

Abstract
Visuospatial processing is a cognitive function that is critical to navigating one’s surroundings and begins to develop during infancy. Extensive research has examined visuospatial processing in adults, but far less work has investigated how visuospatial processing and the underlying neurophysiology changes from childhood to early adolescence, which is a critical period of human development that is marked by the onset of puberty. In the current study, we examined behavioral performance and the oscillatory dynamics serving visuospatial processing using magnetoencephalography (MEG) in a cohort of 70 children and young adolescents aged 8–15 years. All participants performed a visuospatial processing task during MEG, and the resulting oscillatory responses were imaged using a beamformer and probed for developmental and sex-related differences. Our findings indicated that reaction time on the task was negatively correlated with age, and that the amplitude of theta oscillations in the medial occipital cortices increased with age. Significant sex-by-age interactions were also detected, with female participants exhibiting increased theta oscillatory activity in the right prefrontal cortex with increasing age, while male participants exhibited theta increases in the left parietal lobe/left precuneus and left supplementary motor area with increasing age. These data indicate that different nodes of the visuospatial processing network develop earlier in males compared to females (and vice versa) in this age range, which may have major implications for the developmental trajectory of behavioral performance and executive function more generally during the transition through puberty.
Keywords: Puberty, MEG, Magnetoencephalography, Attention, Brain, Vision, Alpha
1. Introduction
One of the most fundamental ways that humans engage their surroundings is by orienting to and discriminating between stimuli in visual space, often by swiftly shifting attention to relevant stimuli to execute goal-directed actions (Kolb and Whishaw, 2009). Attentional modulation of visual processing involves shifting, engaging and then disengaging from objects at specific locations, and this ability arises during the first few months of life and continuously evolves through childhood (Smith and Chatterjee, 2008). In fact, during the first six months of life there is a progressive increase in smooth pursuit, and during the first two to four months attentional disengagement, spatial orienting and object attention significantly improve as well (Colombo, 2001). This is essential, particularly since as children develop from infancy, visuospatial processing and attention allows for proper engagement within a dynamic visual environment that in turn serves as a conduit to facilitate interpersonal connections and the acquisition of emotional regulation (Bryson, 2010). Further, visuospatial processing ability is crucial to a wealth of other cognitive metrics, including visual working memory, mental rotation, and executive function. Importantly, deviations in visuospatial processing ability throughout development have been shown in children with cerebral palsy (Critten et al., 2018), attention-deficit hyperactivity disorder (Fan et al., 2018; Gau and Huang, 2014), and psychosis (Mollon et al., 2018). Nonetheless, our understanding of the neural correlates of healthy visuospatial processing throughout development is limited.
With regards to the underlying neural activity, functional MRI (fMRI) studies probing visuospatial processing in healthy adults have found increased activation in frontoparietal areas, extrastriate cortices, and the anterior cingulate (Pessoa et al., 2003; Thiel et al., 2004). The oscillatory dynamics serving visuospatial processing have also been investigated, and these studies have shown increased theta (4–8 Hz) and gamma band (> 30 Hz) activity in superior parietal and primary visual areas (Proskovec et al., 2018; Wiesman et al., 2017b). Functionally, such gamma synchronization has been associated with the fine scale encoding of local visual stimulus features using electroencephalography (EEG; Busch et al., 2004; Doesburg et al., 2008), magnetoencephalography (MEG; Hoogenboom et al., 2006; Wilson et al., 2018) and EEG/MEG simultaneously (Muthukumaraswamy and Singh, 2013). Additionally, beta (18–24 Hz) and theta frequency activity have been repeatedly linked to visuospatial processing in MEG studies, with spectrally-specific beta activity in somato-motor areas and theta in both prefrontal and occipital cortices (Proskovec et al., 2018; Wiesman et al., 2017b; Wiesman and Wilson, 2019). Such beta oscillations have been broadly associated with motor function across a large number of MEG studies (Heinrichs-Graham et al., 2016, 2017, 2018; Heinrichs-Graham and Wilson, 2016), while theta oscillations have been more frequently implicated in early visual recognition within occipital cortices (Lew et al., 2020; McDermott et al., 2017; Wiesman et al., 2017b, 2018; Wiesman and Wilson, 2019). Theta is also known to play a critical role in sustained attention and has been reported in medial prefrontal cortices, an area suggested to support cognitive monitoring and control processes in studies using both MEG and EEG (Clayton et al., 2015), as well as other regions linked to cognitive control (McDermott et al., 2017). Of note, these fMRI, EEG, and MEG studies of visuospatial processing have focused overwhelmingly on adults, with only a few neuroimaging and neurophysiological studies investigating how visuospatial processing develops from childhood to early adolescence.
The limited developmental research on visuospatial processing has reported patterns of activation similar to adults, with increasing age being associated with progressively increased activation in temporo-parietal brain regions and lateral fronto-striatal cortices (Rubia et al., 2010). Interestingly, some fMRI studies have reported developmental sex differences, including increased activation in the left temporal and parietal areas in males, and right inferior fronto-striato-temporal areas in females (Rubia et al., 2010). These same structures have been highlighted for sex differences in cortical thickness studies, although differences in cortical thickness did not interact with age, at least across the full lifespan (i.e., 7–87 years-old; (Sowell et al., 2007). In sum, a limited amount of fMRI research has suggested developmental sex differences in networks serving visuospatial processing and attention, but the inherent neural dynamics have not been widely examined and remain poorly understood. Additionally, the sex-invariant development effects are also relatively unknown in the context of oscillatory dynamics.
In the current study, we examined the developmental neurophysiology of visuospatial processing using MEG in a cohort of 70 children and young adolescents aged 8–15 years. We chose MEG to address our hypotheses due to its combined excellent temporal resolution and high spatial precision, which differentiates it from fMRI and EEG measures. All participants performed an established visuospatial processing task during MEG, and the resulting MEG oscillatory responses were imaged using a beamforming approach and probed for developmental and sex-related differences. Based on previous research investigating alpha, theta and gamma oscillatory dynamics in adults, we hypothesized that frequency-specific neural activity would differentially covary with chronological age. Moreover, we expected robust sex differences in the oscillatory dynamics serving visuo-spatial processing, as the age range of our participants was centered on the transition through puberty, which is widely known to be a critical period for the emergence of behavioral and emotional sex differences.
2. Materials and methods
2.1. Participants
Seventy children and adolescents aged 8 to 15 years (mean = 11.69, SD = 1.58, 33 males) participated in this study. All participants were typically developing, without attention-deficit/hyperactivity disorder (ADHD) or other disorders affecting brain function, mental illness or previous head trauma, had an IQ above 85, and identified English as their primary language. Participants were excluded according to general MEG/MRI exclusionary criteria such as the presence of metal implants, dental braces or permanent retainers, or other metallic or otherwise magnetic non-removable devices. Other exclusionary criteria included major medical conditions such as cancer, history or diagnosis of alcohol or substance use disorder, or pregnancy. Inclusion/exclusion were confirmed through participant interviews involving the child and parent. All procedures were approved by the Institutional Review Board at the University of Nebraska Medical Center. Written informed consent was obtained from the legally-authorized representative of each participant following detailed description of the study, and participants over 11 years-old provided assent.
2.2. Experimental paradigm
We used an established visuospatial discrimination task to engage visual attention circuitry (Fig. 1; Wiesman et al., 2017b, 2018; Wiesman and Wilson, 2019). During this task, participants were seated in a magnetically shielded room and told to fixate on a crosshair presented centrally. After a variable interstimulus interval (range: 1900–2100 ms), an 8 × 8 grid was presented for 800 ms at one of the four positions relative to the fixation: above right, below right, above left, or below left. The left/right orientations were defined as a lateral offset of 75% of the grid from the center of fixation, and presentation location was pseudo-randomized. Participants were instructed to respond via button press with their right hand whether the grid was positioned to the left (index finger) or right (middle finger) of the fixation point upon presentation of the grid. Each participant performed 240 repetitions of the task (i.e., 240 trials) concurrent with MEG recording.
Fig. 1.
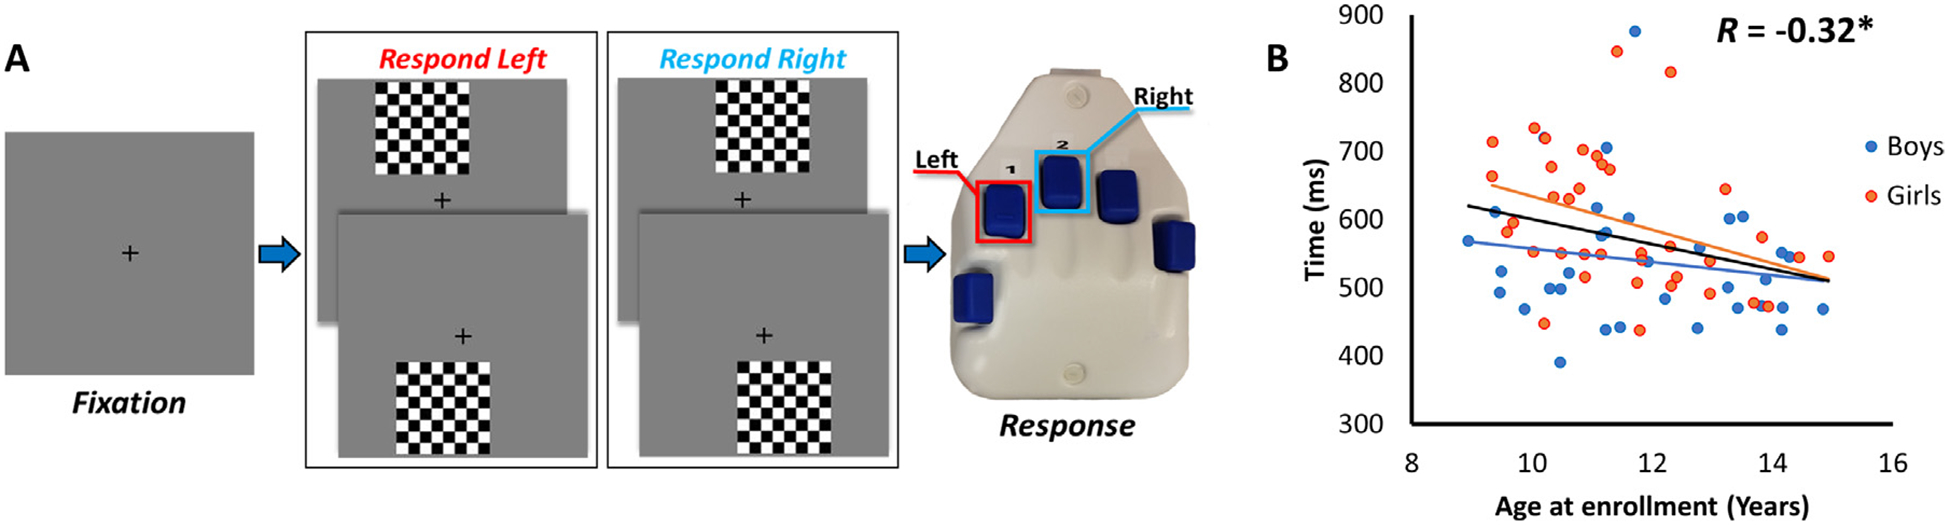
Experimental paradigm and behavioral correlation results. (A) An illustration of the visuospatial task paradigm (Wiesman et al., 2017b). (B) Correlation between age (in years) displayed on the x-axis, and reaction time (in ms) displayed on the y-axis. Age was significantly correlated with reaction time (black line), such that as age increased, reaction time decreased.
2.3. MEG data acquisition
All recordings were conducted in a one-layer magnetically shielded room with active shielding engaged for environmental noise compensation. With an acquisition bandwidth of 0.1–330 Hz, neuromagnetic responses were sampled continuously at 1 kHz using an Elekta/MEGIN MEG system (Helsinki, Finland) with 306 sensors, including 204 planar gradiometers and 102 magnetometers. During data acquisition, participants were monitored via real-time audio-video feeds. MEG data were individually corrected for head motion and subjected to noise reduction using the signal space separation method with a temporal extension (Taulu and Simola, 2006).
2.4. Structural MRI processing and meg coregistration
Prior to MEG measurement, four coils were attached to the subject’s head and localized, together with the three fiducial points and scalp surface, with a 3-D digitizer (Fastrak 3SF002, Polhemus Navigator Sciences, Colchester VT, USA). Once the subject was positioned for MEG recording, an electric current with a unique frequency label (e.g., 322 Hz) was fed to each of the coils. This induced a measurable magnetic field and allowed each coil to be localized in reference to the sensors throughout the recording session. As coil locations were also known in head coordinates, all MEG measurements could be transformed into a common coordinate system. Using this coordinate system, each participant’s MEG data were coregistered with structural T1-weighted MRI data prior to source space analyses using BESA MRI (Version 2.0). Structural MRI data were aligned parallel to the anterior and posterior commissures and transformed into standardized space. Following source analysis (i.e. beamforming), each subject’s 4.0 × 4.0 × 4.0 mm functional images were also transformed into standardized space using the transform that was previously applied to the structural MRI volume and spatially resampled.
2.5. MEG preprocessing, time-frequency transformation, and sensor-level statistics
Cardiac and blink artifacts were removed from the data using signal-space projection (SSP), which was accounted for during source reconstruction (Uusitalo and Ilmoniemi, 1997). The continuous magnetic time series was divided into epochs of 2700 ms duration, with the baseline being defined as −400 to 0 ms before initial stimulus onset. Epochs containing artifacts were rejected based on a fixed threshold method, supplemented with visual inspection. An average of 194.27 (SD = 20.78) trials per participant were used for further analysis. Artifact free epochs were transformed into the time-frequency domain using complex demodulation (Bingham et al., 1967; Hoechstetter et al., 2004; Papp and Ktonas, 1977). By decomposing the sensor-level recordings in this way, it is possible to examine the multi-spectral neural responses underlying performance of a task, which have been suggested to code distinct components of cognition in the human brain (Hari et al., 1997; Jensen et al., 2014; Roux and Uhlhaas, 2014). The resulting spectral power estimations per sensor were averaged over trials to generate time-frequency plots of mean spectral density. These sensor-level data were normalized by dividing the power value of each time-frequency bin by the respective bin’s baseline power, which was calculated as the mean power during the −400 to 0 ms time period. The specific time frequency windows used for imaging were determined by statistical analysis of the sensor level spectrograms across the entire array of gradiometers. Each data point in the spectrogram was evaluated using a mass univariate approach based on the general linear model. To reduce the risk of false positive results while maintaining reasonable sensitivity, a two-stage procedure was followed to control for Type 1 error. In the first stage, paired-sample t tests were conducted on each data point and the output spectrogram of t values was thresholded at p < 0.05 to define time frequency bins containing potentially significant oscillatory deviations across all participants. In stage two, time-frequency bins that survived the threshold were clustered with temporally and/or spectrally neighboring bins that were also above the threshold (p < 0.05), and a cluster value was derived by summing all t values of all data points in the cluster. Nonparametric permutation testing was then used to derive a distribution of cluster values and the significance levels of the observed clusters (from stage one) were tested directly using this distribution (Ernst, 2004; Maris and Oostenveld, 2007). For each comparison, 10,000 permutations were computed to build a distribution of cluster values. Based on these analyses, the time-frequency windows that contained significant oscillatory events across all participants were subjected to a beamforming analysis. We focused our analysis only on those significant events that fell within the time window between the onset of the visual stimulus and the mean RT across all participants, so as to quantify neural responses underlying visuospatial attention and discrimination, rather than other responses inherent to the later portions of the task (i.e., motor termination, response/error-checking).
2.6. MEG source imaging and statistics
MEG preprocessing and imaging used the Brain Electrical Source Analysis (BESA version 6.0) software. Cortical networks were imaged through an extension of the linearly constrained minimum variance vector beamformer, termed Dynamic Imaging of Coherent Sources (Gross et al., 2001), which employs spatial filters in the time-frequency domain to calculate source power for the entire brain volume. The single images are derived from the cross-spectral densities of all combinations of MEG gradiometers averaged over the time-frequency range of interest. In principle, the beamformer operator generates a spatial filter that passes signals without attenuation from a region of interest, while suppressing activity in all other brain areas. The filter properties arise from the forward solution (lead field) for each location on a volumetric grid specified by input voxel space, and from the MEG covariance matrix. Following convention, we computed noise-normalized source power per voxel in each participant using active (i.e., task) and passive (i.e., baseline) periods of equal duration and bandwidth. Such images are typically referred to as pseudo-t maps, with units (pseudo-t) that reflect noise-normalized power differences (i.e., active vs passive) per voxel.
The beamformer images corresponding to each oscillatory response were first grand-averaged to identify their anatomical origin. To evaluate developmental effects, whole brain correlations were computed using the participant’s chronological age in fraction of years and the functional brain maps (in pseudo-t units) of each oscillatory response. Next, two-sample t-tests probing sex differences were conducted on each oscillatory response. To identify age-by-sex interaction effects, whole brain correlation maps were computed separately for males and females as described above. Using these maps, whole brain bivariate correlation coefficient comparisons were computed through Fisher’s Z-transformation, which provided voxel-wise maps of z-scores reflecting the normalized difference between males and females in the development-by-oscillatory power (pseudo-t units) relationship. To account for multiple comparisons, a significance threshold of p < 0.005 was used for the identification of significant clusters in all whole brain statistical maps, accompanied by a cluster threshold of 200 contiguous voxels (Worsley et al., 1996).
To examine the potential contribution of phase-locked time-domain and oscillatory neural responses to our results, we also extracted virtual sensor data from the peak voxel of each of the regions that exhibited a robust effect of age or interaction between age and sex (see below; i.e., age in the calcarine fissure and age-by-sex in the right prefrontal, left supplementary motor, and parietal cortices). Using these virtual sensor data, we computed the time-domain average and inter-trial phase coherence (ITPC) to examine possible relationships between evoked time-domain and oscillatory neural activity, respectively, in these cortical regions and our factors of interest (i.e., age and sex). These data were then averaged over the time (and in the case of the ITPC, frequency) windows from our spectral analyses, and tested for effects of age or interactions between age and sex, using statistical models comparable to those employed for the whole-brain statistics.
3. Results
3.1. Behavioral data
Two participants were excluded due to poor accuracy on the task (3 + SD below the mean), one participant for slow reaction times (3 + SD above the mean), and three participants were excluded due to noisy MEG data. The remaining 64 participants (see Table 1) performed well on the task, with an average accuracy of 95.11% (range = 79.17% to 99.58%; SD = 4.21%). Reaction time (RT; mean = 564.99 ms; SD = 97.05 ms) was significantly correlated with age (r = −0.3217; p = 0.0095) such that participants responded more quickly with increasing age. Of note, this correlation was significant in females (r = −0.34; p = 0.048), but not males (r = −0.24; p = 0.208); however, the difference in the age-related changes between sexes was not significant.
Table 1.
Final Sample Characteristics.
| Sex | N | Age | IQ |
|---|---|---|---|
| Males | 30 | 11.88 | 114 |
| Females | 34 | 11.47 | 112 |
3.2. Sensor-Level data
To identify the time-frequency windows containing significant oscillatory responses across all participants, the sensor-level spectrograms of all gradiometers were examined using paired-samples t-tests (active versus baseline) followed by permutation testing to control for Type 1 error. This analysis showed an initial increase in activity in the 4–8 Hz theta range from 0 to 250 ms (0 ms = stimulus onset) in a cluster of occipital sensors. Following this response, there was a decrease in activity (i.e., a desynchronization) in the alpha range (8–14 Hz) and beta (16–22 Hz) ranges that lasted from 325 to 725 ms and 400–700 ms, respectively. Finally, there was an increase in gamma (64–80 Hz) that extended from 350 to 550 ms (Fig. 2).
Fig. 2.
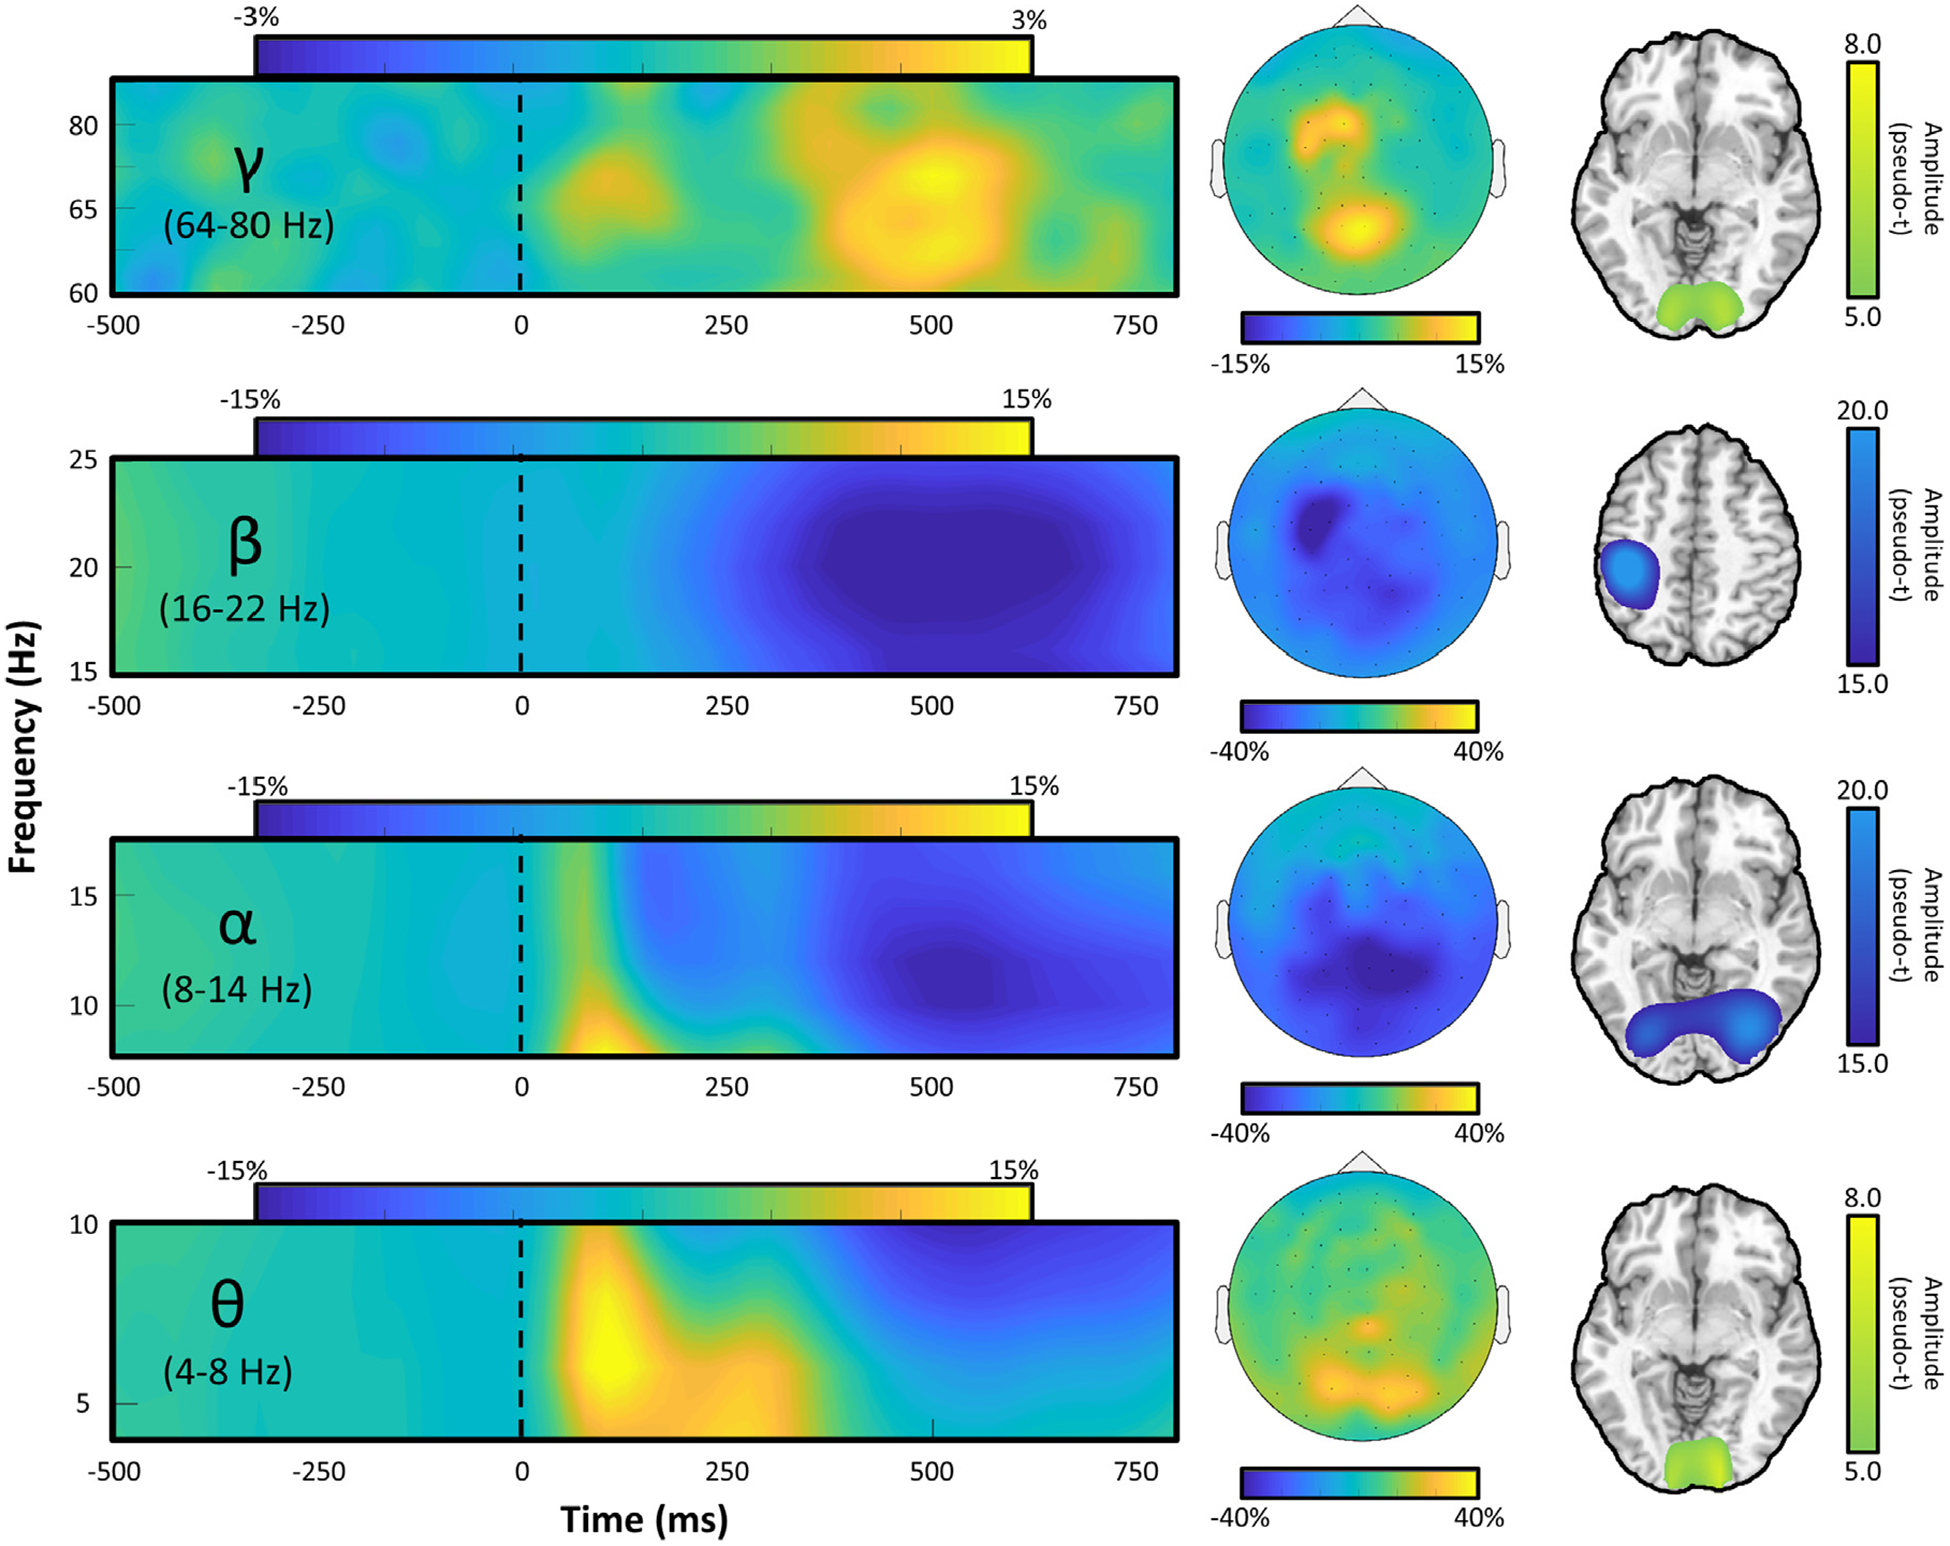
Left: Spectral time course of neural responses in the MEG sensor array. Time (in ms) is denoted on the x-axis, with 0 ms defined as the onset of the visual stimulus, and frequency (in Hz) is shown on the y-axis. All spectrograms represent group-averaged data from gradiometer sensors that were representative of the neural response in each region. Middle: Topographic visualizations of each time-frequency cluster defined in the sensor-level statistical analysis, with percent change from baseline indicated on the color bar below each map. Note that both motor and visual gamma responses can be discerned. Right: Whole brain visualizations of the origin of oscillatory responses within each frequency band, including theta, alpha, and gamma responses in bilateral visual cortices and beta responses in the left motor cortex. Each map is a grand average across all participants. The respective color legend for each image is displayed to the right of each brain visualization.
3.3. Source reconstruction and functional maps
3.3.1. Neural origin of oscillatory responses during task performance
To determine the anatomical origin of the four oscillatory responses observed at the sensor-level, a beamformer source imaging approach was applied to the data of each participant (per time-frequency window). The output images were then averaged across participants per time-frequency window (Fig. 2). These data indicated that the theta, alpha, and gamma responses primarily originated in bilateral occipital cortices, whereas the beta activity was primarily of motor origin. Since the current study was focused on visuo-spatial processing and attention, and prior studies in this age group have investigated developmental beta (and gamma) motor function (Trevarrow et al., 2019), we did not further examine the beta response.
3.3.2. Oscillatory responses are altered with development
Whole brain correlation analysis between chronological age and theta oscillatory power revealed significant positive correlations in the occipital cortices, roughly centered on the calcarine fissure (p < 0.005, corrected; Fig. 3), indicating that theta responses became stronger with increasing age. There was also a marginally significant correlation between reaction time and occipital theta oscillatory activity (p = 0.059, r = −0.252; two-tailed). Interestingly, although time-domain evoked activity in this region did not correlate significantly with age, calcarine inter-trial phase coherence (i.e., a measure of oscillatory phase consistency across trials) exhibited a significant increase with age (p = 0.030, r = 0.260). Increasing theta activity with age was also detected in the left cerebellar cortices and left superior temporal gyrus (p < 0.005, corrected). Surprisingly, no significant correlations between age and alpha or gamma activity were observed.
Fig. 3. –
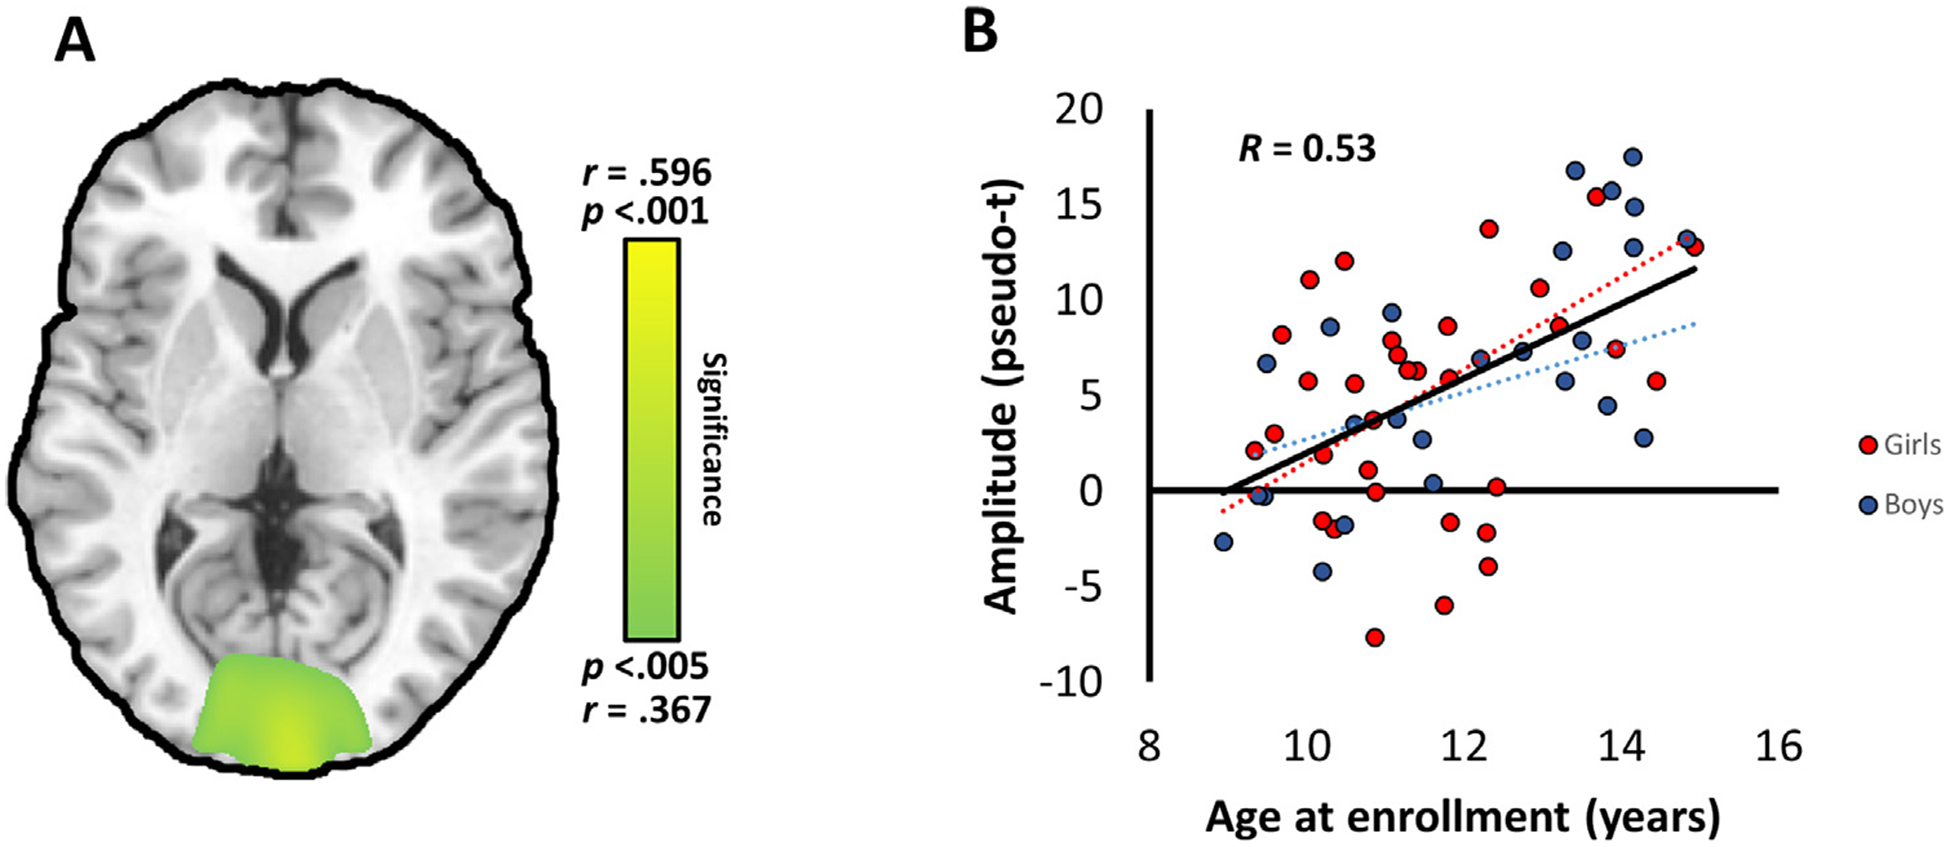
(A) Whole brain correlation map showing the significant relationship between age and theta oscillatory activity. The map has been thresholded at p < 0.005, corrected. (B) Theta oscillatory amplitude at the peak voxel was significantly positively correlated with chronological age in the occipital cortex.
3.3.3. Oscillatory responses vary by sex
To identify sex differences, whole-brain maps for each oscillatory response were compared using independent samples t-tests. These indicated that there were no significant sex differences in the theta or alpha ranges, but that gamma activity in the right middle temporal gyrus was stronger in males relative to females (p < 0.005, corrected).
3.3.4. Age by sex interactions in the strength of oscillatory responses
For these analyses, we divided the group by sex and performed whole brain correlations in each group separately for each peak oscillatory response. We then compared the correlation coefficients between groups using Fisher’s Z transformations. For theta oscillatory activity, these analyses indicated a significant sex-by-age interaction in the right prefrontal cortices (p < 0.005, corrected), with females showing stronger activity as a function of age and males showing a non-significant theta decrease with age (Fig. 4). Interestingly, the opposite pattern was observed for theta activity in left supplementary motor area (SMA) and the left parietal lobe/precuneus (p < 0.005, corrected; Fig. 4). Neither time-domain nor ITPC responses exhibited a significant interaction between age and sex in any of these regions (all p ‘s > 0.10). Additionally, no brain regions exhibited significant sex-by-age interactions in the alpha or gamma range.
Fig. 4. –

(Left) Graphs showing correlations between theta peak voxels (pseudo-t) and age for both males and females. (Right) The corresponding cluster where the interaction was significant. (A) Theta activity in the right prefrontal cortex was significantly stronger as a function of age in females relative to males (p < 0.005, corrected). Conversely, theta activity in the (B) left parietal lobe/precuneus and (C) left supplementary motor area was significantly stronger as a function of age in males compared to females (both p < 0.005, corrected).
4. Discussion
In this study, we examined the impact of sex and development on the neural oscillations underlying visuospatial processing. We found that as age increased, reaction time on the task significantly decreased, reflecting developmental improvement across this age range. In regard to the neurophysiological data, our results showed strong theta, alpha, and gamma oscillations in the occipital cortices, which is in close agreement with normative studies in adults that have used the same task (Wiesman et al., 2017b; Wiesman and Wilson, 2019). Interestingly, we also found robust developmental effects only in the theta range (not alpha or gamma), and some of these interacted with sex. We also found age-invariant sex differences, but these were restricted to the gamma band. Below, we discuss the implications of these findings for understanding the development of visuo-spatial processing in the brain during the transition from childhood to early adolescence.
One of our more interesting findings was an age-related increase in occipital theta activity. The area of significant correlation was centered on, and extended throughout, the calcarine fissure and the curve of change was very similar in boys and girls. Such occipital theta activity has previously been shown to be involved in attentional exploration (Dugue and VanRullen, 2017), and is known to be a key component of early visual processing in adults (Muthukumaraswamy et al., 2010; Wiesman et al., 2017b, 2018; Wiesman and Wilson, 2019). Of note, we observed a marginally significant correlation between the amplitude of occipital theta oscillations and reaction time, and thus the age-related improvement in response speed that we observed may be directly related to this theta response. However, further research is required to elucidate the role that these visual theta responses have in driving the behavioral changes that occur with development. We also observed that oscillatory phase consistency, but not time-domain evoked responses, at this same peak exhibited a similar relationship with age. This implies that the theta oscillations in the calcarine that are increasing as a function of development also have a more consistent phase from trial to trial, and future studies should target this possibility more directly. Such evoked oscillatory responses are not uncommon (Muthukumaraswamy et al., 2010; Spencer et al., 2008; Spooner et al., 2019; Swettenham et al., 2009; Wiesman et al., 2017a), and are thought to represent a functionally distinct mechanism from the induced modulation of ongoing rhythmic activity.
In addition to age-related increases in occipital theta activity, we also found sex differences in visuospatial processing that were restricted to the gamma band, such that males had significantly stronger gamma responses in the right middle temporal gyrus than females. Previous research has demonstrated that the right temporal cortex may be involved in redirecting attention to new, behaviorally relevant objects. This reflects a process whereby irrelevant input is filtered to prevent attending to unimportant objects (Shulman et al., 2007). Since gamma oscillations are implicated in stimulus feature coding, our findings may suggest that during visuospatial processing young males are more efficient at filtering unimportant features in their visual fields than females, which would be qualitatively consistent with our behavioral data. Nonetheless, this hypothesis is preliminary, as the paradigm used here was relatively simple and did not include non-salient stimulus features as a contrast. Future studies should clarify the role of temporal gamma oscillations in the context of development and sex, especially given the data linking aberrant gamma oscillations and developmental disorders (Wilson et al., 2007, 2008, 2009, 2011, 2013).
Finally, we also observed sex-by-age interactions in the amplitude of theta oscillations across multiple brain regions during visuospatial processing. Briefly, we found that females exhibited an increase in theta oscillatory activity with age in the prefrontal cortex, while males showed a mild qualitative decline in theta activity. In contrast, males displayed an increase in theta activity with age in the parietal lobe/precuneus region and the supplementary motor area, while females tended to show theta decreases with age in these cortices. Interestingly, previous research has demonstrated that frontal and parietal regions are involved in goal-directed attention (Corbetta, 1998; Dodds et al., 2011; Ptak, 2012). Coupled with our findings, we suggest this fronto-parietal attention network is improving with age, but that there are important sex-related differences in which nodes of that network develop at specific developmental stages. Females in our study showed significant increases in frontal theta activity with age, while males showed a slight decline, suggesting that the increased theta activity in females may drive an earlier improvement in the frontal node of the alerting network. Conversely, the increased theta activity in the parietal lobes of males with age may suggest that theta activity in this region drives earlier maturation of saliency mapping and attentional orienting in males compared to females. These improvements in the fronto-parietal network may be critical in the commonly-observed changes in visuospatial processing across development.
Lastly, before closing it is important to note the limitations of this study. First, our sample consisted of healthy children from eight to fifteen years of age. In this peri-pubertal population, there is substantial variability in physical and emotional development, which of course likely affects the variability seen in our primary behavioral and neural metrics and complicates interpretations to a moderate degree. Future studies should augment chronological age measures by investigating DNA-methylation measures of biological age, hormone levels (e.g., testosterone, estradiol), and/or pubertal status to derive a more precise measure of developmental stage, and then relate this to neural and behavioral measures across this age range. Future studies should also extend these findings across a broader developmental age range (i.e., younger than eight and older than fifteen) and use a longitudinal design to more fully characterize the overall developmental trajectory. Additionally, because our sample consisted of healthy children, how the developmental trajectories of visuospatial processing may be altered in the context of neurodevelopmental disorders remains to be investigated and this should be a focus of future research. It should also be noted that the spatial resolution of MEG can be relatively coarse, especially in developmental populations where the signal-to-noise ratio is often lower. Thus, we interpret the seemingly focal nature of our significant age and age-by-sex effects cautiously, and suggest that readers do the same. In future analyses, the use of less conservative approaches to multiple comparisons correction, such as threshold-free cluster enhancement (Smith and Nichols, 2009), might provide a more balanced approach to this problem. Finally, it is important to discuss the potential for confounding variables, such as head and brain size changes, which might impact our results. While developmental changes in head size are well-documented in this age range, and might be a concern for similar studies conducted at the sensor-level, we mitigated this concern by computing all of our relevant statistical contrasts at the source-level. In contrast, there is extensive literature showing that brain size reaches maturity well before the ages included in the present study (Caviness Jr et al., 1996; Dekaban and Sadowsky, 1978; Giedd et al., 1996, 1999; Lenroot and Giedd, 2006; Reiss et al., 1996), and a previous analysis of leadfield sensitivity encompassing a much wider age range showed no significant developmental effect in the regions we report herein (Khan et al., 2018). Thus, it seems highly unlikely that either head or brain size would systematically bias our results. Despite these considerations, this study is the first to identify the role of age and sex on the development of neural oscillatory dynamics serving visuo-spatial processing, and as such provides crucial new data on how visual perception and attention normally change during a critical period of human development.
Supplementary Material
Acknowledgments
This research was supported by grants R01-MH121101 (TWW), R01-MH116782 (TWW), R01-MH118013 (TWW), P20-GM130447 (TWW), and F31-AG055332 (AIW) from the National Institutes of Health, and grant #1539067 from the National Science Foundation (VDC). The funders had no role in study design, data collection and analysis, decision to publish, or preparation of the manuscript.
Footnotes
Supplementary materials
Supplementary material associated with this article can be found, in the online version, at doi:10.1016/j.neuroimage.2020.117192.
References
- Bingham C, Godfrey M, Tukey J, 1967. Modern techniques of power spectrum estimation In: Godfrey M (Ed.), IEEE Transactions on Audio and Electroacoustics 56–56. [Google Scholar]
- Bryson SE, 2010. The Early Development of Visual-Spatial Attention In: Tremblay R, Boivin M, Peters R, Paus T (Eds.), Brain Maturation. Encyclopedia on Early Childhood Development online. [Google Scholar]
- Busch NA, Debener S, Kranczioch C, Engel AK, Herrmann CS, 2004. Size matters: effects of stimulus size, duration and eccentricity on the visual gamma-band response. Clin. Neurophysiol 115, 1810–1820. [DOI] [PubMed] [Google Scholar]
- Caviness V Jr, Kennedy D, Richelme C, Rademacher J, Filipek, 1996. The human brain age 7–11 years: a volumetric analysis based on magnetic resonance images. Cerebral Cortex 6, 726–736. [DOI] [PubMed] [Google Scholar]
- Clayton MS, Yeung N, Cohen Kadosh R, 2015. The roles of cortical oscillations in sustained attention. Trends Cogn. Sci 19, 188–195. [DOI] [PubMed] [Google Scholar]
- Colombo J, 2001. The development of visual attention in infancy. Annu. Rev. Psychol 52, 337–367. [DOI] [PubMed] [Google Scholar]
- Corbetta M, 1998. Frontoparietal cortical networks for directing attention and the eye to visual locations: identical, independent, or overlapping neural systems? Proc. Natl. Acad. Sci. U.S.A 95, 831–838. [DOI] [PMC free article] [PubMed] [Google Scholar]
- Critten V, Campbell E, Farran E, Messer D, 2018. Visual perception, visual-spatial cognition and mathematics: associations and predictions in children with cerebral palsy. Res. Dev. Disabil 80, 180–191. [DOI] [PubMed] [Google Scholar]
- Dekaban AS, Sadowsky D, 1978. Changes in brain weights during the span of human life: relation of brain weights to body heights and body weights. Ann. Neurol 4, 345–356. [DOI] [PubMed] [Google Scholar]
- Dodds CM, Morein-Zamir S, Robbins TW, 2011. Dissociating inhibition, attention, and response control in the frontoparietal network using functional magnetic resonance imaging. Cereb. Cortex 21, 1155–1165. [DOI] [PMC free article] [PubMed] [Google Scholar]
- Doesburg SM, Roggeveen AB, Kitajo K, Ward LM, 2008. Large-scale gamma-band phase synchronization and selective attention. Cereb. Cortex 18, 386–396. [DOI] [PubMed] [Google Scholar]
- Dugue L, VanRullen R, 2017. Transcranial magnetic stimulation reveals intrinsic perceptual and attentional rhythms. Front. Neurosci 11, 154. [DOI] [PMC free article] [PubMed] [Google Scholar]
- Ernst MD, 2004. Permutation methods: a basis for exact inference. Statistic. Sci 676–685. [Google Scholar]
- Fan LY, Shang CY, Tseng WI, Gau SS, Chou TL, 2018. Visual processing as a potential endophenotype in youths with attention-deficit/hyperactivity disorder: a sibling study design using the counting Stroop functional MRI. Hum. Brain Mapp 39, 3827–3835. [DOI] [PMC free article] [PubMed] [Google Scholar]
- Gau SS, Huang WL, 2014. Rapid visual information processing as a cognitive endophenotype of attention deficit hyperactivity disorder. Psychol. Med 44, 435–446. [DOI] [PubMed] [Google Scholar]
- Giedd JN, Blumenthal J, Jeffries NO, Castellanos FX, Liu H, Zijdenbos A, Paus T, Evans AC, Rapoport JL, 1999. Brain development during childhood and adolescence: a longitudinal MRI study. Nat. Neurosci 2, 861–863. [DOI] [PubMed] [Google Scholar]
- Giedd JN, Snell JW, Lange N, Rajapakse JC, Casey B, Kozuch PL, Vaituzis AC, Vauss YC, Hamburger SD, Kaysen D, 1996. Quantitative magnetic resonance imaging of human brain development: ages 4–18. Cerebral Cortex 6, 551–559. [DOI] [PubMed] [Google Scholar]
- Gross J, Kujala J, Hamalainen M, Timmermann L, Schnitzler A, Salmelin R, 2001. Dynamic imaging of coherent sources: studying neural interactions in the human brain. Proc. Natl. Acad. Sci. U.S.A 98, 694–699. [DOI] [PMC free article] [PubMed] [Google Scholar]
- Hari R, Salmelin R, Makela JP, Salenius S, Helle M, 1997. Magnetoencephalographic cortical rhythms. Int. J. Psychophysiol 26, 51–62. [DOI] [PubMed] [Google Scholar]
- Heinrichs-Graham E, Arpin DJ, Wilson TW, 2016. Cue-related Temporal Factors Modulate Movement-related Beta Oscillatory Activity in the Human Motor Circuit. J. Cogn. Neurosci 28, 1039–1051. [DOI] [PMC free article] [PubMed] [Google Scholar]
- Heinrichs-Graham E, Kurz MJ, Gehringer JE, Wilson TW, 2017. The functional role of post-movement beta oscillations in motor termination. Brain Struct. Funct 222, 3075–3086. [DOI] [PMC free article] [PubMed] [Google Scholar]
- Heinrichs-Graham E, McDermott TJ, Mills MS, Wiesman AI, Wang YP, Stephen JM, Calhoun VD, Wilson TW, 2018. The lifespan trajectory of neural oscillatory activity in the motor system. Dev Cogn. Neurosci 30, 159–168. [DOI] [PMC free article] [PubMed] [Google Scholar]
- Heinrichs-Graham E, Wilson TW, 2016. Is an absolute level of cortical beta suppression required for proper movement? Magnetoencephalographic evidence from healthy aging. Neuroimage 134, 514–521. [DOI] [PMC free article] [PubMed] [Google Scholar]
- Hoechstetter K, Bornfleth H, Weckesser D, Ille N, Berg P, Scherg M, 2004. BESA source coherence: a new method to study cortical oscillatory coupling. Brain Topogr. 16, 233–238. [DOI] [PubMed] [Google Scholar]
- Hoogenboom N, Schoffelen JM, Oostenveld R, Parkes LM, Fries P, 2006. Localizing human visual gamma-band activity in frequency, time and space. Neuroimage 29, 764–773. [DOI] [PubMed] [Google Scholar]
- Jensen O, Gips B, Bergmann TO, Bonnefond M, 2014. Temporal coding organized by coupled alpha and gamma oscillations prioritize visual processing. Trends Neurosci. 37, 357–369. [DOI] [PubMed] [Google Scholar]
- Khan S, Hashmi JA, Mamashli F, Michmizos K, Kitzbichler MG, Bharadwaj H, Bekhti Y, Ganesan S, Garel K-LA, Whitfield-Gabrieli S, 2018. Maturation trajectories of cortical resting-state networks depend on the mediating frequency band. Neuroimage 174, 57–68. [DOI] [PMC free article] [PubMed] [Google Scholar]
- Kolb B, Whishaw I, 2009. Fundamentals of Human Neuropsychology, 6th ed. Worth Publishers, New York, NY. [Google Scholar]
- Lenroot RK, Giedd JN, 2006. Brain development in children and adolescents: insights from anatomical magnetic resonance imaging. Neurosci. Biobehav. Rev 30, 718–729. [DOI] [PubMed] [Google Scholar]
- Lew BJ, Wiesman AI, Rezich MT, Wilson TW, 2020. Altered neural dynamics in occipital cortices serving visual-spatial processing in heavy alcohol users. J. Psychophar-macol 34, 245–253. [DOI] [PMC free article] [PubMed] [Google Scholar]
- Maris E, Oostenveld R, 2007. Nonparametric statistical testing of EEG- and MEG-data. J. Neurosci. Methods 164, 177–190. [DOI] [PubMed] [Google Scholar]
- McDermott TJ, Wiesman AI, Proskovec AL, Heinrichs-Graham E, Wilson TW, 2017. Spatiotemporal oscillatory dynamics of visual selective attention during a flanker task. Neuroimage 156, 277–285. [DOI] [PMC free article] [PubMed] [Google Scholar]
- Mollon J, David AS, Zammit S, Lewis G, Reichenberg A, 2018. Course of cognitive development from infancy to early adulthood in the psychosis spectrum. JAMA Psychiatry 75, 270–279. [DOI] [PMC free article] [PubMed] [Google Scholar]
- Muthukumaraswamy SD, Singh KD, 2013. Visual gamma oscillations: the effects of stimulus type, visual field coverage and stimulus motion on MEG and EEG recordings. Neuroimage 69, 223–230. [DOI] [PubMed] [Google Scholar]
- Muthukumaraswamy SD, Singh KD, Swettenham JB, Jones DK, 2010. Visual gamma oscillations and evoked responses: variability, repeatability and structural MRI correlates. Neuroimage 49, 3349–3357. [DOI] [PubMed] [Google Scholar]
- Papp N, Ktonas P, 1977. Critical evaluation of complex demodulation techniques for the quantification of bioelectrical activity. Biomed. Sci. Instrum 13, 135–145. [PubMed] [Google Scholar]
- Pessoa L, Kastner S, Ungerleider LG, 2003. Neuroimaging studies of attention: from modulation of sensory processing to top-down control. J. Neurosci 23, 3990–3998. [DOI] [PMC free article] [PubMed] [Google Scholar]
- Proskovec AL, Wiesman AI, Heinrichs-Graham E, Wilson TW, 2018. Beta oscillatory dynamics in the prefrontal and superior temporal cortices predict spatial working memory performance. Sci. Rep 8, 8488. [DOI] [PMC free article] [PubMed] [Google Scholar]
- Ptak R, 2012. The frontoparietal attention network of the human brain: action, saliency, and a priority map of the environment. Neuroscientist 18, 502–515. [DOI] [PubMed] [Google Scholar]
- Reiss AL, Abrams MT, Singer HS, Ross JL, Denckla MB, 1996. Brain development, gender and IQ in children: a volumetric imaging study. Brain 119, 1763–1774. [DOI] [PubMed] [Google Scholar]
- Roux F, Uhlhaas PJ, 2014. Working memory and neural oscillations: alpha-gamma versus theta-gamma codes for distinct WM information? Trends Cogn. Sci 18, 16–25. [DOI] [PubMed] [Google Scholar]
- Rubia K, Hyde Z, Halari R, Giampietro V, Smith A, 2010. Effects of age and sex on developmental neural networks of visual-spatial attention allocation. Neuroima-geNeuroimage 51, 817–827. [DOI] [PubMed] [Google Scholar]
- Shulman GL, Astafiev SV, McAvoy MP, d’Avossa G, Corbetta M, 2007. Right TPJ deactivation during visual search: functional significance and support for a filter hypothesis. Cereb. Cortex 17, 2625–2633. [DOI] [PubMed] [Google Scholar]
- Smith SE, Chatterjee A, 2008. Visuospatial attention in children. Arch. Neurol 65, 1284–1288. [DOI] [PubMed] [Google Scholar]
- Smith SM, Nichols TE, 2009. Threshold-free cluster enhancement: addressing problems of smoothing, threshold dependence and localisation in cluster inference. Neuroimage 44, 83–98. [DOI] [PubMed] [Google Scholar]
- Sowell ER, Peterson BS, Kan E, Woods RP, Yoshii J, Bansal R, Xu D, Zhu H, Thompson PM, Toga AW, 2007. Sex differences in cortical thickness mapped in 176 healthy individuals between 7 and 87 years of age. Cereb. Cortex 17, 1550–1560. [DOI] [PMC free article] [PubMed] [Google Scholar]
- Spencer KM, Niznikiewicz MA, Shenton ME, McCarley RW, 2008. Sensory-evoked gamma oscillations in chronic schizophrenia. Biol. Psychiatry 63, 744–747. [DOI] [PMC free article] [PubMed] [Google Scholar]
- Spooner RK, Wiesman AI, Proskovec AL, Heinrichs-Graham E, Wilson TW, 2019. Rhythmic spontaneous activity mediates the age-related decline in somatosensory function. Cereb. Cortex 29, 680–688. [DOI] [PMC free article] [PubMed] [Google Scholar]
- Swettenham JB, Muthukumaraswamy SD, Singh KD, 2009. Spectral properties of induced and evoked gamma oscillations in human early visual cortex to moving and stationary stimuli. J. Neurophysiol 102, 1241–1253. [DOI] [PubMed] [Google Scholar]
- Taulu S, Simola J, 2006. Spatiotemporal signal space separation method for rejecting nearby interference in MEG measurements. Phys. Med. Biol 51, 1759–1768. [DOI] [PubMed] [Google Scholar]
- Thiel CM, Zilles K, Fink GR, 2004. Cerebral correlates of alerting, orienting and reorienting of visuospatial attention: an event-related fMRI study. Neuroimage 21, 318–328. [DOI] [PubMed] [Google Scholar]
- Trevarrow MP, Kurz MJ, McDermott TJ, Wiesman AI, Mills MS, Wang YP, Calhoun VD, Stephen JM, Wilson TW, 2019. The developmental trajectory of sensorimotor cortical oscillations. Neuroimage 184, 455–461. [DOI] [PMC free article] [PubMed] [Google Scholar]
- Uusitalo MA, Ilmoniemi RJ, 1997. Signal-space projection method for separating MEG or EEG into components. Med. Biol. Eng. Comput 35, 135–140. [DOI] [PubMed] [Google Scholar]
- Wiesman AI, Heinrichs-Graham E, Coolidge NM, Gehringer JE, Kurz MJ, Wilson TW, 2017a. Oscillatory dynamics and functional connectivity during gating of primary somatosensory responses. J. Physiol 595, 1365–1375. [DOI] [PMC free article] [PubMed] [Google Scholar]
- Wiesman AI, Heinrichs-Graham E, Proskovec AL, McDermott TJ, Wilson TW, 2017b. Oscillations during observations: dynamic oscillatory networks serving visuospatial attention. Hum. Brain Mapp 38, 5128–5140. [DOI] [PMC free article] [PubMed] [Google Scholar]
- Wiesman AI, O’Neill J, Mills MS, Robertson KR, Fox HS, Swindells S, Wilson TW, 2018. Aberrant occipital dynamics differentiate HIV-infected patients with and without cognitive impairment. Brain 141, 1678–1690. [DOI] [PMC free article] [PubMed] [Google Scholar]
- Wiesman AI, Wilson TW, 2019. The impact of age and sex on the oscillatory dynamics of visuospatial processing. Neuroimage 185, 513–520. [DOI] [PMC free article] [PubMed] [Google Scholar]
- Wilson TW, Franzen JD, Heinrichs-Graham E, White ML, Knott NL, Wetzel MW, 2013. Broadband neurophysiological abnormalities in the medial prefrontal region of the default-mode network in adults with ADHD. Hum. Brain Mapp 34, 566–574. [DOI] [PMC free article] [PubMed] [Google Scholar]
- Wilson TW, Hernandez OO, Asherin RM, Teale PD, Reite ML, Rojas DC, 2008. Cortical gamma generators suggest abnormal auditory circuitry in early-onset psychosis. Cereb. Cortex 18, 371–378. [DOI] [PMC free article] [PubMed] [Google Scholar]
- Wilson TW, McDermott TJ, Mills MS, Coolidge NM, Heinrichs-Graham E, 2018. tDCS modulates visual gamma oscillations and basal alpha activity in occipital cortices: evidence from MEG. Cereb. Cortex 28, 1597–1609. [DOI] [PMC free article] [PubMed] [Google Scholar]
- Wilson TW, Rojas DC, Reite ML, Teale PD, Rogers SJ, 2007. Children and adolescents with autism exhibit reduced MEG steady-state gamma responses. Biol. Psychiatry 62, 192–197. [DOI] [PMC free article] [PubMed] [Google Scholar]
- Wilson TW, Slason E, Asherin R, Kronberg E, Teale PD, Reite ML, Rojas DC, 2011. Abnormal gamma and beta MEG activity during finger movements in early-on-set psychosis. Dev. Neuropsychol 36, 596–613. [DOI] [PMC free article] [PubMed] [Google Scholar]
- Wilson TW, Slason E, Hernandez OO, Asherin R, Reite ML, Teale PD, Rojas DC, 2009. Aberrant high-frequency desynchronization of cerebellar cortices in early-onset psychosis. Psychiatry Res. 174, 47–56. [DOI] [PMC free article] [PubMed] [Google Scholar]
- Worsley KJ, Marrett S, Neelin P, Vandal AC, Friston KJ, Evans AC, 1996. A unified statistical approach for determining significant signals in images of cerebral activation. Hum. Brain Mapp 4, 58–73. [DOI] [PubMed] [Google Scholar]
Associated Data
This section collects any data citations, data availability statements, or supplementary materials included in this article.