

Abstract
Aims/Introduction
Dyslipidemia plays a critical role in the pathogenesis of metabolic syndrome and diabetes. Evidence has increasingly shown that the ratio of low‐ to high‐density lipoprotein cholesterol (LDL‐C/HDL‐C) is a novel marker for increased risk of insulin resistance and cardiovascular diseases. However, the correlation between the LDL‐C/HDL‐C ratio and diabetes risk is rarely reported. This is the first study to investigate the association between the LDL‐C/HDL‐C ratio and new‐onset diabetes in a large community‐based cohort.
Materials and Methods
In this retrospective cohort study, a total of 116,661 adults without baseline diabetes were enrolled. Participants were stratified into four groups based on LDL‐C/HDL‐C ratio quartiles. The outcome of interest was new‐onset diabetes.
Results
During a median follow‐up period of 2.98 years, 2,681 (2.3%) new diabetes cases were recorded. The total cumulative incidence of diabetes progressively increased alongside LDL‐C/HDL‐C ratio quartiles (0.31, 0.43, 0.68 and 0.88%, respectively, P‐value for trend <0.001). After adjusting for potential confounders, using the lowest quartile of the LDL‐C/HDL‐C ratio as the reference, the risk of diabetes increased with LDL‐C/HDL‐C ratio quartiles (P‐value for trend <0.001); in particular, from the second to fourth quartile, hazard ratios were 1.18 (95% confidence interval 0.87–1.59), 1.42 (95% confidence interval 1.07–1.90) and 1.92 (95% confidence interval 1.43–2.59), respectively. The results were also robust to challenges in multiple sensitivity analyses.
Conclusions
Among the Chinese population, elevated LDL‐C/HDL‐C ratio might be an independent risk factor for new‐onset diabetes.
Keywords: Chinese adults, Incident diabetes, Low‐density lipoprotein cholesterol : high‐density lipoprotein cholesterol ratio
In the present study, we investigated a relationship between the low‐density lipoprotein cholesterol : high‐density lipoprotein cholesterol (LDL‐C/HDL‐C) ratio and the risk of new‐onset diabetes, and found that an elevated LDL‐C/HDL‐C ratio is independently and positively associated with the increased risks of diabetes in the general population. These findings suggested that the ratio of LDL‐C/HDL‐C is not only a surrogate indicator of insulin resistance and cardiovascular disease, but also plays a vital role in the pathogenesis of diabetes.
Introduction
Diabetes mellitus is a global public health challenge for the 21st century, which is illustrated by the high prevalence of associated morbidity and complications 1 . It has been estimated that in 2019, globally, 463 million adults were affected by diabetes, a figure expected to increase to 700 million by 2045, according to the newly released Diabetes Atlas from the International Diabetes Federation 2 . Furthermore, in 2019, approximately 4.2 million deaths worldwide were attributable to diabetes, and 10% of global healthcare expenditure ($US760 billion) was spent on diabetes‐related treatment 2 . As a result, identifying individuals at greater risk by screening with a cost‐effective test, and preventing or delaying the onset of diabetes through risk factor management is a priority in many countries.
Dyslipidemia often occurs long before the onset of biochemical hyperglycemia 3 , 4 . Accumulated evidence has shown that lipid abnormalities and insulin resistance (IR) are the key mechanisms in the pathophysiology of metabolic syndrome, which is likely to progress to diabetes through a bidirectional relationship 3 . In brief, the accumulation of lipid molecules and their metabolites, such as low‐density lipoprotein cholesterol(LDL‐C), triglycerides (TGs) and free fatty acids can impair the function or survival of β‐cells and induce peripheral IR 5 , 6 , 7 . Concurrently, in individuals affected by IR, the plasma insulin levels tend to be increased, which can also contribute to lipid abnormalities, such as low serum high‐density lipoprotein cholesterol (HDL‐C), elevated TG and small dense LDL particles 3 . It is well documented that elevated concentrations of TG and LDL‐C are associated with an increased risk of diabetes 7 , 8 , whereas increased serum HDL‐C levels have been recognized as a protective factor against diabetes 7 , 9 .
Co‐occurrence of multiple lipid abnormalities in individuals is common, whereas associated risks and complications are often the same or coexist 10 . According to a Canadian primary care sentinel surveillance network database 10 , among 134,074 individuals at a mean age of 59.2 years, 35.8, 17.3 and 3.2% had abnormalities in one, two and three dyslipidemia domains, respectively. Furthermore, a report based on French data showed that these figures are higher for patients treated with statins 11 . Thus, clinical markers for mixed dyslipidemia are gradually gaining interest as indicators of disease risk 12 , 13 . Recently, the LDL‐C/HDL‐C ratio, as a simple index that simultaneously evaluates the levels of LDL‐C and HDL‐C, shows superiority to individual lipid levels in terms of predictive value for IR 14 , 15 and atherosclerotic cardiovascular diseases 16 , 17 . However, studies on the LDL‐C/HDL‐C ratio value in predicting new‐onset diabetes are still limited. To date, only a single cross‐sectional study reported a positive association between the LDL‐C/HDL‐C ratio and diabetes risk among patients with hypertension 18 , and whether this positive effect can be extended to apparently healthy individuals is unclear. Therefore, the present longitudinal study aimed to examine the relationship between the LDL‐C/HDL‐C ratio and new‐onset diabetes in Chinese adults.
Methods
Study population
The original clinical data were obtained from a public dataset (https://datadryad.org) offered by Chen et al. 19 , 20 , which conformed to the guidelines of the Declaration of Helsinki and was approved by the Rich Healthcare Group Review Board. According to public policy statements of the dataset, ethics approval was not required for the present study. The data were anonymous, and the requirement for informed consent was therefore waived.
Initially, data from 685,277 adults (aged ≥20 years) who had received health checks at least twice between 2010 and 2016 were extracted from a computerized database established by the Rich Healthcare Group in China by Chen et al. 20 Participants were excluded based on the following criteria: (i) diabetes diagnosis at baseline; (ii) unknown diabetes status during the follow‐up period; (iii) follow‐up intervals <2 years; (iv) incomplete data on sex, body mass index (BMI) and lipid parameters; and (v) extreme BMI values (<15 or >55 kg/m2). Cohort entry was defined as the date of the initial visit, and all patients were followed up until the occurrence of diabetes or the end of the follow‐up period (31 December 2016).
Clinical measurements
As described in the previous research 20 , data on demographic characteristics and results of rigorous physical examination, including age, sex, height, weight, blood pressure and smoking status, were collected using a standardized spreadsheet at the first visit. Bodyweight and height were measured in light indoor clothing with no shoes to the nearest 0.1 kg and 0.1 cm, respectively. Smoking status was classified as non‐smoker, past smoker and current smoker. Blood pressure was measured by using standard mercury sphygmomanometers in a quiet environment. BMI was calculated as weight in kilograms divided by height in meters squared. Trained investigators collected fasting venous blood to measure lipid parameters (AU5800; Beckman Coulter, Brea, CA, USA), plasma glucose (AU5800; Beckman Coulter) and other indexes. LDL‐C/HDL‐C and TG/HDL‐C ratios were calculated as LDL‐C or TG divided by HDL‐C (expressed in mmol/L), respectively.
Endpoint and definitions
The outcome of interest was the occurrence of diabetes. New‐onset diabetes was defined 21 either by fasting plasma glucose (FPG) ≥7.00 mmol/L and/or self‐reported history of diabetes, and/or treatment with insulin or oral hypoglycemic agents during the follow‐up period. Impaired fasting glycaemia (IFG) is defined as a fasting glucose ≥5.6 and <7.0 mmol/L, and normal fasting glucose (NFG) is defined as fasting glucose <5.6 mmol/L.
According to the Chinese criteria 22 for obesity: normal weight is defined as BMI ≥18.5 and <24 kg/m2, and abnormal weight is defined as BMI <18.5 or ≥24 kg/m2.
Statistical analysis
All statistical analyses were carried out using IBM SPSS 21 (version 21.0; Armonk, NY, USA). A two‐tailed P‐value <0.05 was considered statistically significant. Participants were divided into four groups based on LDL‐C/HDL‐C ratio quartiles (Qs): Q1 <1.6358, 1.6358 ≤ Q2 < 1.9836, 1.9836 ≤ Q3 < 2.4453 and Q4 ≥2.4453. Categorical variables were presented as counts (percentages), and comparisons between groups were carried out with χ2‐test. Continuous data were expressed as the mean ± standard deviations, and comparisons between groups were carried out with one‐way anova. The incidence of new‐onset diabetes was reported as cumulative incidence in the present study, and the cumulative incidence was compared by a stratified log–rank test. Kaplan–Meier curves were used to show diabetes‐free survival probability by the baseline LDL‐C/HDL‐C ratio and sex categories. Furthermore, Cox proportional hazards regression analysis was carried out to estimate the relationship between the predictor and outcome, with the lowest quartile of the LDL‐C/HDL‐C ratio set as the reference. Four different models were constructed in the present study, and the results are presented as both crude and adjusted hazard ratios (HRs) estimates with 95% confidence intervals (CI). The potential confounders included in this study were selected based on their associations with the outcome or a change in effect estimate of >10%. Model 1 was adjusted for age, sex, family history of diabetes and smoking status at baseline. Model 2 was adjusted for covariates included in model 1, plus BMI, total cholesterol (TC), TGs, HDL‐C and FPG at baseline. Model 3 was adjusted for covariates included in model 2 and systolic blood pressure (SBP), diastolic blood pressure (DBP), serum blood urea nitrogen (BUN) level and serum creatinine concentration at baseline. Sensitivity analyses were carried out to assess the extent to which the association between the baseline LDL‐C/HDL‐C ratio and diabetes risk were affected by age, BMI and baseline glycemic status. Receiver operating characteristic curve analysis was carried out to assess the possibilities of the LDL‐C/HDL‐C ratio for prediction of diabetes, and the optimal cut‐off points were determined by Youden’s index.
Results
Study population characteristics
In total, 116,661 participants (mean age 44.07 ± 12.93 years; 53.8% men) without diabetes at baseline were enrolled in the present study. The median LDL‐C/HDL‐C ratio was 1.9836 (interquartile range 1.6358–2.4453). The main demographic and clinical characteristics of the participants are summarized in Table 1. Overall, participants in the top quartile of the LDL‐C/HDL‐C ratio (≥2.4453) were older, more likely to be male, current smoker, and have higher levels of BMI, SBP, DBP, TC, TG, LDL‐C, TG/HDL, FPG, BUN and creatinine, but lower levels of serum HDL‐C (all P < 0.001).
Table 1.
Baseline characteristics of the overall participants stratified by serum the low‐density lipoprotein cholesterol : high‐density lipoprotein cholesterol ratio quartiles
| Characteristics | Quartiles of LDL‐C/ HDL‐C index | P‐value | |||
|---|---|---|---|---|---|
| Quartile 1 (n = 29,170) | Quartile 2 (n = 29,152) | Quartile 3 (n = 29,179) | Quartile 4 (n = 29,160) | ||
| Age, years (SD) | 40.53 ± 11.90 | 42.98 ± 12.61 | 45.36 ± 13.05 | 47.42 ± 13.09 | <0.001 |
| Male, n (%) | 10,858 (37.2) | 14,214 (48.8) | 17,341 (59.4) | 20,346 (69.8) | <0.001 |
| Body mass index, kg/m2 (SD) | 21.78 ± 2.97 | 22.98 ± 3.16 | 23.87 ± 3.16 | 24.76 ± 3.13 | <0.001 |
| Smoking status, n (%) | |||||
| Non‐smoker | 6,872 (86.0) | 6,003 (79.3) | 5,776 (72.8) | 5,998 (65.6) | <0.001 |
| Past smoker | 222 (2.8) | 278 (16.7) | 371 (4.7) | 455 (5.0) | |
| Current smoker | 895 (11.2) | 1,287 (17.0) | 1,792 (22.6) | 2,684 (29.4) | |
| Family history of diabetes, n (%) | 647 (2.2) | 669 (2.3) | 643 (2.2) | 675 (2.3) | 0.609 |
| SBP, mmHg (SD) | 115.0 ± 15.6 | 118.3 ± 16.4 | 121.3 ± 16.9 | 123.1 ± 16.7 | <0.001 |
| DBP, mmHg (SD) | 71.5 ± 10.4 | 73.6 ± 10.8 | 75.5 ± 11.0 | 77.2 ± 10.9 | <0.001 |
| Total cholesterol, mmol/L (SD) | 4.25 ± 0.72 | 4.57 ± 0.72 | 4.90 ± 0.77 | 5.44 ± 0.90 | <0.001 |
| Triglycerides, mmol/L (SD) | 1.00 ± 1.04 | 1.21 ± 0.93 | 1.47 ± 0.97 | 1.83 ± 1.03 | <0.001 |
| HDL‐C, mmol/L (SD) | 1.61 ± 0.30 | 1.43 ± 0.24 | 1.32 ± 0.23 | 1.13 ± 0.22 | <0.001 |
| LDL‐C, mmol/L (SD) | 2.20 ± 0.45 | 2.59 ± 0.44 | 2.89 ± 0.50 | 3.39 ± 0.67 | <0.001 |
| LDL‐C/HDL‐C (SD) | 1.37 ± 0.19 | 1.81 ± 0.10 | 2.19 ± 0.13 | 3.06 ± 0.65 | <0.001 |
| TG/HDL‐C (SD) | 0.66 ± 0.87 | 0.88 ± 0.80 | 1.16 ± 0.87 | 1.72 ± 1.11 | <0.001 |
| Blood urea nitrogen, mmol/L (SD) | 4.48 ± 4.48 | 4.68 ± 1.17 | 4.76 ± 1.19 | 4.82 ± 1.17 | <0.001 |
| Creatinine, μmol/L (SD) | 65.43 ± 15.08 | 69.48 ± 15.53 | 72.45 ± 15.71 | 74.00 ± 15.60 | <0.001 |
| Fasting blood glucose, mmol/L (SD) | 4.82 ± 0.56 | 4.95 ± 0.58 | 4.99 ± 0.62 | 5.02 ± 0.65 | <0.001 |
Categorical variables were presented as counts (percentages); continuous data were expressed as the mean ± standard deviation (SD). DBP, diastolic blood pressure; HDL‐C, high‐density lipoprotein cholesterol; LDL‐C, low‐density lipoprotein cholesterol; SBP, systolic blood pressure; TG/HDL‐C, triglyceride/high‐density lipoprotein cholesterol ratio.
Diabetes incidence
During a median follow‐up period of 2.98 years (range 2.0–7.56 years), there were 2,681 (2.3%) new cases of diabetes. The crude cumulative incidence of diabetes by the LDL‐C/HDL‐C ratio quartiles were 0.31, 0.43, 0.68 and 0.88%, from the lowest to the highest quartile, respectively (Table 2). Cumulative incidence gradually increased with higher LDL‐C/HDL‐C quartiles in women and men (all P‐value for log–rank test <0.001). There was a higher cumulative incidence of diabetes across all LDL‐C/HDL‐C ratio quartiles among men than among women (Table 2; Figure 1). Overall 8 year diabetes‐free survival rates, stratified by LDL‐C/HDL‐C ratio quartiles and sex, are presented in Figure 1.
Table 2.
Incidence rate of new‐onset diabetes
| Groups | Participants (n) | Diabetes events (n) | Cumulative incidence (95% CI) |
|---|---|---|---|
| Overall | |||
| Total | 116,661 | 2,681 | 2.30 (2.21–2.38) |
| Quartile 1 | 29,170 | 366 | 0.31 (0.28–0.35) |
| Quartile 2 | 29,152 | 499 | 0.43 (0.39–0.47) |
| Quartile 3 | 29,179 | 789 | 0.68 (0.63–0.72) |
| Quartile 4 | 29,160 | 1,027 | 0.88 (0.83–0.93) |
| P‐value for log–rank test | <0.001 | ||
| Male | |||
| Total | 62,759 | 1,888 | 3.01 (2.87–3.14) |
| Quartile 1 | 10,858 | 248 | 0.40 (0.35–0.44) |
| Quartile 2 | 14,214 | 336 | 0.53 (0.48–0.59) |
| Quartile 3 | 17,341 | 528 | 0.84 (0.77–0.92) |
| Quartile 4 | 20,346 | 776 | 1.24 (1.15–1.32) |
| P‐value for log–rank test | <0.001 | ||
| Female | |||
| Total | 53,902 | 793 | 1.47 (1.37–1.57) |
| Quartile 1 | 18,312 | 118 | 0.22 (0.18–0.26) |
| Quartile 2 | 14,938 | 163 | 0.30 (0.26–0.35) |
| Quartile 3 | 11,838 | 261 | 0.48 (0.43–0.54) |
| Quartile 4 | 8,814 | 251 | 0.47 (0.41–0.52) |
| P value for log–rank test | <0.001 | ||
Figure 1.
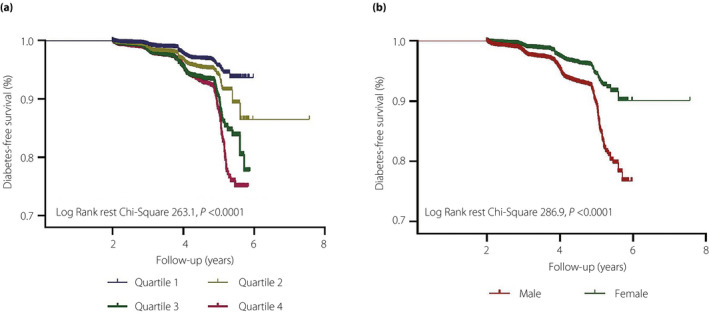
The follow up without a diabetes (diabetes free) survival curve. (a) The incidence of diabetes was higher among participants with a low‐density lipoprotein cholesterol : high‐density lipoprotein cholesterol ratio in the highest quartile. (b) The incidence of diabetes was higher among male participants.
LDL‐C/HDL‐C ratio and risk of diabetes
Collinearity analysis of diabetes predictors and LDL‐C/HDL‐C ratio are presented in Tables S1 and S2. Collinearity analysis showed that LDL‐C, TG/HDL‐C and LDL‐C/HDL‐C had high collinearity (tolerance <0.10 and VIF >10). Therefore, LDL‐C and TG/HDL‐C were not included in the multivariate models. The relationship between the LDL‐C/HDL‐C ratio and diabetes risk was explored in different Cox proportional hazards regression models in which the LDL‐C/HDL‐C ratio was included as a categorical variable. In the unadjusted model, compared with people in the lowest quartile, the HRs for diabetes risk were 1.53 (95% CI 1.34–1.75), 2.18 (95% CI 1.93–2.47) and 2.43 (95% CI 2.16–2.74) for individuals with LDL‐C/HDL‐C ratio in the second, third and fourth quartile, respectively. After progressive adjustment for various variables, including age, sex, family history of diabetes, smoking status, BMI, TGs, TC, HDL‐C, baseline glycemic status (FPG levels or presence of IFG, separately), SBP, DBP, BUN, and creatinine, the LDL‐C/HDL‐C ratio remained significantly associated with new‐onset diabetes, despite the HRs being attenuated (Tables 3,S3).
Table 3.
Cox regression analysis for the relationship between the low‐density lipoprotein cholesterol : high‐density lipoprotein cholesterol ratio and incident diabetes in overall participants
| Models | Quartiles of LDL‐C/HDL‐C ratio | P‐value for trend | |||
|---|---|---|---|---|---|
| Quartile 1 | Quartile 2 | Quartile 3 | Quartile 4 | ||
| Crude | Ref | 1.53 (1.34–1.75) | 2.18 (1.93–2.47) | 2.43 (2.16–2.74) | <0.001 |
| Model 1 | Ref | 1.30 (0.98–1.72) | 1.56 (1.20–2.03) | 1.73 (1.36–2.22) | <0.001 |
| Model 2 | Ref | 1.15 (0.86–1.54) | 1.37 (1.03–1.82) | 1.82 (1.36–2.43) | <0.001 |
| Model 3 | Ref | 1.18 (0.87–1.59) | 1.42 (1.07–1.90) | 1.92 (1.43–2.59) | <0.001 |
Regression results were presented as hazard ratio estimates with 95% confidence intervals, and the reference (Ref) group was quartile 1; P for trend <0.05 is considered statistically significant; model 1 was adjusted for age, sex, family history of diabetes and smoking status at baseline; model 2 was further adjusted for model 1 covariates plus body mass index, total cholesterol, triglycerides, high‐density lipoprotein cholesterol (HDL‐C) and fasting plasma glucose at baseline; model 3 was adjusted for model 2 covariates plus systolic blood pressure, diastolic blood pressure, serum blood urea nitrogen and creatinine at baseline. LDL‐C, low‐density lipoprotein cholesterol.
Stratification analysis
To assess the robustness of the present results, the following subgroup stratified analyses were carried out. All subgroup analyses were adjusted for age, sex, family history of diabetes, smoking status, BMI, TC, TGs, HDL‐C, FPG, SBP, DBP, BUN and creatinine, except the stratification factor itself. First, there was a significant interaction between the LDL‐C/HDL‐C ratio and baseline glycemic status (P = 0.032), suggesting that the impact of the LDL‐C/HDL‐C ratio on diabetes risk might be modified by FPG. To eliminate the influence, we carried out sensitivity analyses in the IFG and NFG subgroups separately, and the results suggested that in those with IFG/NFG, as the LDL/HDL increased, the risk of diabetes increased significantly (Table 4). Similarly, the results for age‐ and BMI‐stratified subgroups were consistent with primary analyses, showing a positive relationship between elevated LDL‐C/HDL‐C ratio and higher risk of diabetes, and this association appeared to be more substantial in participants with abnormal weight and age <55 years (Table 4).
Table 4.
Cox regression analysis for the relationship between the low‐density lipoprotein cholesterol : high‐density lipoprotein cholesterol ratio and incident diabetes in various subgroups of participants
| Subgroups | Adjusted model, HR (95% CI) | P for interaction | ||||
|---|---|---|---|---|---|---|
| Quartile 1 | Quartile 2 | Quartile 3 | Quartile 4 | P for trend | ||
| BMI (kg/m2) | ||||||
| Normal (n = 63,476) | Ref | 1.31 (0.78–2.20) | 2.06 (1.26–3.35) | 2.02 (1.19–3.45) | 0.003 | 0.006 |
| Abnormal (n = 53,185) | Ref | 1.26 (0.86–1.85) | 1.51 (1.01–2.26) | 2.48 (1.53–4.01) | <0.001 | |
| Age (years) | ||||||
| <55 (n = 91,326) | Ref | 1.28 (0.81–2.05) | 1.89 (1.17–3.05) | 3.27 (1.84–5.80) | <0.001 | 0.454 |
| ≥55 (n = 25,335) | Ref | 1.14 (0.77–1.70) | 1.39 (0.95–2.04) | 1.70 (1.14–2.52) | 0.003 | |
| Baseline glycemic status | ||||||
| NFG (n = 101,120) | Ref | 1.97 (1.08–3.59) | 2.50 (1.29–4.82) | 3.66 (1.64–8.18) | 0.002 | 0.032 |
| IFG (n = 15,541) | Ref | 1.02 (0.72–1.45) | 1.21 (0.87–1.70) | 1.50 (1.05–2.13) | 0.006 | |
Regression results were presented as hazard ration (HR) estimates with 95% confidence intervals (CI), and the reference group was quartile 1; P for trend <0.05 is considered statistically significant. When analyzing a subgroup, age, sex, family history of diabetes, smoking status, body mass index (BMI), total cholesterol, triglycerides, high‐density lipoprotein cholesterol (HDL‐C), fasting plasma glucose, systolic blood pressure, diastolic blood pressure, blood urea nitrogen and creatinine were all adjusted, except the stratification factor itself. IFG, impaired fasting glucose; NFG, normal fasting glucose.
Discussion
To the best of our knowledge, this is the first study investigating the relationship between the LDL‐C/HDL‐C ratio and new‐onset diabetes risk in the Chinese population. This longitudinal study clearly showed that as the LDL‐C/HDL‐C ratio increased, the incidence of new‐onset diabetes became gradually more pronounced. After adjusting for the confounding factors, the LDL‐C/HDL‐C ratio was significantly associated with an increased risk of diabetes in Chinese adults, with a value of 1.92 (95% CI 1.43–2.59, P < 0.001) for those in the highest quartile. Furthermore, the positive effect was prominent in all subgroups considered.
The LDL‐C/HDL‐C ratio, as a surrogate marker of IR and mixed dyslipidemia, is gradually gaining interest in cardiovascular disease‐related research 16 , 17 , 23 . However, no data are currently available regarding the effect of the LDL‐C/HDL‐C ratio on diabetes risk in the Chinese population. The present study showed an association between a higher LDL‐C/HDL‐C ratio and an increased risk of diabetes for the first time, and contributed to epidemiological evidence that the LDL‐C/HDL‐C ratio might be an important indicator to identify people at a high risk of diabetes in the Chinese adult population. Similar results were also obtained in a recent cross‐sectional study involving 935 Chinese participants, where Hong et al. 18 found that a higher LDL‐C/HDL‐C ratio is significantly associated with the presence of diabetes among participants with hypertension, regardless of age, sex and other lipid profiles. Of note, in the study by Hong et al. 18 , TG levels alongside the LDL‐C/HDL‐C ratio mediated the risk of diabetes in patients with hypertension. However, there was no evidence of such an interaction in the present study, suggesting an independent effect of the LDL‐C/HDL‐C ratio on diabetes risk in the general population. The mechanisms underlying the close connection between the LDL‐C/HDL‐C ratio and diabetes risk is further supported by evidence from studies that LDL‐C and HDL‐C affect β‐cell function and survival in an opposite way. Specifically, LDL‐C can inhibit the secretion of insulin by islet cells, whereas HDL‐C can promote insulin secretion 7 . In insulin‐producing cell lines, Abderrahmani et al. 24 showed that prolonged incubation with oxidized LDL can diminish insulin expression and induce cell death by activating the c‐Jun N‐terminal kinase pathway, whereas treatment with HDL can counter these effects. Considering all this evidence, the LDL‐C/HDL‐C ratio might be a powerful indicator of new‐onset diabetes mellitus risk, which could be helpful to define populations at “high risk” of diabetes in the Chinese population.
Prediabetes, based on glycemic parameters above normal, but below the diabetes threshold, is a well‐established high‐risk state for developing diabetes, with an annualized conversion rate of 5–10% 25 , 26 . A categorization of individuals as either NFG or prediabetic (IFG or IGT) neglects the fact that incident diabetes risk significantly increases for FPG values that are within the currently accepted normal range 27 , 28 . Thus, in diabetes risk prediction, baseline glycemic measures are considered as continuous (FPG levels) and categorical (presence or absence of IFG) confounding variables individually. The results from different Cox regression models support the conclusion that a higher LDL‐C/HDL‐C ratio at baseline is an independent risk factor for diabetes in community‐based cohorts, regardless of baseline glycemic status. Interestingly, subgroup analysis showed that the predictive value of the LDL‐C/HDL‐C ratio was more potent among individuals with NFG (adjusted HRs in the highest quartile was 3.66 vs 1.55 for the NFG and IFG subgroups, respectively). A possible explanation for this pattern is that the risk of diabetes is apparently increased in participants with elevated FPG levels in the IFG group, thus overriding the effect of a relatively smaller risk factor (elevated LDL‐C/HDL‐C ratio). Furthermore, consistent with previous studies, advanced age and adiposity are also associated with increased diabetes risk 20 . Therefore, we also carried out sensitivity analysis by BMI and age. The results showed that the positive relationship between the LDL‐C/HDL‐C ratio and diabetes risk was robust in all subgroups, with a stronger association among adults aged <55 years. The underlying mechanisms responsible for this age‐related heterogeneity of effect are unclear, but it is likely mediated by a decline in general health and an increase in the number of comorbidities associated with older age, including reduction of cellular capacity to repair. For example, an imbalanced redox system (elevated levels of urinary oxidized guanine/guanosine and urinary 8‐isoprostane) has been associated with increased risk of diabetes among older adults 29 .
The LDL‐C/HDL‐C ratio cut‐off points for assessing the risk of new‐onset diabetes are an important consideration. In the present study, the receiver operating characteristic analysis showed a LDL‐C/HDL‐C ratio of 1.99 to have the strongest association with diabetes (68% sensitivity and 51% specificity, data not shown). Analysis stratified by the LDL‐C/HDL‐C ratio quartiles confirmed this cut‐off point, with a greater clinical outcome expected at a ratio <1.6. Given that this is the first report on the relationship between LDL‐C/HDL‐C ratio and the risk of diabetes in the general population, it is difficult to compare the present findings with previous studies. However, Kurabayashi et al. 30 suggested that maintaining the LDL‐C/HDL‐C ratio <2.0 helped inhibit progression of advanced atherosclerotic plaques or even enhance plaque regression, with a ratio of 1.5 likely to achieve better results. Furthermore, a prior study 31 reported similar cut‐off values of the LDL‐C/HDL‐C ratio for predicting the progression of carotid intima‐media thickness. These findings suggest that application of the LDL‐C/HDL‐C ratio in a clinical setting with the general population might be an accessible and affordable approach that could provide valuable information correlated with several metabolic diseases.
The strength of the present study is that our sample size was large, was derived from 32 sites and 11 cities in China, and the age range was wide; thus, the conclusion of the present study might have wide applicability for the Chinese population. However, the present study also had some limitations. First, diabetes diagnoses were based on self‐report and FPG levels, which is a limitation, as we could have missed some cases of diabetes; however, the 75‐g oral glucose tolerance test (gold standard) is not applicable to a large sample survey because of its complexity to carry out. Second, the types of diabetes were not distinguished; however, previous findings suggest that type 1 diabetes affects <5% of the global population 32 . To a large extent, the present study has focused on type 2 diabetes. Finally, this was a retrospective study, although we adjusted for as many covariate variables as possible to diminish the possible influences, residual confounding was unavoidable. For example, de Boer et al. 33 found that a decline in insulin sensitivity can be attributed to differences in lifestyle and body composition, which are variables the present study could not account for. In addition, previous surveys showed that some antidyslipidemic medications might influence diabetes occurrence, and the results are conflicted 34 , 35 . However, the exact information of oral lipid‐lowering agents was not available for the present participants. Therefore, future well‐designed prospective studies are required to investigate residual confounding and confirm the present study findings.
In the present study, we first investigated the relationship between the LDL‐C/HDL‐C ratio and new‐onset diabetes risk, and our data strongly showed that an elevated LDL‐C/HDL‐C ratio is independently and positively associated with an increased risk of diabetes in the Chinese population. These findings suggested that the ratio LDL‐C/HDL‐C ratio is not only a surrogate indicator of IR and cardiovascular disease, but also plays a vital role in the pathogenesis of diabetes. Regular assessment of the LDL‐C/HDL‐C ratio is helpful as a screening test, and should be accompanied by patient education, including information on the recommended proportions of dietary fatty acids 36 , or intervention with antidyslipidemic medications 35 , to prevent adverse events.
Disclosure
The authors declare no conflict of interest.
Supporting information
Table S1 | Collinearity analysis of unselected diabetes predictors and the low‐density lipoprotein cholesterol : high‐density lipoprotein cholesterol ratio.
Table S2 | Collinearity analysis of selected diabetes predictors and the low‐density lipoprotein cholesterol : high‐density lipoprotein cholesterol ratio.
Table S3 | Association between the low‐density lipoprotein cholesterol : high‐density lipoprotein cholesterol ratio with risk of incident diabetes when fasting plasma glucose was included as a categorical confounding variable.
Acknowledgments
We appreciate Ying Chen and Xiaoying Li et al. for sharing their scientific knowledge. This study was supported by the National Natural Science Foundation of China (No. 81870507).
J Diabetes Investig 2021; 12: 91–98
References
- 1. Zhou B, Lu Y, Hajifathalian Y, et al Worldwide trends in diabetes since 1980: a pooled analysis of 751 populationbased studies with 4.4 million participants. Lancet 2016; 387: 1513–1530. [DOI] [PMC free article] [PubMed] [Google Scholar]
- 2. International Diabetes Federation . IDF Diabetes Atlas, 9th edn Brussels, Belgium: International Diabetes Federation, 2019. Available from: https://diabetesatlas.org/upload/resources/2019/IDF_Atlas_9th_Edition_2019.pdf [Google Scholar]
- 3. Taskinen MR, Boren J. New insights into the pathophysiology of dyslipidemia in type 2 diabetes. Atherosclerosis 2015; 239: 483–495. [DOI] [PubMed] [Google Scholar]
- 4. von Eckardstein A, Sibler RA. Possible contributions of lipoproteins and cholesterol to the pathogenesis of diabetes mellitus type 2. Curr Opin Lipidol 2011; 22: 26–32. [DOI] [PubMed] [Google Scholar]
- 5. Cui W, Ma J, Wang X, et al Free fatty acid induces endoplasmic reticulum stress and apoptosis of beta‐cells by Ca2+/calpain‐2 pathways. PLoS One 2013; 8: e59921. [DOI] [PMC free article] [PubMed] [Google Scholar]
- 6. Kim JK, Fillmore JJ, Sunshine MJ, et al PKC‐theta knockout mice are protected from fat‐induced insulin resistance. J Clin Investig 2004; 114: 823–827. [DOI] [PMC free article] [PubMed] [Google Scholar]
- 7. Rutti S, Ehses JA, Sibler RA, et al Low‐ and high‐density lipoproteins modulate function, apoptosis, and proliferation of primary human and murine pancreatic beta‐cells. Endocrinology 2009; 150: 4521–4530. [DOI] [PubMed] [Google Scholar]
- 8. Skretteberg PT, Grytten AN, Gjertsen K, et al Triglycerides‐diabetes association in healthy middle‐aged men: modified by physical fitness? A long term follow‐up of 1962 Norwegian men in the Oslo Ischemia Study. Diabetes Res Clin Pract 2013; 101: 201–209. [DOI] [PubMed] [Google Scholar]
- 9. Kunutsor SK, Kieneker LM, Bakker SJL, et al Incident type 2 diabetes is associated with HDL, but not with its anti‐oxidant constituent ‐ paraoxonase‐1: the prospective cohort PREVEND study. Metabolism 2017; 73: 43–51. [DOI] [PubMed] [Google Scholar]
- 10. Asghari S, Aref‐Eshghi E, Godwin M, et al Single and mixed dyslipidaemia in Canadian primary care settings: findings from the Canadian primary care sentinel surveillance network database. BMJ Open 2015; 5: 12. [DOI] [PMC free article] [PubMed] [Google Scholar]
- 11. Laforest L, Ambegaonkar BM, Souchet T, et al Mixed dyslipidemias in primary care patients in France. Vasc Health Risk Manag 2012; 8: 247–254. [DOI] [PMC free article] [PubMed] [Google Scholar]
- 12. Chen Z, Chen G, Qin H, et al Higher triglyceride to high‐density lipoprotein cholesterol ratio increases cardiovascular risk: 10‐year prospective study in a cohort of Chinese adults. J Diabetes Investig 2020; 11: 475–481. [DOI] [PMC free article] [PubMed] [Google Scholar]
- 13. Bando Y, Wakaguri H, Aoki K, et al Non‐high‐density cholesterol level as a predictor of maximum carotid intima‐media thickness in Japanese subjects with type 2 diabetes: a comparison with low‐density lipoprotein level. Diabetol Int 2016; 7: 34–41. [DOI] [PMC free article] [PubMed] [Google Scholar]
- 14. Kawamoto R, Tabara Y, Kohara K, et al Low‐density lipoprotein cholesterol to high‐density lipoprotein cholesterol ratio is the best surrogate marker for insulin resistance in non‐obese Japanese adults. Lipids Health Dis 2010; 9: 138. [DOI] [PMC free article] [PubMed] [Google Scholar]
- 15. Byun AR, Lee SW, Lee HS, et al What is the most appropriate lipid profile ratio predictor for insulin resistance in each sex? A cross‐sectional study in Korean populations (The Fifth Korea National Health and Nutrition Examination Survey). Diabetol Metab Syndr 2015; 7: 59. [DOI] [PMC free article] [PubMed] [Google Scholar]
- 16. Kurebayashi N, Yoshikawa D, Ishii H, et al Impact of the low‐ to high‐density lipoprotein cholesterol ratio on composition of angiographically ambiguous left main coronary artery plaque. Circ J 2011; 75: 1960–1967. [DOI] [PubMed] [Google Scholar]
- 17. Zhong Z, Hou J, Zhang Q, et al Assessment of the LDL‐C/HDL‐C ratio as a predictor of one year clinical outcomes in patients with acute coronary syndromes after percutaneous coronary intervention and drug‐eluting stent implantation. Lipids Health Dis 2019; 18: 40. [DOI] [PMC free article] [PubMed] [Google Scholar]
- 18. Hong M, Ling Y, Lu Z, et al Contribution and interaction of the low‐density lipoprotein cholesterol to high‐density lipoprotein cholesterol ratio and triglyceride to diabetes in hypertensive patients: a cross‐sectional study. J Diabetes Investig 2019; 10: 131–138. [DOI] [PMC free article] [PubMed] [Google Scholar]
- 19. Chen Y, Zhang X, Yuan J, et al Association of body mass index and age with incident diabetes in Chinese adults: a population‐based cohort study. Dryad Digital Repository 2018. 10.5061/dryad.ft8750v [DOI] [PMC free article] [PubMed] [Google Scholar]
- 20. Chen Y, Zhang XP, Yuan J, et al Association of body mass index and age with incident diabetes in Chinese adults: a population‐based cohort study. BMJ Open 2018; 8: 9. [DOI] [PMC free article] [PubMed] [Google Scholar]
- 21. Grant RW, Kirkman MS. Trends in the evidence level for the American Diabetes Association’s “Standards of Medical Care in Diabetes” from 2005 to 2014. Diabetes Care 2015; 38: 6–8. [DOI] [PubMed] [Google Scholar]
- 22. Chinese Medical Association Society of Endocrinology Group Obesity . Expert consensus for Chinese adult obesity prevention and control. Chin J Endocrinol Metab 2011; 27: 711–717. [Google Scholar]
- 23. Matsumoto I, Miyake Y, Mizukawa M, et al Impact of low‐density lipoprotein cholesterol/high‐density lipoprotein cholesterol ratio on long‐term outcome in patients undergoing percutaneous coronary intervention. Circ J 2011; 75: 905–910. [DOI] [PubMed] [Google Scholar]
- 24. Abderrahmani A, Niederhauser G, Favre D, et al Human high‐density lipoprotein particles prevent activation of the JNK pathway induced by human oxidised low‐density lipoprotein particles in pancreatic beta cells. Diabetologia 2007; 50: 1304–1314. [DOI] [PubMed] [Google Scholar]
- 25. Tabak AG, Herder C, Rathmann W, et al Prediabetes: a high‐risk state for diabetes development. Lancet 2012; 379: 2279–2290. [DOI] [PMC free article] [PubMed] [Google Scholar]
- 26. Nathan DM, Davidson MB, DeFronzo RA, et al Impaired fasting glucose and impaired glucose tolerance: implications for care. Diabetes Care 2007; 30: 753–759. [DOI] [PubMed] [Google Scholar]
- 27. Tirosh A, Shai I, Tekes‐Manova D, et al Normal fasting plasma glucose levels and type 2 diabetes in young men. N Engl J Med 2005; 353: 1454–1462. [DOI] [PubMed] [Google Scholar]
- 28. Brambilla P, La Valle E, Falbo R, et al Normal fasting plasma glucose and risk of type 2 diabetes. Diabetes Care 2011; 34: 1372–1374. [DOI] [PMC free article] [PubMed] [Google Scholar]
- 29. Schottker B, Xuan Y, Gao X, et al Oxidatively damaged DNA/RNA and 8‐isoprostane levels are associated with the development of type 2 diabetes at older age: results from a large cohort study. Diabetes Care 2020; 43: 130–136. [DOI] [PubMed] [Google Scholar]
- 30. Kurabayashi M, Yamazaki T. Superior benefit of aggressive lipid‐lowering therapy for high‐ risk patients using statins: the SUBARU study–more hypercholesterolemic patients achieve Japan Atherosclerosis Society LDL‐C goals with rosuvastatin therapy than with atorvastatin therapy. J Atheroscler Thromb 2008; 15: 314–323. [DOI] [PubMed] [Google Scholar]
- 31. Enomoto M, Adachi H, Hirai Y, et al LDL‐C/HDL‐C ratio predicts carotid intima‐media thickness progression better than HDL‐C or LDL‐C alone. J Lipids 2011; 2011: 549137. [DOI] [PMC free article] [PubMed] [Google Scholar]
- 32. World Health Organization . Prevention of diabetes mellitus Accessed December 28, 2012.
- 33. de Boer IH, Zelnick L, Afkarian M, et al Impaired glucose and insulin homeostasis in moderate‐severe CKD. J Am Soc Nephrol 2016; 27: 2861–2871. [DOI] [PMC free article] [PubMed] [Google Scholar]
- 34. Sattar N, Preiss D, Murray HM, et al Statins and risk of incident diabetes: a collaborative meta‐analysis of randomised statin trials. Lancet 2010; 375: 735–742. [DOI] [PubMed] [Google Scholar]
- 35. Khang AR, Song YS, Kim KM, et al Comparison of different statin therapy to change low‐density lipoprotein cholesterol and high‐density lipoprotein cholesterol level in Korean patients with and without diabetes. J Clin Lipidol 2016; 10: 528–537.e3. [DOI] [PubMed] [Google Scholar]
- 36. Muller H, Lindman AS, Brantsaeter AL, et al The serum LDL/HDL cholesterol ratio is influenced more favorably by exchanging saturated with unsaturated fat than by reducing saturated fat in the diet of women. J Nutr 2003; 133: 78–83. [DOI] [PubMed] [Google Scholar]
Associated Data
This section collects any data citations, data availability statements, or supplementary materials included in this article.
Supplementary Materials
Table S1 | Collinearity analysis of unselected diabetes predictors and the low‐density lipoprotein cholesterol : high‐density lipoprotein cholesterol ratio.
Table S2 | Collinearity analysis of selected diabetes predictors and the low‐density lipoprotein cholesterol : high‐density lipoprotein cholesterol ratio.
Table S3 | Association between the low‐density lipoprotein cholesterol : high‐density lipoprotein cholesterol ratio with risk of incident diabetes when fasting plasma glucose was included as a categorical confounding variable.