Abstract
Background
Prediction of lymph node status in esophageal squamous cell carcinoma (ESCC) is critical for clinical decision making. In clinical practice, computed tomography (CT) has been frequently used to assist in the preoperative staging of ESCC. Texture analysis can provide more information to reflect potential biological heterogeneity based on CT. A nomogram for the preoperative diagnosis of lymph node metastasis in patients with resectable ESCC has been previously developed. However, to the best of our knowledge, no reports focus on developing CT radiomics features to discriminate ESCC patients with regional lymph node metastasis (RLNM) and non-regional lymph node metastasis (NRLNM). We, therefore, aimed to develop CT radiomics models to predict lymph node metastasis (LNM) in advanced ESCC and to discriminate ESCC between RLNM and NRLNM.
Methods
This study enrolled 334 patients with pathologically confirmed advanced ESCC, including 152 patients without LNM and 182 patients with LNM, and 103 patients with RLNM and 79 patients NRLNM. Radiomics features were extracted from CT data for each patient. The least absolute shrinkage and selection operator (LASSO) model and independent samples t-tests or Mann-Whitney U tests were exploited for dimension reduction and selection of radiomics features. Optimal radiomics features were chosen using multivariable logistic regression analysis. The discriminating performance was assessed by area under the receiver operating characteristic curve (AUC) and accuracy.
Results
The radiomics features were developed based on multivariable logistic regression and were significantly associated with LNM status in both the training and validation cohorts (P<0.001). The radiomics models could differentiate between patients with and without LNM (AUC =0.79 and 0.75, and accuracy =0.75 and 0.71 in the training and validation cohorts, respectively). In patients with LNM, the radiomics features could effectively differentiate between RLNM and NRLNM (AUC =0.98 and 0.95, and accuracy =0.94 and 0.83 in the training and validation cohorts, respectively).
Conclusions
CT radiomics features could help predict the LNM status of advanced ESCC patients and effectively discriminate ESCC between RLNM and NRLNM.
Keywords: Esophageal neoplasms, squamous cell carcinoma, X-ray, computed tomography (CT), lymphatic metastasis
Introduction
Esophageal cancer is the eighth most common malignant tumor worldwide, and squamous cell carcinoma is the predominant histological type (1,2). In clinical settings, patients with early stage esophageal squamous cell carcinoma (ESCC) are likely N0, requiring esophagectomy alone, while lymph node metastasis (LNM) is most common in ESCC patients with locally advanced or metastatic status. Advanced tumors are likely regional N+ and require preoperative or postoperative chemotherapy or chemoradiotherapy (3). According to the definition of the 7th edition of the American Joint Committee on Cancer (AJCC) staging system, cervical lymph nodes are regarded as non-regional or distant lymph nodes in ESCC (4). Patients with cervical LNM or distant LNM have been classified as having stage IVa/IVb disease. Stage IVa exists only in 2 circumstances, including cervical LNM from upper third cancer and celiac LNM from lower third cancer. Patients with IVb stage cancer or distant metastases are regarded as having an incurable disease, and these patients cannot undergo surgery, only chemotherapy and/or radiotherapy (5). Therefore, the prediction of lymph node status in ESCC patients is critical for clinical decision making.
In clinical practice, although computed tomography (CT) has been frequently used to assist with the preoperative staging of ESCC, the detection accuracy of positive lymph nodes on preoperative CT remains controversial, and the reported accuracy, specificity, and sensitivity range between 85.8–87.2%, 63.9–96.4%, and 37.3–67.2%, respectively (6). Recent studies have found that texture analysis can provide more information to reflect potential biological heterogeneity based on widely available CT images (7-9). Radiomics is an emerging field that enables high-throughput extraction of quantitative features from medical images (e.g., CT), and enhances the accuracy of diagnosis, prognosis, and prediction, especially for tumors (10-12). In previous studies (13,14), Tan et al. and Shen et al. developed nomograms for the preoperative diagnosis of LNM in patients with resectable ESCC. Qu et al. adopted a multivariable logistic regression analysis to assess the MR radiomics signature’s role in the preoperative prediction of LNM in patients with esophageal cancer (15). However, to the best of our knowledge, no reports focus on developing CT radiomics features to discriminate between patients with regional LNM (RLNM) and non-regional LNM (NRLNM) despite previous radiomics models for the preoperative diagnosis of LNM in patients with resectable ESCC. Therefore, the purpose of our study was to develop a new CT radiomics model for predicting LNM in advanced ESCC, and a superior radiomics model for discriminating ESCC between RLNM and NRLNM.
Methods
Patients
Ethical approval was obtained for this study, including the retrospective analysis of prospectively acquired data. All participants provided written informed consent before our study.
This study evaluated the institutional database for medical records between September 2016 and January 2019 to identify patients with biopsy-confirmed ESCC who underwent CT scans. The inclusion criteria were as follows: (I) patients had endoscopic biopsy-confirmed ESCC; (II) patients without LNM and with RLNM received esophagectomy within 14 days after the contrast-enhanced CT scan, and the resected lymph node status was pathologically determined after regional lymphadenectomy or extended regional lymphadenectomy; and (III) in patients with NRLNM (e.g., cervical lymph node metastasis), the lymph node status was pathologically confirmed by fine needle aspiration before undergoing neoadjuvant chemotherapy. The exclusion criteria were as follows: (I) patients received any tumor-related treatment (e.g., chemotherapy or radiotherapy) before undergoing CT (n=8); (II) clinicopathological information was incomplete (n=9); or (III) the quality of the CT images was poor (n=4). Ultimately, 334 patients (237 men and 97 women; age range 40–82 years) who met the criteria were enrolled in our study. Of the enrolled patients, no ESCC involved the esophagogastric junction, and 182 patients had LNM, whereas the remaining 152 patients did not as shown on CT. Of the 182 patients with LNM, 103 patients had RLNM, and 79 patients had NRLNM. As for RLNM, it should be noted that regional lymph node status was defined as those in the periesophageal tissue from the upper esophageal sphincter to the celiac artery. Cervical LNM from upper third ESCC was considered as having RLNM in esophageal cancer, while cervical LNM from middle and lower third ESCC was regarded as NRLNM (4). In this study, all patients with NRLNM had cervical LNM, and the cervical lymph node status was identified according to the histopathological reports after fine needle aspiration. In all the 79 patients with NRLNM, cervical LNM was found from middle and lower third ESCC, and no celiac LNM was found as shown on CT.
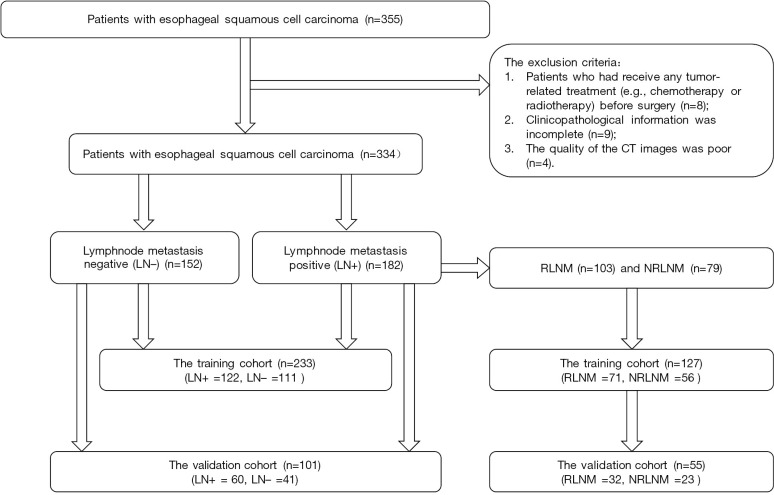
All enrolled patients, including patients with and without LNM, were randomly divided into the training cohort (n=233) and the validation cohort (n=101) in a 7:3 ratio according to the published report by Chen et al. for developing CT radiomics features to predict LNM in ESCC (16). In the training cohort, 122 patients had LNM, whereas 111 did not. In the validation cohort, 60 patients had LNM, whereas 41 patients did not.
In order to develop CT radiomics features for discriminating patients with RLNM and NRLNM, the 182 patients with LNM were randomly subdivided into another training cohort (n=127) and another validation cohort (n=55) in the ratio mentioned above. In this training group, 71 patients had RLNM, whereas 56 had NRLNM. In the validation group, 32 patients had RLNM, while 23 had NRLNM. The research sequence is illustrated in Figure 1. The clinicopathological characteristics in the training cohort and validation cohort between patients with and without LNM, and between patients with RLNM and NRLNM are presented in Tables 1 and 2. The baseline clinicopathological characteristics including age, gender, tumor site, and histological grade were derived from the medical records.
Figure 1.
Flow chart of patient recruitment in this study. LN+, lymph node metastasis positive; LN−, lymph node metastasis negative; RLNM, regional lymph node metastasis; NRLNM, non-regional lymph node metastasis.
Table 1. Clinical characteristics of patients with and without lymph node metastasis in the training and validation cohorts.
| Variable | Training cohort (n=233) | Validation cohort (n=101) | |||
|---|---|---|---|---|---|
| LN− | LN+ | LN− | LN+ | ||
| Gender | |||||
| Male | 80 | 83 | 31 | 43 | |
| Female | 31 | 39 | 10 | 17 | |
| Age (years) | |||||
| Range | 49–78 | 40–82 | 48–79 | 56–77 | |
| Mean ± standard deviation | 65.58±6.58 | 64.07±8.01 | 66.52±7.94 | 66.93±5.70 | |
| Location of the tumor | |||||
| Upper thoracic esophagus | 15 | 19 | 5 | 7 | |
| Middle thoracic esophagus | 79 | 79 | 30 | 38 | |
| Lower thoracic esophagus | 17 | 24 | 6 | 15 | |
| Lymph node status | 111 | 122 | 41 | 60 | |
| Lymph node metastasis | |||||
| RLNM | – | 69 | – | 34 | |
| NRLNM | – | 53 | – | 26 | |
LN, lymph node; +, metastasis positive; −, metastasis negative; RLNM, regional lymph node metastasis; NRLNM, non-regional lymph node metastasis.
Table 2. Clinical characteristics of patients with RLNM and NRLNM in the training and validation cohorts.
| Variable | Training cohort (n=127) | Validation cohort (n=55) | |||
|---|---|---|---|---|---|
| NRLNM | RLNM | NRLNM | RLNM | ||
| Gender | |||||
| Male | 38 | 46 | 18 | 24 | |
| Female | 18 | 25 | 5 | 8 | |
| Age (years) | |||||
| Range | 42–74 | 48–82 | 47–78 | 50–80 | |
| Mean ± standard deviation | 64.88±5.78 | 67.52±4.43 | 65.72±3.58 | 66.79±7.28 | |
| Location of the tumor | |||||
| Upper thoracic esophagus | 6 | 9 | 3 | 4 | |
| Middle thoracic esophagus | 35 | 49 | 13 | 20 | |
| Lower thoracic esophagus | 15 | 13 | 7 | 8 | |
| Lymph node metastasis | 56 | 71 | 23 | 32 | |
RLNM, regional lymph node metastasis; NRLNM, non-regional lymph node metastasis.
Image acquisition
All patients underwent contrast-enhanced imaging with a 128-slice scanner (LightSpeed VCT, GE Medical systems, USA). Examinations were performed during a single breath-hold in the supine position. The scanning coverage was from the neck to the middle of the kidneys. Before CT image acquisitions, 100 to 200 mL water was used as the oral negative contrast material of esophagus. After routine non-enhanced CT, the contrast-enhanced CT scan was started 25–30 s after an intravenous administration of 1.5 mL/kg of the iodinated contrast material (Omnipaque, Iohexol, GE Healthcare, USA) at a rate of 3.0 to 3.5 mL/s for a total of 70–100 mL tailored to body weight at the ratio of 1.5 mL/kg weight via a pump injector (Vistron CT Injection System, Medrad, USA). A saline flush followed the administration of the contrast agent. The CT parameters were as follows: 120 kVp of peak voltage, 280 mA of tube current, 0.5 s of rotation time, 64 mm × 0.625 mm of detector collimation, 5 mm of slice thickness, and a matrix of 512 mm × 512 mm. Subsequently, the CT data were directly transferred to the General Electric Advantage Workstation 4.4 for data analysis.
Tumor segmentation and extraction of radiomics features
Two radiologists (Reader 1 with 3 years of experience in radiology, and Reader 2 with 22 years of experience in digestive radiology) who were blinded to the patients’ clinical outcomes delineated the three-dimensional (3D) region of interest (ROI) on the contrast-enhanced CT image in a blinded fashion (Figure 2) using the IBEX (β1.0, http://bit.ly/IBEX_MDAnderson). This open-source software program ran on MATLAB 2016Ra (MathWorks Inc.) to extract radiomics features (17). For each 3D ROI, when the esophageal wall showed focal thickening of more than 5 mm on transverse imaging, the esophageal wall was regarded as abnormal for the delineation of tumoral ROI (18). The outlines of ESCC were drawn free-hand around the gross tumor volume, avoiding fat, air, and bone. When there were disagreements on the ROI delineation, the two radiologists reached a consensus by discussion. When there was uncertainty around the tumor region, the area was not included in the ROI. Reader 1 performed the ROI delineation twice within 1 week following the same procedure for testing the intra-observer agreements to extract radiomics features.
Figure 2.
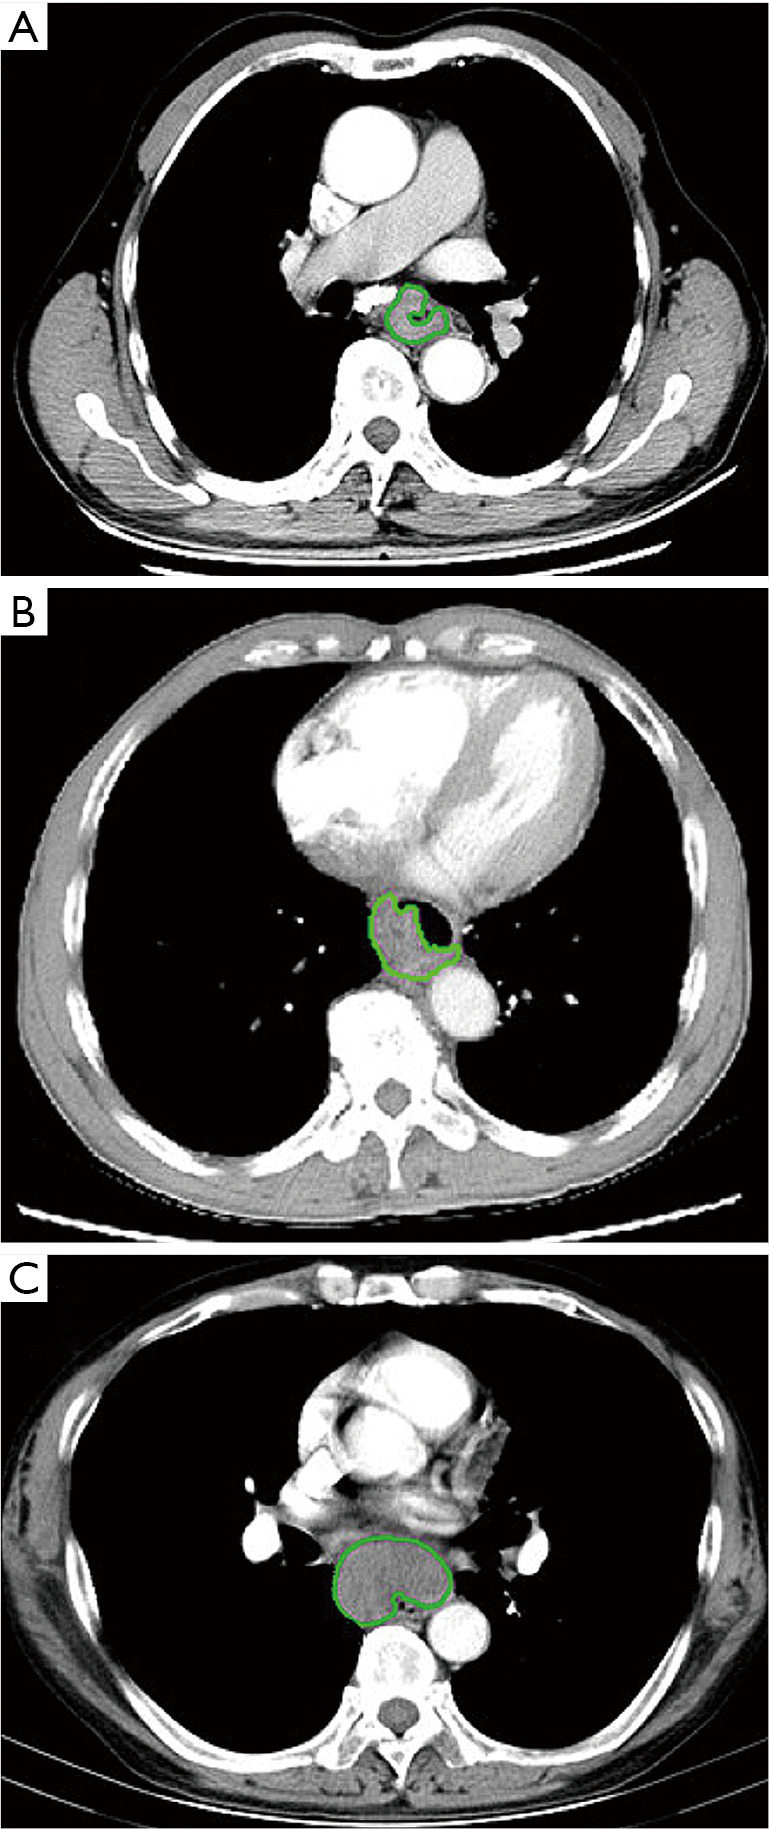
In the examples of esophageal squamous cell carcinoma (ESCC) without lymph node metastasis (LNM) (A) and with regional (B) and non-regional (C) LNM, the tumor contours were segmented manually on contrast-enhanced computed tomography (CT) images.
Features were extracted from the thoracic contrast-enhanced CT data, including shape, intensity histogram, gray level co-occurrence matrix (GLCM), and gray level run-length matrix (GLRLM) (19,20). Feature extraction was also performed using Matlab 2016Ra (MathWorks Inc.). To ensure the repeatability of the results, z-score normalization was performed as a preprocessing step for all data.
Intra- and inter-observer agreement
The intra-class correlation coefficient (ICC) was calculated to estimate intra-observer (Reader 1 twice) and inter-observer (Readers 1 vs. 2) agreements of each radiomics feature extraction. An ICC of greater than 0.75 was considered good agreement (21).
Features selection
Two steps were adopted to select the training cohort’s optimal features for developing CT radiomics features to predict LNM in ESCC and to discriminate ESCC between RLNM and NRLNM. First, all potential important features were selected from the features with an ICC score greater than 0.75 by the independent samples t-test or the Mann-Whitney U test for the training cohort. Features that did not meet either of the above tests were excluded. Second, the stable important features were entered into the least absolute shrinkage and selection operator (LASSO) model by shrinking the coefficients of useless features to zero, with the regulation parameter λ in the training cohort to identify the optimal features (22).
Construction of the radiomics model
Multivariable logistic regression on R software version 3.4.4 (https://www.r-project.org/) was used to produce predictive radiomics models based on CT features previously identified in the training cohort to discriminate patients with LNM from those without LNM, and to further distinguish patients with RLNM from those with NRLNM in patients with LNM. Qu et al. adopted the multivariable logistic regression method to assess the MR radiomics signature’s role in the preoperative prediction of LNM in patients with esophageal cancer and obtained good results (15). As reported, two models from grouped radiomics features based on selected features were developed using multivariable binary logistic regression with backward stepwise selection to build two linear classifiers for discriminating patients without LNM and with LNM, and for distinguishing patients with RLNM from those with NRLNM. Area under receiver operating characteristic curve (AUC), accuracy, sensitivity, and specificity were used to quantify the previous models’ discrimination performance.
Statistics analysis
Clinical characteristics were measured based on the variable type. Continuous variables were compared using a two-sample t-test. Categorical variables were compared using Pearson’s Chi-square test or Fisher’s exact test. The Mann-Whitney U test or the independent samples t test was applied to test the potential correlation of the lymph node status and the radiomics features in both the training cohort and the validation cohort. Statistical analyses of clinical characteristics were performed with SPSS statistical package (version 13.0 for Windows, SPSS Inc.). Other statistical analyses were conducted using R software version 3.4.4 (https://www.r-project.org/). LASSO regression was performed using the “glmnet” package based on the multivariate binary logistic regression analysis. The correlation coefficient matrix was plotted using the “Bggplot2” package. Differences were considered significant at P<0.05 (two-tailed).
Results
Patient characteristics
The training cohort’s demographic characteristics and the validation cohort between patients with and without LNM, and between patients with RLNM and with NRLNM are shown in Tables 1 and 2, respectively.
Inter-observer and intra-observer agreements
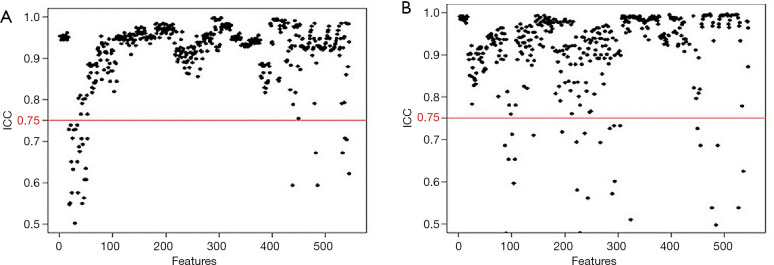
In the 152 patients without LNM and 182 patients with LNM, the rate of good inter-observer agreement (ICC ≥0.75, Figure 3A) for the 525 extracted features reached 94.4%, while 31 features had unsatisfactory agreement (ICC <0.75). The rate of good intra-observer agreement (ICC ≥0.75, Figure 3B) for the 527 extracted features reached 94.7%, while 29 features had unsatisfactory agreement (ICC <0.75). The 60 extracted features with inter- and/or intra-observer ICC of less than 0.75 were excluded. After this assessment, 496 features were selected from the 556 candidate features.
Figure 3.
Evaluation of feature stability with inter- and intra-observer agreements based on the interclass correlation coefficient (ICC). In the 152 patients without lymph node metastasis (LNM) and 182 patients with LNM, features had good inter-observer (A) and intra-observer (B) agreements with ICCs more than 0.75 (above the red cutoff line). After this assessment, 496 features were selected from the 556 features.
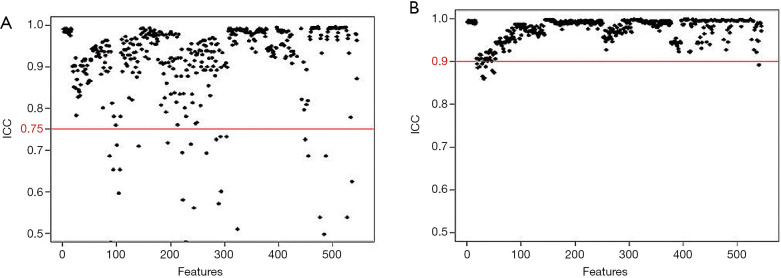
Of the ICC analysis of 182 patients with LNM, the 33 features with unsatisfactory intra- or inter-observer agreements (ICC <0.75) were excluded from the 352 extracted candidate features for discriminating patients with RLNM and NRLNM. Ultimately, 319 features with good intra- and inter-observer agreements (ICC ≥0.75) assessed by the two radiologists were selected (Figure 4A and B, respectively). Reader 1 completed the segmentation of all of the samples.
Figure 4.
Of the ICC analysis of 182 patients with lymph node metastasis (LNM), features had good inter-observer (A) and intra-observer (B) agreements with ICCs more than 0.75. After this assessment, 319 features were selected from the 352 features. ICC, intra-class correlation coefficient
Dimensionality reduction and feature selection
Regarding the 334 patients’ feature analysis for discriminating ESCC between LNM and LNM, none of these features satisfied the Gaussian distribution of homoscedasticity, so the 496 features were analyzed using Mann-Whitney U tests. The Mann-Whitney U tests showed that 386 features were significantly different among the 496 features (all P values <0.05), and a total of 386 features were used for LASSO analysis. As a result, 11 features were identified by LASSO for classifying patients with LNM, with the best tuned regularization parameter λ of 0.012 under the 1-standard error of the minimum criteria (the 1-SE criteria) found by 10-fold cross-validation (Figure 5A,B). These 11 features included 2 shape and size features, 2 intensity histogram, and 7 texture features. The selected features are shown in Table 3.
Figure 5.
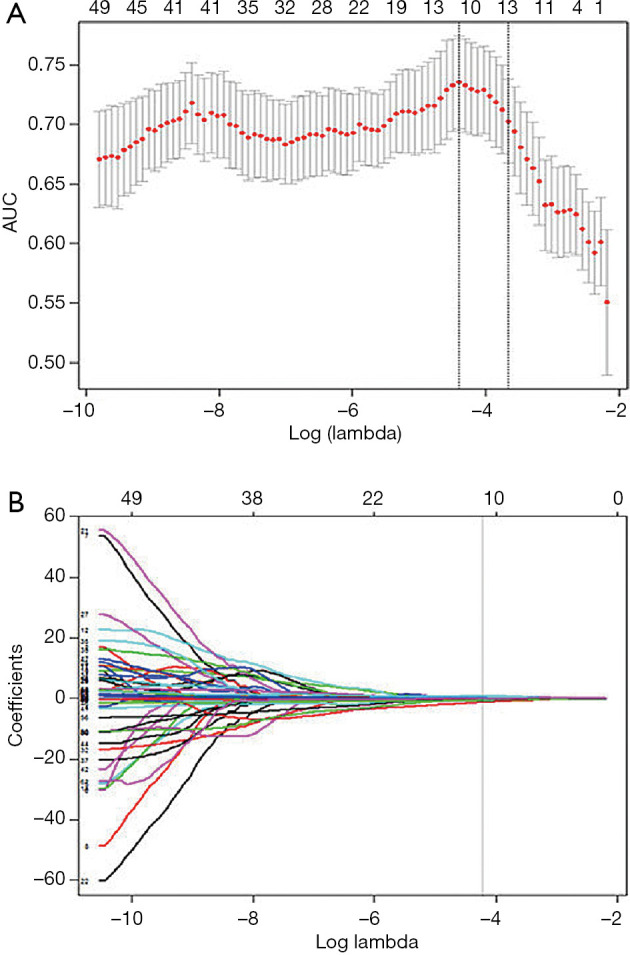
The least absolute shrinkage and selection operator (LASSO) binary logistic regression model used to select radiomics features. (A) Tuning parameter (λ) selection in the LASSO model used 10-fold cross-validation via minimum criteria. The area under the receiver operating characteristic curve (AUC) is plotted versus log(λ). Dotted vertical lines are drawn at the optimal values by using the minimum criteria and the 1 standard error of the minimum criteria (the 1-SE criteria). (B) LASSO coefficient profiles of the 386 radiomics features. A coefficient profile plot was produced against the log(λ) sequence. As a result, 11 non-zero coefficients were chosen.
Table 3. Selected radiomics features with descriptions.
| Feature category | Features of ESCC without LNM vs. with LNM | Features of ESCC with RLNM vs. NRLNM |
|---|---|---|
| GLCM | AutoCorrelation | X0Correlation |
| Correlation | X135Dissimilarity | |
| Entropy | X0InverseVariance | |
| X45InverseVariance | X45InverseVariance | |
| X135InverseVariance | X135InverseVariance | |
| X135MaxProbability | – | |
| Intensity histogram | Kurtosis | InterQuartileRange |
| Skewness | PercentileArea | |
| – | Quartile | |
| – | Range | |
| Shape | Compactness1 | Compactness2 |
| Convex | Max3Ddiameter | |
| Volume | MeaBreadth | |
| – | SurfaceArea |
ESCC, esophageal squamous cell carcinoma; LNM, lymph node metastasis; RLNM, regional lymph node metastasis; NRLNM, non-regional lymph node metastasis; GLCM, gray level co-occurrence matrix.
Regarding the 182 patients’ feature analysis with LNM for discriminating ESCC with RLNM and NRLNM, 9 features showed a Gaussian distribution with homoscedasticity, while the remaining 310 features did not among the 319 features with good inter- and intra-observer agreements. Of the 9 features, 7 features were significant based on independent samples t tests (all P values <0.05), whereas the remaining 2 features were not (all P values >0.05). Among the 310 features without a Gaussian distribution with homoscedasticity, the Mann-Whitney U tests showed that 272 features were significantly different (all P values <0.05), while the remaining 28 features were not (all P values >0.05). Therefore, 279 features with statistical significance were used for LASSO analysis (Figure 6A,B). As a result, 13 features were identified by LASSO for discrimination between RLNM and NRLNM patients. These features included 4 shape and size features, 4 intensity histogram, and 5 texture features. The details are shown in Table 3.
Figure 6.
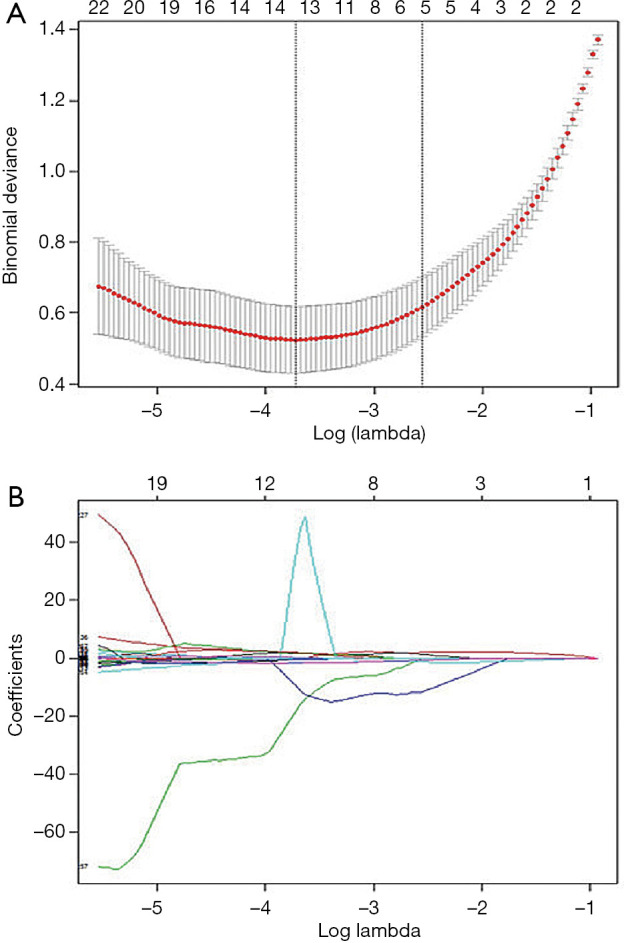
Feature selection using least absolute shrinkage and selection operator (LASSO) algorithm. (A) Tuning parameter (λ) selection in the LASSO model used 10-fold cross-validation via minimum criteria. The binomial deviance is plotted versus log(λ). Dotted vertical lines are drawn at the optimal values by using the minimum criteria and the 1-SE criteria. (B) LASSO coefficient profiles of the 279 radiomics features. A coefficient profile plot was produced against the log(λ) sequence. As a result, 13 non-zero coefficients were chosen.
Construction of the radiomics model
To identify patients with LNM, the radiomics model was constructed using those mentioned above 11 selected features. Good performance of the radiomics model was obtained based on the multivariable logistic regression. The AUCs of the radiomics model for the training and validation cohorts were 0.79 [95% confidence interval (CI), 0.71–0.86] and 0.75 (95% CI, 0.64–0.86), respectively (Figure 7A,B, and Table 4).
Figure 7.
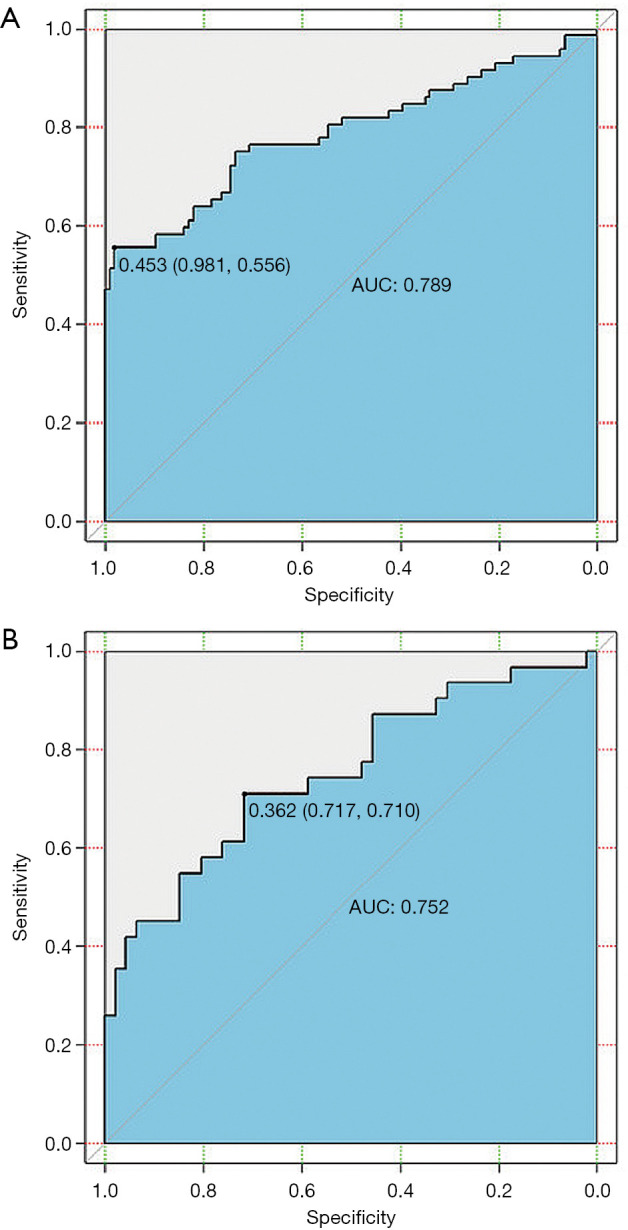
The receiver operating characteristic (ROC) curves of the multivariable logistic regression model for the prediction of lymph node metastasis (LNM) in esophageal squamous cell carcinoma (ESCC) in the training cohort (A) and the validation cohort (B). Notes: Values outside parentheses represent cut-off values; and the first and second values in parentheses indicate sensitivity and specificity, respectively. AUC indicates area under the receiver operating characteristic curve.
Table 4. The performance of radiomics models built using multivariable logistic regression for the training and validation cohorts.
| Cohorts to differentiate | AUC (95% CI) | Accuracy | Sensitivity | Specificity |
|---|---|---|---|---|
| Patients without vs. with lymph node metastasis | ||||
| Training cohort | 0.79 (0.71–0.86) | 0.75 | 0.98 | 0.56 |
| Validation cohort | 0.75 (0.64–0.86) | 0.71 | 0.71 | 0.71 |
| Patients with regional lymph node metastasis vs. non-regional lymph node metastasis | ||||
| Training cohort | 0.98 (0.97–0.99) | 0.94 | 0.97 | 0.91 |
| Validation cohort | 0.95 (0.89–0.98) | 0.83 | 0.81 | 0.86 |
AUC, area under the receiver operating characteristic curve.
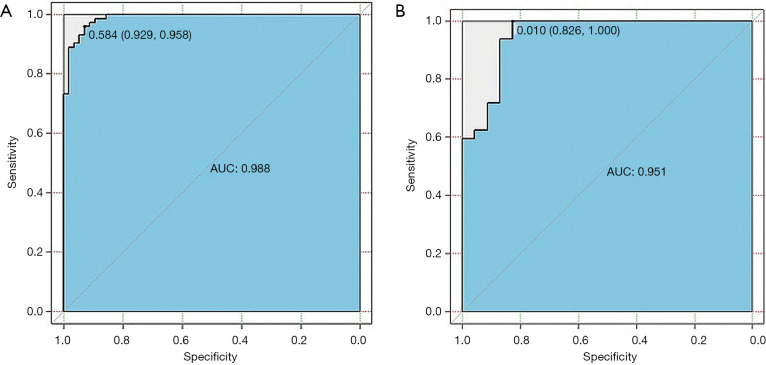
In patients with LNM, the multivariable logistic regression model was constructed using the selected 13 radiomics features for discriminating ESCC with RLNM and NRLNM. The model was able to effectively differentiate ESCC with RLNM and NRLNM, and the AUCs of the radiomics model for the training cohort and the validation cohort were 0.98 (95% CI, 0.97–0.99) and 0.95 (95% CI, 0.89–0.98), respectively (Figure 8A,B, and Table 4).
Figure 8.
The receiver operating characteristic (ROC) curves of the multivariable logistic regression model for the discrimination of patients with regional lymph node metastasis (RLMN) and with non-regional lymph node metastasis (NRLNM) in the training cohort (A) and the validation cohort (B). Values outside parentheses represent cut-off values; and the first and second values in parentheses indicate sensitivity and specificity, respectively. AUC indicates area under the receiver operating characteristic curve.
Discussion
LNM is an important independent predictor for the risk of developing systemic disease, and long-term survival in ESCC (23,24). Lymphadenectomy plays a key role in the treatment of this tumor (25). However, once patients with NRLNM are regarded as having incurable disease, they cannot undergo lymphadenectomy, and must instead undergo conservative treatment. Therefore, the status of lymph nodes is closely related to the choice of treatment. As a non-invasive imaging modality, CT is widely used in diagnosing, treatment planning, or monitoring cancer in routine clinical practice. In this study, we investigated the possibility of CT radiomics features of ESCC to predict LNM, and further explored the CT radiomics features for discriminating RLNM from NRLNM in patients with ESCC.
Our study showed the feasibility of the CT radiomics model for predicting lymph node status in ESCC patients. We extracted quantitative image features of tumors using contrast-enhanced CT. The LASSO method was employed to reduce dimensionality. A total of 11 potential radiomics features, including 2 shape and size features, 2 intensity histogram features, and 7 texture features, were selected from the 556 candidate features based on the contrast-enhanced CT data to build the CT radiomics model to predict LNM in ESCC. Subsequently, 13 potential radiomics features including 4 shape and size features, 4 intensity histogram features, and 5 texture features were selected from the 352 candidate features to build the CT radiomics model for discriminating between ESCC with RLNM or NRLNM. These features had a proper ratio for building the models that could avoid overfitting. Features of shape and size described the external outline of the tumor. The greater volume and larger convex shape indicated more tumor invasions, and increased the possibility of LNM, as also seen in previous studies (26,27). Texture features mainly reflect the texture complexity of tumors, which is closely related to the heterogeneity and prognosis of tumors (7). The present study showed that stable prediction models based on the CT radiomics features have a similar AUC value for distinguishing ESCC with LNM or without LNM, and discriminating ESCC with NRLNM or RLNM in the training cohort and validation cohort.
Our study provided a new CT radiomics model to predict LNM, and a superior radiomics model to discriminate RLNM from NRLNM in patients with ESCC compared to other published studies (13,14). Tan et al. (13) and Shen et al. (14) developed radiomics nomograms for the preoperative diagnosis of ESCC with LNM, and obtained AUCs of 0.75 and 0.80 in the training cohort, and 0.77 and 0.77 in the validation cohort, respectively. Of our analysis of 334 patients with and without LNM, we proposed a multivariable logistic regression model showing predictive performance with AUCs of 0.79 and 0.75 in the training and validation cohorts, respectively. Our results are slightly better than those of Tan et al. (13), and similar to Shen et al. (14). Also, for our analysis of the 182 patients with LNM, the radiomics model performed well in discriminating between RLNM and NRLNM with an AUC of 0.98 in the training cohort and demonstrated similar discrimination with an AUC of 0.95 in the validation cohort. Therefore, our study is the first to develop a predictive model of CT radiomics features for discriminating RLNM from NRLNM in patients with ESCC.
Our study had several limitations. First, radiomics has recently been reported to detect different gene expressions (28,29). It is therefore, necessary to conduct future studies on radiogenomic analyses. Second, this was a single-center study and lacked multicenter verification. Third, given the popularity of deep learning methods (30), it would be useful to provide even a qualitative comparison between our proposed method and the reported deep learning approach, which we did not perform here. We will, therefore conduct the relevant studies in the future.
Conclusions
Our study showed that CT radiomics models have the potential to predict LNM in ESCC patients, as well as discriminate between patients with RLNM and NRLNM. We hope that CT radiomics models can be applied clinically to assess lymph node status for ESCC patients before treatment.
Acknowledgments
Funding: This work was supported by the National Natural Science Foundation of China (grant No. 81571645), the Sichuan Province Special Project for Youth Team of Science and Technology Innovation (grant No. 2015TD0029), and the Construction Plan for Scientific Research Team of Sichuan Provincial Colleges and Universities (grant No. 15TD0023).
Ethical Statement: Ethical approval was obtained from the Affiliated Hospital of North Sichuan Medical College for this study [No.: 2020ER(A)008]. All participants provided written informed consent before our study.
Open Access Statement: This is an Open Access article distributed in accordance with the Creative Commons Attribution-NonCommercial-NoDerivs 4.0 International License (CC BY-NC-ND 4.0), which permits the non-commercial replication and distribution of the article with the strict proviso that no changes or edits are made and the original work is properly cited (including links to both the formal publication through the relevant DOI and the license). See: https://creativecommons.org/licenses/by-nc-nd/4.0/.
Footnotes
Conflicts of Interest: All authors have completed the ICMJE uniform disclosure form (available at http://dx.doi.org/10.21037/qims-20-241). The authors have no conflicts of interest to declare.
References
- 1.Ferlay J, Soerjomataram I, Dikshit R, Eser S, Mathers C, Rebelo M, Parkin DM, Forman D, Bray F. Cancer incidence and mortality worldwide: sources, methods and major patterns in GLOBOCAN 2012. Int J Cancer 2015;136:E359-86. 10.1002/ijc.29210 [DOI] [PubMed] [Google Scholar]
- 2.Torre LA, Bray F, Siegel RL, Ferlay J, Lortet-Tieulent J, Jemal A. Global cancer statistics, 2012. CA Cancer J Clin 2015;65:87-108. 10.3322/caac.21262 [DOI] [PubMed] [Google Scholar]
- 3.Rice TW, Ishwaran H, Hofstetter WL, Schipper PH, Kesler KA, Law S, Lerut EM, Denlinger CE, Salo JA, Scott WJ, Watson TJ, Allen MS, Chen LQ, Rusch VW, Cerfolio RJ, Luketich JD, Duranceau A, Darling GE, Pera M, Apperson-Hansen C, Blackstone EH. Esophageal Cancer: Associations With (pN+) Lymph Node Metastases. Ann Surg 2017;265:122-9. 10.1097/SLA.0000000000001594 [DOI] [PMC free article] [PubMed] [Google Scholar]
- 4.Edge SB, Byrd DR, Compton CC. AJCC Cancer Staging Manual, 7th. New York: Springer, 2010. [Google Scholar]
- 5.Blum MA, Taketa T, Sudo K, Wadhwa R, Skinner HD, Ajani JA. Chemoradiation for esophageal cancer. Thorac Surg Clin 2013;23:551-8. 10.1016/j.thorsurg.2013.07.006 [DOI] [PubMed] [Google Scholar]
- 6.Liu J, Wang Z, Shao H, Qu D, Liu J, Yao L. Improving CT detection sensitivity for nodal metastases in oesophageal cancer with combination of smaller size and lymph node axial ratio. Eur Radiol 2018;28:188-95. 10.1007/s00330-017-4935-4 [DOI] [PubMed] [Google Scholar]
- 7.Ng F, Ganeshan B, Kozarski R, Miles KA, Goh V. Assessment of primary colorectal cancer heterogeneity by using whole-tumor texture analysis: contrast-enhanced CT texture as a biomarker of 5-year survival. Radiology 2013;266:177-84. 10.1148/radiol.12120254 [DOI] [PubMed] [Google Scholar]
- 8.Ganeshan B, Goh V, Mandeville HC, Ng QS, Hoskin PJ, Miles KA. Non-small cell lung cancer: histopathologic correlates for texture parameters at CT. Radiology 2013;266:326-36. 10.1148/radiol.12112428 [DOI] [PubMed] [Google Scholar]
- 9.Shi L, Zhou XL, Sun JJ, Huang JH, Wang X, Li K, Pang PP, Xu YJ, Chen M, Zhang MM. Whole-tumor perfusion CT using texture analysis in unresectable stage IIIA/B non-small cell lung cancer treated with recombinant human endostatin. Quant Imaging Med Surg 2019;9:968-75. 10.21037/qims.2019.06.05 [DOI] [PMC free article] [PubMed] [Google Scholar]
- 10.Lambin P, Rios-Velazquez E, Leijenaar R, Carvalho S, van Stiphout RG, Granton P, Zegers CM, Gillies R, Boellard R, Dekker A, Aerts HJ. Radiomics: extracting more information from medical images using advanced feature analysis. Eur J Cancer 2012;48:441-6. 10.1016/j.ejca.2011.11.036 [DOI] [PMC free article] [PubMed] [Google Scholar]
- 11.Gillies RJ, Kinahan PE, Hricak H. Radiomics: images are more than pictures, they are data. Radiology 2016;278:563-77. 10.1148/radiol.2015151169 [DOI] [PMC free article] [PubMed] [Google Scholar]
- 12.Yip SS, Aerts HJ. Applications and limitations of radiomics. Phys Med Biol 2016;61:R150-66. 10.1088/0031-9155/61/13/R150 [DOI] [PMC free article] [PubMed] [Google Scholar]
- 13.Tan X, Ma Z, Yan LF, Ye WT, Liu ZY, Liang CH. Radiomics nomogram outperforms size criteria in discriminating lymph node metastasis in resectable esophageal squamous cell carcinoma. Eur Radiol 2019;29:392-400. 10.1007/s00330-018-5581-1 [DOI] [PubMed] [Google Scholar]
- 14.Shen C, Liu Z, Wang Z, Guo J, Zhang H, Wang Y, Qin J, Li H, Fang M, Tang Z, Li Y, Qu J, Tian J., Building CT. Radiomics Based Nomogram for Preoperative Esophageal Cancer Patients Lymph Node Metastasis Prediction. Transl Oncol 2018;11:815-24. 10.1016/j.tranon.2018.04.005 [DOI] [PMC free article] [PubMed] [Google Scholar]
- 15.Qu J, Shen C, Qin J, Wang Z, Liu Z, Guo J, Zhang H, Gao P, Bei T, Wang Y, Liu H, Kamel IR, Tian J, Li H. The MR radiomic signature can predict preoperative lymph node metastasis in patients with esophageal cancer. Eur Radiol 2019;29:906-14. 10.1007/s00330-018-5583-z [DOI] [PubMed] [Google Scholar]
- 16.Chen Y, Chen TW, Wu CQ, Lin Q, Hu R, Xie CL, Zuo HD, Wu JL, Mu QW, Fu QS, Yang GQ, Zhang XM. Radiomics model of contrast-enhanced computed tomography for predicting the recurrence of acute pancreatitis. Eur Radiol 2019;29:4408-17. 10.1007/s00330-018-5824-1 [DOI] [PubMed] [Google Scholar]
- 17.Zhang L, Fried DV, Fave XJ, Hunter LA, Yang J, Court LE. IBEX: an open infrastructure software platform to facilitate collaborative work in radiomics. Med Phys 2015;42:1341-53. 10.1118/1.4908210 [DOI] [PMC free article] [PubMed] [Google Scholar]
- 18.Moss AA, Schnyder P, Thoeni RF, Margulis AR. Esophageal carcinoma: pretherapy staging by computed tomography. AJR Am J Roentgenol 1981;136:1051-6. 10.2214/ajr.136.6.1051 [DOI] [PubMed] [Google Scholar]
- 19.Thibault G, Fertil B, Navarro C. Shape and texture indexes application to cell nuclei classification. Int J Pattern Recognition Artificial Intel 2013;27:1357002 10.1142/S0218001413570024 [DOI] [Google Scholar]
- 20.Amadasun M, King R. Textural features corresponding to textural properties. IEEE Transactions on Systems Man & Cybernetics 1989;9:1264-74. 10.1109/21.44046 [DOI] [Google Scholar]
- 21.Shrout PE, Fleiss JL. Intraclass correlations: uses in assessing rater reliability. Psychol Bull 1979;86:420-8. 10.1037/0033-2909.86.2.420 [DOI] [PubMed] [Google Scholar]
- 22.Tibshirani R. Regression shrinkage and selection via the Lasso: a retrospective. J R Stat Soc Series B Stat Methodology 2011;73:273-82. 10.1111/j.1467-9868.2011.00771.x [DOI] [Google Scholar]
- 23.Twine CP, Lewis WG, Morgan MA, Chan D, Clark GW, Havard T, Crosby TD, Roberts SA, Williams GT. The assessment of prognosis of surgically resected oesophageal cancer is dependent on the number of lymph nodes examined pathologically. Histopathology 2009;55:46-52. 10.1111/j.1365-2559.2009.03332.x [DOI] [PubMed] [Google Scholar]
- 24.DeMeester SR. Adenocarcinoma of the esophagus and cardia: a review of the disease and its treatment. Ann Surg Oncol 2006;13:12-30. 10.1245/ASO.2005.12.025 [DOI] [PubMed] [Google Scholar]
- 25.Jemal A, Siegel R, Xu J, Ward E. Cancer statistics, 2010. CA Cancer J Clin 2010;60:277-300. 10.3322/caac.20073 [DOI] [PubMed] [Google Scholar]
- 26.Li H, Chen TW, Li ZL, Zhang XM, Chen XL, Wang LY, Zhou L, Li R, Li CP, Huang XH. Tumor size of resectable oesophageal squamous cell carcinoma measured with multidetector computed tomography for predicting regional lymph node metastasis and N stage. Eur Radiol 2012;22:2487-93. 10.1007/s00330-012-2512-4 [DOI] [PubMed] [Google Scholar]
- 27.Ren X, Zhao Z, Huang W, Liu H, Dong C, Li Y. Analysis of the characteristics and factors influencing lymph node metastasis in thoracic esophageal carcinoma and cancer of the gastric cardia. Hepatogastroenterology 2015;62:73-6. [PubMed] [Google Scholar]
- 28.Panth KM, Leijenaar RT, Carvalho S, Lieuwes NG, Yaromina A, Dubois L, Lambin P. Is there a causal relationship between genetic changes and radiomics-based image features? An in vivo preclinical experiment with doxycycline inducible GADD34 tumor cells. Radiother Oncol 2015;116:462-6. 10.1016/j.radonc.2015.06.013 [DOI] [PubMed] [Google Scholar]
- 29.Rios Velazquez E, Parmar C, Liu Y, Coroller TP, Cruz G, Stringfield O, Ye Z, Makrigiorgos M, Fennessy F, Mak RH, Gillies R, Quackenbush J, Aerts HJWL. Somatic mutations drive distinct imaging phenotypes in lung cancer. Cancer Res 2017;77:3922-30. 10.1158/0008-5472.CAN-17-0122 [DOI] [PMC free article] [PubMed] [Google Scholar]
- 30.Li W, Li YF, Qin WJ, Liang XK, Xu JY, Xiong J, Xie YQ. Magnetic resonance image (MRI) synthesis from brain computed tomography (CT) images based on deep learning methods for magnetic resonance (MR)-guided radiotherapy. Quant Imaging Med Surg 2020;10:1223-36. 10.21037/qims-19-885 [DOI] [PMC free article] [PubMed] [Google Scholar]


