

Abstract
MicroRNA let‐7b is a potent tumor suppressor and targets crucial oncogenes. Previous studies have shown that let‐7b expression is suppressed in ovarian cancer; however, the regulatory mechanisms of let‐7b in ovarian cancer are still not well defined. The cellular role and targets of let‐7b in ovarian cancer remain elusive. In the present study, we showed that histone demethylase, KDM2B, directly suppressed let‐7b expression by H3K36me2 demethylation. Moreover, let‐7b inhibited EZH2 expression in ovarian cancer cells. Based on these results we know that let‐7b antagonizes the enhancement of EZH2 expression caused by KDM2B overexpression, and its expression is negatively correlated with KDM2B and EZH2 expression. More importantly, proliferation, migration, and wound healing assays showed that let‐7b inhibited ovarian cancer cell proliferation and migration in vitro. Additionally, let‐7b overexpression neutralized KDM2B‐promoted cell proliferation and migration. Furthermore, downregulation of let‐7b increased the xenografted tumor volumes in nude mice that were transplanted with KDM2B‐silenced cells. EZH2 silencing reversed the tumor growth enhancement mediated by inhibition of let‐7b. Last, we show that let‐7b expression is suppressed in ovarian carcinomas and its expression is negatively associated with the clinicopathological features of ovarian cancer, including histological type, histological grade, International Federation of Gynecology and Obstetrics (FIGO) stage, and lymph node metastatic status. In conclusion, in ovarian cancer, let‐7b expression is epigenetically suppressed by high expression of KDM2B. The loss of let‐7b upregulates the expression of EZH2, which promotes ovarian cancer growth in vitro and in vivo.
Keywords: EZH2, KDM2B, let‐7b, microRNAs, ovarian cancer
In ovarian cancer, let‐7b expression is epigenetically suppressed by the high expression of KDM2B. The loss of let‐7b upregulates the expression of EZH2, which promotes ovarian cancer growth in vitro and in vivo.
Abbreviations
- EZH2
enhancer of zeste homolog 2
- H3K36me2
dimethylation of H3 lysine 36
- H3K4me3
trimethylation of H3 lysine 4
- KDM2B
lysine‐specific demethylase 2B
1. INTRODUCTION
The 5‐year survival rate of ovarian cancer patients in 2008 according to the Surveillance, Epidemiology, and End Results (SEER) Program was less than 50% 1 and the number of deaths worldwide due to ovarian cancer was approximately 152 000. 2 Although new therapeutic measures have continually been introduced into practice over the past decades, the long‐term survival rate of ovarian cancer patients has not improved greatly. 1 Identifying the novel molecular mechanisms governing ovarian cancer progression as a means to provide more precise treatment to patients and prolong their survival time is of great importance.
MicroRNAs (miRNAs) are 18‐24‐long nucleotide regulatory RNA molecules. miRNAs prevent their target genes from translating or degrading the target mRNAs by specifically binding to the mRNA 3′‐UTR by complete or partial matching of its reverse complementary sequences. 3 Studies have shown that certain miRNAs are critical players in ovarian tumorigenesis and therapy resistance. 4 Members of the let‐7 family, including let‐7a, 5 let‐7e, 6 and let‐7f, 7 are suppressed in ovarian cancer. Low let‐7g tissue levels are also significantly associated with acquired chemoresistance in patients with late‐stage epithelial ovarian cancer. 8 Among the let‐7 members, the role of let‐7b in ovarian cancer has not been uniform or consistent among studies. 3 , 4 , 9 A couple of studies showed that the expression of let‐7b was significantly lower in patients with epithelial ovarian cancer (a subtype of ovarian cancer accounting for 85% of cancer cases) than in healthy individuals 3 or in patients with ovarian epithelial benign tumors. 10 The lower expression of let‐7b is significantly correlated with decreased progression‐free survival and overall survival. 3 Levels of let‐7b in the circulation or in ascites‐derived extracellular vesicles were also found to be significantly lower in ovarian cancer patients than in the healthy population. 11 , 12 In contrast, in a meta‐analysis of let‐7b levels, a high let‐7b level was found to be positively correlated with markers of invasiveness and a poorer prognosis in high‐grade serous ovarian cancer. 13 These contradictory results indicate the need for further study of let‐7b functions.
Let‐7b suppresses tumor progression by targeting essential oncogenes. In breast cancer, 14 endometrial carcinoma, 15 and gastric cancer 16 let‐7b represses tumor malignancy by targeting CDK6, HMGA2, and ING1, respectively. In ovarian cancer, more investigations are necessary to characterize the direct targets of let‐7b. Studies have shown that let‐7b inhibition increases the expression of HMGA2, 17 c‐Myc, Dicer, and Imp3 10 in ovarian cancer cells. Another study introduced let‐7b into ovarian cancer stem cells with ultrasound microbubbles, which resulted in significantly increased cell apoptosis and a decrease in the expression of CD133, a cancer stemness marker. 18 However, it is unknown whether CD133 is the direct target of let‐7b.
The mechanisms regulating let‐7b expression in ovarian cancer are also not well understood. Several studies have shown that long non‐coding RNA (lncRNA) HOST2 (human ovarian cancer‐specific transcript 2) sequesters let‐7b in ovarian cancer, 10 cervical cancer, 19 gliomas, 20 and breast cancer. 14 Another study demonstrated that the genomic loss of let‐7b locus is one of the reasons for the low expression of let‐7b in ovarian cancer. 21 However, it is not known whether let‐7b expression is epigenetically regulated in ovarian cancer cells.
Previously, KDM2B, a histone demethylase specific for the dimethylation of H3 lysine 36 (H3K36me2) 22 and trimethylation of H3 lysine 4 (H3K4me3), 23 was shown to bind to the genomic locus of let‐7b and demethylate H3K36me2 to suppress its expression in mouse embryonic fibroblasts. The reduced expression of let‐7b further increased the expression of EZH2, a methyltransferase specifically catalyzing H3K27me3, 24 and resulted in cell senescence. 25 The same regulatory pathway has been shown to operate in myeloid cells. 26 It is unclear whether this regulatory pathway exists and plays a role in ovarian cancer cells.
Our previous results have shown that a high expression of KDM2B is associated with poor prognosis in ovarian cancer patients and that silencing KDM2B expression in ovarian cancer cells decreases cell proliferation and migration. Interestingly, KDM2B also regulates the expression of EZH2 27 which promotes ovarian cancer growth and metastasis by suppressing p16. 28 However, the molecular mechanism of how KDM2B regulates EZH2 in ovarian cancer remains elusive. In this study, we show that KDM2B suppresses let‐7b epigenetically, and the low expression of let‐7b promotes ovarian cancer progression by targeting EZH2.
2. MATERIALS AND METHODS
2.1. Ovarian cancer specimens and patient information
Ovarian specimens were collected from patients who were hospitalized in The First Affiliated Hospital of Guangxi Medical University between March 2011 and April 2015. All patients signed informed consent forms. None of the enrolled patients received radiotherapy, chemotherapy, or any other treatment before surgery. The 20 normal ovarian specimens were collected from the patients who underwent adnexectomy due to uterine myoma or adenomyosis. The 33 ovarian benign tumors included 15 serous cystadenomas and 18 cases of mucous cystadenomas. The 21 cases of borderline tumors included 14 cases of serous cystadenomas and 7 cases of mucous cystadenomas. The ovarian carcinoma specimens included 70 epithelial ovarian tumors (42 serous adenocarcinomas, 20 mucous adenocarcinomas, 7 endometrioid carcinomas, and 1 squamous carcinoma) and 10 non‐epithelial ovarian tumors. The patients were 18‐83 years old at the time of diagnosis and had an average age of 48 years. All the diagnoses were determined by pathological examination of ovarian tissues and the stages were determined according to the International Federation of Gynecology and Obstetrics (FIGO) Guidelines. The study was approved by the Institutional Research Ethics Committee of Guanxi Medical University.
All of the specimens were collected within 30 minutes of surgical removal. A piece of tissue approximately 0.5 cm × 0.5 cm × 0.5 cm was immediately put in a vial with 2 mL RNA protection solution and kept at 4°C overnight. The next day, the RNA protection solution was discarded, and the specimens were stored at −80°C until use.
2.2. Antibodies, plasmids, and primers
Rabbit anti‐KDM2B (09‐864; Millipore), anti‐EZH2 (ab191250 and ab191080; Abcam), anti‐LaminB1 (ab16048; Abcam), and goat‐anti rabbit HRP (CST) antibodies were used for western blots or immunohistochemistry (IHC). H3K36me2 (ab9049; Abcam) and RNA pol II (ab193468; Abcam) antibodies were used in a ChIP assay. Real‐time PCR primers and oligos used for shRNA cloning are listed in Table 1. The oligos of hsa‐let‐7b‐5p‐inhibition(21257‐1)‐a and hsa‐let‐7b‐5p‐inhibition(21257‐1)‐b were used for cloning the let‐7b inhibitor sequence into the GV280 vector, and the oligos of hsa‐let‐7b(16144‐1)‐P1 and hsa‐let‐7b(16144‐1)‐P2 were used for cloning the let‐7b mimic sequence into the GV369 vector. Primers of KDM2B(21416‐11)‐P1 and KDM2B(21416‐11)‐P2 were used to amplify KDM2B coding sequences, and the 4062bp PCR product was cloned into the Age I/Age I site of GV358 vector. The sequences of shKDM2B, shEZH2, and shNC are as follows: TTCTTCAAACGCTGTGGAA, GAAATCTTAAACCAAGAAT, and TTCTCCGAACGTGTCACGT, respectively.
Table 1.
Primers used in the present study
| Primer ID | Sequence | Purpose |
|---|---|---|
| KDM2B‐F | CTCACTGCTGTTGGCACCAC | KDM2B real‐time PCR |
| KDM2B‐R | TGCTTGCAGTACCTCAGGTCAATA | |
| EZH2‐F | TTGTTGGCGGAAGCGTGTAAAATC | EZH2 real‐time PCR |
| EZH2‐R | TCCCTAGTCCCGCGCAATGAGC | |
| β‐actin‐F | GCCAACACAGTGCTGTCTGG | β‐actin real‐time PCR |
| β‐actin ‐R | GCTCAGGAGGAGCAATGATCTTG | |
| Let‐7b‐F | CCTGCCCAGCCCTCCTGCTC | Let‐7B ChIP real‐time PCR |
| Let‐7b‐R | GCACCAGCCCCTGCCTGGCG | |
| hsa‐let‐7b‐5p‐inhibition(21257‐1)‐a | AATTCAAAAATGAGGTAGTAGGTTGTGTGGTT | Let‐7b inhibitor cloning |
| hsa‐let‐7b‐5p‐inhibition(21257‐1)‐b | CcggAACCACACAACCTACTACCTCATTTTTg | |
| hsa‐let‐7b(16144‐1)‐P1 | GAGGATCCCCGGGTACCGGCTCCTGCTCTGGTGACTGAGGAC | Let‐7b mimics cloning |
| hsa‐let‐7b(16144‐1)‐P2 | CACACATTCCACAGGCTAGCCCTGCAGGTCACTGAGGTG | |
| KDM2B(21416‐11)‐P1 | GAGGATCCCCGGGTACCGGTCGCCACCATGGCGGGTCCGCAAATGGGGGGATCTGCAG | KDM2B coding sequence cloning |
| KDM2B(21416‐11)‐P2 | TCCTTGTAGTCCATACCACTCAGTTTTTGCAGGAGTTTTTCTTCTAC |
2.3. Immunohistochemistry
The ovarian specimens were fixed in formalin and embedded in paraffin. Following deparaffinization with xylene and rehydration with graded ethanol solutions, the tissue sections were boiled in 10 mM sodium citrate buffer (pH 6.0) for 5 minutes for antigen retrieval. 3% H2O2 was used next to inactivate endogenous peroxidase. The sections were then blocked with 5% goat serum and blotted with the corresponding primary antibodies and secondary antibodies. Streptavidin‐biotin complexes and diaminobenzidine (DAB) were used for color development and counterstaining was done with hematoxylin. The staining signals were scored.
2.4. Cell culture and lentiviral transduction
The ovarian cancer cell lines, A2780, SKOV3, and CAOV3 were obtained from the China Center for Type Culture Collection (CCTCC, Wuhan, China). The cells were propagated in RPMI‐1640 medium (Hyclone, USA) containing 10% FBS (Thermo Fisher Scientific, USA) and maintained at 37°C under a humidified atmosphere containing 5% CO2.
Lentiviral particles were packaged in 293T cells using the standard protocol (ref.). On the day of transduction, the viruses (MOI for A2780 cells = 20; MOI for SKOV3 cells = 80) were diluted in 100 µL infection enhancement solution (GENE Company, Shang Hai, China) and added to the cells. 72 hours later the cells were collected for analysis or screened with puromycin for 3‐5 days.
2.5. RNA extraction and real‐time PCR
To extract RNAs from ovarian samples, one‐third of the samples were cut and homogenized in 1 mL TRIzol (Invitrogen) immediately after removing from −80°C storage. To extract RNAs from cultured cells, the cells were washed twice with cold PBS and lysed with 1 mL TRIzol on ice for 5 minutes. RNAs were then extracted following the manufacturer’s protocol. The RNA samples were quantified with a UV spectrophotometer and examined by electrophoresis.
Genomic DNAs in the RNA samples were removed and cDNAs were synthesized using an RNA Reverse Transcription Kit from Takara. Real‐time PCRs were carried out using SYBR Green Real‐time PCR Master Mix (Roche) on an ABI 7300 real‐time PCR machine. The real‐time PCR primers used in the study are listed in Table 1. The reaction mixtures were denatured at 95°C for 10 minutes, followed by 40 cycles of 95°C for 15 seconds and 60°C for 30 seconds. The 2−ΔΔCt method was used to quantify gene expression.
2.6. Protein extraction and western blotting
After washing the cells twice with PBS, the cells were lysed with RIPA buffer containing phenylmethylsulfonyl fluoride. The cell debris was removed by centrifugation at 13 800 g for 10 minutes at 4°C. The protein in the supernatant was quantified using a BCA kit and 40 µg protein was run on a 10% SDS‐PAGE. After electrophoresis the proteins were transferred onto a PVDF membrane, the membrane was blocked with BSA and blotted with the corresponding primary and secondary antibodies. The membrane was next visualized with an ECL kit.
2.7. Cell proliferation analysis
Cells were trypsinized 48 hours after transfection and 3 × 10³ cells per well were seeded into five 96‐well plates. Every 48 hours, spent media was exchanged with 100 µL fresh growth medium. Every 24 hours, one plate was used for cell proliferation analysis using a CCK‐8 (Dojindo) kit. Each time point was done in quadruplicate. The growth curves were graphed based on the absorbance at A450. The experiment was repeated three times.
2.8. Transwell assay
Forty‐eight hours after transduction, the cells were trypsinized and collected by centrifugation. The cells were resuspended in FBS‐free medium at a density of 1 × 10⁶ cells/mL for the A2780 cells and 5 × 10⁵ cells/mL for the SKOV3 cells. RPMI 1640 medium containing 10% FBS (600 µL) was added into the lower chamber of the Transwell plate (Corning) and 100 µL resuspended cells were added to the upper chamber. The cells were incubated for 48 hours. After incubation, the lower layer of cells was scrubbed off the Transwell filter using a cotton swab and the cells were fixed in methanol for 30 minutes and stained with 0.5% crystal violet for 30 minutes. Five randomly selected fields were counted under a 200× microscope and the cell count numbers averaged. The experiment was repeated three times.
2.9. Wound healing assay
Forty‐eight hours after transduction, the cells were trypsinized and 2 × 10⁴ cells per well were seeded into a 96‐well plate and cultured for 24 hours. After confluency reached an estimated 80%, a 10 µL pipette tip was scraped across the cell layer to simulate a wound. After photographing the simulated wound, the cells were returned to a 37°C incubator. At 12, 24, and 48 hours of incubation, photographs of the simulated wounds were made. The wound healing rate was calculated using the following formula: R = (W 0 – Wt)/W 0 × 100%. W 0 represents the wound width at 0 time‐point, and Wt represents the wound width at the t time point. The experiment was repeated three times.
2.10. Xenografted tumor growth
Five‐week‐old female nude mice were injected s.c. with the corresponding ovarian cancer cells. Tumor volumes were measured every week for 4 weeks. After the tumor growth experiment was completed, the xenografted tumors were excised for western blotting and IHC analyses. The experiments were approved by the Animal Experimental Ethics Committee of Guangxi Medical University.
2.11. Statistical analysis
All data were analyzed using SPSS13.0 software and presented as mean ± standard deviation. ChIP assays and qRT‐PCR experiments were repeated at least three times and data are reported for one of the biological replicates. For comparisons between two independent groups, Student’s t test was used. For comparations among more than two groups, two‐way ANOVA with appropriate multiple comparison tests was used. The correlation between two quantitative data sets was accomplished using the Pearson method. Enumeration data were analyzed with chi‐squared analysis or Fisher’s exact test. Differences were considered statistically different if P < .05.
3. RESULTS
3.1. Low let‐7b expression is associated with poor prognosis of ovarian cancer
To explore the role of let‐7b in ovarian cancer, we examined the expression of let‐7b in ovarian cancer patients. Our results showed that normal ovarian specimens had the highest expression of let‐7b with a relative expression level of 7.86 ± 0.92 (Figure 1A). Expression of let‐7b decreased with an increase in ovarian cancer malignancy. The relative expression levels of let‐7b were 5.88 ± 0.92, 4.21 ± 1.07, and 2.69 ± 1.23, in the benign tumor, borderline tumor, and ovarian carcinoma specimens, respectively (Figure 1A).
Figure 1.
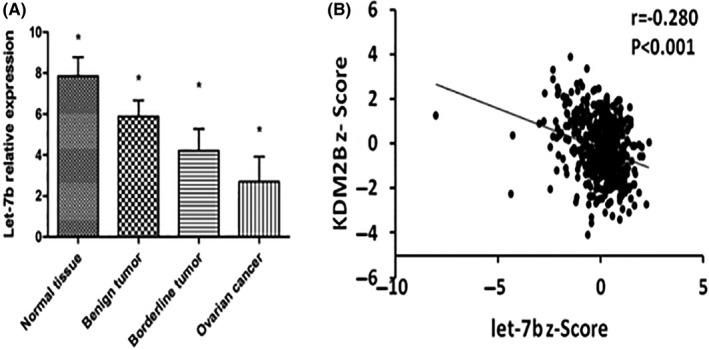
Expression of let‐7b in ovarian carcinoma and its association with KDM2B expression. A, Expression of let‐7b in the specimens of normal ovaries (n = 20), benign tumors (n = 33), borderline tumors (n = 21), and ovarian carcinomas (n = 80). B, Let‐7b expression is negatively associated with EZH2 expression in ovarian serous cystadenocarcinoma (n = 489, the expression data set is from The Cancer Genome Atlas). *P < .05
Furthermore, the expression of let‐7b was negatively associated with the clinicopathological features of ovarian cancer, including histological type, histological grade, FIGO stage, and lymph node metastatic status (Table 2). The expression levels of let‐7b were 1.99 ± 0.79 and 2.69 ± 0.54 in the epithelial and non‐epithelial carcinomas, respectively, and 2.32 ± 0.52 and 1.57 ± 0.18 in the highly differentiated G1/G2 and lowly differentiated G3 ovarian carcinomas, respectively. The expression of let‐7b was significantly lower in stage III/IV patients than in stage I/II patients (0.88 ± 0.69 vs 2.44 ± 0.50, P = .034). Moreover, the patients with lymph node metastasis expressed much lower levels of let‐7b than the patients without lymph node metastasis (1.31 ± 0.31 vs 2.28 ± 0.32, P = .02) (Table 2). As studies in other models have suggested that several miRs, including let‐7b, are regulated by KDM2B, 29 , 30 we analyzed the relationship of KDM2B and let‐7b in ovarian cancer specimens. Let‐7b expression was significantly inversely correlated with KDM2B expression in The Cancer Genome Atlas (TCGA) ovarian cancer specimens (r = −0.28, P < .001) (Figure 1B), indicating that KDM2B might regulate the expression of let‐7b in ovarian cancer cells.
Table 2.
Association of miRNA let‐7b expression with the clinicopathological features of ovarian cancer patients
| Clinicopathological features | Let‐7b relative expression | |||||
|---|---|---|---|---|---|---|
| Sample number | Mean | Standard deviation | t | P | ||
| Age (y) | ||||||
| <48 | 38 | 2.17 | ±0.58 | 0.70 | .521 a | |
| ≥48 | 42 | 2.61 | ±1.12 | |||
| Histological types | ||||||
| Epithelial carcinoma | 70 | 1.99 | ±0.79 | 1.25 | .027 a | |
| Serous | 42 | 1.99 | ±0.68 | |||
| Mucinous | 20 | 2.38 | ±0.70 | |||
| Other types | 8 | 2.47 | ±0.48 | |||
| Non‐epithelial carcinoma | 10 | 2.69 | ±0.54 | |||
| Histological grade | ||||||
| G1/G2 (moderately/highly differentiated) | 41 | 2.32 | ±0.52 | 3.69 | .021 a | |
| G3 (poorly differentiated) | 39 | 1.57 | ±0.18 | |||
| FIGO stage | ||||||
| I/II stage | 42 | 2.44 | ±0.50 | 3.16 | .034 a | |
| III/VI stage | 38 | 0.88 | ±0.69 | |||
| Lymph node metastasis | ||||||
| No | 48 | 2.28 | ±0.32 | 3.74 | .020 a | |
| Yes | 32 | 1.31 | ±0.31 | |||
Abbreviation: FIGO, International Federation of Gynecology and Obstetrics.
Independent sample t test.
3.2. KDM2B inhibits let‐7b expression in ovarian cancer
We hypothesized that KDM2B promotes ovarian cancer progression by inhibiting let‐7b expression. Therefore, we examined the role of KDM2B in regulating let‐7b expression in ovarian cancer cells. As shown in Figure 2A,B, silencing KDM2B significantly reduced mRNA and protein levels of KDM2B in A2780 and SKOV3 cells. More importantly, the expression of let‐7b was elevated considerably in the shKDM2B cells (Figure 2C). On the contrary, overexpression of KDM2B significantly lowered let‐7b expression (Figure 2D‐F). ChIP assays subsequently confirmed that KDM2B binds the let‐7b loci (Figure 2G), consistent with the observed effects of KDM2B on the expression of let‐7b. We purified core histones from cells and analyzed the product by western blots using methylation state‐specific antibodies. Western blot analysis demonstrated that overexpression of KDM2B resulted in a marked decrease of H3K36me2 levels but did not alter the H3K4 levels (Figure 2H). Next, we immunoprecipitated the chromatin using H3K36me2 specific antibody. ChIP analysis results showed that overexpression of KDM2B decreased the H3K36 methylation at the let‐7b loci (Figure 2I).
Figure 2.
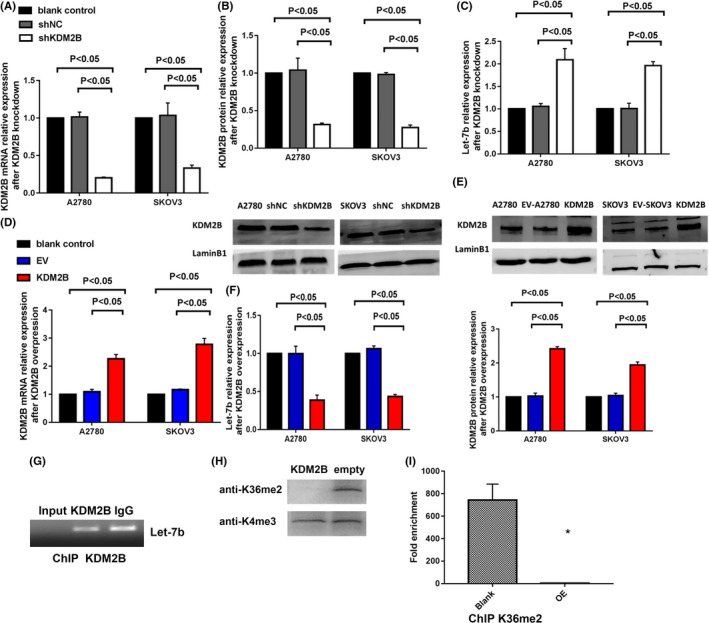
KDM2B suppresses the expression of microRNA let‐7b in ovarian cancer cells. A, Real‐time PCR shows that the shRNA of KDM2B (shKDM2B) decreases the relative levels of KDM2B mRNA compared to the blank control and negative control shRNA (shNC) in A2780 and SKOV3 cells (n = 3). B, KDM2B silencing decreases the levels of KDM2B protein in A2780 and SKOV3 cells. The bar chart displays the quantitative results of the western blots (the bottom panel). C, Let‐7b expression was elevated in A2780 and SKOV3 cells in which KDM2B expression was silenced (n = 3). D, Real‐time PCR shows that KDM2B overexpression increases the relative levels of KDM2B mRNA compared to the blank control and empty control (EC) in A2780 and SKOV3 cells (n = 3). E, KDM2B overexpression increases the levels of KDM2B protein in A2780 and SKOV3 cells. The bar chart displays the quantitative results of the western blots (the top panel). F, Let‐7b expression is suppressed in A2780 and SKOV3 cells in which KDM2B expression is elevated (n = 3). G, ChIP analysis of A2780 cells for the binding of endogenous KDM2B to the let‐7b loci. H, Acid extracted histones were prepared from A2780 cells stably overexpressing KDM2B and subjected to western blotting using the anti‐H3K36me2 or H3K4me3 antibodies. I, The ChIP assay provides proof that overexpression of KDM2B erased H3K36me2 at the let‐7b locus (n = 3)
3.3. Let‐7b inhibits EZH2 expression in ovarian cancer cells
Next, we investigated if let‐7b regulates EZH2 expression. Real‐time PCR showed that let‐7b inhibitors markedly reduced let‐7b expression and increased the mRNA expression of EZH2 in A2780 and SKOV3 cells (Figure 3A,B). Western blots confirmed that EZH2 expression was significantly increased after silencing let‐7b (Figure 3C). We have shown that KDM2B positively regulated EZH2 expression in ovarian cancer. 27 In this study, we found that EZH2 mRNA and protein were decreased by let‐7 mimics, but not by the NC mimics in A2780 and SKOV3 cells transfected with KDM2B‐expressing vectors (Figure 3D,E). To verify the KDM2B/let‐7b/EZH2 regulatory axis, we examined ovarian cancer specimens. In 62 ovarian carcinoma specimens from our hospital, the relative levels of let‐7b were negatively correlated with EZH2 expression (r = −0.697, P < .001) (Figure 3F). By interrogating the ovarian cancer data set of TCGA, 31 we also found that the levels of let‐7b were negatively correlated with EZH2 mRNA expression (r = −0.217, P < .001, n = 489) (Figure 3G). These results confirmed the KDM2B/let‐7b/EZH2 regulatory axis in ovarian carcinoma.
Figure 3.
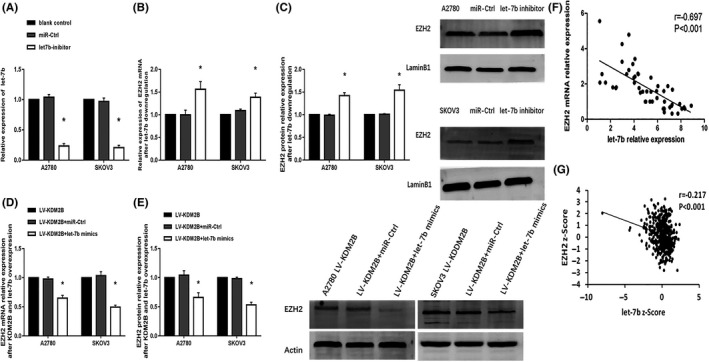
Let‐7b mediates the increase of EZH2 expression induced by KDM2B. A, Let‐7b inhibitors significantly decreased the let‐7b levels in A2780 and SKOV3 cells (n = 3). B, EZH2 mRNA levels were elevated in A2780 and SKOV3 cells after downregulating let‐7b (n = 3). C, EZH2 protein levels were elevated in A2780 and SKOV3 cells after downregulating let‐7b. The bar chart displays the quantitative results of the western blots (the right panel). D, Let‐7b overexpression (let‐7b mimics) decreased EZH2 mRNA levels in KDM2B‐overexpressing A2780 and SKOV3 cells compared with negative control microRNAs (mimic NC) (n = 3). E, Let‐7b overexpression (let‐7b mimics) decreased EZH2 protein levels in KDM2B‐overexpressing A2780 and SKOV3 cells. The bar chart displays the quantitative results of the western blots (the right panel). F‐G, Expression of let‐7b in ovarian carcinoma and its association with EZH2 expression. F, Real‐time PCR shows that let‐7b expression is negatively associated with EZH2 expression in 62 ovarian specimens. G, Let‐7b expression is negatively associated with EZH2 expression in ovarian serous cystadenocarcinoma (n = 489, the expression data set is from The Cancer Genome Atlas). *P < .05
3.4. Let‐7b inhibits ovarian cancer cell proliferation and migration in vitro
We next investigated the role of microRNA let‐7b in ovarian cancer. Our results showed that let‐7b inhibitors promoted cell proliferation (P < .05) (Figure 4A), but let‐7b mimics significantly slowed down A2780 and SKOV3 cell proliferation (P < .05) (Figure 4B). Furthermore, let‐7b inhibitors increased the migrated cell numbers in the Transwell analysis (Figure 4C), but the expression of let‐7b mimics significantly inhibited cell migration in A2780 and SKOV3 cells (Figure 4D).
Figure 4.
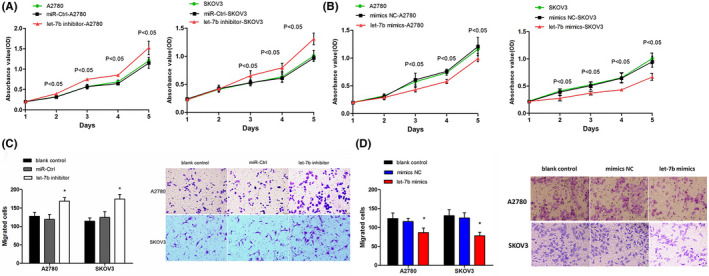
The role of let‐7b in ovarian cancer proliferation and migration. A, Inhibitionof let‐7b (let‐7b inhibitor) in A2780 (left) and SKOV3 (right) cells promotes cell growth compared with the control microRNAs (miR‐Ctrl) (n = 4). B, Let‐7b mimics inhibited A2780 (left) and SKOV3 (right) cell growth compared with the control microRNA mimics (mimics NC) (n = 4). C, Transwell migration assays demonstrate that let‐7b inhibitors promoted A2780 and SKOV3 cell migration. (magnification, ×200). Quantitative results (bar chart) (n = 3) and representative pictures (the right panel) are shown. D, Transwell migration assays demonstrate that let‐7b mimics inhibited A2780 and SKOV3 cell migration. Quantitative results (bar chart) (n = 3) and representative pictures (the right panel) are shown. (Magnification, ×200). *P < .05
3.5. Let‐7b expression antagonizes the promotion effects of cell proliferation and migration mediated by KDM2B in vitro
KDM2B was overexpressed in ovarian cancer cell lines, A2780, SKOV3, and CAOV3 for these experiments. As shown in Figure 5A‐D, the exogenous expression of KDM2B further promoted cancer cell proliferation, increased cell migration in the Transwell assay (Figure 5E), and enhanced cell movement in the wound healing assay (Figure 5F). However, expressing let‐7b mimics in KDM2B‐overexpressing cells significantly inhibited cell proliferation (Figure 6A), lowered the capability for cell migration (Figure 6B) and cell movement (Figure 6C). These results indicated that KDM2B promoted ovarian cancer malignancy through inhibiting let‐7b expression.
Figure 5.

KDM2B promotes ovarian cancer cell proliferation and migration. A, KDM2B mRNA levels in A2780, SKOV3,and CAOV3 cells transduced with control (LV‐CON) and KDM2B overexpression (LV‐KDM2B) lentiviruses (n = 3). B, Quantitative protein levels in A2780, SKOV3, and CAOV3 cells transduced with LV‐CON and LV‐KDM2B lentiviruses. C, Western blots of KDM2B of A2780, SKOV3 and CAOV3 cells transduced with LV‐CON and LV‐KDM2B lentiviruses. D, Overexpression of KDM2B promotes A2780 (left), SKOV3 (top right), and CAOV3(bottom right) cell proliferation (n = 4). E, Transwell migration assays show that KDM2B overexpression promotes the capability of cells to pass (migrate) through the membranes. Quantitative results (bar chart) (n = 3) and representative pictures (the right panel) are shown (magnification, ×200). F, Wound healing experiments showed that KDM2B overexpression in A2780, SKOV3 and CAOV3 cells promoted cell movement. Quantitative results (bar chart) (n = 3) and representative pictures (right panel) are shown. (magnification, ×100)
Figure 6.
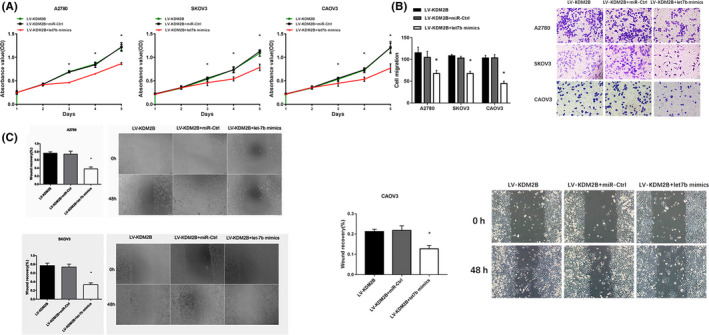
Let‐7b mediates the promotion effects on cell proliferation and migration induced by KDM2B overexpression. A, Let‐7b mimics inhibited cell proliferation in A2780 (left), SKOV3 (middle) and CAOV3 (right) cells overexpressing KDM2B (n = 4). B, Transwell migration assays showed that let‐7b mimics inhibits the capability of A2780, SKOV3 and CAOV3 cells overexpressing KDM2B to pass through the membranes. Quantitative results (bar chart) (n = 3) and representative pictures (the right panel) are shown. (magnification, ×200). C, Wound healing experiments showed that let‐7b mimics inhibited cell movement in A2780 (top left), SKOV3 (bottom left) and CAOV3 (right) cells overexpressing KDM2B. Quantitative results (bar chart) (n = 3) and representative pictures are shown (magnification, ×100). *P < .05
3.6. Xenografted tumors verify the role of the KDM2B/let‐7b/EZH2 axis in ovarian cancer in vivo
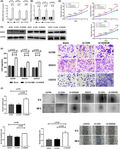
The role of the KDM2B/let‐7b/EZH2 axis was further evaluated using tumor xenografts in mice. 27 KDM2B silencing inhibited the growth of SKOV3 cells in nude mice, while decreasing KDM2B and let‐7b expression restored the xenografted tumor volumes (P < .05) (Figure 7A). Moreover, let‐7b inhibition accelerated xenografted tumor growth, but silencing EZH2 in let‐7b inhibitor‐overexpressing cells restored the tumor volumes (P < .05) (Figure 7A). Real‐time PCR on the xenografted tumors showed that silencing KDM2B enhanced let‐7b expression, but decreased EZH2 mRNA expression (Figure 7B). Western blots and immunohistochemistry on the xenografted tumor samples showed that EZH2 expression was decreased significantly at the protein level (Figure 7B,C). These results suggest that the high expression of KDM2B in ovarian cancer inhibits let‐7b expression, which further results in an increase of EZH2 expression that promotes cancer progression.
Figure 7.
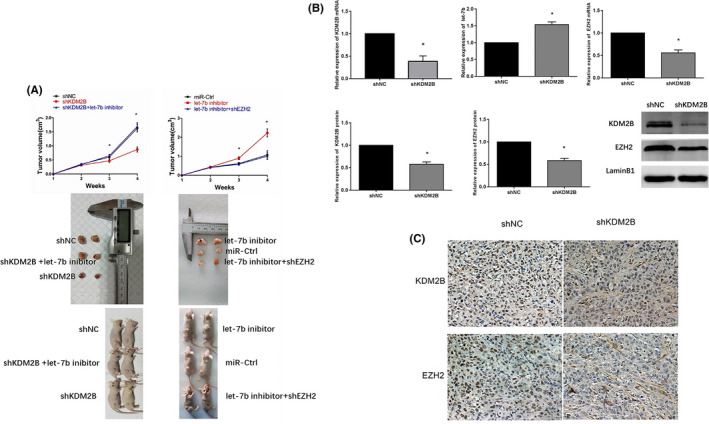
Xenografted tumors verified the role of the KDM2B/let‐7b/EZH2 axis in ovariancancer in vivo. A, Tumor volumes (top) (n = 5) and representative pictures (bottom) of xenografted tumors show that let‐7b inhibitors restored tumor growth in KDM2B silencing tumors in vivo and EZH2 silencing neutralized the tumor growth promotion effects induced by let‐7b inhibitors in vivo. B, Levels of KDM2B mRNA (top left, n = 3), let‐7b (top middle, n = 3), and EZH2 mRNA (top right, n = 3), and the quantitative results of KDM2B (bottom left) and EZH2 protein (bottom middle) levels, as well as the Western blot (bottom right), are shown after KDM2B silencing in SKOV3 cells. C, IHC results of KDM2B and EZH2 in xenografted shNC‐SKOV3 and shKDM2B‐SKOV3 tumors (magnification, ×400). *P < .05
4. DISCUSSION
Ovarian cancer is a prevalent gynecological malignancy with high mortality. Although pan‐cancer treatments have advanced greatly in the past few decades, the 5‐year survival of ovarian cancer patients has not improved greatly. 1 Therefore, it is of great importance to identify novel molecular mechanisms governing ovarian cancer progression so that recent progress related to targeted therapy can be applied to ovarian cancer. We have demonstrated in our previous study that both KDM2B and EZH2 are upregulated in ovarian cancer and promote ovarian cancer cell proliferation and migration. 27 , 28 Interestingly, KDM2B positively regulated EZH2 expression, as the reverse or silencing of KDM2B decreased EZH2 expression. 27 However, how KDM2B regulates EZH2 expression remains elusive. In this study, we have shown that microRNA let‐7b is the pivotal mediator of this regulatory network.
Our study elucidates the KDM2B/let‐7b/EZH2 regulatory pathway by providing several lines of evidence. First, we show that silencing KDM2B enhanced let‐7b expression while exogenously expressing KDM2B suppressed let‐7b expression (Figure 2A‐F). We also showed that let‐7b inhibitors increased EZH2 expression in ovarian cancer cells but let‐7b mimics suppressed EZH2 expression in KDM2B‐overexpressing cells (Figure 3A‐E). These observations clearly show that KDM2B suppresses let‐7b expression and that a reduction of let‐7b allows for EZH2 mRNA expression and an EZH2 upregulation. Although the KDM2B/let‐7b/EZH2 axis has been reported in primary mouse embryonic fibroblasts 25 and myeloid cells, 26 this regulatory pathway has not been previously investigated in ovarian cancer.
While one study claims that higher let‐7b expression is a favorable biomarker in ovarian cancer by meta‐analysis, 13 most studies agree with the tumor suppressor role of let‐7b in multiple tumors. Our study verified the tumor suppressor role of let‐7b in ovarian cancer patients (Figure 1A). We validated that the expression of let‐7b was negatively correlated with KDM2B and EZH2 expression by real‐time PCR in ovarian cancer carcinoma specimens (Figures 1B and 3F‐G), and low let‐7b expression was significantly associated with the poor prognosis in ovarian cancer (Table 2).
Besides the identification of the regulatory pathway, we thoroughly characterized the role of the KDM2B/let‐7b/EZH2 axis in the growth of ovarian cancer cells. We found that microRNA let‐7b was a key regulator of ovarian cancer proliferation and migration. Let‐7b inhibitors promoted ovarian cancer cell proliferation and migration, whereas let‐7b mimics suppressed cancer proliferation and migration in vitro (Figure 4A‐D). More importantly, our study demonstrated that let‐7b mediated cancer progression induced by KDM2B. Furthermore, we show that let‐7b mimics antagonize the progression effects of KDM2B on cell proliferation and migration in vitro (Figure 6A‐C) and that let‐7b inhibitors reversed the growth inhibition resulting from KDM2B silencing in the xenograft tumor model (Figure 7A). Last, and consistent with the KDM2B/let‐7b/EZH2 regulatory pathway, silencing EZH2 suppressed the growth of xenografted tumors in which let‐7b expression was inhibited (Figure 7B). Therefore, our results are the first to elucidate the essential role of the KDM2B/let‐7b/EZH2 regulatory pathway in ovarian cancer and identify let‐7b as a critical regulator of ovarian cancer.
The identification of the KDM2B/let‐7b/EZH2 regulatory pathway provides a novel way to target let‐7b in ovarian cancer. LncRNA HOST2 and genomic loss of let‐7b are the two reasons that lead to the low expression of let‐7b in ovarian cancer. 10 , 21 However, it would be difficult to target HOST2 using small molecules and to recover the copy number of the let‐7b genomic locus. In contrast, it would be easier to restore let‐7b expression in ovarian cancer by targeting KDM2B. Therefore, our study paves the way to target let‐7b in ovarian cancer.
DISCLOSURE
The authors have no conflicts of interest to declare.
ACKNOWLEDGMENTS
The study was supported by the National Natural Science Foundation of China (Project Approval No. 81360389 and 81960466) and Guangxi Natural Science Foundation of China (Project Approval No. 2018GXNSFAA050050).
Kuang Y, Xu H, Lu F, et al. Inhibition of microRNA let‐7b expression by KDM2B promotes cancer progression by targeting EZH2 in ovarian cancer. Cancer Sci. 2021;112:231–242. 10.1111/cas.14708
REFERENCES
- 1. Eisenhauer EA. Real‐world evidence in the treatment of ovarian cancer. Ann Oncol. 2017;28(Suppl. 8):viii61‐viii65. [DOI] [PubMed] [Google Scholar]
- 2. Narod S. Can advanced‐stage ovarian cancer be cured? Nat Rev Clin Oncol. 2016;13(4):255‐261. [DOI] [PubMed] [Google Scholar]
- 3. Nam EJ, Yoon H, Kim SW, et al. MicroRNA expression profiles in serous ovarian carcinoma. Clin Cancer Res. 2008;14(9):2690‐2695. [DOI] [PubMed] [Google Scholar]
- 4. Yu Z, Kim J, He L, et al. Functional analysis of miR‐34c as a putative tumor suppressor in high‐grade serous ovarian cancer1. Biol Reprod. 2014;91(5):1‐12. [DOI] [PMC free article] [PubMed] [Google Scholar]
- 5. Agostini A, Brunetti M, Davidson B, et al. Genomic imbalances are involved in miR‐30c and let‐7a deregulation in ovarian tumors: Implications for HMGA2 expression. Oncotarget. 2017;8(13):21554–21560. [DOI] [PMC free article] [PubMed] [Google Scholar]
- 6. Xiao M, Cai J, Cai L, et al. Let‐7e sensitizes epithelial ovarian cancer to cisplatin through repressing DNA double strand break repair. J Ovarian Res. 2017;10(1):24. [DOI] [PMC free article] [PubMed] [Google Scholar]
- 7. Zhang L, Volinia S, Bonome T, et al. Genomic and epigenetic alterations deregulate microRNA expression in human epithelial ovarian cancer. Proc Natl Acad Sci USA. 2008;105(19):7004–7013. [DOI] [PMC free article] [PubMed] [Google Scholar]
- 8. Biamonte F, Santamaria G, Sacco A, et al. MicroRNA let‐7g acts as tumor suppressor and predictive biomarker for chemoresistance in human epithelial ovarian cancer. Sci Rep. 2019;9(1):5668. [DOI] [PMC free article] [PubMed] [Google Scholar]
- 9. Zhao M, Sun J, Zhao Z. Synergetic regulatory networks mediated by oncogene‐driven microRNAs and transcription factors in serous ovarian cancer. Mol Biosyst. 2013;9(12):3187‐3198. [DOI] [PMC free article] [PubMed] [Google Scholar]
- 10. Gao Y, Meng H, Liu S, et al. LncRNA‐HOST2 regulates cell biological behaviors in epithelial ovarian cancer through a mechanism involving microRNA let‐7b. Hum Mol Genet. 2015;24(3):841‐852. [DOI] [PubMed] [Google Scholar]
- 11. Chung YW, Bae HS, Song JY, et al. Detection of microRNA as novel biomarkers of epithelial ovarian cancer from the serum of ovarian cancer patient. Int J Gynecol Cancer. 2013;23(4):673‐679. [DOI] [PubMed] [Google Scholar]
- 12. Yamamoto CM, Oakes ML, Murakami T, Muto MG, Berkowitz RS, Ng SW. Comparison of benign peritoneal fluid‐ and ovarian cancer ascites‐derived extracellular vesicle RNA biomarkers. J Ovarian Res. 2018;11(1):1‐9. [DOI] [PMC free article] [PubMed] [Google Scholar]
- 13. Tang Z, Ow GS, Thiery JP, Ivshina AV, Kuznetsov VA. Meta‐analysis of transcriptome reveals let‐7b as an unfavorable prognostic biomarker and predicts molecular and clinical subclasses in high‐grade serous ovarian carcinoma. Int J Cancer. 2014;134(2):306‐318. [DOI] [PubMed] [Google Scholar]
- 14. Zhang Y, Zhang H, Kang H, Huo W, Zhou Y, Zhang Y. Knockdown of long non‐coding RNA HOST2 inhibits the proliferation of triple negative breast cancer via regulation of the let‐7b/CDK6 axis. Int J Mol Med. 2019;43(2):1049‐1057. [DOI] [PubMed] [Google Scholar]
- 15. Romero‐Pérez L, Castilla MÁ, López‐García MÁ, et al. Molecular events in endometrial carcinosarcomas and the role of high mobility group AT‐hook 2 in endometrial carcinogenesis. Hum Pathol. 2013;44(2):244‐254. [DOI] [PubMed] [Google Scholar]
- 16. Han X, Chen Y, Yao N, Liu H, Wang Z. MicroRNA let‐7b suppresses human gastric cancer malignancy by targeting ING1. Cancer Gene Ther. 2015;22(3):122‐129. [DOI] [PubMed] [Google Scholar]
- 17. Mahajan A, Liu Z, Gellert L, et al. HMGA2: A biomarker significantly overexpressed in high‐grade ovarian serous carcinoma. Mod Pathol. 2010;23(5):673‐681. [DOI] [PubMed] [Google Scholar]
- 18. Yang C, Li B, Yu J, Yang F, Cai K, Chen Z. Ultrasound microbubbles mediated miR‐let‐7b delivery into CD133+ ovarian cancer stem cells. Biosci Rep. 2018;38(5):1‐12. [DOI] [PMC free article] [PubMed] [Google Scholar]
- 19. Zhang Y, Jia LG, Wang P, et al. The expression and significance of lncRNA HOST2 and microRNA let‐7b in HPV‐positive cervical cancer tissues and cell lines. Eur Rev Med Pharmacol Sci. 2019;23(6):2380‐2390. [DOI] [PubMed] [Google Scholar]
- 20. Wang Q, Zhuang ZW, Cheng YM, et al. An in vitro and in vivo study of the role of long non‐coding RNA‐HOST2 in the proliferation, migration, and invasion of human glioma cells. IUBMB Life. 2019;71(1):93‐104. [DOI] [PubMed] [Google Scholar]
- 21. Wang Y, Hu X, Greshock J, et al. Genomic DNA Copy‐Number Alterations of the let‐7 Family in Human Cancers. PLoS One. 2012;7(9):e44399. [DOI] [PMC free article] [PubMed] [Google Scholar]
- 22. Tsukada Y, Fang J, Erdjument‐Bromage H, et al. Histone demethylation by a family of JmjC domain‐containing proteins. Nature. 2006;439(7078):811‐816. [DOI] [PubMed] [Google Scholar]
- 23. Frescas D, Guardavaccaro D, Bassermann F, Koyama‐Nasu R, Pagano M. JHDM1B/FBXL10 is a nucleolar protein that represses transcription of ribosomal RNA genes. Nature. 2007;450(7167):309‐313. [DOI] [PubMed] [Google Scholar]
- 24. Jones BA, Varambally S, Arend RC. Histone methyltransferase ezh2: a therapeutic target for ovarian cancer. Mol Cancer Ther. 2018;17(3):591‐602. [DOI] [PMC free article] [PubMed] [Google Scholar]
- 25. Tzatsos A, Paskaleva P, Lymperi S, et al. Lysine‐specific demethylase 2b (KDM2B)‐let‐7‐enhancer of zester homolog 2 (EZH2) pathway regulates cell cycle progression and senescence in primary cells. J Biol Chem. 2011;286(38):33061‐33069. [DOI] [PMC free article] [PubMed] [Google Scholar]
- 26. Karoopongse E, Yeung C, Byon J, et al. The KDM2B‐let‐7b‐EZH2 axis in myelodysplastic syndromes as a target for combined epigenetic therapy. PLoS One. 2014;9(9):e107817. [DOI] [PMC free article] [PubMed] [Google Scholar]
- 27. Kuang Y, Lu F, Guo J, et al. Histone demethylase KDM2B upregulates histone methyltransferase EZH2 expression and contributes to the progression of ovarian cancer in vitro and in vivo. Onco Targets Ther. 2017;10:3131‐3144. [DOI] [PMC free article] [PubMed] [Google Scholar]
- 28. Lu F, Xu H, Wang Q, Li M, Meng J, Kuang Y. Inhibition of enhancer of zeste homolog 2 increases the expression of p16 and suppresses the proliferation and migration of ovarian carcinoma cells in vitro and in vivo. Oncol Lett. 2018;15(3):3233‐3239. [DOI] [PMC free article] [PubMed] [Google Scholar]
- 29. Tzatsos A, Paskaleva P, Lymperi S, et al. Lysine‐specific demethylase 2B (KDM2B)‐let‐7‐enhancer of zester homolog 2 (EZH2) pathway regulates cell cycle progression and senescence in primary cells. J Biol Chem. 2011;286:33061‐33069. [DOI] [PMC free article] [PubMed] [Google Scholar]
- 30. Kottakis F, Polytarchou C, Foltopoulou P, Sanidas I, Kampranis SC, Tsichlis PN. FGF‐2 regulates cell proliferation, migration, and angiogenesis through an NDY1/KDM2B‐miR‐101‐EZH2 pathway. Mol Cell. 2011;43:285‐298. [DOI] [PMC free article] [PubMed] [Google Scholar]
- 31. Bell D, Berchuck A, Birrer M, et al. Integrated genomic analyses of ovarian carcinoma. Nature. 2011;474(7353):609‐615. [DOI] [PMC free article] [PubMed] [Google Scholar]