Abstract
Abstract
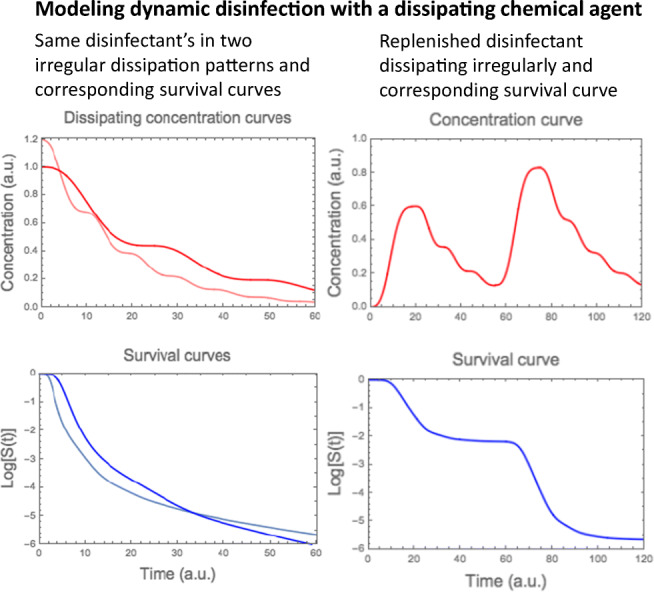
The most notable microbial survival models of disinfection kinetics are the original and modified versions of the static Chick-Watson-Hom’s (CWH) initially developed for water chlorination. They can all be viewed as special cases of the Weibull survival model, where the observed static curve is the cumulative form (CDF) of the times at which the individual targeted microbes succumb to the treatment. The CWH model time’s exponent is the distribution’s shape factor, and its concentration-dependent rate parameter represents the distribution’s scale factor’s reciprocal. Theoretically, the concentration- dependence of the Weibull model’s rate parameter need not to be always in a form of a power-law relationship as the CWH model requires, and two possible alternatives are presented. Apart from being chemically reactive, most chemical disinfectants are also volatile, and their effective concentration rarely remains constant. However, the published dynamic versions of the original CWH model are mathematically incongruent with their static versions. The issue is nonexistent in the dynamic version of the Weibull or other distribution-based models, provided that the momentary inactivation rate is expressed as the static rate at the momentary concentration, at the time that corresponds to the momentary survival ratio. The resulting model is an ordinary differential equation (ODE) whose numerical solution can describe survival curves under realistic regular and irregular disinfectant dissipation patterns, as well as during the disinfectant dispersion and/or its replenishment.
Key Points
• The Chick-Watson-Home models are treated as special cases of the Weibull distribution.
• Dynamic microbial survival curve described as ordinary differential equation solution.
• Survival rate models of disinfectant dissipation and replenishment patterns presented.
Graphical abstract
Keywords: Disinfection, Chick-Watson-Hom’s model, Microbial inactivation, Weibull distribution, Rosin-Rammler distribution, Fermi distribution
Introduction
With the COVID-19 pandemic, issues concerning disinfection are receiving more public and public health attention. The kinetics of microbial chemical disinfection has a long history, and it has been described mathematically by a variety of models (e.g., Ganguly et al. (2018), Gyurek and Finch (1998), Luukkonen et al. (2015), Santoro et al. (2007), Younas et al. (2014)). The most commonly employed models have been the original and variants of the Chick-Watson and Hom’s model (Chick 1908; Watson 1908; Hom 1972). These models’ mathematical properties and application to disinfectants, such as chlorine, chlorine dioxide, ozone, hydrogen peroxide, paracetic acid, copper, and ethanol, have been described and discussed in numerous publications, e.g., Armstrong et al. (2017), Chang et al. (2018), Chong et al. (2011), Falsanisi et al. (2006), Ganguly et al. (2018), Gyurek and Finch (1998), Haas and Joffe (1994), Haas and Kara (1984), Ibarguen-Mondragon et al. (2020), Jessen et al. (2008), John et al. (2005), Kampf (2018), Lambert and Johnston (2000), Luukkonen et al. (2015), Mounaouer and Abdennaceur (2016), Rattanakul et al. (2015), Rossi et al. (2007), and Schijven et al. (2019).
Almost invariably, their starting point has been the “static” model version where the disinfectant’s concentration, as well as temperature and other factors, are assumed to remain constant. The “dynamic,” or rate model versions, i.e., where the disinfectant’s concentration vary, primarily due to the disinfectant dissipation, has been obtained by expressing the survival rate as the time derivative of the static semi-logarithmic survival curve (see below). Since, with very few exceptions (notably silver), disinfectants are both highly reactive chemically and volatile, maintaining their concentration constant can be an issue. Therefore, dynamic models are indispensable in evaluating the antimicrobial efficacy of single and repeated treatments with such disinfectants.
The objectives of this study have been to investigate and highlight the mathematical properties of the Chick-Watson-Hom’s (CWH) type models, propose an expanded version that would eliminate their theoretical shortcomings, and explore the potential of alternative kinetic models in the description of dynamic chemical disinfection.
Chick-Watson-Hom’s inactivation kinetics
The static Chick-Watson model, originally developed for water chlorination, is usually presented in the form:
| 1 |
where the targeted microbe’s momentary survival ratio S(t) = N(t)/N0, N(t) and N0 being its momentary number after time t and its initial number, respectively, and C is the disinfectant’s concentration. The model’s two adjustable parameters, k and n, are characteristic to the targeted microbe (which can be a virus, bacterium or other kind of a microbe) and the particular disinfectant type. These parameters’ magnitudes also depend on the ambient conditions such as the medium’s temperature and pH. Notice that the survival ratio’s logarithm base in this work is 10, which refers to the number of decade reduction in the targeted microbial population’s size. Using the natural logarithm in the equations will only affect the numerical value of k.
Hom’s, or the CWH, model is an expanded version of the Chick-Watson model, which for static disinfection can be written as
| 2 |
where the exponent m is the added parameter.
By these definitions, the original Chick-Watson is just a special case of the CWH model where m = 1, and the original Chick model where m = n = 1.
According to various publications, e.g., Gyurek and Finch (1998), Haas and Joffe (1994), Jessen et al. (2008), Mounaouer and Abdennaceur (2016), and Santoro et al. (2007), the dynamic or rate version of the Chick-Watson model is
| 3 |
and that of the CWH model, of which Eq. 3 is a special case,
| 4 |
However, these two rate equations (Eq. 3 and Eq. 4) can describe the survival or inactivation rate only if the disinfectant’s concentration remains unchanged, i.e., where C and hence Cn are constant throughout the process. If the disinfectant concentration does vary in time, i.e., where C = C(t) ≠ constant, then the correct derivation of the differential rate equation, regardless of whether m = 1 or m ≠ 1, is (Peleg 2021)
| 5 |
This mathematical issue is not settled by making Eq. 3 or Eq. 4 the starting point, in which case, the integration would produce the equation
| 6 |
which unless C(t) = constant is not the same as Eq. 1 or Eq. 2 (ibid).
Haas and Joffe (1994) have avoided this issue by expressing C(t) in Eq. 6 as an exponential decay term, i.e.,
| 7 |
which enabled them to reach an approximate calculation of the integral (see also Falsanisi et al. (2006) and Chang et al. (2018)).
With today’s mathematical software such as Mathematica® (Wolfram Research, Champaign IL, USA), the program used to produce the figures in this work, but also with other commercially available mathematical programs, the numerical calculation of the corrected dynamic Log10[S(t)] as defined by Eq. 7 is not an issue. The same can be said about similar but more elaborate concentration dissipation patterns. The problem with Eq. 5 as a survival model is that it allows the survival ratio to rise with the decrease in the disinfectant concentration even at a lethal level, a topic to which we will return in the discussion of the Weibullian and other distribution-based models.
According to the CWH type models, when C(t) = 0, the targeted microbe remains intact indefinitely, i.e., Log10[S(t)] = 0 at all times. It is true of course that the inactivation rate produced by disinfection with an effective antimicrobial chemical agent by far exceeds that which occurs naturally. Therefore, considering the latter negligible is reasonable, in most practical situations and ignoring it in the model construction fully justified. Theoretically, however, this may not be always the case, as in a marginal treatment of a naturally unstable pathogen and/or at the end of a treatment with a highly volatile chemical agent. In such cases, at least in principle, the disinfectant’s effective concentration, unless replenished, can dramatically diminish and reach a level where the two rates can become of comparable magnitude. If a correction for such a probably rare scenario is indeed needed, then the CWH model as formulated by Eq. 3 could be amended and written in a form such as
| 8 |
where k0 and m0 are the natural decay’s parameters of the targeted microbe under the same ambient conditions.
Or, if m0 = m, then
| 9 |
The cornerstone of the original Chick model has been that microbial inactivation follows first-order kinetics whose rate equation is
| 10 |
where k is the rate constant. This rate, or exponential decay, constant, k, according to Chick, is proportional to the disinfectant’s concentration, i.e., k = kCC. In the Chick-Watson model, the notion of first-order kinetics is preserved, but the rate constant becomes proportional to the disinfectant’s concentration raised to a power n, i.e., k = kCWCn. The Chick-Watson-Hom’s (CWH) model does away with first-order kinetics by replacing the time t with tm, but preserves the Chick-Watson rate constant’s concentration dependence in the form k = kCWHCn.
No doubt the disinfection rate constant k, however defined, should be a concentration-dependent term. But why should this dependence be universally in a power-law form, i.e., kC or kCn, is not at all obvious. Here are two hypothetical not unrealistic situations where replacement of the power-law term could be justified. A power-law term, unless accompanied by a clarifying “If statement,” does not indicate that there might be an effective threshold disinfectant concentration, or marks the disinfectant level where the inactivation starts in earnest. At the other end, a power-law expression does not reveal that there might be a disinfectant’s concentration level at which its effectiveness starts to level off. Where such a reservation is appropriate, the CWH’s model’s fit, as judged by statistical criteria, would only pertain to the particular experimental concentrations range examined.
Weibullian approach to microbial survival and inactivation kinetics
Consider a population of a virus, bacterium, protist, or any other microorganism, exposed to a lethal chemical disinfectant in water or other medium, and let’s assume that an individual member of this population can be in one of two states, viable/alive or inactivated/dead (for simplicity, let us also assume that when the targeted microbe is a bacterium or protist, no cell division takes place on the pertinent time scale, and ignore the possibility of injury and recovery or adaptation. These features can be incorporated in the survival model construction, but they should not concern us here). Had the lethal agent been applied in perfect uniformity, and had all the individual microbes been identical genetically, in exactly the same physiological state, and homogenously dispersed, then, theoretically, they would all succumb to the lethal agent at the same time, and their population’s survival curve would resemble a step function (see Peleg 1996, 2006; Peleg and Cole 1998). In reality, there is always a certain degree of variability within the exposed microbial population so that the individuals are inactivated and become uncountable at different times. The observed survival curve is therefore a record of the exposed microbes’ spectrum of sensitivities (or resistances) to the agent, expressed as the cumulative form (CDF) of the inactivation/death events’ temporal distribution. Depending on the targeted microbe, the disinfectant kind, and the ambient conditions, this distribution can assume different shapes, symmetric or skewed, narrow or wide, etc. (ibid). The local slope of the cumulative form of this distribution, regardless of its shape, is the momentary survival or inactivation rate, which has time reciprocal dimension and units. In other words, the notions of an underlying spectrum of resistances or sensitivities characterized by a distribution function and of inactivation kinetics are the two sides of the same coin.
The Weibull distribution
The Weibull distribution function is a flexible mathematical model which has been applied to many unrelated failure/survival phenomena, among them microbial inactivation by heat and other means including chemical disinfection of water (Corradini and Peleg 2003; Peleg 2006). Since in modeling disinfection kinetics, we are primarily dealing with inactivation rates and rate parameters, we will use this model’s original version known as the Rosin-Rammler distribution, to maintain the analogy with the Chick-Watson-Hom’s model.
In static chemical disinfection, i.e., under constant disinfectant concentration (and at a constant temperature, pH, etc.), the cumulative Weibullian model can be written as
| 11 |
where b(C) is a concentration-dependent rate parameter, related to Weibullian scale factor’s reciprocal, and m(C) a power, the Weibullian shape factor. Where the power m(C) has no or weak concentration dependence and can be assumed practically constant (van Boekel 2002; Corradini and Peleg 2003), then the static Weibullian model of microbial survival becomes
| 12 |
Thus, from a formalistic viewpoint, the CWH model can be considered a special case of Eq. 12, where the Weibullian model’s rate parameter b(C) = kCn.
According to the Weibullian model, a shape factor larger that one (m > 1), i.e., a semi-logarithmic survival curve having downward concavity, indicates that damage accumulation weakens the survivors’ resistance which progressively shortens the time needed for their elimination. Upper concavity (m < 1), known as “tailing,” probably indicates that more susceptible members of the targeted population are eliminated fast, leaving behind more resistant survivors which takes progressively longer to inactivate. Log-linear or what is known as first-order kinetics, according to the Weibullian model, is just a special case where the shape factor m = 1.
An observed lag time in the otherwise concave downward survival curve, known as a flat “shoulder,” can be viewed as indicating that the underlying susceptibility distribution’s mode is much larger than its variance, and hence, there is no need for an “If statement” in the model formulation to indicate its existence (see Peleg 2006, 2021, and below). A sigmoid survival curve in chemical disinfection exhibiting both a flat shoulder and tailing of the kind described by Ganguly et al. (2018) can be viewed as indicating that the population is most probably a mixture. Dynamic versions of sigmoid inactivation patterns can be produced in the same way as the Weibullian (see Peleg (2006)), but they will not be further discussed in this work.
Expressing the Weibullian rate parameter’s concentration dependence
Theoretically, there are numerous possible ways to describe the b(C) vs. C relationship mathematically of which the CWH power-law is just one. Two such hypothetical power-law b(C) vs. C curves are shown at the top plots in Figs. 1 and 2, and two generated with alternative models at the top of Fig. 3.
Fig. 1.
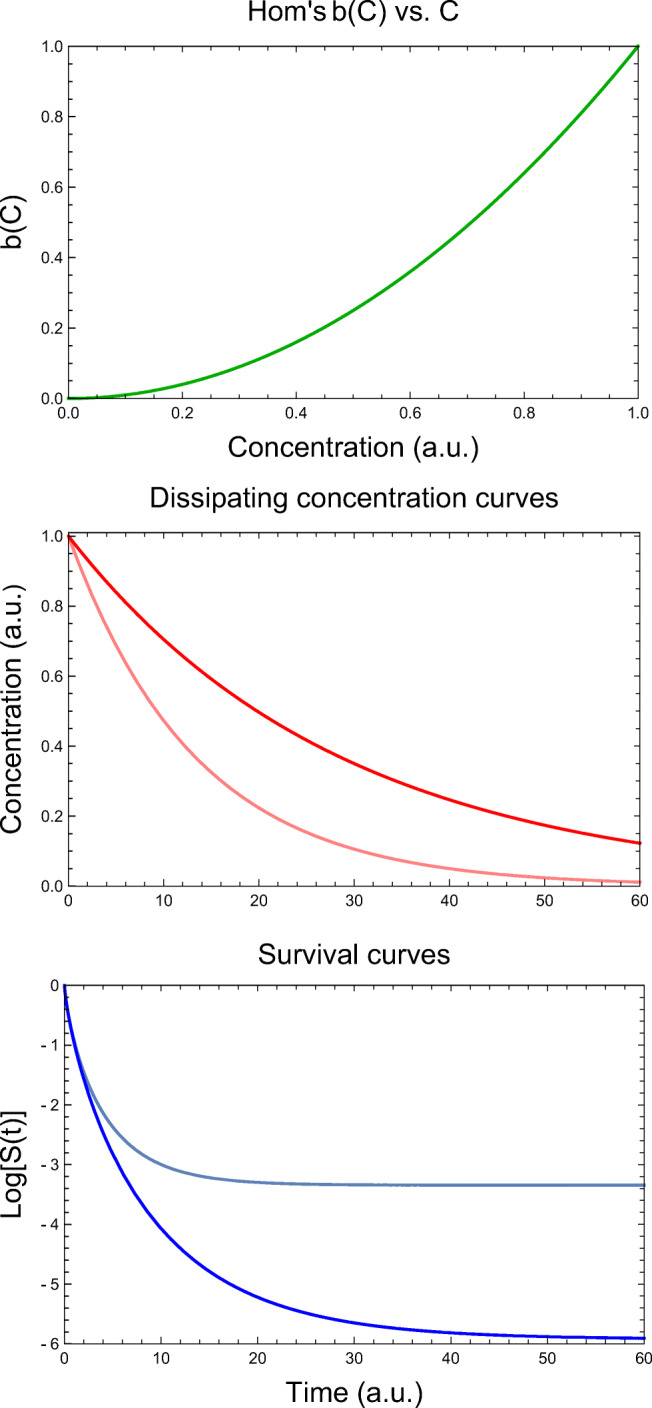
Simulated survival curves during disinfection with an exponentially dissipating chemical agent generated with the dynamic version of the Weibullian model (Eq. 15) where b(C) = kCn as in the traditional Chick-Watson-Hom’s model. Top - the b(C) vs. C relationship, middle - two dissipating concentration profiles, and bottom - the two corresponding survival curves. Notice that the differential rate equations’ complexity is no hindrance to their numerical solution
Fig. 2.
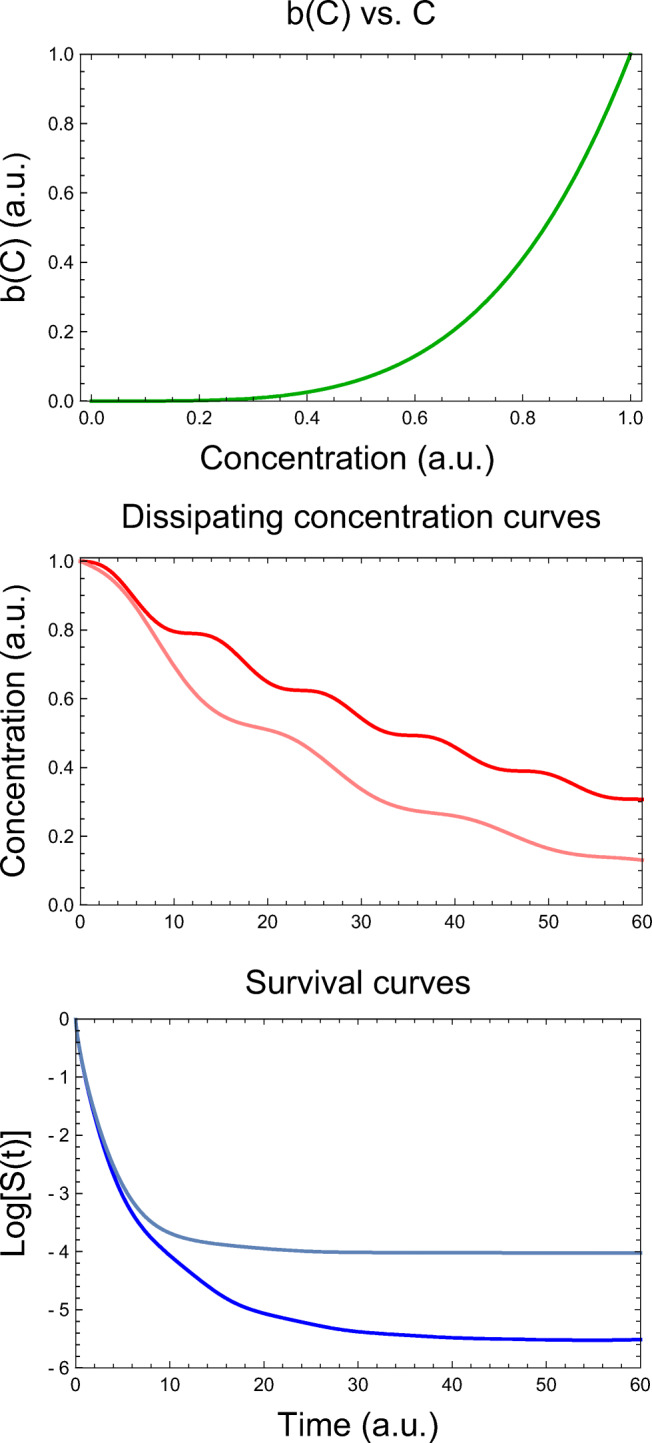
Simulated survival curves during disinfection with an irregularly dissipating chemical agent generated with the dynamic version of the Weibullian model (Eq. 15) where b(C) = kCn as in the traditional Chick-Watson-Hom’s model. Top - the b(C) vs. C relationship, middle - two dissipating concentration profiles, and bottom - the two corresponding survival curves. Notice that the differential rate equations’ complexity is no hindrance to their numerical solution
Fig. 3.
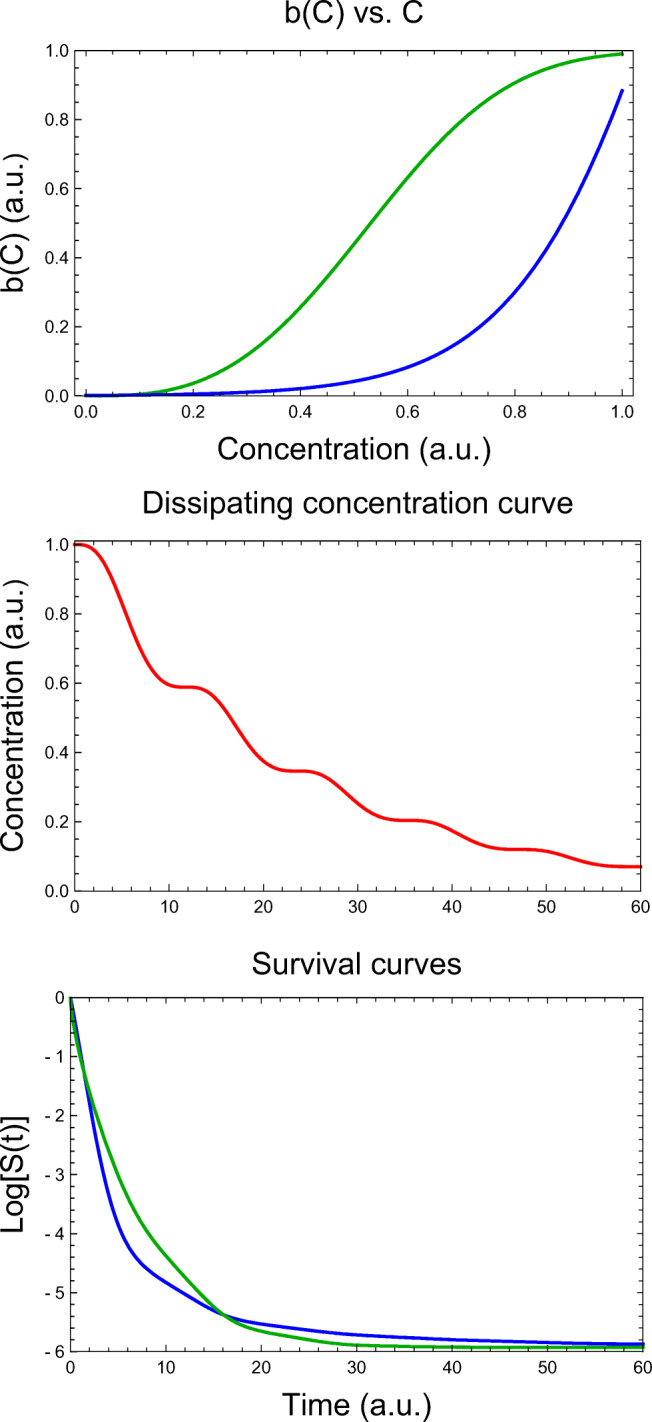
Simulated survival curves during disinfection with an irregularly dissipating chemical agent generated with the dynamic version of the Weibullian model (Eq. 15) where b(C) follows the alternative models Eq. 13 (green) and Eq. 14 (blue). Top - the b(C) vs. C relationship, middle - the irregularly dissipating concentration profile, and bottom - the two corresponding survival curves. Notice that the differential rate equations’ complexity is no hindrance to their numerical solution
Stretched exponential model
Consider a hypothetical scenario where the chemical disinfectant is ineffective at low concentrations and its lethality level “flattens” at high concentrations. In between, there is a concentration range where the lethality rises with the concentration fast at first and then at a lower pace, approaching a plateau later. Such a scenario can be described by a sigmoid b(C) vs. C relationship of the kind shown as a blue curve at the top of Fig. 3. A flexible mathematical model that can describe such a relationship is the three parameters stretched exponential model, which can be written in the form
| 13 |
where basym is the asymptotic b(C) level, Cc1 a marker of the inflection point concentration, and p > 1 an exponent (where p ≤ 1 the b(C) vs. C will have a Monod curve’s shape, i.e., a curve having a progressively decreasing slope without an inflection point).
Log-exponential model
Another hypothetical scenario, represented by the green b(C) vs. C curve at the top of Fig. 3, describes a situation where the disinfectant is practically ineffective below a certain concentration level marked by Cc2, i.e., at C < < Cc2, b(C) ≈ 0, and at C > > Cc2, b(C) rises linearly with the concentration (as in Chick’s model). To describe such a scenario, one can use the two parameters log-exponential model (Corradini and Peleg 2003; Peleg 2006).
| 14 |
According to this model, at C > > Cc2, b(C) ≈ kb(C−Cc2).
Dynamic disinfection
The local slope of a static semi-logarithmic survival curve is constant, i.e., time-independent, only if the inactivation follows first-order kinetics (i.e., m = 1 and n = constant using the CWH model’s terminology). Therefore, in dynamic disinfection where m ≠ 1, and where C(t) varies with time, the momentary inactivation rate is the static rate at the momentary concentration at the time which corresponds to the momentary survival ratio (Peleg and Penchina (2000), Corradini and Peleg (2003)). This translates into the differential rate equation
| 15 |
which for m = 1, i.e., for first-order kinetics, is reduced to dLog10/dt = − b[C(t)].
Despite its cumbersome appearance, Eq. 15 is an ordinary differential equation (ODE), and can be rapidly solved numerically for almost any conceivable realistic concentration history C(t), including when presented as an interpolating function.
Figure 1 (bottom) shows two simulated dynamic survival curves where the disinfectant’s concentration dissipates exponentially (middle plots). They were generated with the dynamic Weibullian model (Eq. 15) where the b(C) vs. C relationship is expressed by the power-law model, b(C) = kCn as in the CWH model. Figure 2 describes two such survival curves generated for two hypothetical scenarios where the dissipating disinfectant’s concentration exhibits irregular oscillations. As expected, the complicated fluctuating concentration profiles (shown at the middle of the figure) were no hindrance to their corresponding differential rate equations numerical solutions, which produced the corresponding survival curves almost instantaneously.
Two additional examples of the use of Eq. 15 to simulate disinfection with an irregularly dissipating chemical agent are shown in Fig. 3. The two generated survival curves, shown at the bottom of that figure, were generated with the same Weibullian rate model, except that the rate parameter’s, b(C)’s, concentration dependence was defined by Eq. 13 (blue) or Eq. 14 (green). Here again, the fluctuating concentration profile’s complexity, shown at the middle of the figure, and that of the corresponding b[C(t)]’s terms was no hindrance to the two corresponding rate equations numerical solution. And here too, the survival curves have been rendered almost instantaneously.
(An interested reader can generate his or her own dynamic survival curves, with Eq. 14 as the concentration dependence model, using the freely downloadable interactive Wolfram Demonstration https://demonstrations.wolfram.com/MicrobialSurvivalWithDissipatingDisinfectant/.)
Notice that the shown oscillatory dissipating concentration profiles in Figs. 2 and 3 were generated in a manner that the disinfectant’s concentration cannot rise unless it is replenished, and that the formulation of Eq. 15 guarantees that the survival ratio can only drop or remain stable but never rise (Peleg 2006), unless recontamination occurs or growth may resume at very low residual disinfectant concentration (except for viruses).
The dynamic version of the Weibullian model for microbial survival was originally developed for and has been repeatedly validated in thermal inactivation. Only later has it been validated for water disinfection by volatile disinfectants (Corradini and Peleg 2003). By “validated,” we do not mean good fit to experimental survival data as judged by statistical criteria or successful interpolation, but that the model correctly predicted experimental data not used in the calculation of its parameters (ibid).
Alternative underlying distribution functions
Although the flexible Weibullian model can be viewed as a natural choice for describing most concave upward and downward semi-logarithmic survival curves, it need not be unique for some kinds of survival curves, and deficient for others. For example, it can and has been demonstrated with published microbial survival data having inevitable experimental scatter that the lognormal distribution performed just as well when applied to concave downward curves (Aragao et al. 2007). The Weibullian model’s advantage here is that with a fixed shape factor, m[C(t)] = constant, only b[C(t)] ought to be expressed mathematically, while when using the lognormal distribution, both its logarithmic mean and standard deviation ought to be determined and expressed as functions of the disinfectant’s concentration and time. The same can be said about the numerous other unimodal distribution functions which one might consider (see Walck (2007)). This is not an issue where the experimental semi-logarithmic survival curves are concave upward in which case the lognormal distribution cannot be even considered (but the exponential distribution function can). Or, if skewness reversal is involved, the log-beta distribution might be a particularly suitable model.
There are two types of survival patterns for which the Weibull and any of its alternative distribution functions is clearly not a useful model. One is where at the end of a notable flat “shoulder” (lag time), the survival ratio drops so steeply that the survival curve resembles a step function (Peleg 1996). The other is where the drop beyond the notable shoulder is clearly log-linear (Najm 2006). Theoretically, the latter can be observed at low disinfectant concentrations while the former at high concentrations as shown schematically in Fig. 4. This figure also demonstrates that in such a case, the shoulder gets shorter as the disinfectant’s concentration is increased.
Fig. 4.
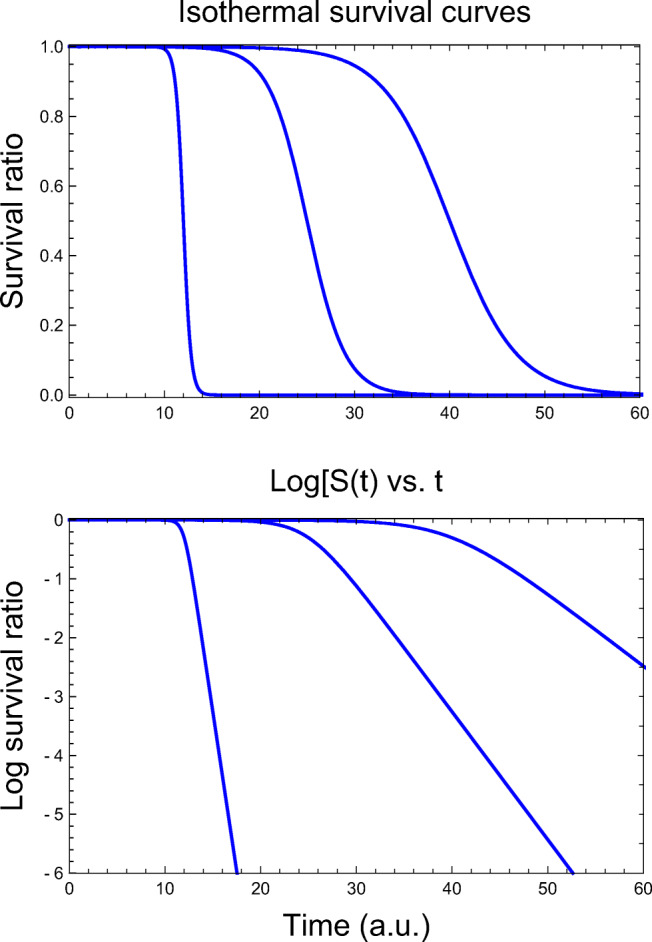
Isothermal survival curves generated with Fermi’s distribution as a model. Top - on linear coordinates and bottom - on semi-logarithmic coordinates
These two kinds of survival curves, and transitions between them, can be described by the Fermi distribution function (Peleg 1996), which for our purpose can be written in the form
| 16 |
where tc(C) marks the shoulder’s concentration-dependent duration and kF(C) the linear semi-logarithmic survival curve’s slope well beyond it. According to this model when kF(C) < < t − tc, the curve becomes practically indistinguishable form a step function, i.e., at t < tc, S(t) ≈ 0 and at t > tc, S(t) ≈ 0. Yet S(t) or Log10[S(t)] as defined by Eq. 16 is a continuous function that has real derivatives.
The dynamic version of the Fermi distribution model
The notion that the momentary inactivation (or survival) rate is the static rate at the momentary concentration at the time that corresponds to the momentary survival ratio can be extended to the Fermi model as well as to any other dynamic model survival model. In the Fermi model’s case, the rate equation can be written in the form
| 17 |
where the time that corresponds to the momentary survival ratio, t*(t), is
| 18 |
Again, despite its cumbersome appearance, Eq. 17 is an ODE and can be solved numerically for almost every conceivable realistic concentration profile C(t). This rate equation differs from the Weibullian model described by Eq. 15 not only in the underlying model equation, which contains two time-dependent terms, tc(t) = tc[C(t)] and kF[(t) = [C(t)], instead of one, b[C(t)] where m = constant, but also in it the boundary condition. Unlike the Weibullian (or lognormal) distribution whose domain is from 0 to ∞, the Fermi’s distribution’s domain is from − ∞ to ∞, and hence, at t = 0 Log10[S(t)] < 0 by definition. This discrepancy is taken care of by assigning the boundary condition not as Log10[S(0)] = 0, but the very small static value of Log10[S(0)] at the initial disinfectant’s concentration.
Two examples of the Fermi model use to generate survival curves under irregularly dissipating disinfectant concentrations are given in Fig. 5. The shown survival curves were generated for a hypothetical disinfectant whose Fermian model’s two parameters, the tc and kF in Eq. 16, decrease exponentially with its concentration (see figure’s top). The survival curves themselves were calculated and plotted practically instantaneously, as expected, again demonstrating that the two rate equations complexity were no hindrance to their numerical solutions.
Fig. 5.
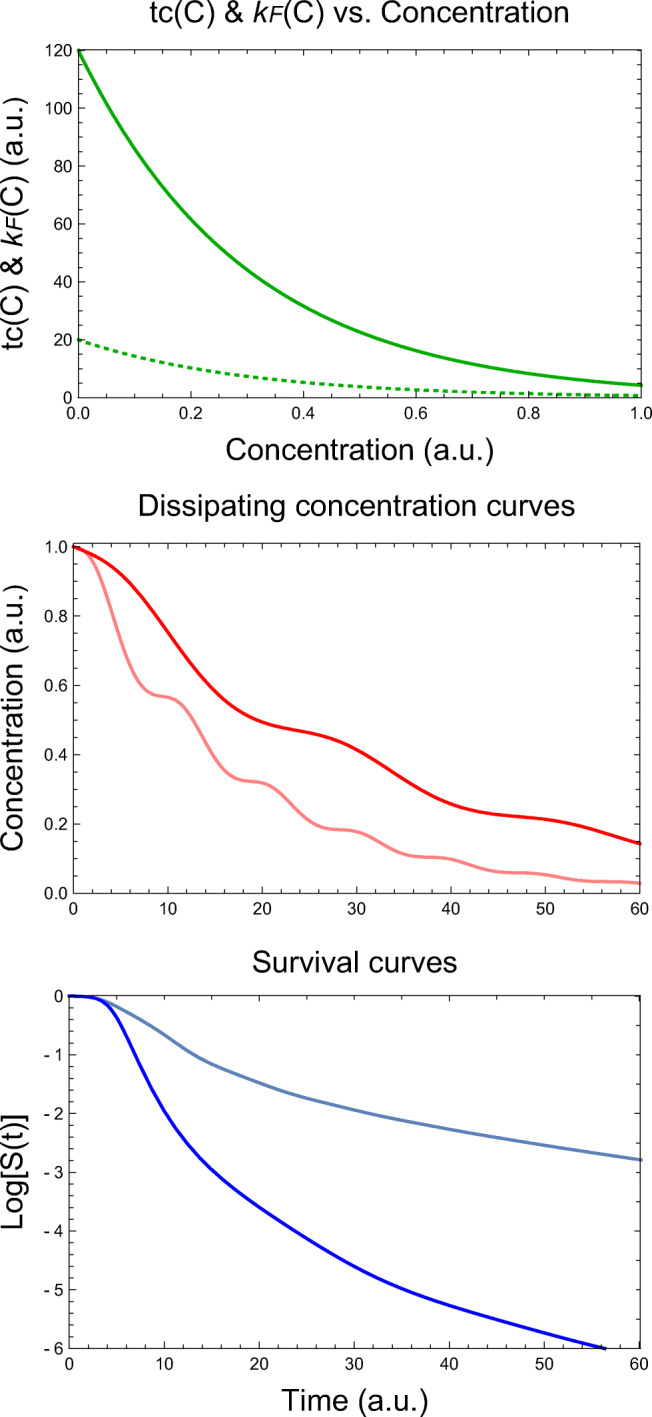
Simulated survival curves during disinfection with an irregularly dissipating chemical agent generated with the dynamic version of the Fermi distribution function (Eqs. 17 and 18), whose parameters tc(C) (solid green curve) and kF(C) (dotted green curve) drop exponentially. Top - the tc(C) and kF(C) vs. C relationships, middle - two irregularly dissipating concentration profiles, and bottom - the two corresponding survival curves. Notice that the differential rate equations’ complexity is no hindrance to their numerical solution
Disinfectant replenishing and accounting for its dispersing time
The survival patterns presented in Figs. 1, 2, 3, 4, and 5, as well as in most if not all the cited publications, describe the outcome of hypothetical treatments with dissipating disinfectants having known initial concentration, i.e., at t = 0, C(t) = C0. The proposed rate models, however, are also applicable to processes where the disinfectant is replenished, as demonstrated in Fig. 6. The figure describes an idealized hypothetical scenario where the disinfectant is replenished twice. The assumptions are that the replenishment is instantaneous and followed by the disinfectant exponential dissipation. The mathematical expression that describes the shown concentration profile has two “If statements” and the dynamic Weibullian survival model (Eq. 15) has its b(C) described by a power-law term as in the CWH model. As before, the resulting differential rate equation complexity has been no hindrance to its numerical solution by Mathematica®, and the corresponding survival curve plot was rendered almost instantaneously.
Fig. 6.
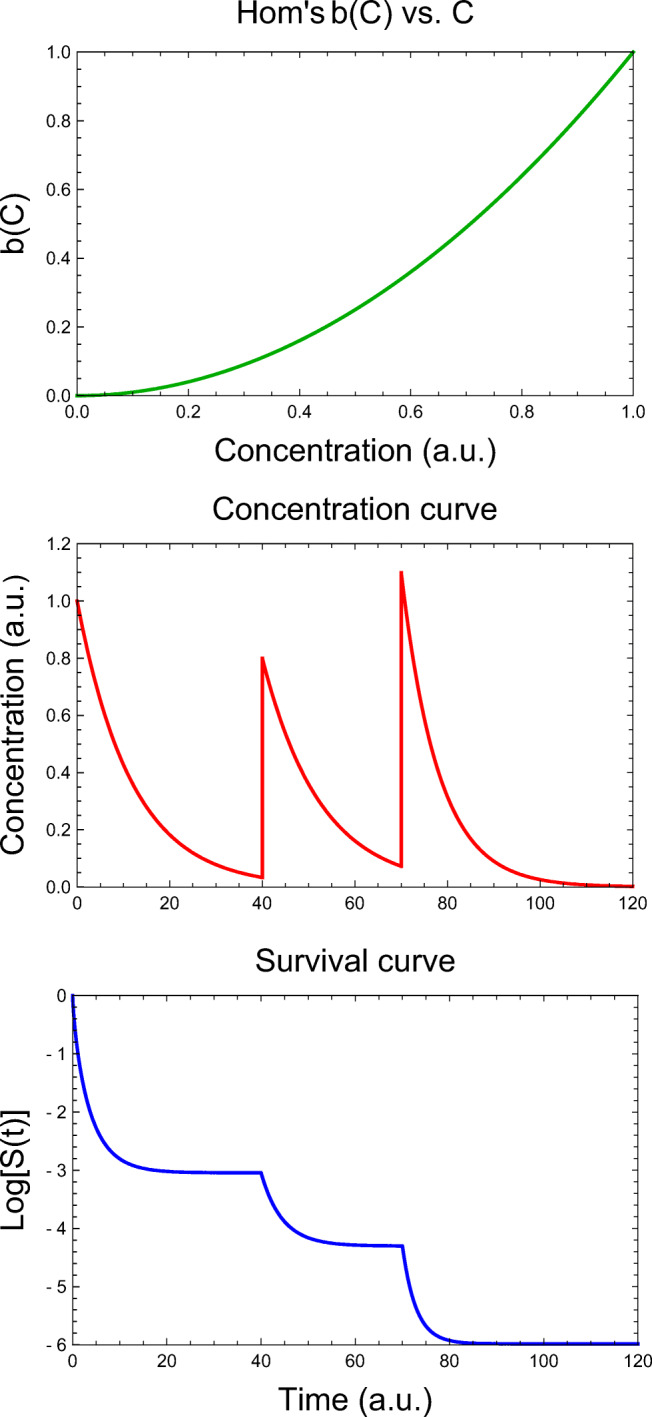
Simulated survival curves generated by the dynamic version of the CWH-Weibullian model for twice replenished disinfectant. Notice that the “If statements” in the model’s rate equation is no hindrance to its numerical solution
A more realistic scenario is where both the disinfectant initial application and its replenishment are not instantaneous, and its dissipation is irregular rather than perfectly exponential, as shown in Fig. 7. The expression used to generate the shown profile had only one “If statement,” and the survival rate model was again the Weibullian with its b(C) described by a power-law term as in the CWH model. Once more, the resulting differential rate equation complexity has been no hindrance to its numerical solution, and, as before, the survival curve has been rendered instantaneously for all practical purposes.
Fig. 7.
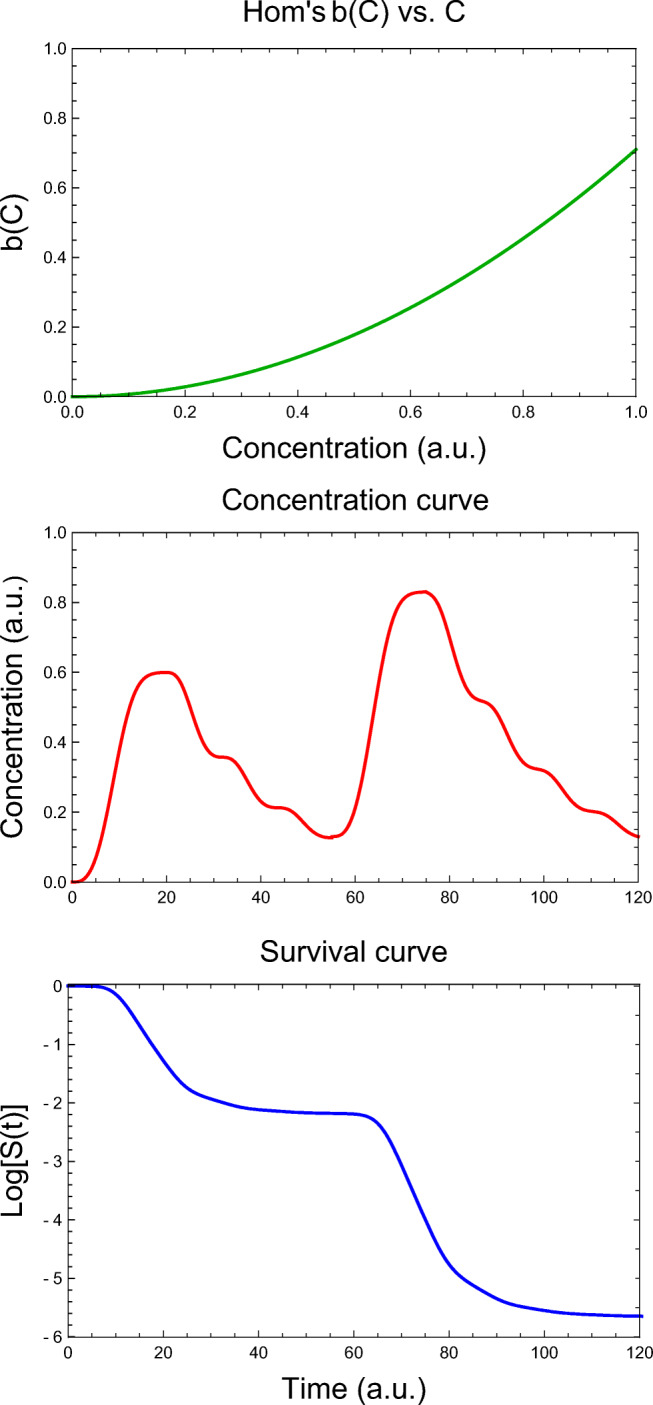
A simulated survival curve generated by the dynamic version of the CWH-Weibullian model for a replenished disinfectant whose dispersion in the treated medium takes substantial time. Notice that the differential rate equations’ complexity (which also includes an “If statement”) is no hindrance to its numerical solution
Figures 6 and 7 clearly demonstrate that currently available mathematical software offers a handy tool to generate and study realistic disinfection patterns, which include the disinfectant replenishment and dispersion stages. With a program such as the one used to generate these two figures, one can compare different survival models and application regimes in a very short time. One can also rapidly examine the effect of variation or uncertainties in the targeted microbe’s survival parameters, the disinfectant’s properties and the concentration profile, and assess their influence on the treatment’s efficacy. Such simulations would assist in the disinfectant selection, the choice of its initial concentration, and its application mode, which might include its replenishment timing.
Concluding remarks
This work has focused on the mathematical properties of the traditional chemical disinfection kinetic models and options of their replacement in the study of dynamic disinfection with dissipating/volatile disinfectants. Therefore, no effort has been made to compare the efficacy and feasibility of different disinfectants or the fit of different kinetic models to experimental data. The main findings of the work are as follows:
The static version of the Chick-Watson-Hom’s model can be viewed as the cumulative (CDF) form of a targeted microbe’s Weibullian inactivation-time distribution. The time’s exponent m in this model’s equation is the distribution’s shape factor, and the rate parameter, b(C) = kC or kCn, represents its scale factor.
Despite being supported by published experimental data, the universality of the power-law relationship between the rate parameter and the disinfectant concentration cannot be taken for granted. At least theoretically, it can be replaced by other expressions, and two alternatives and their rationale are offered.
There is a mathematical issue with the published CWH model’s dynamic and static versions, which can be eliminated by its replacement with the dynamic version of the Weibullian model. The result is an ordinary differential equation (ODE) that can be solved numerically for almost every conceivable realistic concentration profile.
Similar disinfection models can be constructed based on alternative underlying distribution functions. An example is the Fermi distribution, which can account for survival curves resembling a step function and/or having a substantial lag time with log-linear continuation.
The same modeling approach can be used for a disinfectant’s replenishment mode, and for accounting for what happens until it reaches its intended initial concentration. Despite the complexity of the resulting rate equations, they too are ODE’s and can be rapidly solved numerically.
Authors’ contribution
Not applicable.
Compliance with ethical standards
Conflict of interest
The authors declare that they have no conflict of interest.
Ethics approval
The work did not include any animal or human samples or patient data.
Consent to participate and consent for publication
Not applicable.
Footnotes
Publisher’s note
Springer Nature remains neutral with regard to jurisdictional claims in published maps and institutional affiliations.
References
- Aragao GMF, Corradini MG, Normand MD, Peleg M. Evaluation of the Weibull and log-normal distribution functions as survival models of Escherichia coli under isothermal and non-isothermal conditions. Int J Food Microbiol. 2007;19:243–257. doi: 10.1016/j.ijfoodmicro.2007.08.004. [DOI] [PubMed] [Google Scholar]
- Armstrong AM, Sobsey MD, Cassanova LM. Disinfection of bacteriophage MS2 by copper in water. Appl Microbiol Biotechnol. 2017;101:6891–6897. doi: 10.1007/s00253-017-8419-x. [DOI] [PubMed] [Google Scholar]
- Chang CW, Huo X, Lin TF. Exposure of Microcystis aeruginosa to hydrogen peroxide and titanium dioxide under visible light conditions: Modeling the impact of hydrogen peroxide and hydroxyl radical on cell rupture and microcystin degradation. Water Res. 2018;141:217–226. doi: 10.1016/j.watres.2018.05.023. [DOI] [PubMed] [Google Scholar]
- Chick H. An investigation of the laws of disinfection. Epidemiol Infect. 1908;8:92–152. doi: 10.1017/s0022172400006987. [DOI] [PMC free article] [PubMed] [Google Scholar]
- Chong MN, Jin B, Saint CP. Bacterial inactivation kinetics of a photo-disinfection system using novel titania-impregnated kaolinite photocatalyst. Chem Eng J. 2011;171:16–23. doi: 10.1016/j.cej.2011.03.024. [DOI] [Google Scholar]
- Corradini MG, Peleg M. A model of microbial survival curves in water treated with a volatile disinfectant. J Appl Microbiol. 2003;95:1268–1276. doi: 10.1046/j.1365-2672.2003.02104.x. [DOI] [PubMed] [Google Scholar]
- Falsanisi D, Gehr R, Antoro D, Dell’Erba A, Notarnicola M, Liberti L. Kinetics of PAA demand and its implications on disinfection of wastewaters. Water Qual Res J Can. 2006;41:398–409. doi: 10.2166/wqrj.2006.043. [DOI] [Google Scholar]
- Ganguly P, Byrne C, Breen A, Pilali SC. Antimicrobial activity of photocatalysts: fundamentals, mechanisms, kinetics and recent advances. Appl Catal B Environ. 2018;225:51–75. doi: 10.1016/j.apcatb.2017.11.018. [DOI] [Google Scholar]
- Gyurek LL, Finch GR. Modeling water treatment chemical disinfection kinetics. J Environ Eng. 1998;14:783–793. doi: 10.1061/(ASCE)0733-9372(1998)124:9(783). [DOI] [Google Scholar]
- Haas CN, Joffe J. Disinfection under dynamic conditions: modification of Hom’s model for decay. Environ Sci Technol. 1994;28:1367–1469. doi: 10.1021/es00056a028. [DOI] [PubMed] [Google Scholar]
- Haas CN, Kara SB. Kinetics of microbial inactivation by chlorine - I. Review of results in demand free systems. Water Res. 1984;11:1443–1449. doi: 10.1016/0043-1354(84)90015-0. [DOI] [Google Scholar]
- Hom LW. Kinetics of chlorine disinfection of an ecosystem. J ASCE. J Sanit Eng Div. 1972;9:183–194. [Google Scholar]
- Ibarguen-Mondragon E, Revelo-Romo D, Hidalgo A, Garcia H, Galeano LA. Mathematical modelling of MS2 virus inactivation by Al/Fe-PILC-activated catalytic wet peroxide oxidation (CWPO) Environ Sci Pollut Res. 2020;27:19836–19,844. doi: 10.1007/s11356-020-08365-4. [DOI] [PubMed] [Google Scholar]
- Jessen A, Randall A, Reinhart D, Daly L. Effectiveness of ferrate as a disinfectant for ballast water. Water Environ Res. 2008;80:561–569. doi: 10.2175/193864708X267423. [DOI] [PubMed] [Google Scholar]
- John DE, Haas CN, Nwachuku N, Gebra CP. Chlorine and ozone disinfection of Encephalitozoon intestinalis spores. Water Res. 2005;39:2369–2375. doi: 10.1016/j.watres.2005.04.013. [DOI] [PubMed] [Google Scholar]
- Kampf G. Efficacy of ethanol against viruses in hand disinfection. J Hospital Infect. 2018;98:331–338. doi: 10.1016/j.jhin.2017.08.025. [DOI] [PMC free article] [PubMed] [Google Scholar]
- Lambert RJW, Johnston MD. Disinfection kinetics: a new hypothesis and model for the tailing of log-survivor/time curves. J Appl Microbiol. 2000;88:907–913. doi: 10.1046/j.1365-2672.2000.01060.x. [DOI] [PubMed] [Google Scholar]
- Luukkonen T, Heynink T, Ramo J, Lassi U. Comparison of organic peracids in wastewater treatment: disinfection, oxidation and corrosion. Water Res. 2015;85:275–285. doi: 10.1016/j.watres.2015.08.037. [DOI] [PubMed] [Google Scholar]
- Mounaouer B, Abdennaceur H. Modeling and kinetic characterization of wastewater disinfection using chlorine and UV irradiation. Environ Sci Pollut Res. 2016;23:19861–19875. doi: 10.1007/s11356-016-7173-4. [DOI] [PubMed] [Google Scholar]
- Najm I (2006) An alternative interpretation of disinfection kinetics. J Am Water Works Assoc 98: 93–101
- Peleg M. Evaluation of the Fermi equation as a model of dose-response curves. Appl Microbiol Biotechnol. 1996;46:303–306. doi: 10.1007/s002530050821. [DOI] [Google Scholar]
- Peleg M. Advanced quantitative microbiology for food and biosystems: models for predicting growth and inactivation. Boca Raton: CRC Press; 2006. [Google Scholar]
- Peleg M (2021) Microbial dose-response curves and disinfection efficacy models revisited. Food Eng Rev (in press)
- Peleg M, Cole MB. Reinterpretation of microbial survival curves. Crit Rev Food Sci Nutr. 1998;38:353–380. doi: 10.1080/10408699891274246. [DOI] [PubMed] [Google Scholar]
- Peleg M, Penchina CM. Modeling microbial survival during exposure to a lethal agent with varying intensity. Crit Rev Food Sci Nutr. 2000;42:159–172. doi: 10.1080/10408690091189301. [DOI] [PubMed] [Google Scholar]
- Rattanakul S, Oguma K, Takizawa S. Sequential and simultaneous applications of UV and chlorine for adenovirus inactivation. Food Environ Virol. 2015;7:295–304. doi: 10.1007/s12560-015-9202-8. [DOI] [PubMed] [Google Scholar]
- Rossi R, Antonelli M, Mezzanotte V, Nurizzo C. Peracetic acid disinfection: a feasible alternative to wastewater chlorination. Water Environ Res. 2007;79:341–350. doi: 10.2175/106143006X101953. [DOI] [PubMed] [Google Scholar]
- Santoro D, Gehr R, Bartrand TA, Liberti L, Notarnicola M, Dell’Erba A, Falsanisi D, Haas CN. Wastewater disinfection by peracetic acid: assessment of models for tracking residual measurements and inactivation. Water Environ Res. 2007;79:775–787. doi: 10.2175/106143007X156817. [DOI] [PubMed] [Google Scholar]
- Schijven J, Teunis P, Suylen T, Ketelaars H, Hornstra L, Rutjes S. Water Res. 2019;158:34–35. doi: 10.1016/j.watres.2019.03.090. [DOI] [PubMed] [Google Scholar]
- Van Boekel MAJS. On the use of the Weibull model to describe thermal inactivation of microbial vegetative cells. Int J Food Microbiol. 2002;74:139–159. doi: 10.1016/S0168-1605(01)00742-5. [DOI] [PubMed] [Google Scholar]
- Walck C (2007) Handbook on statistical distribution for experimentalists, University of Stockholm October (Available at http://www.stat.rice.edu/~dobelman/textfiles/DistributionsHandbook.pdf)
- Watson HE. A note on variation of the rate of disinfection with change in the concentration of the disinfectant. Epidemiol Infect. 1908;8:536–542. doi: 10.1017/S0022172400015928. [DOI] [PMC free article] [PubMed] [Google Scholar]
- Younas H, Qazi IA, Hashmi I, Awan MA, Mahmood A, Qayyum HA. Wastewater disinfection by peracetic acid: assessment of models for tracking residual measurements and inactivation. Environ Sci Pollut Res. 2014;21:740–752. doi: 10.1007/s11356-013-1980-7. [DOI] [Google Scholar]


