Abstract
Shade caused by the proximity of neighboring vegetation triggers a set of acclimation responses to either avoid or tolerate shade. Comparative analyses between the shade‐avoider Arabidopsis thaliana and the shade‐tolerant Cardamine hirsuta revealed a role for the atypical basic‐helix‐loop‐helix LONG HYPOCOTYL IN FR 1 (HFR1) in maintaining the shade tolerance in C. hirsuta, inhibiting hypocotyl elongation in shade and constraining expression profile of shade‐induced genes. We showed that C. hirsuta HFR1 protein is more stable than its A. thaliana counterpart, likely due to its lower binding affinity to CONSTITUTIVE PHOTOMORPHOGENIC 1 (COP1), contributing to enhance its biological activity. The enhanced HFR1 total activity is accompanied by an attenuated PHYTOCHROME INTERACTING FACTOR (PIF) activity in C. hirsuta. As a result, the PIF‐HFR1 module is differently balanced, causing a reduced PIF activity and attenuating other PIF‐mediated responses such as warm temperature‐induced hypocotyl elongation (thermomorphogenesis) and dark‐induced senescence. By this mechanism and that of the already‐known of phytochrome A photoreceptor, plants might ensure to properly adapt and thrive in habitats with disparate light amounts.
Keywords: Cardamine hirsuta, HFR1, PIFs, shade avoidance, shade tolerance
Subject Categories: Ecology, Plant Biology, Signal Transduction
Modulation of the stability and COP1 interaction of the photomorphogenesis regulator HFR1 regulates shade tolerance differences in Arabidopsis and C. hirsuta seedlings.

Introduction
Acclimation of plants to adjust their development to the changing environment is of utmost importance. This acclimation relies on the plant’s ability to perceive many cues such as water, nutrients, temperature, or light. Conditions in nature often involve simultaneous changes in multiple light cues leading to an interplay of various photoreceptors to adjust plant growth appropriately (Pierik & Testerink, 2014; Mazza & Ballare, 2015; de Wit et al, 2016; Ballare & Pierik, 2017; Fiorucci & Fankhauser, 2017). Nearby vegetation can impact both light quantity and quality. Under a canopy, light intensity is decreased and its quality is changed as the overtopping green leaves strongly absorb blue and red light (R) but reflect far‐red light (FR). As a consequence, plants growing in forest understories receive less light of a much lower R to FR ratio (R:FR) than those growing in open spaces. In dense plant communities, FR reflected by neighboring plants also decreases R:FR but typically without changing light intensity. We refer to the first situation as canopy shade (very low R:FR) and the second as proximity shade (low R:FR). In general, two strategies have emerged to deal with shade: avoidance and tolerance (Valladares & Niinemets, 2008; Gommers et al, 2013; Pierik & Testerink, 2014). Shade avoiders usually promote elongation of organs to outgrow the neighbors and avoid light shortages, reduce the levels of photosynthetic pigments to cope to light shortage, and accelerate flowering to ensure species survival (Casal, 2013). The set of responses to acclimate to shade is collectively known as the shade avoidance syndrome (SAS). In contrast, shade‐tolerant species usually lack the promotion of elongation growth in response to shade and have developed a variety of traits to acclimate to low light conditions and optimize net carbon gain (Smith, 1982; Valladares & Niinemets, 2008).
In Arabidopsis thaliana, a shade‐avoider plant, low R:FR is perceived by phytochromes. Among them, phyA has a negative role in elongation, particularly under canopy shade, whereas phyB inhibits elongation inactivating PHYTOCHROME INTERACTING FACTORS (PIFs), members of the basic‐helix‐loop‐helix (bHLH) transcription factor family that promote elongation growth. In particular, PIFs induce hypocotyl elongation by initiating an expression cascade of genes involved in auxin biosynthesis and signaling [e.g., YUCCA 8 (YUC8), YUC9, INDOLE‐3‐ACETIC ACID INDUCIBLE 19 (IAA19), IAA29], and other processes related to cell elongation [e.g., XYLOGLUCAN ENDOTRANSGLYCOSYLASE 7 (XTR7)]. Genetic analyses indicated that PIF7 is the key PIF regulator of the low R:FR‐induced hypocotyl elongation with PIF4 and PIF5 having important contributions. Indeed, pif7 mutant responds poorly to low R:FR compared to the pif4 pif5 double or pif1 pif3 pif4 pif5 quadruple (pifq) mutants, but the triple pif4 pif5 pif7 mutant is almost unresponsive to low R:FR (Lorrain et al, 2008; Li et al, 2012; de Wit et al, 2016; van Gelderen et al, 2018). PhyB‐mediated shade signaling involves other transcriptional regulators, such as LONG HYPOCOTYL IN FR 1 (HFR1), PHYTOCHROME RAPIDLY REGULATED 1 (PAR1), BIM1, ATHB4, or BBX factors, that either promote or inhibit shade‐induced hypocotyl elongation (Sessa et al, 2005; Roig‐Villanova et al, 2007; Sasidharan & Pierik, 2010; Cifuentes‐Esquivel et al, 2013; Bou‐Torrent et al, 2014; Gallemi et al, 2017; Yang & Li, 2017). HFR1, a member of the bHLH family, is structurally related to PIFs but lacks the phyB‐ and DNA‐binding ability that PIFs possess (Galstyan et al, 2011; Hornitschek et al, 2012). HFR1 inhibits PIF activity by heterodimerizing with them, as described for PIF1 (Shi et al, 2013), PIF3 (Fairchild et al, 2000), PIF4, and PIF5 (Hornitschek et al, 2009), Heterodimerization with HFR1 prevents PIFs from binding to the DNA and altering gene expression. In this manner, HFR1 acts as a transcriptional cofactor that modulates SAS responses, e.g., it inhibits hypocotyl elongation in seedlings in a PIF‐dependent manner, forming the PIF‐HFR1 transcriptional regulatory module (Galstyan et al, 2011).
What mechanistic and regulatory adjustments in shade signaling are made between species to adapt to plant shade is a topic that has not received much attention until now. This question has been recently addressed performing comparative analyses between phylogenetically related species. In two related Geranium species that showed petioles with divergent elongation responses to shade, transcriptomic analysis led to propose that differences in expression of three factors, FERONIA, THESEUS1, and KIDARI, shown to activate SAS elongation responses in A. thaliana, might be part of the adjustments necessary to acquire a shade‐avoiding or tolerant habit (Gommers et al, 2017). When comparing two related mustard species that showed divergent hypocotyl elongation response to shade, A. thaliana and Cardamine hirsuta (Hay et al, 2014), molecular and genetic analyses indicated that phyA, and to a lesser extent phyB, contributed to establish this divergent response. In particular, the identification and characterization of the C. hirsuta phyA‐deficient slender in shade 1 (sis1) mutant indicated that differential features of this photoreceptor in A. thaliana and C. hirsuta could explain their differential response to shade. Thus, stronger phyA activity in C. hirsuta wild‐type plants resulted in a suppressed hypocotyl elongation response when exposed to low or very low R:FR (Molina‐Contreras et al, 2019). These approaches indicated that the implementation of shade avoidance and shade tolerance involved the participation of shared genetic components. They also suggest that other responses co‐regulated by these shared components will be accordingly affected.
With this frame of reference, we asked whether the phyB‐dependent PIF‐HFR1 module was also relevant to shape the shade response habits in different plant species. We found that C. hirsuta plants deficient in ChHFR1 gained a capacity to elongate in response to shade. We also report that AtHFR1 and ChHFR1 are expressed at different levels and encode proteins with different protein stability, caused by their different binding affinities with CONSTITUTIVE PHOTOMORPHOGENIC 1 (COP1), known to affect AtHFR1 stability under shade (Pacin et al, 2016). We propose that adaptation to plant shade in A. thaliana and C. hirsuta relies on the PIF‐HFR1 regulatory module. As PIFs regulate several other processes, we hypothesized that a set of responses co‐regulated by the PIF‐HFR1 module are also affected and associated with the shade‐avoidance and shade‐tolerant habits. After exploring this possibility, we found that thermoregulation of hypocotyl elongation and dark‐induced senescence, two well‐known PIF‐regulated responses (Koini et al, 2009; Stavang et al, 2009; Sakuraba et al, 2014), is consistently affected in C. hirsuta.
Results
HFR1 is required for the shade tolerance habit of Cardamine hirsuta
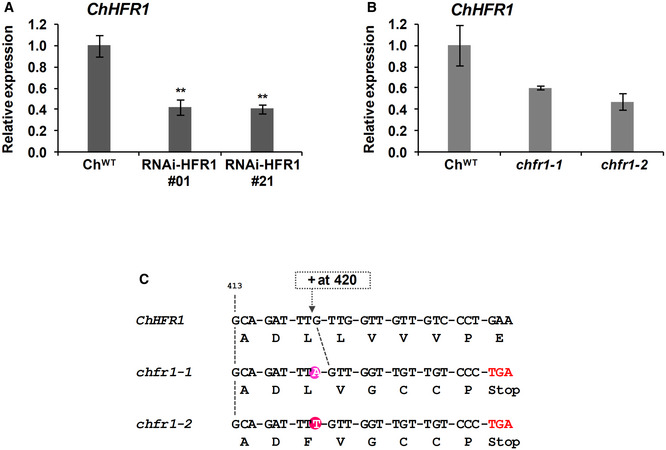
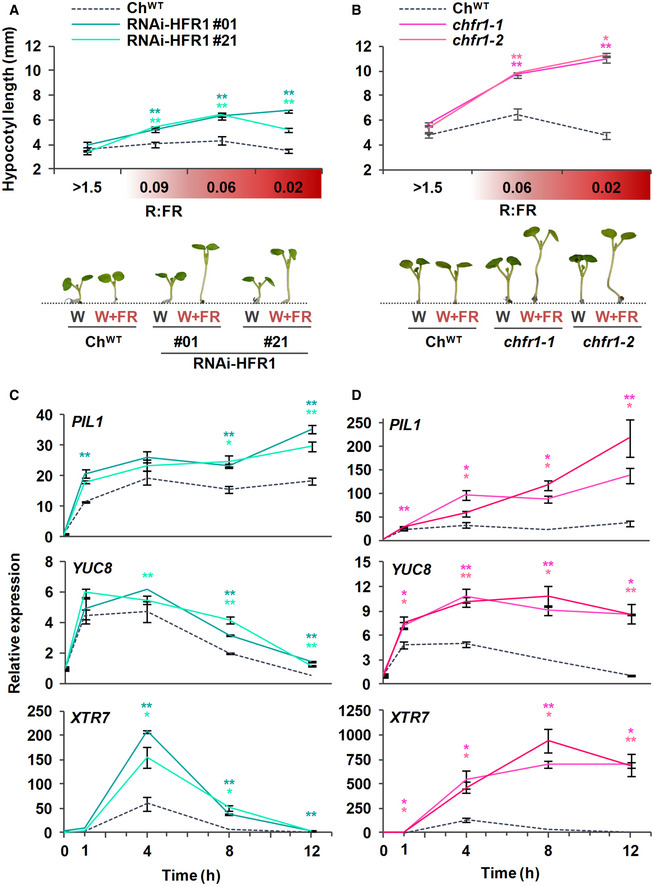
First, we wanted to determine if HFR1 has a role in the shade‐tolerance habit of C. hirsuta, i.e., whether ChHFR1 contributes to inhibit hypocotyl elongation when this species is exposed to shade. For this purpose, we generated several C. hirsuta RNAi lines to downregulate HFR1 expression (RNAi‐HFR1 lines). As expected, ChHFR1 expression was attenuated in seedlings of two RNAi‐HFR1 selected lines (#01 and #21) compared to the wild type (ChWT) (Fig EV1A). When growing under white light (W) of high R:FR (> 1.5), hypocotyl length of these two RNAi‐HFR1 lines was undistinguishable from ChWT (Fig 1A). By contrast, under W supplemented with increasing amounts of FR (W + FR) resulting in moderate (0.09), low (0.05–0.06), and very low (0.02) R:FR (that simulated proximity and canopy shade) (Martinez‐Garcia et al, 2014), the hypocotyl elongation of RNAi‐HFR1 seedlings was significantly promoted compared to ChWT, which was unresponsive (Fig 1A).
Figure EV1. Characterization of RNAi‐HFR1 and chfr1 mutants in Cardamine hirsuta .
-
A, BRelative expression levels of ChHFR1 gene, normalized to EF1α in ChWT, (A) two RNAi‐HFR1 lines (#01 and #21) and (B) the two chfr1 mutants of C. hirsuta. Seedlings were grown for 7 days in W. Expression values are the mean ± SE of three independent biological replicates relative to ChWT. Asterisks mark significant differences (Student t‐test: **P‐value < 0.01) relative to ChWT.
-
CThe two identified chfr1‐1 and chfr1‐2 mutants have one nucleotide insertion at position 420 of the ChHFR1 ORF, which leads to a frame shift and a premature stop codon.
Figure 1. Hypocotyls of Cardamine hirsuta seedlings with reduced levels of ChHFR1 strongly elongate in response to simulated shade.
-
A, BHypocotyl length of ChWT, (A) RNAi‐ChHFR1 transgenic, and (B) chfr1 mutant seedlings grown under different R:FR. Seedlings were grown for 7 days in continuous W (R:FR > 1.5) or for 3 days in W then transferred to W supplemented with increasing amounts of FR (W + FR) for 4 more days, producing various R:FR. Aspect of representative 7‐day‐old ChWT, RNAi‐HFR1 and chfr1‐1 seedlings grown in W or W + FR (R:FR, 0.02), as indicated, is shown in lower panel.
-
C, DEffect of W + FR exposure on the expression of PIL1, YUC8, and XTR7 genes in seedlings of ChWT, (C) RNAi‐HFR1, and (D) chfr1 mutant lines. Expression was analyzed in 7‐day‐old W‐grown seedlings transferred to W + FR (R:FR, 0.02) for 0, 1, 4, 8, and 12 h. Transcript abundance is normalized to EF1α levels.
Data information: Values are the means ± SE of three independent biological replicates relative to ChWT value at 0 h. Asterisks mark significant differences (Student's t‐test: **P‐value < 0.01; *P‐value < 0.05) relative to ChWT value at the same time point.
Using CRISPR‐Cas9, we obtained two mutant lines of ChHFR1 (named chfr1‐1 and chfr1‐2) with a single nucleotide insertion in their sequence leading to a premature stop codon (Fig EV1C). These mutants showed a non‐significant decrease of ChHFR1 expression in W‐grown seedlings (Fig EV1B). Similar to the RNAi‐HFR1 lines, their hypocotyls were undistinguishable from ChWT under W but elongated strongly in response to W + FR exposure (Fig 1B), showing a slender in shade (sis) phenotype. Together, we concluded that HFR1 represses hypocotyl elongation in response to shade in C. hirsuta.
Exposure of A. thaliana wild‐type (AtWT) and ChWT seedlings to low R:FR induces a rapid increase in the expression of various direct target genes of PIFs, including PIF3‐LIKE 1 (PIL1), YUC8, and XTR7 (Fig 1C and D) (Ciolfi et al, 2013; Hersch et al, 2014; Molina‐Contreras et al, 2019). The shade‐induced expression of these genes was significantly higher in RNAi‐HFR1 and chfr1 mutant lines compared to ChWT (Fig 1C and D), indicating that ChHFR1 might repress shade‐triggered hypocotyl elongation in part by downregulating the rapid shade‐induced expression of these genes in C. hirsuta, as it was observed with AtHFR1 in A. thaliana seedlings (Hornitschek et al, 2009).
HFR1 expression is higher in Cardamine hirsuta than in Arabidopsis thaliana seedlings
To test if the lack of elongation of ChWT hypocotyls in response to shade was caused by higher levels of ChHFR1 expression in this species, we used primer pairs that amplify HFR1 (Fig EV2A) and three housekeeping genes (EF1α, SPC25, YLS8) in both species (Molina‐Contreras et al, 2019). As expected, expression of HFR1 was induced in shade‐treated seedlings of both species, in agreement with the presence of canonical PIF‐binding sites (G‐box, CACGTG) in the HFR1 promoters (Martinez‐Garcia et al, 2000; Hornitschek et al, 2009; Fig EV3A). More importantly, ChHFR1 transcript levels were always higher than those of AtHFR1 during the whole period analyzed (from days 3 to 7) (Fig 2). Because HFR1 is part of the PIF‐HFR1 regulatory module, we next compared transcript levels of PIF genes in both species. PIF7 expression was significantly lower in C. hirsuta than in A. thaliana in either W or W + FR during the period analyzed (Fig 2). By contrast, PIF4 expression was higher in C. hirsuta than in A. thaliana, whereas that of PIF5 was similar in both species (Fig EV2B). Together, these results indicated that whereas HFR1 expression is enhanced, that of PIF7 is globally attenuated in ChWT compared to AtWT seedlings. As a consequence, the PIF‐HFR1 transcriptional module might be differently balanced in these species, with HFR1 imposing a stronger suppression on the PIF7‐driven hypocotyl elongation in the shade‐tolerant C. hirsuta seedlings.
Figure EV2. Alignments of HFR1, PIF4, PIF5, and PIF7 partial DNA sequences in Arabidopsis thaliana and Cardamine hirsuta .
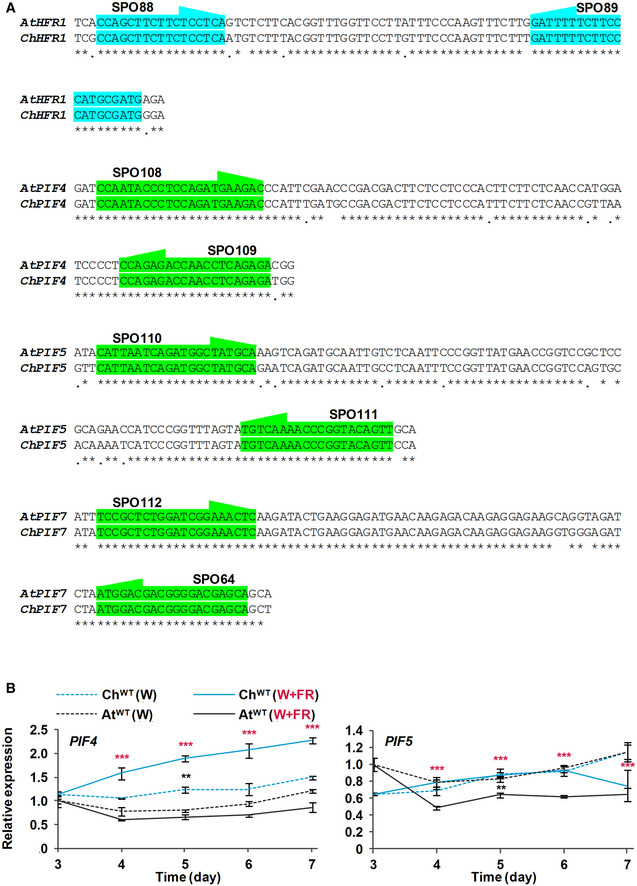
- Location of shared primers and amplicons used for comparison of expression levels by RT‐qPCR between species.
- Transcript abundance of PIF4 and PIF5, normalized to YLS8, SPC25, and EF1α in ChWT and AtWT grown as in Fig 2. Expression values are the means ± SE of three independent biological replicates relative to the data of AtWT grown in continuous W at day 3. Asterisks mark significant differences (2‐way ANOVA: **P‐value < 0.01, ***P‐value < 0.001) between ChWT and AtWT when grown under W (black asterisks) or W + FR (red asterisks).
Figure EV3. ChHFR1 and AtHFR1 complement the Arabidopsis thaliana hfr1‐5 mutant long hypocotyl phenotype.
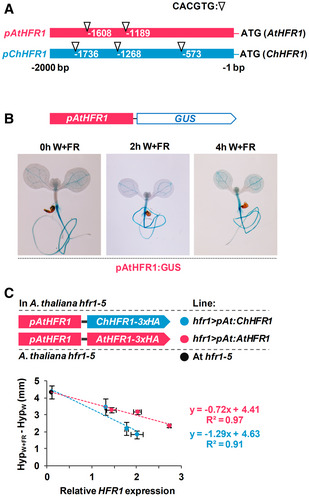
- Cartoon of HFR1 promoters from A. thaliana (pAtHFR1) and C. hirsuta (pChHFR1). These promoters cover 2,000 bp from the beginning of the translation start of the two HFR1 genes. The positions of G‐boxes (CACGTG) are indicated with arrows.
- GUS staining of representative A. thaliana seedlings expressing GUS under the pAtHFR1 (line #03). Seven‐day‐old W‐grown seedlings were treated with W + FR for the indicated amount of time.
- Correlation between HypW+FR‐HypW (means ± SE of at least four biological replicates, data shown in Fig 3C) and relative levels of ChHFR1 or AtHFR1 expression (means ± SE of three biological replicates, data shown in Fig 3B). The estimated regression equations and the R 2 values are shown for each plot.
Figure 2. Levels of HFR1 transcript are higher in Cardamine hirsuta than Arabidopsis thaliana seedlings.
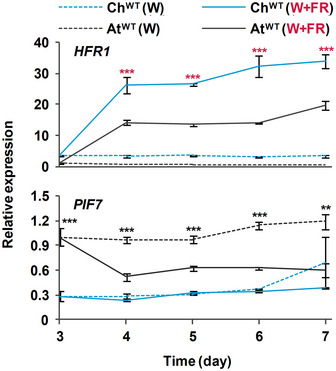
Seedlings of ChWT and AtWT were grown for 3 days in W then either kept under the same conditions or transferred to W + FR (R:FR, 0.02) for the indicated times. Plant material was harvested every 24 h. Transcript abundance of HFR1 and PIF7 was normalized to three reference genes (EF1α, SPC25, and YLS8). Expression values are the means ± SE of three independent biological replicates relative to the data of AtWT grown in continuous W at day 3. Asterisks mark significant differences (2‐way ANOVA: **P‐value < 0.01, ***P‐value < 0.001) between ChWT and AtWT when grown under W (black asterisks) or W + FR (red asterisks).
ChHFR1 protein is more stable than AtHFR1
A higher specific activity of ChHFR1 compared to its orthologue AtHFR1 might also contribute to the role of this transcriptional cofactor in maintaining the shade tolerance habit of C. hirsuta. To test this possibility, we transformed A. thaliana hfr1‐5 plants with constructs to express either AtHFR1 or ChHFR1 fused to the 3x hemagglutinin tag (3xHA). These genes were expressed under the transcriptional control of the 2 kb of the AtHFR1 promoter (pAt), generating hfr1>pAt:ChHFR1 and hfr1>pAt:AtHFR1 lines (Fig 3A). Fusion of pAt to the GUS reporter gene resulted in GUS activity in cotyledons and roots of transgenic lines, with increased levels in hypocotyls of seedlings exposed for 2–4 h to W + FR (Fig EV3B). Several independent transgenic lines of each construct were analyzed for hypocotyl length (Appendix Fig S1), HFR1 transcript levels and 3xHA‐tagged protein abundance. In these lines, HFR1 biological activity was estimated as the difference in hypocotyl length of seedlings grown under W + FR (HypW+FR) and W (HypW) (HypW+FR‐HypW) (Molina‐Contreras et al, 2019). The potential to suppress the hypocotyl elongation in shade below that of hfr1‐5 seedlings would depend on the transcript level of HFR1 and/or its protein levels. The hfr1>pAt:ChHFR1 lines had shorter hypocotyls in shade (i.e., stronger global HFR1 activity) compared to hfr1>pAt:AtHFR1 lines of similar HFR1 expression levels (Figs 3B and C, and EV3C), suggesting that total HFR1 activity was higher in hfr1>pAt:ChHFR1 than in hfr1>pAt:AtHFR1 lines. However, we observed much higher abundance of HFR1‐3xHA protein after shade exposure in hfr1>pAt:ChHFR1 lines than in hfr1>pAt:AtHFR1 lines with comparable levels of HFR1 expression (Fig 3D), suggesting that the ChHFR1 protein might be much more stable. Together, these results point to differences in protein stability (rather than in specific activity) as the main cause for the enhanced HFR1 total activity of ChHFR1 compared to AtHFR1 in complemented lines.
Figure 3. The activity of ChHFR1 is higher than that of AtHFR1 in Arabidopsis thaliana seedlings.
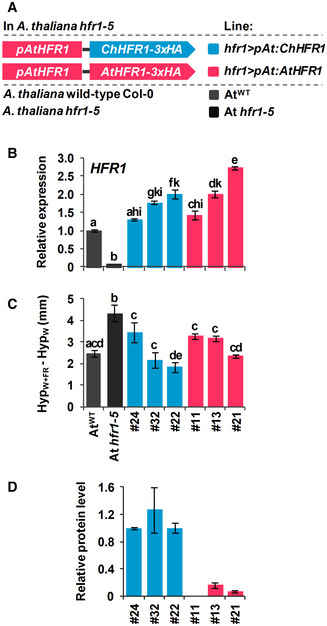
- Cartoon of constructs containing ChHFR1 or AtHFR1 under the HFR1 promoter of Arabidopsis thaliana (pAtHFR1) used to complement hfr1‐5 mutant of A. thaliana (At hfr1‐5).
- Relative expression of HFR1 in seedlings of AtWT, At hfr1‐5, hfr1>pAt:ChHFR1 (in blue), and hfr1>pAt:AtHFR1 (in red) lines grown under W + FR (R:FR, 0.02). Expression values are the means ± SE of three independent biological replicates relative to the data of 7 days old AtWT. Transcript abundance is normalized to UBQ10 levels.
- Elongation response of seedlings of the indicated lines grown for 7 days in continuous W or 2 days in W then transferred for 5 days to W + FR (R:FR, 0.02). The mean hypocotyl length in W (HypW) and W + FR (HypW+FR) of at least four biological replicates was used to calculate HypW+FR‐HypW. Error bars represent SE.
- Relative HFR1 protein levels in seedlings of the indicated lines, normalized to actin protein levels, are the means ± SE of three independent biological replicates relative to hfr1>pAt:ChHFR1 line #22 that is taken as 1. Seedlings were grown for 7 days in continuous W (~ 20 µmol/m2·s1) after which they were incubated for 3 h in high W (~ 100 µmol/m2·s1) and transferred to W + FR (R:FR, 0.06) for 3 h.
Data information: Different letters denote significant differences (one‐way ANOVA with the Tukey test, P‐value < 0.05) among means.
Source data are available online for this figure.
AtHFR1 stability is affected by light conditions. In etiolated seedlings, exposure to W promotes stabilization and accumulation of AtHFR1, whereas in W‐grown seedlings, high intensity of W increases its abundance (Duek et al, 2004; Yang et al, 2005). Importantly, AtHFR1 stability has a strong impact on its biological activity as overexpression of stable forms of this protein leads to phenotypes resulting from enhanced HFR1 activity (Yang et al, 2005; Galstyan et al, 2011). As AtHFR1 and ChHFR1 primary structures are globally similar (Fig EV4A), we aimed to test if ChHFR1 stability is also light‐dependent. We first examined ChHFR1 protein accumulation in response to different W intensities in seedlings of an A. thaliana hfr1‐5 line that constitutively express ChHFR1 (hfr1>35S:ChHFR1) (Fig EV4B). When grown in our normal W conditions (~ 20 µmol/m2·s1), these seedlings accumulated low but detectable levels of ChHFR1; when transferred to higher W intensity (~ 100 µmol/m2·s1), ChHFR1 levels increased 10‐fold (Fig EV4C). As ChHFR1 is expressed under the constitutive 35S promoter, these results indicate that ChHFR1 protein accumulation is induced by high W intensity, as it has been described for AtHFR1 (Yang et al, 2005). This prompted us to pretreat W‐grown seedlings with 3 h of high W intensity in all our subsequent experiments to analyze ChHFR1 levels.
Figure EV4. ChHFR1 protein accumulates in high W.
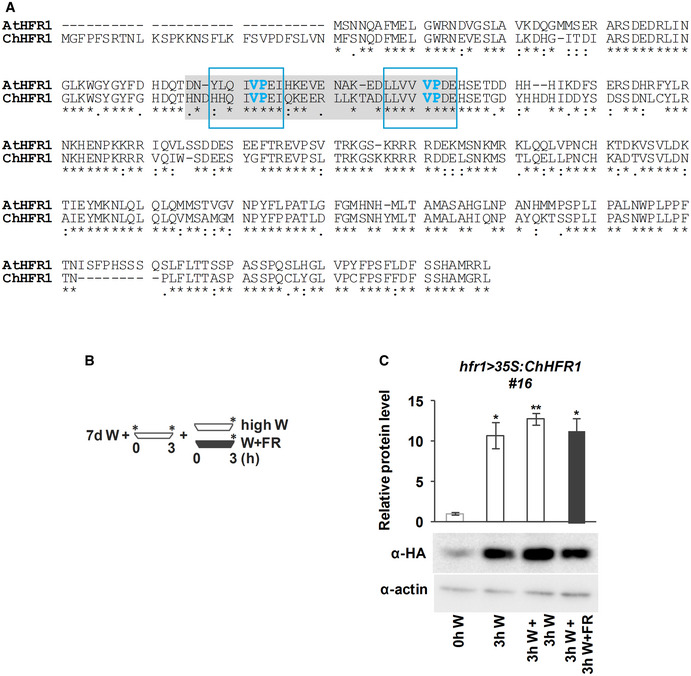
- Alignment of AtHFR1 and ChHFR1 protein sequences. Putative COP1 interacting motifs, defined in AtHFR1, are highlighted with a light gray box. VP motifs are highlighted with blue letters. Amino acid sequences inside the blue line rectangles correspond to the synthetic AtHFR1, ChHFR1, and At/ChHFR1 VP peptides used in the microscale thermophoresis assays (Appendix Table S3).
- Cartoon representing the light treatments given to seedlings to estimate relative HFR1‐3xHA levels. Seedlings grown for 7 days in low W (~ 20 µmol/m2·s1, R:FR ≈ 6.4) were first moved to high W (~ 100 µmol/m2·s1, R:FR ≈ 3.9) for 3 h and then either transferred to high W (control) or high W + FR (R:FR ≈ 0.06) for 3 h. Seedling samples were collected at the time points indicated with asterisks.
- Relative HFR1‐3xHA protein levels of hfr1>35S:ChHFR1 seedlings (line #16) grown as indicated in B, with a representative immunoblot in a lower panel. Relative protein levels are the mean ± SE of three independent biological replicates relative to the data point of 0 h in high W (0 h W). Asterisks mark significant differences in protein levels (Student t‐test: **P‐value < 0.01; *P‐value < 0.05) relative to the 0 h W value.
Source data are available online for this figure.
Next, we exposed hfr1>pAt:ChHFR1 (line #22) and hfr1>pAt:AtHFR1 (line #13) seedlings to W + FR (Fig 4A). Although HFR1 expression in both lines was similarly induced after 3 h of W + FR, hfr1>pAt:ChHFR1 line displayed higher levels of recombinant HFR1 protein compared to hfr1>pAt:AtHFR1 line after 3–6 h of W + FR exposure (Fig 4A), suggesting a higher stability of the C. hirsuta protein compared to the A. thaliana orthologue. ChHFR1 protein is more abundant than AtHFR1 also when transiently expressed to comparable levels in Nicotiana benthamiana (tobacco) leaves (Fig 4B and C). This indicates that the higher abundance of ChHFR1 is an intrinsic property of the protein that resides in its primary structure.
Figure 4. ChHFR1 and AtHFR1 proteins show different stability in shade.
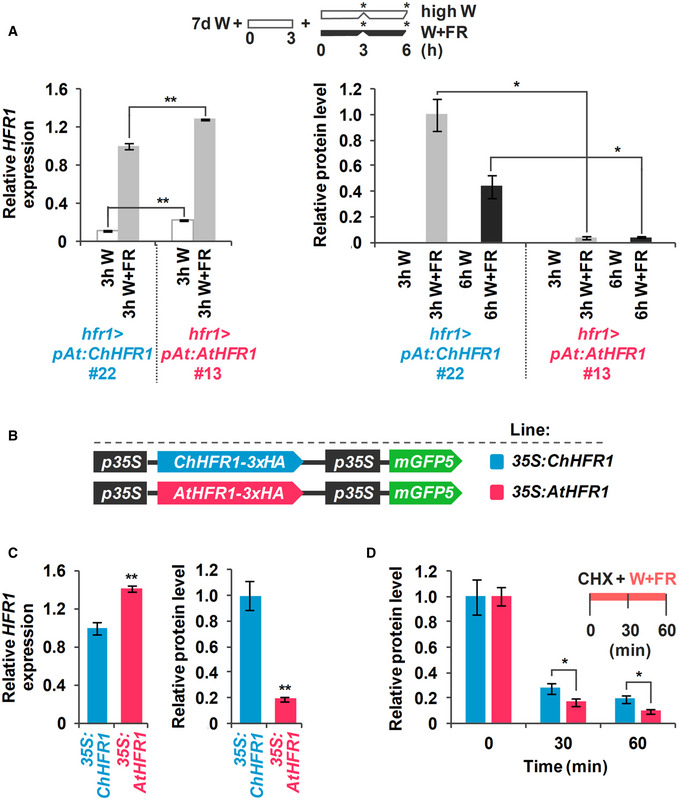
- Expression of HFR1 and protein levels of HFR1‐3xHA in seedlings of hfr1>pAt:ChHFR1 (line #22) and hfr1>pAt:AtHFR1 (line #13). Seedlings were grown for 7 days in continuous W (~ 20 µmol/m2·s1) after which they were incubated for 3 h in high W (~ 100 µmol/m2·s1) and then either kept at high W or transferred to W + FR (R:FR, 0.06) for 3 or 6 h, as indicated in the cartoon at the top. Relative HFR1 transcript levels, normalized to UBQ10, are the means ± SE of three independent biological replicates relative to hfr1>pAt:ChHFR1 #22 grown for 3 h under W + FR. Relative protein levels, normalized to actin, are the means ± SE of three independent biological replicates relative to hfr1>pAt:ChHFR1 #22. Samples were collected at data points marked in the cartoon with asterisks.
- Cartoon of constructs containing ChHFR1 or AtHFR1 under the 35S promoter used for transient expression of transgenes in N. benthamiana leaves.
- Relative HFR1 transcript levels transiently expressed in tobacco leaves, normalized to the GFP, are the means ± SE of three independent biological replicates (left). Relative HFR1 protein levels, normalized to the GFP levels, are the means ± SE of four independent biological replicates (right). In (A) and (C), asterisks mark significant differences (Student's t‐test: *P‐value < 0.05, **P‐value < 0.01) between the indicated pairs.
- Degradation of ChHFR1 (35S:ChHFR1) and AtHFR1 (35S:AtHFR1) in tobacco leaf disks treated with cycloheximide (CHX, 100 µM) for the indicated times. Tobacco plants were kept under high W (~ 200 µmol/m2·s1) for 3 days after agroinfiltration and then leaf circles were treated with W + FR (R:FR, 0.2) and CHX. Relative HFR1 protein levels (ChHFR1, blue bars; AtHFR1, red bars), normalized to the GFP levels, are the means ± SE of four biological replicates relative to data point 0, taken as 1 for each line. Asterisks mark significant differences (2‐way ANOVA: *P‐value < 0.05) between ChHFR1 and AtHFR1 at the same time point.
Source data are available online for this figure.
AtHFR1 is known to be targeted for degradation via the 26S proteasome in dark‐grown seedlings. Shade also promotes AtHFR1 degradation compared to non‐shade treatments (Pacin et al, 2016). Hence, ChHFR1 abundance might be similarly targeted, and the increased ChHFR1 protein stability might be due to differences in degradation kinetics, likely by the 26S proteasome. We addressed this possibility by treating tobacco leaf disks overexpressing ChHFR1 and AtHFR1 with the protein synthesis inhibitor cycloheximide (CHX) combined with shade (Fig 4D). This treatment resulted in a decrease in ChHFR1 and AtHFR1 protein levels. However, ChHFR1 degradation was significantly slower than that of AtHFR1 (Fig 4D), supporting that changes in degradation kinetics likely contribute to the observed differences in stability between ChHFR1 and AtHFR1.
Light‐ and shade‐regulated degradation of AtHFR1 requires binding to COP1 and the COP1 E3 ubiquitin ligase activity. Binding to COP1 results in HFR1 ubiquitination, which targets HFR1 for degradation via the 26S proteasome (Jang et al, 2005; Yang et al, 2005; Pacin et al, 2016). COP1‐interacting proteins harbor sequence‐divergent Val‐Pro (VP) motifs that bind the COP1 WD40 domain with different affinities (Lau et al, 2019).
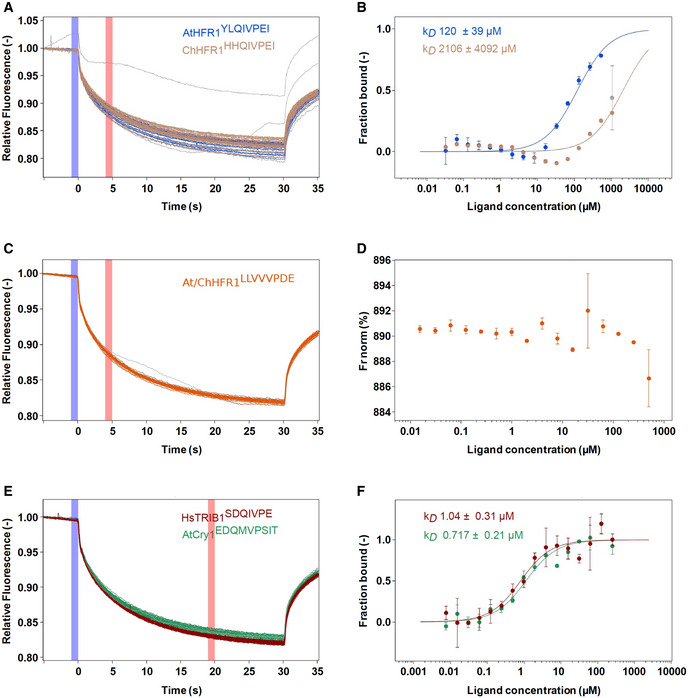
Inspection of the COP1 WD40–AtHFR1 complex structure (Lau et al, 2019) revealed that sequence differences between AtHFR1 and ChHFR1 map to the N‐terminus of the VP peptide involved in the interaction with COP1 (Fig 5A). We hypothesized that these sequence variations between HFR1 species may result in different COP1 binding affinities, affecting targeting and subsequent degradation of the two HFR1 orthologues. We thus quantified the interaction of synthetic AtHFR1 and ChHFR1 VP peptides with COP1 using microscale thermophoresis (MST, see Methods). AtHFR1 bound the COP1 WD40 domain with a dissociation constant (kD) of ~ 120 µM (Figs 5B and EV5). The ChHFR1 VP peptide showed only weak binding to COP1 WD40, with a kD in the millimolar range (Figs 5B and EV5). Importantly, a second putative VP sequence in At/ChHFR1 showed no detectable binding, while the previously characterized A. thaliana cryptochrome 1 (AtCRY1) and the human HsTRIB1 VP sequences bound COP1 WD40 with a kD in the ~ 1 µM range, in good agreement with earlier isothermal titration calorimetry binding assays (Figs 5B and EV5) (Lau et al, 2019). Taken together, AtHFR1 VP peptide interacted more strongly with COP1 WD40, suggesting that AtHFR1 may represent a better substrate for COP1 than ChHFR1.
Figure 5. AtHFR1 interacts more strongly than ChHFR1 with the WD40 domain of COP1.
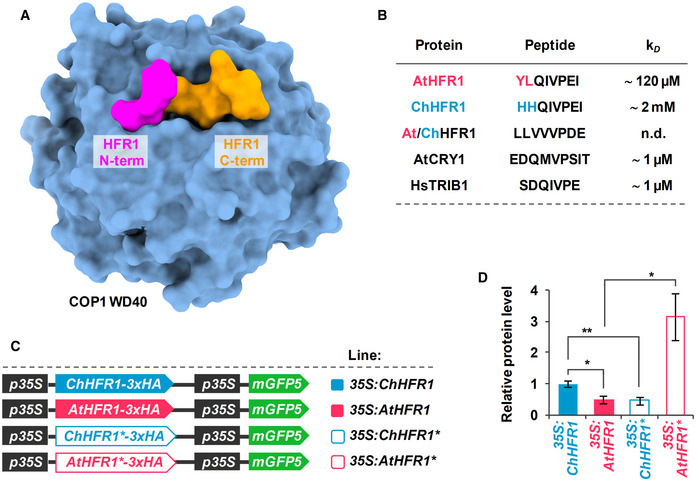
- Overview of the COP1 WD40‐AtHFR1 complex (PDB ID 6QTV). The COP1 WD40 domain and the AtHFR1 VP peptide are shown in surface representation and colored in blue and orange, respectively. The N‐terminus of HFR1 VP peptide, the amino acid of which differs between AtHFR1 and ChHFR1, is highlighted in magenta.
- Table summaries of the microscale thermophoresis binding assay (see Fig EV5). The sequence of the respective synthetic peptides is indicated.
- Cartoon of constructs containing ChHFR1, AtHFR1, ChHFR1* and AtHFR1* derivatives under the 35S promoter used for transient expression of transgenes in N. benthamiana leaves.
- Relative HFR1 protein levels, normalized to the GFP levels, are the means ± SE of four independent biological replicates. Asterisks mark significant differences (Student t‐test: *P‐value < 0.05, **P‐value < 0.01) between the indicated pairs.
Source data are available online for this figure.
Figure EV5. Microscale thermophoresis (MST) experimental traces and analysis.
-
A–FRaw MST traces and analysis of AtCOP1 WD40 with different peptides in triplicates (duplicates for At/ChHFR1 VP). The concentration of AtCOP1 WD40 is fixed at 0.15 μM mixed with 16 serially diluted peptide concentrations at 1:1 ratio. Panels A, C, and E show the normalized MST traces. The blue box area illustrates the fluorescence before activation of the infrared (IR) laser and red box area illustrates average fluorescence after activation of the IR laser. Average values ± SD (error bars) were subsequently used for fluorescence normalization. kD fit displaying fraction bound as a function of ligand concentration is shown in adjacent right panels B, D, and F. (A) Raw MST traces for AtHFR1 (in blue) and ChHFR1 (in light‐brown) VP peptides. Individual concentrations that showed slight aggregation or precipitation are shown in gray and were excluded from the kD fit calculation. (B) Fitted data over a concentration range from 0.032 to 500 μM for AtHFR1 VP (blue dots) and 0.032 to 1,000 μM for ChHFR1 VP (light‐brown dots) were used to derive the corresponding dissociation constant kD. (C) Raw MST traces for At/ChHFR1 VP peptide (in orange). One concentration that showed slight precipitation or aggregation is shown in gray. A concentration range of 0.0154 to 506 μM was used for the At/ChHFR1 VP. (D) No kD was determined, as no binding between COP1 WD40 and the At/ChHFR1 VP peptide (orange dots) was detected. (E) A concentration range from 0.0076 to 250 μM for HsTRIB1 (in red) and AtCRY1 (in green) peptides was used. Raw MST traces show no aggregation or precipitation effects during this binding. One AtCRY1 VP outlier is shown in gray. (F) The kD for HsTRIB1 (brown dots) and AtCRY1 (green dots) VP peptides was calculated using the normalized traces.
Next, we aimed to explore if these differences in COP1 affinity had an impact in the subsequent degradation of AtHFR1 and ChHFR1 proteins. To test this possibility, we generated chimeric HFR1 genes in which the VP region was swapped, named as ChHFR1* and AtHFR1* (Fig 5C). ChHFR1* differed from ChHFR1 in the VP region, that was substituted for the AtHFR1‐VP1. Reciprocally, AtHFR1* contained the ChHFR1‐VP region. Like the wild‐type versions, these HFR1 derivative genes were fused to the 3xHA and placed under the control of the 35S promoter (Fig 5C). When transiently expressed in tobacco leaves, ChHFR1* was now less abundant than AtHFR1*, suggesting that the VP regions contain enough information to determine the pattern of stability of the resulting HFR1 protein (Fig 5D). Because AtHFR1‐VP1 binds to COP1 WD40 domain with higher affinity than ChHFR1‐VP1, these results indicate a negative correlation of the binding affinity to COP1 with the accumulation (i.e., the higher the affinity the lower the accumulation). Hence, we concluded that in the HFR1 context, a stronger binding to COP1 results in lower abundance.
HFR1 interacts with PIF7
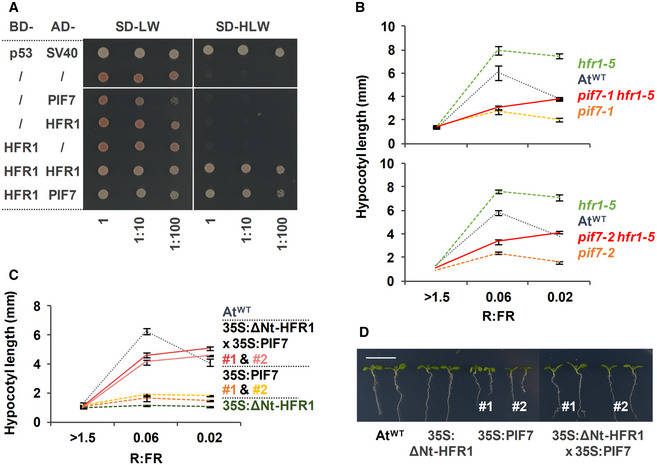
AtHFR1 has been shown to interact with all the members of the photolabile AtPIF quartet (PIF1, PIF3, PIF4, and PIF5). Using a yeast two‐hybrid (Y2H) assay, we observed that AtHFR1 homodimerized, which indicated that its HLH domain is functional in this assay (Fig 6A). In the same assay, AtHFR1 was also shown to interact with AtPIF7 (Fig 6A). These results agree with recent data (Zhang et al, 2019). Because AtPIF7 is the main PIF in A. thaliana promoting hypocotyl elongation in response to low R:FR (Li et al, 2012), we aimed to address whether HFR1 also interacts genetically with PIF7. First, we analyzed the genetic interaction between AtHFR1 and AtPIF7. After crossing A. thaliana hfr1‐5 with pif7‐1 and pif7‐2 mutants, we analyzed the hypocotyl response of the obtained double mutants in different low R:FR conditions. As expected, hfr1 hypocotyls were longer and those of pif7 mutants were shorter compared to AtWT under both W + FR conditions used (Fig 6B). In W and low R:FR (0.06), double pif7 hfr1 mutant seedlings behaved mostly as pif7 single mutants. However, under very low R:FR (0.02), they elongated similar to AtWT hypocotyls (Fig 6B). Together, these results indicate that pif7 is epistatic over hfr1 under low R:FR, whereas it seems additive under very low R:FR, two conditions that we speculate as mimicking proximity and canopy shade, respectively (Martinez‐Garcia et al, 2014).
Figure 6. AtHFR1 interacts with AtPIF7.
-
AY2H growth assay showing the interaction between AtHFR1 and AtPIF7. The BD‐ and the AD‐derivative constructs used in the assay are shown on the left side of the panel. SD‐LW or SD‐HLW refer to the selective medium (plated as drops in dilutions of 1, 1:10, and 1:100) indicative of transformed cells or interaction between the hybrid proteins, respectively. Truncated forms of murine p53 (BD‐fused) and SV40 large T‐antigen (AD‐fused), known to interact, were used as a positive control. Empty vectors (/) were used as negative controls.
-
B, CHypocotyl length of seedlings of AtWT, (B) pif7‐1, hfr1‐5, pif7‐1 hfr1‐5 (top graph), pif7‐2, hfr1‐5, and pif7‐2 hfr1‐5 (bottom graph) mutants, and (C) transgenic 35S:GFP‐ΔNt‐HFR1 (35S:ΔNt‐HFR1), two lines of 35S:PIF7‐CFP (35S:PIF7 #1 and #2), and 35S:GFP‐ΔNt‐HFR1 35S:PIF7‐CFP double transgenic (35S:ΔNt‐HFR1 × 35S:PIF7 #1 and #2) seedlings grown under different R:FR. Seedlings were grown in W (R:FR > 1.5) for 7 days or for 2 days in W and then transferred to two W + FR treatments (R:FR 0.06 or 0.02) for 5 additional days. Values of hypocotyl length are the means ± SE of three independent biological replicates (at least 10 seedlings per replica).
-
DAspect of representative 7‐day‐old W‐grown seedlings shown in C. Scale bar is 1 cm.
To further analyze the HFR1‐PIF7 interaction, we aimed to test if HFR1 overexpression will interfere with PIF7 overexpression and impede its effects. For HFR1, we used a line overexpressing a stable but truncated form of the protein (missing the N‐terminal, 35S:GFP‐ΔNt‐HFR1, line #03) that strongly inhibits shade‐induced hypocotyl elongation in A. thaliana without affecting other aspects of the seedling development (Galstyan et al, 2011) (Fig 6C and D). For PIF7, we used two available 35S:PIF7‐CFP lines (#1 and #2) (Leivar et al, 2008) that were almost unresponsive to W + FR (Fig 6C) and smaller and less developed than the AtWT in W (Fig 6D). The inhibition of shade‐induced elongation observed in the 35S:PIF7‐CFP lines contrasts with the positive effect of growth observed by several other authors when overexpressing PIF7 fused to smaller tags (Flash‐tag peptide) (Li et al, 2012), likely caused by toxic or squelching effects caused by high levels of the PIF7‐CFP protein. In W, 35S:GFP‐ΔNt‐HFR1 35S:PIF7‐CFP double transgenic seedlings (#1 and #2) did not differ in hypocotyl length and general aspect with AtWT; interestingly, they did elongate clearly in low and very low R:FR (Fig 6C and D). The recovery of the shade‐induced hypocotyl elongation and size of the seedlings took place even though HFR1 transcript levels were significantly lower than in the 35S:GFP‐ΔNt‐HFR1 parental line. PIF7 transcript levels were not significantly different in the double transgenic seedlings than in their respective parental lines (Appendix Fig S2). Therefore, the inhibitory effect of PIF7‐CFP overexpression appeared to be counteracted by the overexpression of the truncated HFR1, further supporting the genetic interaction between HFR1 and PIF7 (Fig 6C and D).
Altogether, these analyses support that HFR1 and PIF7 interaction is important for the regulation of hypocotyl elongation in response to shade. These results are consistent with HFR1 functioning as a suppressor of PIF7.
HFR1 restrains PIF activity in Cardamine hirsuta
The similarity between shade‐induced and warm temperature‐induced hypocotyl elongation (thermomorphogenesis) suggests common underlying mechanisms. In A. thaliana, the increased activity of HFR1 at warm temperatures was previously shown to provide an important restraint on PIF4 action that drives elongation growth (Foreman et al, 2011). Similarly, we hypothesized that the increased activity of HFR1 in C. hirsuta might restrain PIF activity more efficiently and consequently alter thermomorphogenesis (Fig 7A). We analyzed this response by growing seedlings constantly at 22°C, 28°C, or transferred from 22°C to 28°C after day 2 (Fig 7B). Whereas warm temperature promoted hypocotyl elongation of AtWT seedlings compared to those growing at 22°C, pifq and pif7‐2 mutant seedlings were almost unresponsive to 28°C, in accordance with the role of PIF4, PIF5, and PIF7 in thermomorphogenesis (Stavang et al, 2009; Franklin et al, 2011; Fiorucci et al, 2020). Unlike the hfr1‐5 mutant, which was slightly but significantly more responsive than AtWT, A. thaliana seedlings that overexpress a stable form of HFR1 (35S:GFP‐ΔNt‐HFR1, ΔNtHFR1) were almost unresponsive to 28°C (Fig 7C), indicating that HFR1 activity impacts this PIF‐dependent response. A lack of hypocotyl elongation was also observed in ChWT at 28°C, a response that was recovered in the C. hirsuta chfr1 mutant seedlings (Fig 7C). These results support our hypothesis that a strong suppression of PIFs by the enhanced HFR1 activity is responsible for the lack of hypocotyl elongation at 28°C of ChWT seedlings (Fig 7A). Together, our results suggest that the activity of the PIF‐HFR1 regulatory module might be a general mechanism to coordinate the hypocotyl elongation in response to both W + FR exposure and 28°C.
Figure 7. Cardamine hirsuta has an attenuated hypocotyl elongation at warm temperature and delayed dark‐induced senescence (DIS).
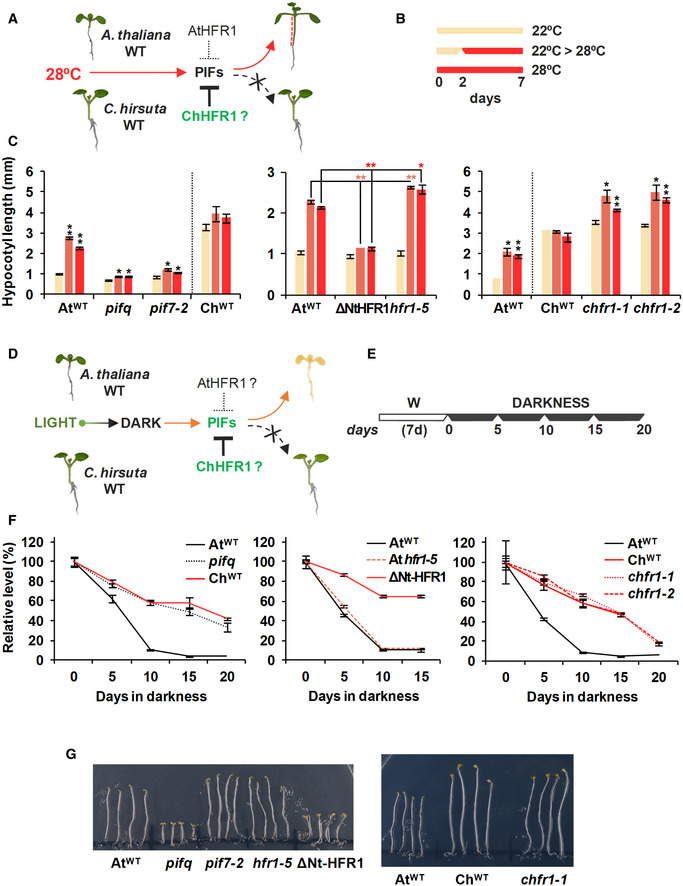
- In AtWT, PIFs promote hypocotyl elongation as a response to warm temperature (28ºC). High ChHFR1 activity is expected to inhibit this response by repressing PIFs more effectively in ChWT and attenuate hypocotyl elongation at 28°C.
- Seedlings were grown for 7 days in W at either 22°C, 2 days at 22°C then transferred to 28°C for additional 5 days (22°C > 28°C) or for 7 days at 28°C, as represented in the panel.
- Hypocotyl length of seedlings of (left) AtWT, pifq, pif7‐2, ChWT, (middle) 35S:GFP‐ΔNt‐HFR1 (ΔNtHFR1), hfr1‐5 and (right) chfr1‐1 and chfr1‐2 lines grown at warm temperatures. Hypocotyl lengths are the means ± SE of three biological replicates. Asterisks mark significant differences (Student's t‐test: *P‐value < 0.05, **P‐value < 0.01) relative to the same genotype grown at 22°C (left and right graphs, black asterisks), and between the indicated pairs (middle graph, red asterisks).
- In AtWT, PIF‐mediated DIS involves a reduction of chlorophyll levels. HFR1 activity might inhibit DIS through repression of PIFs. If PIF activity is attenuated in ChWT, DIS would be delayed in this species compared to AtWT.
- Seedlings were grown for 7 days in W and then transferred to total darkness for several days to induce senescence, as illustrated at the right panel.
- Relative chlorophylls levels of (left) AtWT, pifq, ChWT, (middle) ΔNtHFR1, hfr1‐5 and (right) chfr1‐1, and chfr1‐2 lines after DIS was promoted for the indicated time. For each genotype, values are relative to pigment levels at time 0 (7 days in W). Data are the means ± SE of four independent biological replicates.
- Aspect of 4‐day‐old dark‐grown seedlings of AtWT, pifq, pif7‐2, hfr1‐5 and ΔNt‐HFR1 (left panel), and AtWT, ChWT, and chfr1‐1 (right panel).
We also studied dark‐induced senescence (DIS), another PIF‐dependent process (Fig 7D). In A. thaliana, DIS can be induced by transferring light‐grown seedlings to complete darkness, a process in which PIF4 and PIF5 have major roles (Sakuraba et al, 2014; Song et al, 2014; Liebsch & Keech, 2016). DIS results in a degradation of chlorophylls, which can be quantified as markers of senescence progression (Sakuraba et al, 2014; Song et al, 2014). To examine DIS, we transferred light‐grown AtWT, pifq, and ChWT seedlings to total darkness for up to 20 days (Fig 7E). After DIS was activated, AtWT seedlings became pale and eventually died. After just 5 days of darkness, chlorophyll levels dropped, and longer dark treatments resulted in pronounced differences between the three genotypes. AtWT seedlings became visibly yellow at day 10, accompanied by a strong reduction of chlorophyll levels that dropped to less than 10% (Fig 7F). DIS was delayed in 35S:GFP‐ΔNt‐HFR1 seedlings, supporting that a stable HFR1 form can interfere with PIF activity in regulating this trait. However, DIS in was not advanced in hfr1 mutants (Fig 7E). In ChWT seedlings, chlorophyll levels declined more slowly and seedlings were still green after 20 days of darkness, just like pifq (Fig 7E). The observed delay in the DIS in C. hirsuta was not affected in chfr1 mutants, suggesting that HFR1 does not regulate this trait in any of the two species. It also pointed to a reduced PIF activity as the main cause for the delayed DIS in this species (Fig 7D–F). As HFR1 is very unstable, particularly in dark‐grown conditions (Duek et al, 2004; Yang et al, 2005), it seems plausible that HFR1 does not accumulate in seedlings when transferred to the dark. Despite this attenuation of PIF activity, ChWT seedlings showed an etiolated phenotype similar to that of AtWT when grown in the dark, in contrast to A. thaliana pifq and 35S:GFP‐ΔNt‐HFR1 seedlings (Fig 7G), suggesting the PIF activity is high enough in C. hirsuta to induce the normal skotomorphogenic development.
Discussion
It is currently unknown whether the switch between shade avoidance and tolerance strategies is an easily adjustable trait in plants. The existence of closely related species with divergent strategies to acclimate to shade provides a good opportunity to study the genetic and molecular basis for adapting to this environmental cue. To this goal, we performed comparative analyses of the hypocotyl response to shade in young seedlings of two related Brassicaceae: A. thaliana and C. hirsuta. Arabidopsis thaliana, a model broadly used to study the SAS hypocotyl response, is well characterized on a physiological, genetic, and molecular level. Cardamine hirsuta was previously described as a shade‐tolerant species whose hypocotyls are unresponsive to simulated shade (Hay et al, 2014; Molina‐Contreras et al, 2019). Recent work showed that phyA is a major contributor to the suppression of hypocotyl elongation of C. hirsuta seedlings in response to shade, mainly due to the stronger phyA activity in this species compared to the shade‐avoider A. thaliana (Molina‐Contreras et al, 2019). Importantly, an enhanced phyA activity was not enough to explain the lack of shade‐induced hypocotyl elongation in C. hirsuta, pointing to additional components that contribute to this response. Our aim to fill this gap led us to uncover a role for HFR1 in this response.
In C. hirsuta, removal of HFR1 function resulted in a strong slender in shade (sis) phenotype but milder than that of sis1 plants, deficient in the phyA photoreceptor (Molina‐Contreras et al, 2019), providing genetic evidence for the role of HFR1 in restraining the C. hirsuta hypocotyl elongation in shade (Fig 1A and B). This indicates that, like phyA, HFR1 contributes to implement the shade‐tolerant habit in C. hirsuta seedlings. Because of the sis phenotype of chfr1 and RNAi‐HFR1 seedlings (Fig 1), we hypothesized that HFR1 activity is higher in C. hirsuta than in A. thaliana. Consistently, transcript levels of HFR1 were significantly higher in ChWT than AtWT seedlings in both W and W + FR (Fig 2). Higher HFR1 levels in C. hirsuta may not be relevant in W because of the expected lower abundance and activity of PIFs, but a higher pool of ChHFR1 ready to suppress early ChPIF action in shade could provide a fast and sustained repression of the elongation response. Indeed, the shade‐induced expression of PIL1, YUC8, and XTR7, known to be direct PIF target genes in A. thaliana, was strongly and rapidly enhanced in chfr1 and RNAi‐HFR1 seedlings (Fig 1C and D). More importantly, rapid shade‐induced expression was globally attenuated in ChWT compared to AtWT seedlings (Molina‐Contreras et al, 2019).
In addition to changes in gene expression, a higher HFR1 activity in C. hirsuta could also result from post‐translational regulation affecting protein stability. Our immunoblot analyses indicated that HFR1 proteins rapidly accumulate in response to simulated shade (W + FR), likely as a consequence of the strong shade‐induced responsiveness of the promoter (Fig 4A). These results support that regulation of HFR1 protein abundance in low R:FR occurs mainly at the transcriptional level, as suggested (de Wit et al, 2016). More importantly, ChHFR1 accumulates significantly more when expressed under the control of a constitutive promoter either under W or W + FR (Fig 4B–D) suggesting that intrinsic differences in post‐translational stability between these proteins play a role in their contrasting accumulation.
AtHFR1 protein abundance is modified post‐translationally by phosphorylation (Park et al, 2008) and ubiquitination in a light‐ and COP1‐dependent manner (Jang et al, 2005; Yang et al, 2005). Canopy shade promotes nuclear accumulation of COP1 (Pacin et al, 2013; Pacin et al, 2016) allowing it to directly interact with and polyubiquitinate AtHFR1, leading to its degradation by the 26S proteasome (Jang et al, 2005; Yang et al, 2005; Huang et al, 2014). AtHFR1, like ChHFR1, contains two putative COP1 binding sites (VP motifs) on its N‐terminal half (Fig EV4A), although only one binds COP1 (Figs 5A and EV5) (Lau et al, 2019). Deletion of AtHFR1 Nt leads to its stabilization in the dark and light (Duek et al, 2004) and results in a stronger biological activity (Jang et al, 2005; Yang et al, 2005; Galstyan et al, 2011), highlighting the importance of the COP1‐interacting domain for light regulation of AtHFR1 stability. Our MST binding assays showed that AtHFR1 binds to COP1 about 100 times more weakly than other plant COP1 substrates do (Lau et al, 2019), and ChHFR1 even more weakly than AtHFR1 (Fig 5A and B). AtHFR1 and ChHFR1 primary structures are similar, including the putative COP1‐interacting domain (Jang et al, 2005), except for the addition of 30 amino acids at the N‐terminal part of ChHFR1 and a 9‐amino acid insertion in the C‐terminal part of AtHFR1 (Fig EV4A). We cannot discount the possibility that protein sequence and/or structural differences other than the VP motifs could also contribute to the affinity of the full‐length HFR1 orthologues for COP1 and account for the difference in abundance between C. hirsuta and A. thaliana HFR1. However, the strong impact of swapping the VP region between ChHFR1 and AtHFR1 on the abundance of the resulting HFR1* proteins (Fig 5C and D) further points to the binding affinity of COP1 for its substrates as a main determinant of the stability of the two HFR1 orthologues. Together, our results point to (i) the regulation of affinity for COP1 as impacting HFR1 stability and (ii) HFR1 stability as a mechanism to control global HFR1 activity to modulate adaptation of different plant species to vegetation proximity and shade.
AtHFR1 was previously shown to interact with all the AtPIFQ members and to form non‐DNA‐binding heterodimers (Fairchild et al, 2000; Hornitschek et al, 2012; Shi et al, 2013). Our genetic and Y2H experiments extended the list of AtHFR1 interactors to AtPIF7, the major SAS‐promoting PIF (Fig 6). If ChHFR1 maintains similar PIF‐binding abilities, the reduced expression of ChPIF7 (Fig 2) might further contribute to imbalance the PIF‐HFR1 module in favor of the negative HFR1 activity in C. hirsuta compared to A. thaliana. Because of the higher stability of ChHFR1 over AtHFR1 in shade (Fig 4), an even stronger repression of global PIF activity in C. hirsuta would contribute to the unresponsiveness of hypocotyls to shade. The attenuation of the warm temperature‐induced hypocotyl elongation in C. hirsuta, which is a PIF‐regulated process in A. thaliana (Koini et al, 2009; Stavang et al, 2009; Hayes et al, 2017; Fiorucci et al, 2020) and HFR1‐dependent in both species (Fig 7A–C), further agrees with our proposal of an enhanced activity of HFR1 in C. hirsuta compared to A. thaliana. On the other hand, the delayed DIS observed in C. hirsuta, shown to be PIF‐regulated in A. thaliana (Sakuraba et al, 2014; Song et al, 2014) but unaffected by HFR1 in the two species analyzed (Fig 7D and E), suggests that PIF activity is globally lower per se in C. hirsuta than in A. thaliana. Together, our results indicate that PIF‐HFR1 module is balanced differently in C. hirsuta by the combination of (i) an attenuated global PIF activity and PIF7 expression compared to A. thaliana and (ii) the increased levels of ChHFR1 in light and shade conditions, resulting in the repression of PIF‐regulated processes in C. hirsuta (Fig 8). Importantly, although attenuated, PIF activity in C. hirsuta is enough to provide a functional and effective etiolation response (Fig 7G) for seedlings survival during germination in the dark.
Figure 8. Model summarizing how PIF‐HFR1 transcriptional module is differently balanced in Arabidopsis thaliana and Cardamine hirsuta .
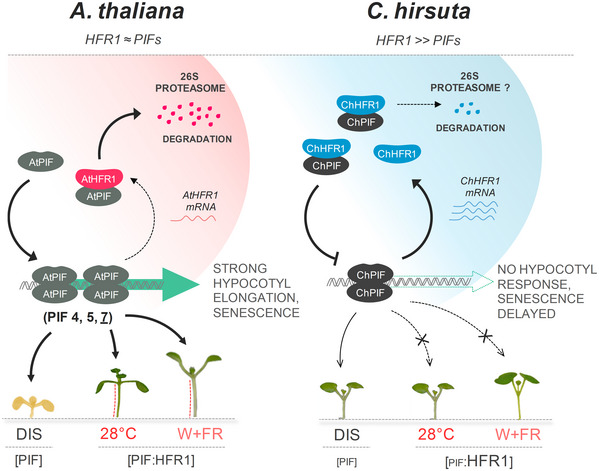
Shade (low R:FR) displaces phytochrome photoequilibrium toward the inactive form, allowing PIFs to promote the expression of shade avoidance‐related genes, such as HFR1. PIF transcript or/and protein levels are induced in response to warm temperatures, resulting in enhanced expression of growth‐promoting genes. HFR1 abundance is also increased by warm temperature. HFR1 modulates these responses by heterodimerizing with PIFs and inhibiting their DNA‐binding ability. As a result, HFR1 attenuates hypocotyl elongation of A. thaliana seedlings in response to shade or warm temperature. In C. hirsuta, higher HFR1 activity inhibits more effectively PIF action than in A. thaliana. In addition, PIF abundance is attenuated in C. hirsuta. Both changes alter the PIF‐HFR1 balance in C. hirsuta, resulting in lower PIF transcriptional activity. As a consequence, shade‐ and warm temperature‐induced hypocotyl elongation are repressed and DIS is delayed in this species.
Activity of HFR1 and phyA (Molina‐Contreras et al, 2019) appears to be increased in C. hirsuta to maintain unresponsiveness of hypocotyls to shade. An aspect shared by both negative regulators is that their expression and/or stability are strongly affected by light conditions. Expression of both PHYA and HFR1 is induced by simulated shade in de‐etiolated seedlings. By contrast, whereas the stability of the photolabile phyA is reduced by light but enhanced by shade, that of AtHFR1 is promoted by light and decreased by shade (Kircher et al, 1999; Duek et al, 2004; Park et al, 2008; Ciolfi et al, 2013; Casal et al, 2014; Martinez‐Garcia et al, 2014; Pacin et al, 2016; Yang et al, 2018). Although expression of both PHYA and HFR1 is higher in C. hirsuta than in A. thaliana, different mechanisms might contribute to their increased activity in C. hirsuta. Indeed, enhanced ChphyA repression was achieved by its stronger specific intrinsic activity (Molina‐Contreras et al, 2019). By contrast, enhanced ChHFR1 repression was accomplished through its higher gene expression and protein stability coupled with an attenuated PIF7 activity. Altogether this could provide a more repressive state of the C. hirsuta PIF‐HFR1 module. Because of the temporal differences downregulating many of the shade marker genes between phyA (observed after 4–8 h of shade exposure) (Molina‐Contreras et al, 2019) and HFR1 (rapidly detected after just 1 h of shade exposure) (Fig 1C and D), it seems likely that ChHFR1 and ChphyA suppressor mechanisms of shade response in C. hirsuta act independently, as it was reported for A. thaliana (Ciolfi et al, 2013; Ortiz‐Alcaide et al, 2019). Therefore, the concerted activity of these two independent suppressor mechanisms seems to coordinately prevent the shade‐induced hypocotyl elongation in C. hirsuta. Whether other shade‐tolerant species employ the same adaptive principles is something we aim to explore in the future.
Materials and Methods
Plant material and growth conditions
Arabidopsis thaliana hfr1‐5, pif7‐1, pif7‐2, and pifq mutants, 35S:PIF7‐CFP and 35S:GFP‐ΔNt‐HFR1 lines (in the Col‐0 background, AtWT) and Cardamine hirsuta (Oxford ecotype, Ox, ChWT) plants have been described before (Yang et al, 2005; Leivar et al, 2008; Galstyan et al, 2011; Hay et al, 2014). Plants were grown in the greenhouse under long‐day photoperiods (16 h light and 8 h dark) to produce seeds, as described (Martinez‐Garcia et al, 2014; Gallemi et al, 2016; Gallemi et al, 2017). For transient expression assays, Nicotiana benthamiana plants were grown in the greenhouse under long‐day photoperiods (16 h light and 8 h dark).
For hypocotyl assays, seeds were surface‐sterilized and sown on solid growth medium without sucrose (0.5×GM–). For gene expression analyses, immunoblot experiments and pigment quantification, seeds were sown on a sterilized nylon membrane placed on top of the solid 0.5×GM– medium. After stratification (dark at 4°C) of 3–6 days, plates with seeds were incubated in plant chambers at 22°C under continuous white light (W) for at least 2 h to break dormancy and synchronize germination (Paulisic et al, 2017; Roig‐Villanova et al, 2019).
W was emitted from cool fluorescent tubes that provided from 20 to 100 µmol/m2·s1 of photosynthetically active radiation (PAR) with a red (R) to far‐red light (FR) ratio (R:FR) from 1.3 to 3.3. The different simulated shade treatments were produced by supplementing W with increasing amounts of FR (W + FR). FR was emitted from GreenPower LED module HF far‐red (Philips), providing R:FR of 0.02–0.09. Light fluence rates were measured with a Spectrosense2 meter (Skye Instruments Ltd), which measures PAR (400–700 nm), and 10 nm windows of R (664–674 nm) and FR (725–735 nm) regions (Martinez‐Garcia et al, 2014). Details of the resulting light spectra have been described before (Molina‐Contreras et al, 2019).
Temperature‐induced hypocotyl elongation assays were done by placing the plates with seeds under the indicated light conditions in growth chambers at 22°C or 28°C.
Measurement of hypocotyl length
Hypocotyl length was measured as described (Paulisic et al, 2017; Roig‐Villanova et al, 2019). Experiments were repeated at least three times with more than 10 seedlings per genotype and/or treatment, providing consistent results. Hypocotyl measurements from the different experiments were averaged.
Generation of transgenic lines, mutants, and crosses
Arabidopsis thaliana hfr1‐5 plants were transformed to express AtHFR1 and ChHFR1 under the promoters of 35S or AtHFR1 (pAt). The obtained lines were named as hfr1>35S:ChHFR1, hfr1>pAt:AtHFR1, and hfr1>pAt:ChHFR1. Transgenic RNAi‐HFR1 and mutant chfr1‐1 and chfr1‐2 lines are in ChWT background. Details of the constructs used for the generation of these lines (Morineau et al, 2017) are provided as Appendix Supplementary Methods.
Gene expression analyses
Real‐time qPCR analyses were performed using biological triplicates, as indicated (Gallemi et al, 2017). Total RNA was extracted from seedlings, treated as indicated, using commercial kits (Maxwell® SimplyRNA and Maxwell® RSC Plant RNA Kits; www.promega.com). 2 µg of RNA was reverse‐transcribed with Transcriptor First Strand cDNA synthesis Kit (Roche, www.roche.com). The A. thaliana UBIQUITIN 10 (UBQ10) was used for normalization in A. thaliana hfr1‐5 lines expressing AtHFR1 or ChHFR1. The ELONGATION FACTOR 1α (EF1α), YELLOW‐LEAF‐SPECIFIC GENE 8 (YLS8) and SPC25 (AT2G39960) were used for normalizing and comparing the levels of HFR1 and PIF7 between A. thaliana and C. hirsuta (Molina‐Contreras et al, 2019). Primers sequences for qPCR analyses are provided in Appendix Table S1.
Expression of HFR1 derivatives in Nicotiana benthamiana
Nicotiana benthamiana plants were agroinfiltrated with Agrobacterium tumefaciens strains transformed with the plasmids to express the various HFR1 derivatives and kept in the greenhouse under long‐day photoperiods. Samples (leaf circles obtained from infiltrated areas) were taken 3 days after agroinfiltration and frozen immediately. In Fig 4D, prior freezing, leaf circles were incubated in Petri dishes with 10 ml of the ±CHX solution for the indicated times and conditions. Each biological sample contained about 75 mg of leaf tissue from the same leaf. Additional details of the preparation of the plasmids used are provided in Appendix Supplementary Methods.
Protein extraction and immunoblotting analyses
To detect and quantify transgenic AtHFR1 and ChHFR1, proteins were extracted from ~ 50 mg of 7‐day‐old seedlings (grown as indicated) or from 50 to 75 mg of agroinfiltrated N. benthamiana leaves. Plant material was frozen in liquid nitrogen, ground to powder and total proteins were extracted using an SDS‐containing extraction buffer (1.5 µl per mg of fresh weight), as described (Gallemi et al, 2017). Protein concentration was estimated using Pierce™ BCA Protein Assay Kit (Thermo Scientific, www.thermofisher.com). Proteins (45–50 µg per lane) were resolved on a 10% SDS–PAGE gel, transferred to a PVDF membrane and immunoblotted with rat monoclonal anti‐HA (High Affinity, clone 3F10, Roche; 1:2,000 dilution) or mouse monoclonal anti‐GFP (monoclonal mix, clones 7.1 + 13.1, Roche; 1:2,000 dilution). Secondary antibodies used were horseradish peroxidase (HRP)‐conjugated goat anti‐rat (Polyclonal, A9037, Sigma, www.sigmaaldrich.com; 1:5,000 dilution) and HRP‐conjugated sheep anti‐mouse (Promega; 1:10,000 dilution). Development of blots was carried out in ChemiDoc™ Touch Imaging System (Bio‐Rad, www.bio‐rad.com) using ECL Prime Western Blotting Detection Reagent (GE Healthcare, RPN2236). Relative protein levels of three to four biological replicates were quantified using Image Lab™ Software.
Yeast 2 hybrid assays
For yeast 2 hybrid (Y2H) assays, we employed a cell mating system, as described (Gallemi et al, 2017). The leucine (Leu) auxotroph YM4271a yeast strain was transformed with the AD‐derived constructs and the tryptophan (Trp) auxotroph pJ694α strain with the BD‐derived constructs. Colonies were selected on synthetic defined medium (SD) lacking Leu (SD‐L) or Trp (SD‐W), grown in liquid medium and set to mate by mixing equal volumes of transformed cells. Dilutions of the mated cells were selected on SD‐LW, and protein interactions were tested on SD‐LW medium lacking histidine (SD‐HLW). Details of the yeast constructs used are provided as Appendix Supplementary Methods.
Expression of AtCOP1 WD40 protein and purification
AtCOP1 WD40 (residues 349–675) was expressed in Spodoptera frugiperda Sf9 cells (Thermo Fisher) and purified as described previously (Lau et al, 2019). Details of the procedure are provided as Appendix Supplementary Methods.
Protein labeling and microscale thermophoresis
COP1 WD40 was labeled using Monolith Protein Labeling Kit RED‐NHS 2nd Generation Amine Reactive kit (MO‐L011; Nanotemper Technologies, Munich, Germany). After the TEV cleavage, COP1 WD40 was in buffer A containing 2 mM β‐ME, which is incompatible with the labeling procedure. Therefore, prior to labeling, the buffer was exchanged using labeling buffer NHS provided in the kit. In the last step, the protein was purified from the free dye, in the assay buffer 20 mM Hepes pH 7.5, 150 mM NaCl, 2 mM TCEP and 0.05% [v/v] Tween‐20 in 12–15 different fractions. The absorbance of each sample was measured at 280 and 650 nm. The Degree of Labeling (DOL) was calculated using the formula provided in the manual. Aliquots containing 2,000 to 8,000 nM concentration of proteins and DOL of > 0.5 were flash frozen for the use in the assay.
Peptide solutions were freshly prepared in the assay buffer at desired concentrations. For each independent replicate, 10 μl of peptide solution was serially diluted 1:1 using assay buffer, in 16 PCR tubes. 10 μl of solution was discarded from the 16th tube, thus each tube contained 10 μl of peptide solution. Each dilution step was mixed with 10 μl of 150 nM of COP1 WD40 and transferred into Monolith NT.115 Premium Capillaries (MO‐K025). The samples were measured with the Monolith NT.115 instrument at a 25% LED Power and 20% MST power. The resulting thermophoresis data were analyzed with the MOAffinityAnalysis software (Nanotemper Technologies).
Author contributions
JFM‐G conceived the original research plan, and directed and coordinated the study. SP, WQ, CT, BA, and FN designed and/or carried out experiments using A. thaliana and C. hirsuta. MT and FN fundamentally contributed to design the constructs to obtain C. hirsuta transgenic and mutant lines. HAV and MH designed and performed MST experiments and their analyses. SP and JFM‐G wrote the article with contributions and/or comments of all other authors.
Conflict of interest
The authors declare that they have no conflict of interest.
Supporting information
Appendix
Expanded View Figures PDF
Source Data for Expanded View
Review Process File
Source Data for Figure 3
Source Data for Figure 4
Source Data for Figure 5
Acknowledgements
We are grateful to Peter Quail (PGEC, Albany, CA, USA) for providing 35S:PIF7‐CFP seeds; and to Manuel Rodriguez‐Concepción (CRAG) for comments on the manuscript. SP received predoctoral fellowships from the Agència d’Ajuts Universitaris i de Recerca (AGAUR—Generalitat de Catalunya, FI programme). WQ is a recipient of a predoctoral Chinese Scholarship Council (CSC) fellowship. CT received a Marie Curie IEF postdoctoral contract funded by the European Commission and a CRAG short‐term fellowship. We also acknowledge the support of the MINECO for the “Centro de Excelencia Severo Ochoa 2016‐2019” award SEV‐2015‐0533 and by the CERCA Programme/Generalitat de Catalunya. FN research at the IJPB benefits from the support of the LabEx Saclay Plant Sciences‐SPS (ANR‐10‐LABX‐0040‐SPS). Our research is supported by grants from BBSRC (BB/H006974/1) and Max Planck Society (core grant) to MT, and from MINECO‐FEDER (BIO2017‐85316‐R) and AGAUR (2017‐SGR1211 and Xarba) to JFM‐G. MH is an International Research Scholar by the Howard Hughes Medical Institute.
The EMBO Journal (2021) 40: e104273.
Data availability
This study includes no data deposited in external repositories.
References
- Ballare CL, Pierik R (2017) The shade‐avoidance syndrome: multiple signals and ecological consequences. Plant Cell Environ 40: 2530–2543 [DOI] [PubMed] [Google Scholar]
- Bou‐Torrent J, Galstyan A, Gallemi M, Cifuentes‐Esquivel N, Molina‐Contreras MJ, Salla‐Martret M, Jikumaru Y, Yamaguchi S, Kamiya Y, Martinez‐Garcia JF (2014) Plant proximity perception dynamically modulates hormone levels and sensitivity in Arabidopsis . J Exp Bot 65: 2937–2947 [DOI] [PMC free article] [PubMed] [Google Scholar]
- Casal JJ (2013) Photoreceptor signaling networks in plant responses to shade. Annu Rev Plant Biol 64: 403–427 [DOI] [PubMed] [Google Scholar]
- Casal JJ, Candia AN, Sellaro R (2014) Light perception and signalling by phytochrome A. J Exp Bot 65: 2835–2845 [DOI] [PubMed] [Google Scholar]
- Cifuentes‐Esquivel N, Bou‐Torrent J, Galstyan A, Gallemi M, Sessa G, Salla Martret M, Roig‐Villanova I, Ruberti I, Martinez‐Garcia JF (2013) The bHLH proteins BEE and BIM positively modulate the shade avoidance syndrome in Arabidopsis seedlings. Plant J 75: 989–1002 [DOI] [PubMed] [Google Scholar]
- Ciolfi A, Sessa G, Sassi M, Possenti M, Salvucci S, Carabelli M, Morelli G, Ruberti I (2013) Dynamics of the shade‐avoidance response in Arabidopsis . Plant Physiol 163: 331–353 [DOI] [PMC free article] [PubMed] [Google Scholar]
- de Wit M, Keuskamp DH, Bongers FJ, Hornitschek P, Gommers CMM, Reinen E, Martinez‐Ceron C, Fankhauser C, Pierik R (2016) Integration of phytochrome and cryptochrome signals determines plant growth during competition for light. Curr Biol 26: 3320–3326 [DOI] [PubMed] [Google Scholar]
- Duek PD, Elmer MV, van Oosten VR, Fankhauser C (2004) The degradation of HFR1, a putative bHLH class transcription factor involved in light signaling, is regulated by phosphorylation and requires COP1. Curr Biol 14: 2296–2301 [DOI] [PubMed] [Google Scholar]
- Fairchild CD, Schumaker MA, Quail PH (2000) HFR1 encodes an atypical bHLH protein that acts in phytochrome A signal transduction. Genes Dev 14: 2377–2391 [PMC free article] [PubMed] [Google Scholar]
- Fiorucci AS, Fankhauser C (2017) Plant strategies for enhancing access to sunlight. Curr Biol 27: R931–R940 [DOI] [PubMed] [Google Scholar]
- Fiorucci AS, Galvao VC, Ince YC, Boccaccini A, Goyal A, Allenbach Petrolati L, Trevisan M, Fankhauser C (2020) PHYTOCHROME INTERACTING FACTOR 7 is important for early responses to elevated temperature in Arabidopsis seedlings. New Phytol 226: 50–58 [DOI] [PMC free article] [PubMed] [Google Scholar]
- Foreman J, Johansson H, Hornitschek P, Josse EM, Fankhauser C, Halliday KJ (2011) Light receptor action is critical for maintaining plant biomass at warm ambient temperatures. Plant J 65: 441–452 [DOI] [PubMed] [Google Scholar]
- Franklin KA, Lee SH, Patel D, Kumar SV, Spartz AK, Gu C, Ye S, Yu P, Breen G, Cohen JD et al (2011) Phytochrome‐interacting factor 4 (PIF4) regulates auxin biosynthesis at high temperature. Proc Natl Acad Sci USA 108: 20231–20235 [DOI] [PMC free article] [PubMed] [Google Scholar]
- Galstyan A, Cifuentes‐Esquivel N, Bou‐Torrent J, Martinez‐Garcia JF (2011) The shade avoidance syndrome in Arabidopsis: a fundamental role for atypical basic helix‐loop‐helix proteins as transcriptional cofactors. Plant J 66: 258–267 [DOI] [PubMed] [Google Scholar]
- Gallemi M, Galstyan A, Paulisic S, Then C, Ferrandez‐Ayela A, Lorenzo‐Orts L, Roig‐Villanova I, Wang X, Micol JL, Ponce MR et al (2016) DRACULA2 is a dynamic nucleoporin with a role in regulating the shade avoidance syndrome in Arabidopsis . Development 143: 1623–1631 [DOI] [PubMed] [Google Scholar]
- Gallemi M, Molina‐Contreras MJ, Paulisic S, Salla‐Martret M, Sorin C, Godoy M, Franco‐Zorrilla JM, Solano R, Martinez‐Garcia JF (2017) A non‐DNA‐binding activity for the ATHB4 transcription factor in the control of vegetation proximity. New Phytol 216: 798–813 [DOI] [PubMed] [Google Scholar]
- Gommers CM, Visser EJ, St Onge KR, Voesenek LA, Pierik R (2013) Shade tolerance: when growing tall is not an option. Trends Plant Sci 18: 65–71 [DOI] [PubMed] [Google Scholar]
- Gommers CM, Keuskamp DH, Buti S, van Veen H, Koevoets IT, Reinen E, Voesenek LA, Pierik R (2017) Molecular profiles of contrasting shade response strategies in wild plants: differential control of immunity and shoot elongation. Plant Cell 29: 331–344 [DOI] [PMC free article] [PubMed] [Google Scholar]
- Hay AS, Pieper B, Cooke E, Mandakova T, Cartolano M, Tattersall AD, Ioio RD, McGowan SJ, Barkoulas M, Galinha C et al (2014) Cardamine hirsuta: a versatile genetic system for comparative studies. Plant J 78: 1–15 [DOI] [PubMed] [Google Scholar]
- Hayes S, Sharma A, Fraser DP, Trevisan M, Cragg‐Barber CK, Tavridou E, Fankhauser C, Jenkins GI, Franklin KA (2017) UV‐B perceived by the UVR8 photoreceptor inhibits plant thermomorphogenesis. Curr Biol 27: 120–127 [DOI] [PMC free article] [PubMed] [Google Scholar]
- Hersch M, Lorrain S, de Wit M, Trevisan M, Ljung K, Bergmann S, Fankhauser C (2014) Light intensity modulates the regulatory network of the shade avoidance response in Arabidopsis . Proc Natl Acad Sci USA 111: 6515–6520 [DOI] [PMC free article] [PubMed] [Google Scholar]
- Hornitschek P, Lorrain S, Zoete V, Michielin O, Fankhauser C (2009) Inhibition of the shade avoidance response by formation of non‐DNA binding bHLH heterodimers. EMBO J 28: 3893–3902 [DOI] [PMC free article] [PubMed] [Google Scholar]
- Hornitschek P, Kohnen MV, Lorrain S, Rougemont J, Ljung K, Lopez‐Vidriero I, Franco‐Zorrilla JM, Solano R, Trevisan M, Pradervand S et al (2012) Phytochrome interacting factors 4 and 5 control seedling growth in changing light conditions by directly controlling auxin signaling. Plant J 71: 699–711 [DOI] [PubMed] [Google Scholar]
- Huang X, Ouyang X, Deng XW (2014) Beyond repression of photomorphogenesis: role switching of COP/DET/FUS in light signaling. Curr Opin Plant Biol 21: 96–103 [DOI] [PubMed] [Google Scholar]
- Jang IC, Yang JY, Seo HS, Chua NH (2005) HFR1 is targeted by COP1 E3 ligase for post‐translational proteolysis during phytochrome A signaling. Genes Dev 19: 593–602 [DOI] [PMC free article] [PubMed] [Google Scholar]
- Kircher S, Kozma‐Bognar L, Kim L, Adam E, Harter K, Schafer E, Nagy F (1999) Light quality‐dependent nuclear import of the plant photoreceptors phytochrome A and B. Plant Cell 11: 1445–1456 [DOI] [PMC free article] [PubMed] [Google Scholar]
- Koini MA, Alvey L, Allen T, Tilley CA, Harberd NP, Whitelam GC, Franklin KA (2009) High temperature‐mediated adaptations in plant architecture require the bHLH transcription factor PIF4. Curr Biol 19: 408–413 [DOI] [PubMed] [Google Scholar]
- Lau K, Podolec R, Chappuis R, Ulm R, Hothorn M (2019) Plant photoreceptors and their signaling components compete for COP1 binding via VP peptide motifs. EMBO J 38: e102140 [DOI] [PMC free article] [PubMed] [Google Scholar]
- Leivar P, Monte E, Al‐Sady B, Carle C, Storer A, Alonso JM, Ecker JR, Quail PH (2008) The Arabidopsis phytochrome‐interacting factor PIF7, together with PIF3 and PIF4, regulates responses to prolonged red light by modulating phyB levels. Plant Cell 20: 337–352 [DOI] [PMC free article] [PubMed] [Google Scholar]
- Li L, Ljung K, Breton G, Schmitz RJ, Pruneda‐Paz J, Cowing‐Zitron C, Cole BJ, Ivans LJ, Pedmale UV, Jung HS et al (2012) Linking photoreceptor excitation to changes in plant architecture. Genes Dev 26: 785–790 [DOI] [PMC free article] [PubMed] [Google Scholar]
- Liebsch D, Keech O (2016) Dark‐induced leaf senescence: new insights into a complex light‐dependent regulatory pathway. New Phytol 212: 563–570 [DOI] [PubMed] [Google Scholar]
- Lorrain S, Allen T, Duek PD, Whitelam GC, Fankhauser C (2008) Phytochrome‐mediated inhibition of shade avoidance involves degradation of growth‐promoting bHLH transcription factors. Plant J 53: 312–323 [DOI] [PubMed] [Google Scholar]
- Martinez‐Garcia JF, Huq E, Quail PH (2000) Direct targeting of light signals to a promoter element‐bound transcription factor. Science 288: 859–863 [DOI] [PubMed] [Google Scholar]
- Martinez‐Garcia JF, Gallemi M, Molina‐Contreras MJ, Llorente B, Bevilaqua MR, Quail PH (2014) The shade avoidance syndrome in Arabidopsis: the antagonistic role of phytochrome a and B differentiates vegetation proximity and canopy shade. PLoS One 9: e109275 [DOI] [PMC free article] [PubMed] [Google Scholar]
- Mazza CA, Ballare CL (2015) Photoreceptors UVR8 and phytochrome B cooperate to optimize plant growth and defense in patchy canopies. New Phytol 207: 4–9 [DOI] [PubMed] [Google Scholar]
- Molina‐Contreras MJ, Paulisic S, Then C, Moreno‐Romero J, Pastor‐Andreu P, Morelli L, Roig‐Villanova I, Jenkins H, Hallab A, Gan X et al (2019) Photoreceptor activity contributes to contrasting responses to shade in Cardamine and Arabidopsis seedlings. Plant Cell 31: 2649–2663 [DOI] [PMC free article] [PubMed] [Google Scholar]
- Morineau C, Bellec Y, Tellier F, Gissot L, Kelemen Z, Nogue F, Faure JD (2017) Selective gene dosage by CRISPR‐Cas9 genome editing in hexaploid Camelina sativa . Plant Biotechnol J 15: 729–739 [DOI] [PMC free article] [PubMed] [Google Scholar]
- Ortiz‐Alcaide M, Llamas E, Gomez‐Cadenas A, Nagatani A, Martinez‐Garcia JF, Rodriguez‐Concepcion M (2019) Chloroplasts modulate elongation responses to canopy shade by retrograde pathways involving HY5 and abscisic acid. Plant Cell 31: 384–398 [DOI] [PMC free article] [PubMed] [Google Scholar]
- Pacin M, Legris M, Casal JJ (2013) COP1 re‐accumulates in the nucleus under shade. Plant J 75: 631–641 [DOI] [PubMed] [Google Scholar]
- Pacin M, Semmoloni M, Legris M, Finlayson SA, Casal JJ (2016) Convergence of CONSTITUTIVE PHOTOMORPHOGENESIS 1 and PHYTOCHROME INTERACTING FACTOR signalling during shade avoidance. New Phytol 211: 967–979 [DOI] [PubMed] [Google Scholar]
- Park HJ, Ding L, Dai M, Lin R, Wang H (2008) Multisite phosphorylation of Arabidopsis HFR1 by casein kinase II and a plausible role in regulating its degradation rate. J Biol Chem 283: 23264–23273 [DOI] [PubMed] [Google Scholar]
- Paulisic S, Molina‐Contreras MJ, Roig‐Villanova I, Martinez‐Garcia JF (2017) Approaches to study light effects on brassinosteroid sensitivity. Methods Mol Biol 1564: 39–47 [DOI] [PubMed] [Google Scholar]
- Pierik R, Testerink C (2014) The art of being flexible: how to escape from shade, salt, and drought. Plant Physiol 166: 5–22 [DOI] [PMC free article] [PubMed] [Google Scholar]
- Roig‐Villanova I, Bou‐Torrent J, Galstyan A, Carretero‐Paulet L, Portoles S, Rodriguez‐Concepcion M, Martinez‐Garcia JF (2007) Interaction of shade avoidance and auxin responses: a role for two novel atypical bHLH proteins. EMBO J 26: 4756–4767 [DOI] [PMC free article] [PubMed] [Google Scholar]
- Roig‐Villanova I, Paulisic S, Martinez‐Garcia JF (2019) Shade avoidance and neighbor detection. Methods Mol Biol 2026: 157–168 [DOI] [PubMed] [Google Scholar]
- Sakuraba Y, Jeong J, Kang MY, Kim J, Paek NC, Choi G (2014) Phytochrome‐interacting transcription factors PIF4 and PIF5 induce leaf senescence in Arabidopsis . Nat Commun 5: 4636 [DOI] [PubMed] [Google Scholar]
- Sasidharan R, Pierik R (2010) Cell wall modification involving XTHs controls phytochrome‐mediated petiole elongation in Arabidopsis thaliana . Plant Signal Behav 5: 1491–1492 [DOI] [PMC free article] [PubMed] [Google Scholar]
- Sessa G, Carabelli M, Sassi M, Ciolfi A, Possenti M, Mittempergher F, Becker J, Morelli G, Ruberti I (2005) A dynamic balance between gene activation and repression regulates the shade avoidance response in Arabidopsis . Genes Dev 19: 2811–2815 [DOI] [PMC free article] [PubMed] [Google Scholar]
- Shi H, Zhong S, Mo X, Liu N, Nezames CD, Deng XW (2013) HFR1 sequesters PIF1 to govern the transcriptional network underlying light‐initiated seed germination in Arabidopsis . Plant Cell 25: 3770–3784 [DOI] [PMC free article] [PubMed] [Google Scholar]
- Smith H (1982) Light quality, photoperception, and plant strategy. Ann Rev Plant Physiol 33: 481–518 [Google Scholar]
- Song Y, Yang C, Gao S, Zhang W, Li L, Kuai B (2014) Age‐triggered and dark‐induced leaf senescence require the bHLH transcription factors PIF3, 4, and 5. Mol Plant 7: 1776–1787 [DOI] [PMC free article] [PubMed] [Google Scholar]
- Stavang JA, Gallego‐Bartolome J, Gomez MD, Yoshida S, Asami T, Olsen JE, Garcia‐Martinez JL, Alabadi D, Blazquez MA (2009) Hormonal regulation of temperature‐induced growth in Arabidopsis . Plant J 60: 589–601 [DOI] [PubMed] [Google Scholar]
- Valladares F, Niinemets U (2008) Shade tolerance, a key plant feature of complex nature and consequences. Ann Rev Ecol Evol Syst 39: 237–257 [Google Scholar]
- van Gelderen K, Kang C, Paalman R, Keuskamp D, Hayes S, Pierik R (2018) Far‐red light detection in the shoot regulates lateral root development through the HY5 transcription factor. Plant Cell 30: 101–116 [DOI] [PMC free article] [PubMed] [Google Scholar]
- Yang J, Lin R, Sullivan J, Hoecker U, Liu B, Xu L, Deng XW, Wang H (2005) Light regulates COP1‐mediated degradation of HFR1, a transcription factor essential for light signaling in Arabidopsis . Plant Cell 17: 804–821 [DOI] [PMC free article] [PubMed] [Google Scholar]
- Yang C, Li L (2017) Hormonal regulation in shade avoidance. Front Plant Sci 8: 1527 [DOI] [PMC free article] [PubMed] [Google Scholar]
- Yang C, Xie F, Jiang Y, Li Z, Huang X, Li L (2018) Phytochrome A negatively regulates the shade avoidance response by increasing auxin/indole acidic acid protein stability. Dev Cell 44: 29–41.e4 [DOI] [PubMed] [Google Scholar]
- Zhang R, Yang C, Jiang Y, Li L (2019) A PIF7‐CONSTANS‐Centered molecular regulatory network underlying shade‐accelerated flowering. Mol Plant 12: 1587–1597 [DOI] [PubMed] [Google Scholar]
Associated Data
This section collects any data citations, data availability statements, or supplementary materials included in this article.
Supplementary Materials
Appendix
Expanded View Figures PDF
Source Data for Expanded View
Review Process File
Source Data for Figure 3
Source Data for Figure 4
Source Data for Figure 5
Data Availability Statement
This study includes no data deposited in external repositories.


