

Structured Summary
Background:
A major deficit in understanding and improving treatment in coeliac disease (CD) is the lack of empiric data on real world gluten exposure.
Aims:
To estimate gluten exposure on a gluten-free diet (GFD) using immunoassays for gluten immunogenic peptides (GIP). Relationships among GIP detection, symptoms and suspected gluten exposures were examined.
Methods:
Adults with biopsy-confirmed CD on a GFD for 24 months were recruited from a population-based inception cohort. Participants kept a diary and collected urine samples for 10 days and stools on days 4–10. “Doggie bags” containing ¼ portions of foods consumed were saved during the first 7 days. Gluten in food, stool and urine was quantified using A1/G12 ELISA.
Results:
Eighteen participants with CD (12 female; age 21–70 years) and 3 participants on a gluten-containing diet enrolled and completed the study. 12/18 CD participants had a median 2.1 mg gluten per exposure (range 0.2 to >80 mg). Most exposures were asymptomatic and unsuspected. There was high intraindividual variability in the interval between gluten ingestion and excretion. Participants were generally unable to identify the food.
Conclusions:
Gluten exposure on a GFD is common, intermittent, usually silent, and excretion kinetics are highly variable between individuals. The amount of gluten varied widely, but was typically in the milligram range which was 10–100 times less than was consumed by those on an unrestricted diet. These findings suggest that a strictly gluten free diet is difficult to attain and specific exposures are difficult to detect due to variable time course of excretion.
Keywords: Coeliac disease, gluten immunogenic peptide, gluten-free diet, treatment adherence, immunoassay, stool test, urine test
Introduction
Coeliac disease is a chronic gluten-responsive immune mediated enteropathy1 that is treated with a gluten-free diet (GFD)2. Patients with coeliac disease report high rates of adherence to a strict GFD3; however, unintentional gluten exposures may be more common than realized and are distinct from lapses in an otherwise intentionally strict GFD4,5. Compared to other chronic health conditions, the treatment burden of coeliac disease is high6. The limitations and socio-emotional toll of a GFD are increasingly recognized7, which along with high rates of ongoing symptoms and enteropathy on a GFD are driving efforts to develop adjunctive or alternative therapies to a GFD. These include immunomodulatory therapies as well as gluten-digesting enzymes that hydrolyze prolyl-peptide bonds that are resistant to human gastrointestinal luminal proteases8.
Recently, tests for gluten in food9–11, and gluten immunogenic peptides (GIP) in stool12,13 and urine14 have been developed. These immunoassays rely upon the G12 and/or A1 antibodies, which bind GIP - gluten peptides resistant to intraluminal and serum proteases that are recognized by T cells of patients with coeliac disease9–12. Using these methods, GIP were detected in feces from 1 in 4 Spanish patients with coeliac disease who reported strict adherence to a GFD and had no sources of gluten ingestion identified on a detailed 3-day dietary questionnaire12. These assays quantify gluten excretion, not ingestion. Syage et al have estimated that adults with coeliac disease on a GFD consume a median 141 mg gluten per day through extrapolation from stool GIP concentrations16; however, many factors affecting kinetics of GIP excretion (e.g., food matrices, individual variations, water ingestion) were not accounted for.
Previously, in a sample of community-dwelling adults with biopsy-confirmed coeliac disease who were aiming to adhere to a strictly gluten-free diet, we demonstrated that low concentrations of gluten can be found in the food, urine and stool17. In this study we quantified the amount and frequency of gluten exposures; characterized the timing of gluten absorption and excretion; and examined the relationship of gluten exposure to acute symptoms and suspected gluten exposures.
Methods
As described previously17, participants were recruited from the Manitoba Celiac Disease Inception Cohort study. This prospective longitudinal study enrolled adults (16 years or older) with biopsy-confirmed coeliac disease. Diagnosis of coeliac disease was based upon villous atrophy and intraepithelial lymphocytosis (Marsh 3 lesions) on intestinal biopsy and elevated serum tissue transglutaminase (TTG IgA) and/or endomysial (EMA IgA) antibody levels17. In Manitoba, a central laboratory performs all serum TTG IgA testing which facilitated a population-based approach to reduce recruitment bias. Specifically, a list of physicians with patients with elevated serum TTG was generated weekly throughout the enrolment period. These physicians were contacted to inform them of the study, and provided with recruitment materials for their patients. Secondary recruitment methods included referral by the endoscopist, and advertisements at retailers of gluten-free products and in the newsletter of the Manitoba Chapter of the Canadian Celiac Association. Participants were recruited within 6 weeks of GFD initiation, with additional study visits at 6, 12, and 24 months. Per usual practice, participants were referred at diagnosis to a Registered Dietitian with GFD expertise and given information about the Canadian Celiac Association patient support group.
For the DOGGIE BAG sub-study, coeliac disease participants on a strict GFD completed an additional diary, food record, and food, urine, and stool sample collection during the 10 days immediately prior to per-protocol follow-up biopsy 24 months after initiation of a GFD (Figure 1). Healthy persons without coeliac disease or a dietary gluten restriction were studied as positive controls for gluten ingestion. Exclusion criteria (applicable to both groups): 1) inability to complete diary and/or collect samples; 2) baseline stool frequency <3/week; or 3) concurrent digestive or malabsorptive disorder other than disaccharide intolerance (e.g., viral gastroenteritis, small intestinal bacterial overgrowth, inflammatory bowel disease). Participants on a “strict GFD” were trying to follow a strict gluten-free diet and did not report intentional gluten exposure.
Figure 1. Study design.

Participants completed a detailed food diary and collected 3 urine samples daily for three days. During the first 7 days, a “doggie bag” containing 25% of all food and some beverages was saved. Stool (minimum 4 samples on different days) was collected starting at day 4 to allow for washout of any gluten consumed prior to the start of the study period.
All DOGGIE BAG study participants were instructed to follow their usual dietary patterns including any packaged/processed and restaurant or take-out meals. To reduce participant burden and account for intestinal transit, food samples were collected for the first 7 days and stools were collected on days 4–10. Participants were instructed to collect their first morning urine (50 mL) plus two additional samples daily (preferably midday and at bedtime) throughout the study period. The participants provided with specific instructions to prevent contamination with gluten during sample collection. Sterile collection containers were provided as well as a −20°C freezer (Whynter LLC, Brea, CA) in which to store all food and body waste samples. GIP are stable for >72 hours at room temperature in urine and stool; nevertheless, a thermometer was also provided to monitor freezer temperature.
The study protocol was reviewed by the University of Manitoba Health Research Ethics Board.
Participant diary and standardized measures of coeliac disease activity and gluten-free diet adherence
Participants logged sample collection times and kept a food record. Each day, participants reported whether they thought that they may have ingested gluten, and described any symptoms of suspected gluten exposure. Responses were independent, so participants could suspect gluten exposure without symptoms or vice versa. If gluten exposure was suspected, then participants indicated which food(s) they suspected contained gluten. At the end of the study, participants completed standardized coeliac disease specific self-report measures, including: Celiac Symptom Index (CSI)18, a 16-item measure with possible scores ranging from 16 to 80 on which scores of 30 are less are associated with better quality of life and GFD adherence; Celiac Diet Assessment Tool (CDAT)19, a seven-item self-report measure with questions about symptoms and personal traits, with possible scores ranging from 7 to 35 on which scores of 12 or less are associated with adequate adherence; and Gluten-Free Eating Assessment Tool Short (GF-EATs), a single-item self-reported adherence scale with 5 categorical responses ranging from frequent gluten (more than once per week) to no gluten20. In addition, GFD adherence was assessed by a Registered Dietitian with expertise in GFD based using the Dietitian Integrated Evaluation Tool for Gluten-Free Diets (GFD) which incorporates assessment of: 3-day food records; food frequency questionnaire including gluten-free and gluten-containing items; assessment of risk behaviors and precautions to avoid gluten at home, work/school, restaurants and other people’s homes; and label reading skills21. This was reported using a 10-point ordinal descriptive scale on which higher scores correspond to greater adherence with a score of 10 reserved for individuals living in gluten-free homes who eat out only a few times per year. Scores for the Manitoba Celiac Disease Inception Cohort at 24 months range from 1 to 10 with a median of 8 (IQR 6–8)
Food collection
During the first 7 days, participants provided portions of food consumed, including sauces, salad dressings, flavoured coffees and beer. Unprocessed, inherently gluten-free foods were not collected (e.g., raw or steamed fresh fruits or vegetables without dressing or sauce; water, wine, 100% fruit juice or unflavoured milk, tea, filtered coffee made at home from whole beans). A representative ¼ portion was selected as it was more accurate than a 1/3 portion (based upon weight of food sampled as a proportion of weight of the total meal) in a pilot study of 10 persons (data not shown). A digital scale (Ozeri ZK14-S, Ozeri USA, San Diego, CA) was provided to facilitate accurate sampling. Detailed in-person and written instructions were provided regarding collection of “representative” sample of all foods on their plate to account for complex meals with multiple food components.
Thawed food samples were batch processed for each participant and pooled based upon time consumed (04.01–10.00, 10.10–16.00, 16.00–04.00). Each pooled sample was homogenized using a 1000W triple blade stainless steel blender (Breville, Saint Laurent, QC) with deionized water added when required to facilitate mixing. The blender was thoroughly cleaned and rinsed between each sample.
Quantification of gluten in food samples
Gluten content of food (ppm) was determined using gliadin as a standard according to the recommendations of the Working Group on Prolamine Analysis and Toxicity22 using an A1-G12 antibody sandwich enzyme-linked immunosorbent assay9 (ELISA; GlutenTox ELISA Sandwich A1-G12, Hygiena Diagnostica, Seville, Spain) that is specific and sensitive for the most gluten immunogenic peptides in food23. Gluten concentration in food samples was determined according to the following formula to account for sample dilution:
The amount of gluten consumed was estimated using the following formula to convert from ppm to mg and account for sampling of ¼ of food as plated (the participant ate the other ¾):
Following sample dilution, the working limit of quantification of this method is 1.6 ppm gluten.
Quantification of GIP in stool samples
Stool samples were thawed and the entire collection was manually homogenized. Stool GIP concentration was determined by sandwich ELISA (iVYLISA GIP Stool kit, iVYDAL In Vitro Diagnostics®, Biomedal S.L., Seville, Spain) according to the manufacturer’s protocol. Each sample was run in duplicate with ≥4 different aliquots tested on different days using α-gliadin 33-mer as GIP reference material. The accuracy of this method in detecting gluten in stool has been reported previously: analytical sensitivity having limits of detection and quantification of 60 and 160 ng GIP per gram stool, respectively; and diagnostic sensitivity and specificity of 98.5% and 100%, respectively12. GIP are stable in stool stored between −20 and −80°C for more than 12 months, and through multiple freeze-thaw cycles.
Quantification of GIP in urine samples
Urine samples were processed for testing by the iVYCHECK GIP Urine (iVYDAL In Vitro Diagnostics®, Biomedal S.L., Seville, Spain) according to the manufacturer’s recommendations. This immunochromatographic test uses G12/A1 antibodies and provides a visual result as a red line in the test zone14. Samples with positive qualitative results were quantified using the iVYCHECK Reader. The validity of this method in detecting GFD transgressions was determined by the analytical sensitivity using α-gliadin 33mer peptide (limits of detection and quantification 2.2 and 6.3 ng per mL urine, respectively). Each sample was run in duplicate and at least two different aliquots of each sample were tested on different days.
Tissue transglutaminase antibody levels
Serum TTG IgA levels were determined by the Immunology Lab at St Boniface Hospital, Winnipeg, Canada. In May 2015, the assay was changed from ImmuLisa (Immco Diagnostics Inc, Buffalo NY) to Bioplex 2200 (Bio-Rad Laboratories (Canada) Inc, Montreal QC). All results are reported as multiples of the upper limit of normal (ULN) for the assay used (ImmuLisa 20, Bioplex 15).
Results
All recruited participants, which included 18 persons with coeliac disease on a GFD (12 female; median 41 years, range 21–77) and 3 healthy persons who consumed gluten regularly (1 female; ages 20, 36, 43 years) completed the study protocol (Table 1). As reported previously, participants with coeliac disease were generally asymptomatic although some reported mild symptoms; Celiac Symptom Index (CSI) scores ranged from 19 to 4017. Celiac diet adherence test (CDAT) scores were ≤14 suggesting adequate adherence; however, self-reported GFD adherence on the Gluten-Free Eating Assessment Tool short (GF-EATs) suggested higher rates of gluten exposure. Median serum TTG IgA at 24 months was 0.6 ULN (range 0.07 to 2.67), a more than ten-fold decrease from diagnosis, providing further evidence that gluten consumption had been reduced.
Table 1 –
Coeliac Disease Participant Characteristics at Baseline and after 24 months on a Gluten-free Diet According to Gluten Ingestion and Excretion (N=18)
| Diagnosis | 24 months | ||
|---|---|---|---|
| Gluten detected (N = 12) | No gluten detected (N=6) | ||
| Age [years (IQR)] | 41 (21–77) | 48 (28–63) | 39 (36–45) |
| Female [% (n)] | 56 (66%) | 8 (66%) | 4 (66%) |
| HLA Genotype [% (n)] | |||
| DQ2 | 15 (83%) | 11 (92%) | 4 (66%) |
| DQ8 | 1 (6%) | -- | 1 (17%) |
| DQ2/DQ8 | 2 (11%) | 1 (8%) | 1 (17%) |
| TTG IgA serology (reported as multiples of upper limit of normal) [median (IQR)] | 9 (3.6 – > 10) | 0.73 (0.28–1.3) | 0.50 (0.32–1.2) |
| Celiac symptom index (CSI) [median (IQR)] | 39.5 (39.3–47.8) | 29 (26–33) | 30 (27–35) |
| 1 | -- | -- | 2 (33%) |
| Dietitian Global Assessment Score (DIET-GFD) | |||
| 5 | --- | 1 (8%) | -- |
| 6 | --- | 2 (16%) | 1 (17%) |
| 7 | --- | 3 (25%) | 2 (33%) |
| 8 | --- | 5 (42%) | 1 (17%) |
| 9 | --- | 1 (8%) | 2 (33%) |
| Marsh classification [% (n)] | |||
| 0 | -- | 4 (33%) | 2 (33%) |
| 1 | -- | -- | 2 (33%) |
| 2 | -- | -- | -- |
| 3a | 30 (35%) | 8 (66%) | 2 (33%) |
| 3b | 36 (43%) | -- | -- |
| 3c | 19 (22%) | -- | -- |
DIET-GFD – Dietitian Integrated Evaluation Tool for Gluten-Free Diets
The mean number of pooled food samples was 17.4 (range 12–21). Those with fewer samples tended not to have a sample for the 04:01–10:00 time interval because they ate fruit and/or drank coffee/tea at breakfast. Three food samples were not collected (2 forgot; 1 participant travelled to the United States and was unable to return with the sample). Participants collected a mean 29.0 (range 22–30) urine samples and 4.2 (range 3–6) stool samples. Urine sample collections were missed due to urinary incontinence, working conditions and forgetfulness. There were no freezer failures.
Gluten in food and GIP in urine and stool: Healthy participants on a gluten-containing diet
The 3 participants on a gluten-containing diet collected samples during 62 of 63 possible time intervals. Nine (14%) food samples did not contain detectable gluten and 1 contained only 4 ppm gluten. Most (75%) contained very high amounts of gluten that exceeded the upper limit of the dynamic range of the assay (~600 ppm gluten, depending on sample dilution). Consistent with these findings, 67 of 88 (76%) urine samples contained between 2.2 and 58.5 ng GIP/mL, and all 12 (100%) stool samples contained detectable GIP.
Gluten in food: Coeliac disease participants on a GFD
Coeliac disease participants following a GFD ate food prepared in their own home, at others’ homes and at restaurants, and several participants travelled away from home. Overall, 25/313 (8%) pooled food samples tested positive. Based upon sample weights, median estimated gluten exposure was 2.1 mg per ingestion (range 0.2 to >80 mg). Foods that tested positive for gluten were consumed throughout the day and included baked goods, sausages, snacks and restaurant meals that were allegedly gluten-free (Table 3).
Table 3 –
Details of pooled food samples that tested positive for gluten immunogenic peptides
| Estimated mg gluten | Study ID | Day eaten | Time eaten (24 hr clock) |
Foods in positive sample | Notes | Marsh grade at 24 months |
|---|---|---|---|---|---|---|
| 0.2 | 11 | 5 | 17.00 | Cheese flavour corn chips, hard caramel candies | Chips labelled gluten-free | 3a |
| 1 | 5 | 3 | 11.00 13.00 |
Caramel candy Muffin with cheese |
No gluten-containing ingredients | 3a |
| 1.1 | 2 | 2 | 10.30 | Eggs, waffles | Waffles made at home from mix labelled GF | 3a |
| 1.4 | 5 | 4 | 12–15.00 15.00 |
Smoothie Cookie, marshmallow |
Purchased from smoothie shop Suspected gluten in cookie |
3a |
| 1.5 | 16 | 3 | 7.00 | 2 slices GF bread, fried eggs, ham, cheese. | 3a | |
| 1.6 | 17 | 1 | 13.45 | Steak, baked beans, fried potatoes | Restaurant meal | 0 |
| 2.6 | 12 | 4 | 7.15 | Toast (GF labeled bread), jam, peanut butter | Toast in GF side of shared 4-slice toaster. Dedicated GF condiments. | 3a |
| 2.7 | 7 | 1 | 19.45 22.45 |
Ham/quinoa casserole Granola bar (certified GF oats) |
At a house party | 0 |
| 3 | 16 | 3 | 18.00 21.00 |
Fish, duck, French fries Cornflakes with milk |
3a | |
| 3 | 17 | 3 | 17.38 19.20 |
Pepperoni pizza Dark chocolate |
GF pizza from restaurant with shared kitchen. Suspected. Brand may contain barley. |
0 |
| 3.2 | 8 | 7 | 9.00 | Ham and tomato omelet | 3a | |
| 4 | 16 | 7 | 12.00 | Pork and potato | 3a | |
| 5.4 | 16 | 2 | 19.00 | Chicken, duck, fried rice | Symptomatic, not suspected. | 3a |
| 6 | 17 | 5 | 9.20 | Donut | Labeled GF. Attributed suspected exposure to leftover pizza eaten later in day | 0 |
| 7.5 | 16 | 1 | 18.00 | Chicken, ham, potatoes | Symptomatic, not suspected. | 3a |
| 9.5 | 11 | 1 | 12.30 | Rice grits, potato chips | Grits wheat-free, no gluten-containing ingredients | 3a |
| 10.1 | 12 | 3 | 16.30 19.15 21.00 |
PB&J sandwich bar GF spaghetti, parmesan cheese Cheesecake |
GF labeled oat product GF labeled pasta GF label |
3a |
| 19.5 | 12 | 5 | 19.30 | Perogies, sausage, salad | Perogies local GF baker. Sausage farmer’s market (told was GF). | 3a |
| 25 | 12 | 2 | 18.30 | GF naan bread, vindaloo, rice | Restaurant with GF menu, identified as coeliac needing GF | 3a |
| 27 | 16 | 5 | 11.30 | Beef, potato, peas, carrots | 3a | |
| 36 | 16 | 3 | 11.30 15.00 |
Sausage, potato Apple pie |
3a | |
| 39 | 14 | 2 | 16.00 18.00 |
Sausage Flavoured corn chips |
Butcher told was GF | 0 |
| 40 | 16 | 4 | 11.30 | Chicken, borscht, carrot | 3a | |
| 57 | 16 | 7 | 21.30 | Beer, hamburger, vegetables | Intentional gluten ingestion? | 3a |
| 80 | 16 | 1 | 11.30 | Hamburger, potatoes | Symptomatic, not suspected. | 3a |
Bold text indicates items that participants identified as potentially containing gluten; GF – gluten-free.
GIP in urine and stool: Coeliac disease participants on a GFD
Overall, 30/519 (6%) urine samples tested positive for gluten. Positive samples from 8 participants contained 2.2 to 26.8 ng GIP per mL. For stool, 8/75 (11%) tested positive, containing 140 to 910 ng GIP per gram stool (Table 2). Five participants had at least one positive stool sample.
Table 2 –
Detection of Gluten in Food, and GIP in Urine and Stool Collected Over a 10 day Period From Participants with Coeliac Disease on a GFD for 24 months (N=18)
| Sample type | Number of samples | Number of Positive samples | Number of Participants with positive sample |
|---|---|---|---|
| Food | 313 | 25 (8%) | 9 (50%) |
| Urine | 519 | 30 (6%) | 8 (44%) |
| Stool | 75 | 8 (11%) | 5 (28%) |
| All samples | 907 | 63 (7%) | 12 (67%) |
Association between suspected gluten exposure and detection of GIP
For the coeliac disease participants, there were 20 days when gluten exposure was suspected, 14 of which were during the first seven days when food samples were collected. Twenty-seven foods were implicated related to concerns about cross-contact with gluten in restaurants or at home, specific ingredients (e.g., Worcestershire sauce), specific foods (e.g., cookie prepared by co-worker) and suspicions based upon symptoms. Most participants (73%) who suspected a gluten exposure had at least one positive food, stool or urine sample; however, only two participants correctly identified the culprit food (2 samples). There was only case in which gluten was detected when symptoms of gluten exposure were experienced. Four of the seven participants who did not suspect a gluten exposure had at least one sample that tested positive for GIP.
Correlation and time course of documented gluten consumption and detection of GIP in urine or stool
There were 25 documented gluten exposures from food, 8 of which were associated with a positive urine sample within 36 hours and 9 of which were associated with a positive stool sample 2 to 4 days later (Figure 2). The interval between consumption of a food sample that tested positive for gluten and GIP detection in urine ranged from 2 to 49 hours.
Figure 2. Time course of gluten ingestion and excretion by participants with food, stool and/or urine sample(s) testing positive.
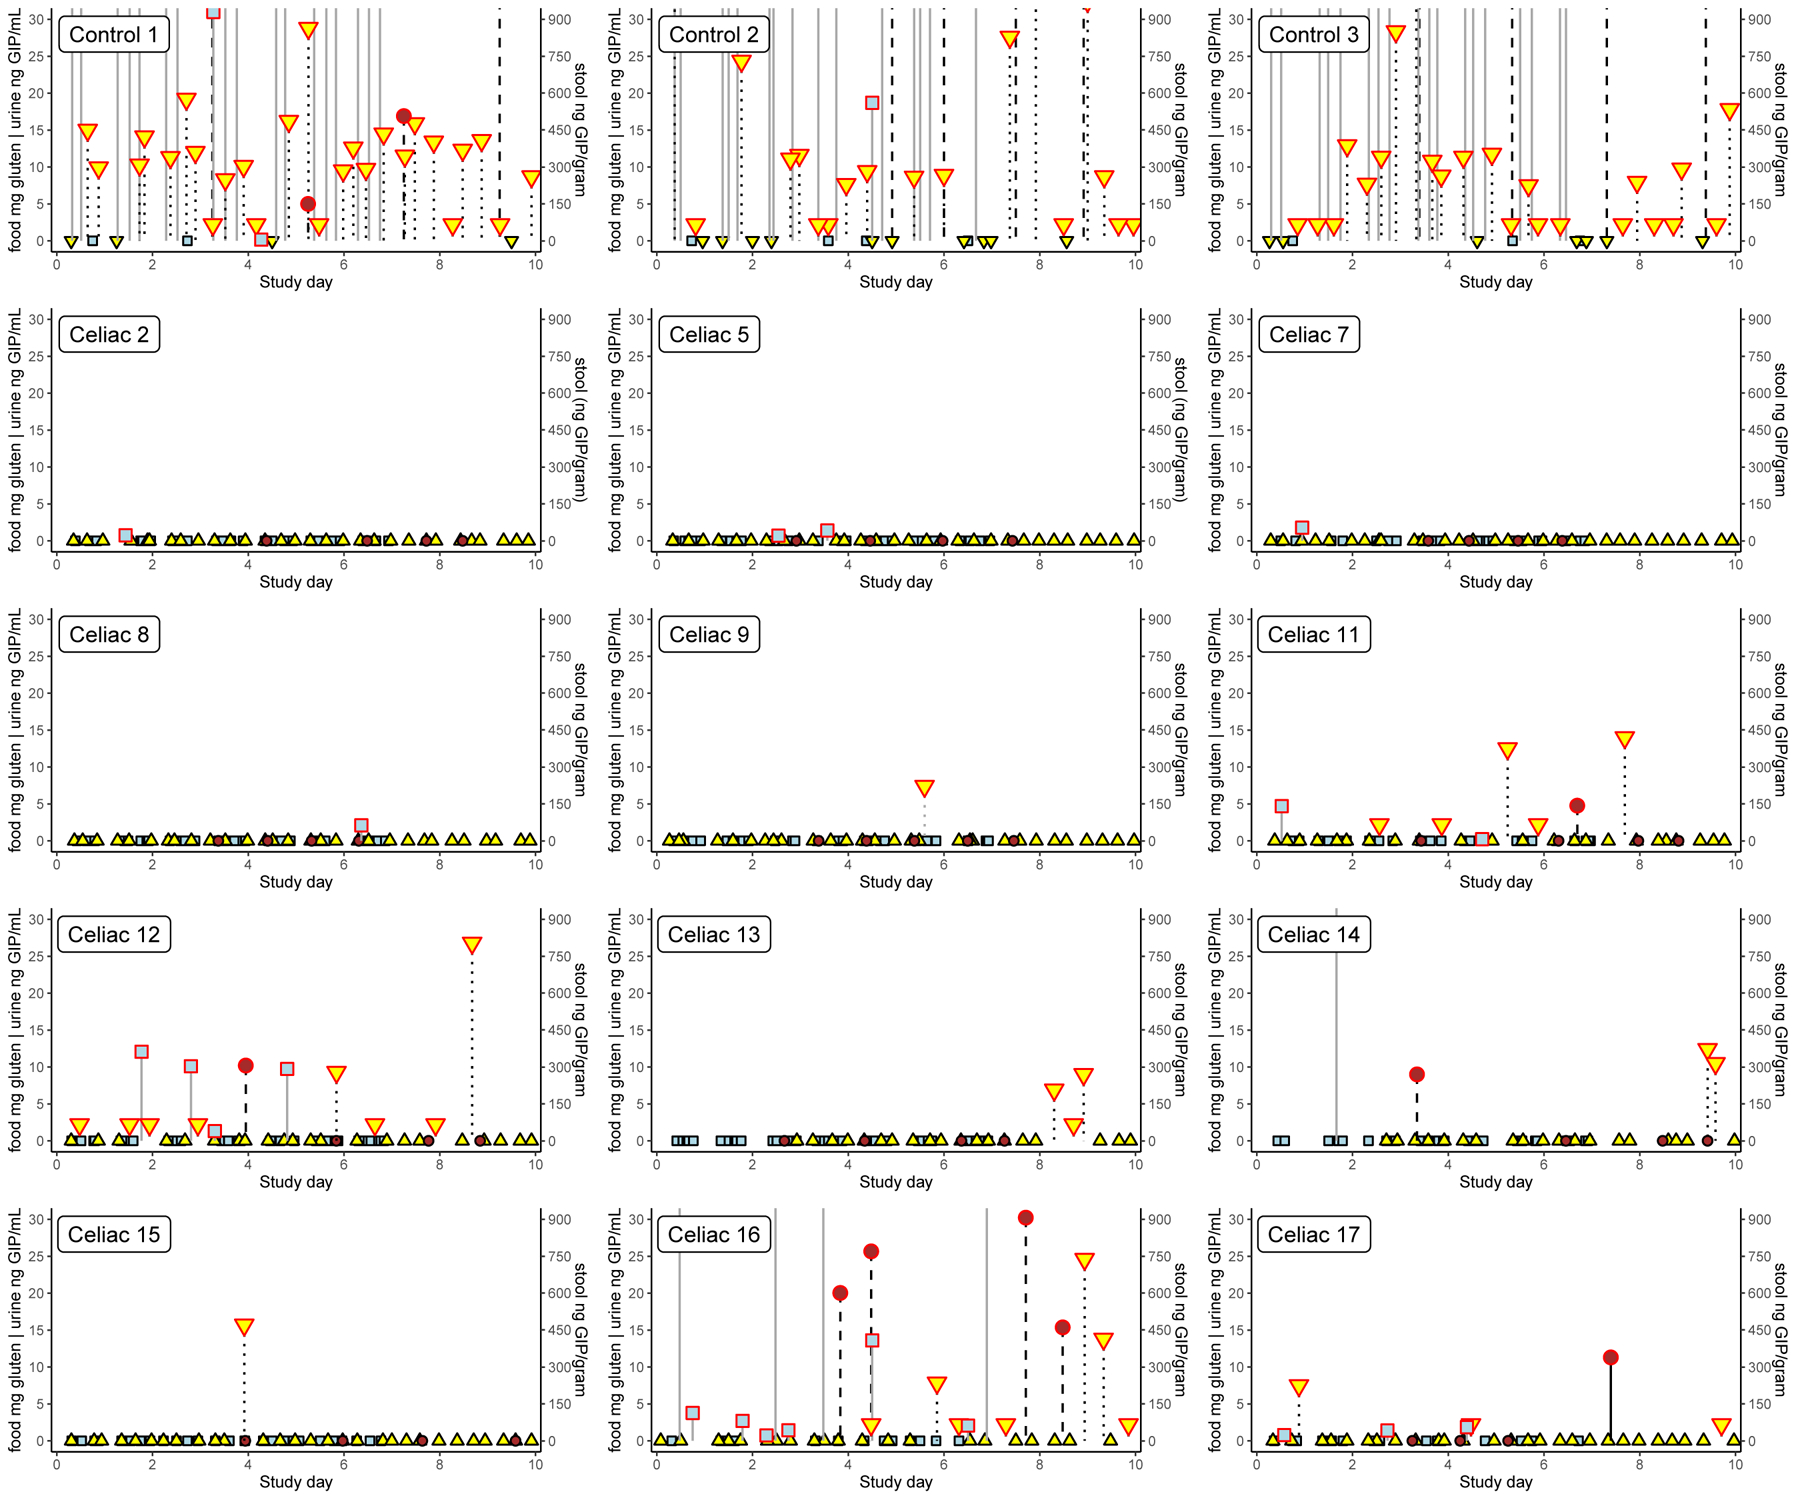
Food samples are indicated by light blue squares, urine by yellow triangles and stool by brown circles. Samples in which gluten was detected are outlined in red. The left axis denotes the amount of gluten in milligrams detected in food samples and concentration of GIP in urine samples (ng/mL). Food samples testing over the upper limit of the assay are plotted outside the range and there is no symbol denoting the actual value. The right axis denotes the concentration of GIP in stool (ng/g). Results from the 3 healthy controls who consumed gluten regularly (panel A) and the 12 participants following a GFD who had any sample with detectable GIP (panel B) are shown. All samples from the other 6 participants on a GFD tested negative. Participant 11 consumed 4.7 mg gluten (17 ppm) in rice grits and potato chips and 0.2 mg gluten (4 ppm) in nacho chips and caramel candies 3 days later. In both cases, urine tested positive for GIP 49 hours after exposure. Participant 12 consumed 12.1 mg gluten (35 ppm) on day #2, 10.1 mg gluten (21 ppm) on day #3, 1.3 mg gluten (11 ppm) on day #4 and 9.7 mg gluten (42 ppm) on day #5. Urine was positive for GIP within 4 hours of the first two exposures, and 25 hours after the fourth exposure. Stool produced on the night of day #4 contained GIP. Participant 17 consumed 0.8 mg gluten (6 ppm) on day #1, 1.4 mg gluten (5 ppm) on day #3 and 1.8 mg gluten (45 ppm) on day#5. GIP were detected in urine 7.5 hours after the first exposure and 2 hours after the third exposure. Stool collected on the morning of day #8 contained detectable GIP. Participant 14 had consumed >20 mg gluten (>100 ppm) on day #2 with GIP detected in stool collected 48 hours later. Urine samples tested negative; however, no samples were obtained between 6 and 24 hours after gluten exposure. Participants 2, 5, 7 and 8 each had at least one exposure to up to 2.1 mg gluten with no GIP detected in any contemporaneous urine or stool samples. Participant 16 had repeated gluten exposure with 10 (59%) of food samples collected containing detectable levels of GIP (no samples tested positive on day#6). Stool samples collected on days 4, 5, 8 and 9 all contained GIP. GIP were not detected in any urine sample collected day #1 through day #4, but at least one urine sample contained GIP on day #5 through day #10.
Discussion
This study confirms that gluten ingestion occurs frequently despite efforts to follow a strictly gluten free diet. Our findings likely represent a “best case” scenario as participants were highly engaged having participated in a research study since diagnosis and had access to highly skilled dietitians with GFD expertise. Gluten exposure was often unsuspected and occurred at home as well as when eating out. Twelve of eighteen persons with coeliac disease on an intentional GFD, based upon standardized self-report measures, were exposed to gluten within the 10 day study period. The estimated amount of gluten consumed ranged from 0.2 mg to more than 80 mg. This is orders of magnitude less than the 3 to 10 grams typically utilized in gluten challenge studies, which may partially explain why most gluten exposures were silent (no symptoms reported) and unsuspected by participants. The clinical consequences of chronic intermittent milligram range gluten exposures observed in our study are unknown. As previously reported, there was discordance between gluten exposures and villous atrophy in our cohort, which may be related to the timing of follow-up biopsy, duration of the sample collection period, and/or high sensitivity assay detecting milligram-range gluten ingestions17.
We observed considerable inter-individual variability in the interval between gluten consumption and GIP excretion in urine, a phenomenon previously reported in healthy individuals14,24. Some participants absorbed and excreted GIP relatively rapidly, with GIP detectable in urine collected within hours of ingestion. Others displayed a more protracted time course with GIP appearing in urine collected 24 hours after gluten consumption. Renal dysfunction was an exclusion criterion but we did not study gastric emptying or small intestinal transit. Participants were instructed to collect three urine samples per day (preferably first morning, during the day and at bedtime), so we likely did not capture all urine that contained GIP. This complicates evaluation of the relationship between estimated gluten consumption and detection of GIP in urine. However, among individuals with multiple gluten exposures, the interval between gluten consumption and collection of urine with detectable GIP was generally consistent intra-individually (i.e., for a given participant) and ranged from <4 to >24 hours.
There was also variation in the amount of gluten ingestion that was associated with detection of gluten in urine. The smallest estimated gluten exposure that was detected was 0.2 mg, which is two orders of magnitude less than what was determined to be the limit of detection for healthy individuals14. This participant reported that they may have been exposed to gluten transferred from toast prepared in a 4-slice toaster with a shared crumb tray, but dedicated gluten-free toasting slots. Situations in which gluten may be introduced through cross-contact highlight the challenges associated with estimating gluten content through sampling of food, as gluten may not be homogenously distributed and the sampled portion is not consumed.
The kinetics of gluten absorption and excretion may be affected by multiple factors in addition to the amount consumed. Intact dietary proteins, including ovalbumin25, lactoglobulin26 and gliadin24,27, may be detected in serum within minutes of ingestion and the concentration tends to peak within hours. Numerous studies have demonstrated transcellular passage of proteins across the small intestinal epithelium which is likely the predominant mechanism in healthy persons. In a case series of 5 patients with CD, Husby et al26 demonstrated that absorption of ovalbumin and lactoglobulin was more rapid and more extensive in untreated patients with villous atrophy than in those who were following a GFD. Absorbed dietary proteins are not bound to immune complexes and serum protein concentration is not related to antigen-specific IgG, IgA or IgM25. The phenomenon of wheat dependent exercise-induced anaphylaxis (WDEIA) is instructive. Affected individuals are prone to anaphylaxis if they exercise after wheat consumption, but not with wheat consumption alone or exercise alone. Exercise is associated with increased serum gliadin levels28, and detectable serum gliadin is associated with positive response to wheat plus exercise challenge27. Non-steroidal anti-inflammatory drugs (NSAIDs) also increase antigen uptake24 and may induce wheat dependent exercise-induced anaphylaxis.
Detection of GIP in urine is dependent upon intestinal absorption as well as renal excretion. Circulating gluten is filtered by the kidneys which reabsorb most proteins. Urinary peptides are derived from proteolysis of non-reabsorbed proteins. Although poorly correlated, renal dysfunction is associated with a decrease in the urine peptide-to-protein ratio29. Urinary peptide excretion is increased in children with coeliac disease compared to age- and sex-matched controls30 and decreases following treatment with a GFD31.
Many circumstances may contribute to gluten ingestion. Introduction of gluten to inherently gluten-free grains can occur during any stage from planting through harvest and processing32. Commercial seed may legally contain off-types (seeds other than the stated variety or strain). Accordingly, commercial “naturally” gluten-free grain products often contain >20 ppm gluten in Canada [61/640 (9.5%)]33 and the United States [7/22 (32%)]34, including grain products with a “gluten-free” label35. Food products labeled as gluten-free have also been tested. In Europe, there was negligible gluten content in the 205 commercially available gluten-free foods tested36, while in a US study approximately 5% of the 158 gluten-free products tested above levels of 20 ppm37. Further, these studies might be underestimating gluten content because they typically utilized the R5 antibody sandwich ELISA method which produced high variation of results in interlaboratory proficiency studies38 and does not detect small hydrolyzed gluten fragments or some of the most immunogenic gluten peptides39,40. In a systematic review of 24 cross-sectional studies, gluten contamination of both processed foods (13.2%) and raw ingredients (41.3%)41 was common. Gluten ingestion may also occur as a result of household contamination, such as through use of shared cooking utensils42. Finally, patients may inadvertently ingest gluten due to incomplete information about ingredients or misinterpretation of food labels due to misconceptions regarding the gluten-free status of an ingredient. All of these situations occurred during the study, and many participants suspected gluten ingestion based upon how food was prepared in a shared kitchen or unclear product label information. Our study was not designed to assess whether gluten exposure is associated with where a food is prepared. This question is difficult to answer definitively because food preparation is complicated and “self-prepared” meals are themselves sourced using ingredients from outside the home. Several participants commented upon this in the margin of their food records (e.g., “told it was gluten-free” in reference to products purchased at a farmer’s market). We did not collect sufficiently granular data on the source of all components of meals, or indeed gluten testing data, to discern the extent to which they were derived from pure ingredients vs assembled from partially prepared foods.
Strengths of this study include analysis of food samples in addition to analysis of temporally relevant urine and stool using an assay for the immunodominant gluten peptide over a multi-day period. As well, participants were recruited from a larger longitudinal research study with comprehensive regular follow-up that included review of practices to avoid cross-contact as well as assessments of label-reading skills. These participants were recruited within weeks of initiating a GFD so were all at a similar point in their disease trajectory when they participated in the study.
While this may limit the generalizability of the findings, one might expect that the general population of patients with coeliac disease, many of whom do not receive regular disease-specific follow-up43,44, would be less successful at eliminating gluten from their diet. Previous trials of patients with coeliac disease asked to maintain a GFD45 have shown a Hawthorne Effect, i.e., observation of behavior changes behavior. Our participants may have initially intensified their adherence to the GFD due to their study participation – two-thirds of positive urine samples were collected during the latter half of the observation period. Thus, it is possible that this study under-estimated typical “real world” gluten exposures. Another potential limitation is that we did not test all foods and beverages consumed during the 10 day study period, which could under-estimate gluten ingestion, and makes it difficult to correlate gluten excretion during the last days of the study with gluten ingestion. Although participants were given clear instructions, we did not monitor the accuracy of sampling from complex meals composed of multiple foods. Prior to this study, there were limited data available regarding the gluten content of food directly consumed by patients with coeliac disease. Therefore, we made the pragmatic decision to maximize the likelihood of capturing gluten exposure by excluding presumably gluten-free unprocessed foods or medications, which are generally thought to be unlikely to contain clinically significant amounts of gluten46.
In conclusion, notable aspects of this study include our use of recently developed tests for gluten in food, urine and stool to measure directly gluten ingestion and excretion in individuals with coeliac disease who are endeavoring to follow a GFD. Even in a relatively brief observation period of just 10 days, two-thirds of participants were found to have ingested and/or excreted gluten. Our results suggest that most patients with coeliac disease in actuality can only attain a gluten reduced diet, and the recommended strict GFD may not be possible to maintain fully. While ongoing unrestricted gluten ingestion is known to be a risk for development of complications, the clinical consequences of intermittent low-level gluten exposures are unknown. Given that gluten exposure may be inevitable, it is necessary to understand better what degree of exposure is harmful and who may be more predisposed to persistent disease activity at the relatively low exposure levels observed in this study. Additionally, the potential role of self-monitoring technologies that provide real-time feedback on gluten content of food and on gluten excretion is largely unexplored. Ultimately, less challenging and more feasible treatments are needed for coeliac disease. A viable pharmacologic treatment for coeliac disease must account for frequent sporadic gluten exposures on the order of milligrams which may be silent and unsuspected.
Acknowledgements:
The authors thank the participants for their dedication and diligence in sample collection. The Manitoba Celiac Cohort was funded by the Canadian Institutes of Health Research, Manitoba Health Research Council and Canadian Celiac Association. Biomedal S.L. provided reagents. JAS received salary support from the Canadian Institutes of Health Research, Canadian Association of Gastroenterology, Children’s Health Research Institute of Manitoba, Harvard Medical School Eleanor and Miles Shore Fellowship in Gastroenterology and the National Institute Of Diabetes And Digestive And Kidney Diseases of the National Institutes of Health under Award Numbers T32 DK007760 and K23 DK119584. The content is solely the responsibility of the authors and does not necessarily represent the official views of the National Institutes of Health. CB is supported in part by the Bingham Chair in Gastroenterology. CS was supported by Ministerio de Economía y Competitividad, Spain SAF2017-83700-R.
Footnotes
Statement of Interests
Potential Competing Interests: CNB has served on advisory boards of Abbvie Canada, Ferring Canada, Janssen Canada, Pfizer Canada, Roche Canada,Takeda Canada, and has consulted to Mylan Pharmaceuticals and Takeda. He has received unrestricted educational grants from Abbvie Canada, Janssen Canada, Pfizer Canada, Shire Canada, and Takeda Canada. He has been on speaker’s bureau of Ferring Canada, Janssen Canada, Takeda Canada, and Medtronic Canada.
AC is the CEO and shareholder of Biomedal S.L. He is also partner of Glutenostics LLC. Biomedal was the licensor of G12/A1 monoclonal antibodies for detection in food, urine and stool at the time of the study.
DRD has received research funding from Biomedal S.L. and has served as a consultant for Takeda Pharmaceuticals and Shire Canada and is Chair of the Professional Advisory Council of the Canadian Celiac Association.
RD was an employee of Biomedal S.L. at the time of the study.
CPK has acted as a scientific advisor to Cour Pharma, Glutenostics, Innovate, ImmunogenX, Innovate and Takeda. He also acts as Principal Investigator on a research grant on coeliac disease supported by Aptalis.
DAL is a Medical Director for Takeda Pharmaceuticals.
FL was an employee of Celimmune at the time of the study, and is currently an employee of Provention Bio. He also serves as a partner in Biomedal and Glutenostics.
JAS has served on an advisory board of Takeda Pharmaceuticals and received research support from Cour Pharma, Glutenostics and the Celiac Disease Foundation.
IC, KHG, LAG, LNR, CS, VS and DW have no disclosures.
References
- 1.Lebwohl B, Sanders DS, Green PHR. Coeliac disease. Lancet (London, England). 2017;6736(17):1–12. [DOI] [PubMed] [Google Scholar]
- 2.Rubio-Tapia A, Hill ID, Kelly CP, Calderwood AH, Murray JA. ACG clinical guidelines: diagnosis and management of celiac disease. Am J Gastroenterol. 2013;108(5):656–676; quiz 677. [DOI] [PMC free article] [PubMed] [Google Scholar]
- 3.Hall NJ, Rubin G, Charnock A. Systematic review: adherence to a gluten-free diet in adult patients with coeliac disease. Aliment Pharmacol Ther. 2009;30(4):315–330. doi: 10.1111/j.1365-2036.2009.04053.x [DOI] [PubMed] [Google Scholar]
- 4.Silvester JA, Graff LA, Rigaux L, Walker JR, Duerksen DR. Symptomatic suspected gluten exposure is common among patients with coeliac disease on a gluten-free diet. Aliment Pharmacol Ther. 2016;44(6):612–619. doi: 10.1111/apt.13725 [DOI] [PMC free article] [PubMed] [Google Scholar]
- 5.Stefanolo JP, Tálamo M, Dodds S, et al. Real-world Gluten Exposure in Patients With Celiac Disease on Gluten-Free Diets, Determined From Gliadin Immunogenic Peptides in Urine and Fecal Samples. Clin Gastroenterol Hepatol. March 2020. doi: 10.1016/j.cgh.2020.03.038 [DOI] [PubMed] [Google Scholar]
- 6.Shah S, Akbari M, Vanga R, et al. Patient perception of treatment burden is high in celiac disease compared with other common conditions. Am J Gastroenterol. 2014;109(9):1304–1311. doi: 10.1038/ajg.2014.29 [DOI] [PMC free article] [PubMed] [Google Scholar]
- 7.Wolf RL, Lebwohl B, Lee AR, et al. Hypervigilance to a Gluten-Free Diet and Decreased Quality of Life in Teenagers and Adults with Celiac Disease. Dig Dis Sci. 2018;63(6):1438–1448. doi: 10.1007/s10620-018-4936-4 [DOI] [PubMed] [Google Scholar]
- 8.Wungjiranirun M, Kelly CP, Leffler DA. Current Status of Celiac Disease Drug Development. Am J Gastroenterol. 2016;(March):1–8. doi: 10.1038/ajg.2016.105 [DOI] [PubMed] [Google Scholar]
- 9.Morón B, Bethune MT, Comino I, et al. Toward the assessment of food toxicity for celiac patients: characterization of monoclonal antibodies to a main immunogenic gluten peptide. PLoS One. 2008;3(5):e2294. doi: 10.1371/journal.pone.0002294 [DOI] [PMC free article] [PubMed] [Google Scholar]
- 10.Taylor SL, Nordlee JA, Jayasena S, Baumert JL. Evaluation of a Handheld Gluten Detection Device. J Food Prot. 2018;81(10):1723–1728. doi: 10.4315/0362-028X.JFP-18-184 [DOI] [PubMed] [Google Scholar]
- 11.Wolf RL, Green PHR, Lee AR, Reilly NR, Zybert P, Lebwohl B. Benefits From and Barriers to Portable Detection of Gluten, Based on a Randomized Pilot Trial of Patients With Celiac Disease. Clin Gastroenterol Hepatol. 2019;(April):112–114. doi: 10.1016/j.cgh.2019.03.011 [DOI] [PMC free article] [PubMed] [Google Scholar]
- 12.Comino I, Fernández-Bañares F, Esteve M, et al. Fecal Gluten Peptides Reveal Limitations of Serological Tests and Food Questionnaires for Monitoring Gluten-Free Diet in Celiac Disease Patients. Am J Gastroenterol. 2016;111(10):1456–1465. doi: 10.1038/ajg.2016.439 [DOI] [PMC free article] [PubMed] [Google Scholar]
- 13.Comino I, Segura V, Ortigosa L, et al. Prospective longitudinal study: use of faecal gluten immunogenic peptides to monitor children diagnosed with coeliac disease during transition to a gluten-free diet. Aliment Pharmacol Ther. 2019;(November 2018):1484–1492. doi: 10.1111/apt.15277 [DOI] [PMC free article] [PubMed] [Google Scholar]
- 14.Moreno M de L, Cebolla Á, Muñoz-Suano A, et al. Detection of gluten immunogenic peptides in the urine of patients with coeliac disease reveals transgressions in the gluten-free diet and incomplete mucosal healing. Gut. 2017;66(2):250–257. doi: 10.1136/gutjnl-2015-310148 [DOI] [PMC free article] [PubMed] [Google Scholar]
- 15.Shan L, Molberg Ø, Parrot I, et al. Structural basis for gluten intolerance in celiac sprue. Science. 2002;297(5590):2275–2279. doi: 10.1126/science.1074129 [DOI] [PubMed] [Google Scholar]
- 16.Syage JA, Kelly CP, Dickason MA, et al. Determination of gluten consumption in celiac disease patients on a gluten-free diet. Am J Clin Nutr. 2018;107(2):201–207. doi: 10.1093/ajcn/nqx049 [DOI] [PubMed] [Google Scholar]
- 17.Silvester JA, Comino I, Kelly CP, Sousa C, Duerksen DR, DOGGIE BAG Study Group. Most Patients With Celiac Disease on Gluten-Free Diets Consume Measurable Amounts of Gluten. Gastroenterology. 2020;158(5):1497–1499.e1. doi: 10.1053/j.gastro.2019.12.016 [DOI] [PMC free article] [PubMed] [Google Scholar]
- 18.Leffler DA, Dennis M, Edwards George J, et al. A validated disease-specific symptom index for adults with celiac disease. Clin Gastroenterol Hepatol. 2009;7(12):1328–1334, 1334.e1–3. doi: 10.1016/j.cgh.2009.07.031 [DOI] [PubMed] [Google Scholar]
- 19.Leffler DA, Dennis M, Edwards George JB, et al. A simple validated gluten-free diet adherence survey for adults with celiac disease. Clin Gastroenterol Hepatol. 2009;7(5):530–536, 536.e1–2. doi: 10.1016/j.cgh.2008.12.032 [DOI] [PubMed] [Google Scholar]
- 20.Silvester JA, Comino I, Kelly CP, Sousa C, Duerksen DR, DOGGIE BAG Study Group. Most Patients With Celiac Disease on Gluten-free Diets Consume Measurable Amounts of Gluten. Gastroenterology. December 2019. doi: 10.1053/j.gastro.2019.12.016 [DOI] [PMC free article] [PubMed] [Google Scholar]
- 21.Atsawarungruangkit A, Silvester JA, Weiten D, et al. Development of the Dietitian Integrated Evaluation Tool for Gluten-Free Diets (DIET-GFD). Nutrition. 2020;Accepted,. [DOI] [PMC free article] [PubMed] [Google Scholar]
- 22.Immer U, Haas-Lauterbach S. Gliadin as a measure of gluten in foods containing wheat, rye, and barley-enzyme immunoassay method based on a specific monoclonal antibody to the potentially celiac toxic amino acid prolamin sequences: collaborative study. J AOAC Int. 2012;95(4):1118–1124. doi: 10.5740/jaoacint.CS2012 [DOI] [PubMed] [Google Scholar]
- 23.Bruins Slot ID, Bremer MGEG, Van Der Fels-Klerx I, Hamer RJ. Evaluating the performance of gluten ELISA test kits: The numbers do not tell the tale. Cereal Chem. 2015;92(5):513–521. doi: 10.1094/CCHEM-07-14-0166-R [DOI] [Google Scholar]
- 24.Matsuo H, Kaneko S, Tsujino Y, K K. Effects of non-steroidal anti-inflammatory drugs (NSAIDs) on serum allergen levels after wheat ingestion. J Dermatol Sci. 2009;53(3):241–243. doi: 10.1016/j.jdermsci.2008.10.005 [DOI] [PubMed] [Google Scholar]
- 25.Husby S, Jensenius JC, Svehag SE. Passage of undegraded dietary antigen into the blood of healthy adults. Quantification, estimation of size distribution, and relation of uptake to levels of specific antibodies. Scand J Immunol. 1985;22(1):83–92. [DOI] [PubMed] [Google Scholar]
- 26.Husby S, Foged N, Høst a, Svehag SE. Passage of dietary antigens into the blood of children with coeliac disease. Quantification and size distribution of absorbed antigens. Gut. 1987;28(9):1062–1072. doi: 10.1136/gut.28.9.1062 [DOI] [PMC free article] [PubMed] [Google Scholar]
- 27.Kohno K, Matsuo H, Takahashi H, et al. Serum Gliadin Monitoring Extracts Patients with False Negative Results in Challenge Tests for the Diagnosis of Wheat-Dependent Exercise-Induced Anaphylaxis. Allergol Int. 2013;62(2):229–238. doi: 10.2332/allergolint.12-OA-0495 [DOI] [PubMed] [Google Scholar]
- 28.Matsuo H, Morimoto K, Akaki T, et al. Exercise and aspirin increase levels of circulating gliadin peptides in patients with wheat-dependent exercise-induced anaphylaxis. Clin Exp Allergy. 2005;35:461–466. [DOI] [PubMed] [Google Scholar]
- 29.Singh A, Gudehithlu KP, Le G, et al. Decreased urinary peptide excretion in patients with renal disease. Am J Kidney Dis. 2004;44(6):1031–1038. doi: 10.1053/j.ajkd.2004.08.025 [DOI] [PubMed] [Google Scholar]
- 30.Reichelt WH, Ek J, Stensrud M, Reichelt KL. Peptide Excretion in Celiac Disease. J Pediatr Gastroenterol Nutr. 1998;26(3):305–309. [DOI] [PubMed] [Google Scholar]
- 31.Ek J, Stensrud M, Reichelt KL. Gluten-free diet decreases urinary peptide levels in children with celiac disease. J Pediatr Gastroenterol Nutr. 1999;29(3):282–285. [DOI] [PubMed] [Google Scholar]
- 32.Collin P, Thorell L, Kaukinen K, Mäki M. The safe threshold for gluten contamination in gluten-free products. Can trace amounts be accepted in the treatment of coeliac disease? Aliment Pharmacol Ther. 2004;19(12):1277–1283. doi: 10.1111/j.1365-2036.2004.01961.x [DOI] [PubMed] [Google Scholar]
- 33.Koerner TB, Cléroux C, Poirier C, Cantin I, Alimkulov A, Elamparo H. Gluten contamination in the Canadian commercial oat supply. Food Addit Contam Part A. 2011;28(6):705–710. doi: 10.1080/19440049.2011.579626 [DOI] [PMC free article] [PubMed] [Google Scholar]
- 34.Thompson T, Lee AR, Grace T. Gluten contamination of grains, seeds, and flours in the United States: a pilot study. J Am Diet Assoc. 2010;110(6):937–940. doi: 10.1016/j.jada.2010.03.014 [DOI] [PubMed] [Google Scholar]
- 35.Koerner TB, Cleroux C, Poirier C, et al. Gluten contamination of naturally gluten-free flours and starches used by Canadians with celiac disease. Food Addit Contam Part A Chem Anal Control Expo Risk Assess. 2013;30(12):2017–2021. doi: 10.1080/19440049.2013.840744 [DOI] [PubMed] [Google Scholar]
- 36.Gibert A, Kruizinga AG, Neuhold S, et al. Might gluten traces in wheat substitutes pose a risk in patients with celiac disease? A population-based probabilistic approach to risk estimation. Am J Clin Nutr. 2013;97(1):109–116. doi: 10.3945/ajcn.112.047985 [DOI] [PubMed] [Google Scholar]
- 37.Thompson T, Simpson S. A comparison of gluten levels in labeled gluten-free and certified gluten-free foods sold in the United States. Eur J Clin Nutr. 2015;69(2):143–146. doi: 10.1038/ejcn.2014.211 [DOI] [PubMed] [Google Scholar]
- 38.Cebolla Á, Moreno M de L, Coto L, Sousa C. Gluten immunogenic peptides as standard for the evaluation of potential harmful prolamin content in food and human specimen. Nutrients. 2018;10(12):1–16. doi: 10.3390/nu10121927 [DOI] [PMC free article] [PubMed] [Google Scholar]
- 39.Thompson T, Méndez E. Commercial assays to assess gluten content of gluten-free foods: why they are not created equal. J Am Diet Assoc. 2008;108(10):1682–1687. doi: 10.1016/j.jada.2008.07.012 [DOI] [PubMed] [Google Scholar]
- 40.Moreno M de L, Muñoz-Suano A, López-Casado MÁ, Torres MI, Sousa C, Cebolla Á. Selective capture of most celiac immunogenic peptides from hydrolyzed gluten proteins. Food Chem. 2016;205:36–42. doi: 10.1016/j.foodchem.2016.02.066 [DOI] [PubMed] [Google Scholar]
- 41.Falcomer AL, Santos Araújo L, Farage P, Santos Monteiro J, Yoshio Nakano E, Puppin Zandonadi R. Gluten contamination in food services and industry: A systematic review. Crit Rev Food Sci Nutr. December 2018:1–15. doi: 10.1080/10408398.2018.1541864 [DOI] [PubMed] [Google Scholar]
- 42.See JA, Kaukinen K, Makharia GK, Gibson PR, Murray JA. Practical insights into gluten-free diets. Nat Rev Gastroenterol Hepatol. 2015;12(10):580–591. doi: 10.1038/nrgastro.2015.156 [DOI] [PubMed] [Google Scholar]
- 43.Silvester JA, Leichtner AM, Alhassan E, Weir DC, Hintze ZJ, Blansky BA. Lack of Follow-up of Pediatric Patients With Celiac Disease. Clin Gastroenterol Hepatol. 2019. doi: 10.1016/j.cgh.2018.12.027 [DOI] [PMC free article] [PubMed] [Google Scholar]
- 44.Herman ML, Rubio-Tapia A, Lahr BD, Larson JJ, Van Dyke CT, Murray J a. Patients with celiac disease are not followed up adequately. Clin Gastroenterol Hepatol. 2012;10(8):893–899.e1. doi: 10.1016/j.cgh.2012.05.007 [DOI] [PMC free article] [PubMed] [Google Scholar]
- 45.Murray JA, Kelly CP, Green PHR, et al. No Difference Between Latiglutenase and Placebo in Reducing Villous Atrophy or Improving Symptoms in Patients With Symptomatic Celiac Disease. Gastroenterology. 2017;152(4):787–798.e2. doi: 10.1053/j.gastro.2016.11.004 [DOI] [PubMed] [Google Scholar]
- 46.U.S. Department of Health and Human Services Food and Drug Administration. Gluten in Drug Products and Associated Labeling Recommendations Guidance for Industry. DRAFT GUIDANCE.; 2017.