Abstract
Objective:
The incidence of colorectal cancer is increasing every year, and autophagy may be related closely to the pathogenesis of colorectal cancer. Autophagy is a natural catabolic mechanism that allows the degradation of cellular components in eukaryotic cells. However, autophagy plays a dual role in tumorigenesis. It not only promotes normal cell survival and tumor growth but also induces cell death and suppresses tumors survival. In addition, the pathogenesis of various conditions, including inflammation, neurodegenerative diseases, or tumors, is associated with abnormal autophagy. The present work aimed to examine the significance of autophagy-related genes (ARGs) in prognosis prediction, to construct an autophagy prognostic model, and to identify independent prognostic factors for colorectal cancer (CRC).
Methods:
This study discovered a total of 36 ARGs in CRC cases using The Cancer Genome Atlas (TCGA) and Human Autophagy-dedicated (HADd) databases along with functional enrichment analysis. Then, an autophagy prognostic model was constructed using univariate Cox regression analysis, and the key prognostic genes were screened. Finally, independent prognostic markers were determined through independent prognostic analysis and clinical correlation analysis of key genes.
Results:
Of the 36 differentially expressed ARGs, 13 were related to prognosis, as determined by univariate Cox regression analysis. A total of 6 key genes were obtained by a multivariate Cox regression analysis. Independent prognostic values were shown by 3 genes, namely, microtubule-associated protein 1 light chain 3 (MAP1LC3C), small GTPase superfamily and Rab family (RAB7A), and WD-repeat domain phosphoinositide-interacting protein 2 (WIPI2) by independent prognostic analysis and clinical correlation.
Conclusions:
In this study, molecular bioinformatics technology was employed to determine and construct a prognostic model of autophagy for colon cancer patients, which revealed 3 autophagy-related features, namely, MAP1LC3C, WIPI2, and RAB7A.
Keywords: autophagy, prognostic model, colorectal cancer, bioinformatics, markers
Introduction
Autophagy is a natural catabolic mechanism that degrades the intracellular components in eukaryotic cells.1,2 This process is referred to as the type II programmed cell death, and its abnormality is involved in the pathogenic mechanisms of many disorders, such as inflammatory disease, neurodegenerative disorders, or cancers.3,4 However, how autophagy plays a role in cancer diseases remains unknown. Since autophagy is a complex process, more research should be conducted to explore the association of autophagy with tumors and to exploit potential biological processes that might have important clinical implications for evaluating a novel therapeutic method for cancer.
Colorectal cancer (CRC) is a common cancer that affects both colonic and rectal cells found in the digestive tract and accounts for high morbidity and mortality rates.5-7 The incidence of CRC, the fifth most malignant tumors in China, is increasing every year. Some studies have demonstrated the 2-way regulatory role of autophagy in the development of CRC. Autophagy promotes not only tumor growth and cell survival, but also suppresses tumors and promotes cell death, providing a clear approach for the clinical management of CRC.6 The study by Chen et al 8 showed that decyl caffeic acid (DC) inhibited the cell death caused by autophagy during CRC HCT–116 cell treatment, and the depletion of DC can suppress the proliferation of CRCs to varying degrees. Some studies have also shown that targeted autophagy can increase the sensitivity of anti-CRC chemotherapy drugs.9 Therefore, it is important to explore the appropriate molecular biomarkers for the clinical treatment and prognosis of CRC.
Here, the correlations of the expression patterns of the autophagy-related genes (ARGs) were studied using the clinical data of 514 CRC cases obtained from The Cancer Genome Atlas (TCGA), and an autophagy prognosis model was constructed. Independent prognostic analysis and clinical correlation analysis were performed, in which risk scores and clinical factors of ARGs were combined to find biomarkers that affect the prognosis of CRC cases.
Materials and Methods
Data Collection
A total of 232 autophagy genes were extracted from the HADb (Human Autophagy Database, http://www.autophagy.lu/index.html), which was the first database constructed exclusively for autophagy and lists the ARGs in the human body. In this study, HADb was used to acquire multifarious ARGs. In addition, the transcriptome data (mRNA sequencing data) and the clinical information including 473 CRC tissue samples and 41 normal samples were downloaded from the TCGA database (https://portal.gdc.cancer.gov). Besides, the clinical-pathological characteristics data of the patients, including gender, age, survival status, tumor grade, stage, and other information, were also included in the clinical data.
Enrichment Analysis of Differentially Expressed ARGs (DEARGs)
DEARGs in CRC compared with normal samples were estimated using the R statistical software and were presented as |log2 (Fold Change, FC)|>1 along with FDR <0.05. Biological characteristics were explored using functional analysis, such as gene ontology (GO) and the Kyoto Protocol Encyclopedia of Genes and Genomes (KEGG). The R packages “Autophagy. GO.R,” Autophagy. KEGG.R,” “BiocManager limma” and “BiocManager heatmaps” were used for enrichment analysis.
Construction of Autophagy Prognosis Model Based on ARGs
The ARG expression profiles were obtained from the TCGA and HADb databases. Univariate Cox regression analysis by R package software “survival.R” was used to analyze the obtained data to find the prognostic-related autophagy genes related to the survival of patients with CRC. Subsequently, an autophagy prognostic model was constructed and optimized by multivariate Cox regression, and the key genes were screened. The linear combination of coefficients was adopted for examining the gene levels. Finally, the relative risk for each patient was determined using the constructed model. CRC cases were divided into 2 groups, (i) the high-risk (H) and (ii) the low-risk (L) groups, according to the median risk score value. In addition, hazard ratios (H), along with the 95% confidence interval (CI) values were determined.
Evaluation of the Prognostic Models and Clinical Correlation Analysis
First, the survival condition was compared between the 2 groups using R package software, and the Kaplan–Meier (K–M) survival curve together with the risk curve was drawn. Then, the R package “survival.R” was used for univariate and multivariate independent prognostic analysis to explore the relationship between the clinicopathological characteristics and the risk scores, and the independent prognostic factors were screened. Finally, the R package “survivalROC.R” was used to plot the ROC curve, and the area under ROC curve (AUC) value was determined to verify model prediction accuracy. Scatterplot was drawn using the R package “beeswarm.R” for clinical correlation analysis. Key autophagy genes and the risk values were analyzed with the clinicopathological characteristics to predict the biomarkers for the prognosis of CRC.
Statistical Analysis
The statistical analyses were performed using R 3.6.3 (https://www.r-project.org/) and ActivePerl (https://www.activestate.com/). Plots were drawn using the R package software. Single/multifactor regression analysis, model construction, independent prognosis analysis, and correlation analysis were performed using the R package software. All the statistical tests were 2-sided, and p < 0.05 was considered statistically significant.
Results
Differentially Expressed ARGs
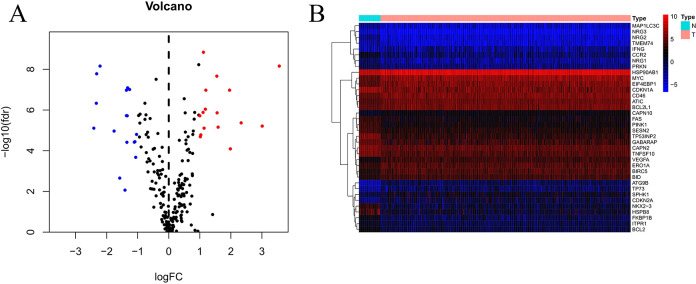
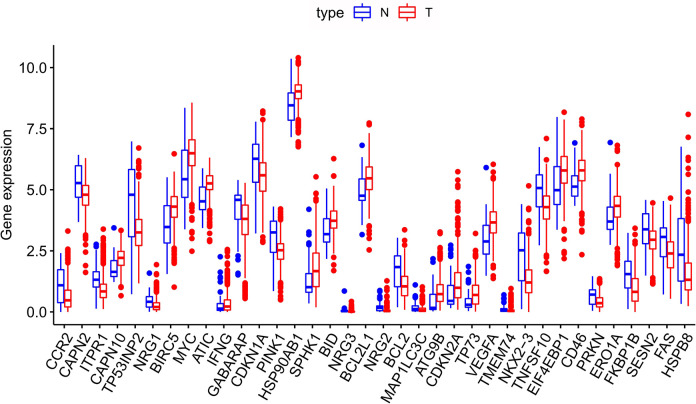
The transcriptome and clinical information of 473 CRC tissue samples and 41 normal samples were downloaded from TCGA. A total of 452 CRC patients who had available clinical data as well as gene expression patterns were enrolled in this study. The expressions of 206 ARGs were collected using the threshold of FDR < 0.05 together with |log2(FC)|>1, and eventually, 16 upregulated and 20 downregulated ARGs (Figure 1) were obtained. Furthermore, 36 DEARGs in CRC compared with non-carcinoma samples were expressed using box plot analysis (Figure 2). The Figure 2 displays the expression patterns of 20 downregulated genes (CCR2, CAPN2, ITPR1, TP53INP2, NRG1, GABARAP, CDKN1A, PINK1, NRG3, NRG2, BCL2, MAP1LC3C, TMEM74, NKX2–3, TNFSF10, PRKN, FKBP1B, SESN2, FAS, HSPB8) and 16 upregulated genes (CAPN10, BIRC5, MYC, ATIC, IFNG, HSP90AB1, SPHK1, BID, BCL2L1, ATG9B, CDKN2A, TP73, VEGFA, EIF4EBP1, CD46, and ERO1A).
Figure 1.
DEARGs in CRC in comparison to non-carcinoma samples. (A) Volcano plot showing the 206 ARGs obtained from the TCGA and HADb databases. Red color is indicative of up-regulation, whereas blue color denotes down-regulation. Black color indicates that the differences between the CRC and non-carcinoma samples were not significant. (B) Hierarchical cluster analysis on the expression of DEARGs.
Figure 2.
Expression profiles for 36 ARGs within CRC and non-carcinoma tissues. Red bar indicates the different cancer samples, while blue bar suggests the non-carcinoma samples. Red dots on top of each gene name indicate significant up-regulation, whereas blue dots represent significant down-regulation.
Functional Annotations for DEARGs
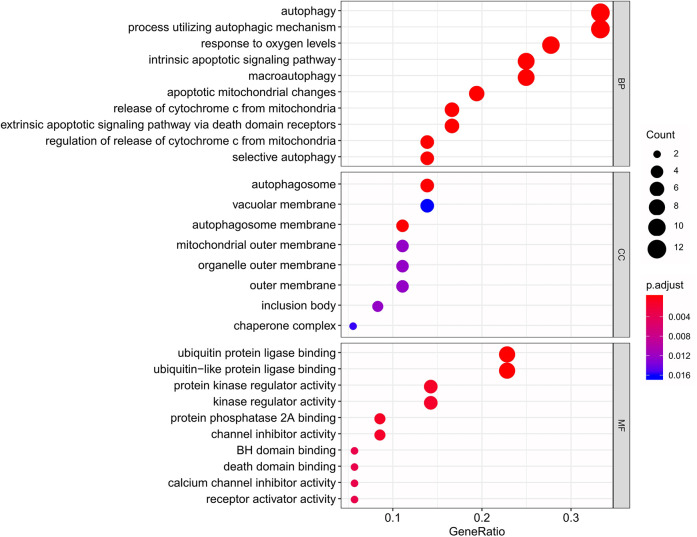
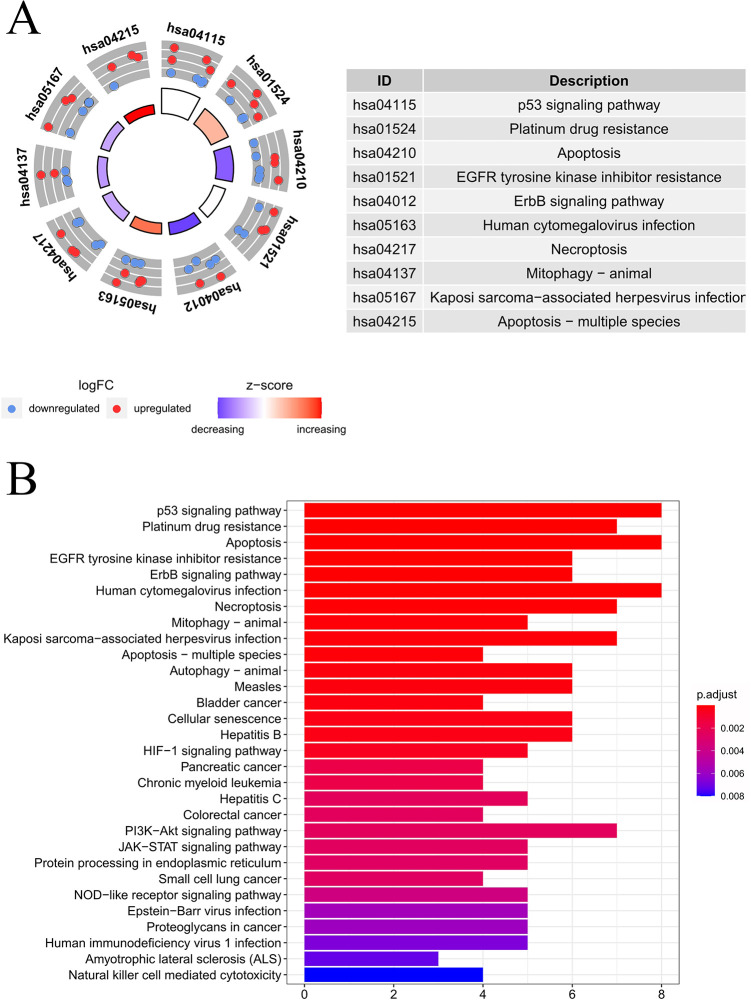
Table 1 presents the functional annotations for the 36 DEARGs, including the functions of GO terms, together with the enrichment of KEGG pathways. The most significant biological processes (BPs) for the GO terms included cytochrome C release in the mitochondria, autophagy, response to oxygen levels, and changes in apoptotic mitochondria, while the most significant cellular components (CC) were the autophagy membrane, autophagosome, outer mitochondrial membrane, and the outer membranes of organelles. In regard to the molecular function (MF), most of the identified genes showed enrichment within the protein kinase regulator activity, protein phosphatase 2A binding, ubiquitin-like protein ligase binding, kinase regulating activity, ubiquitin-protein ligase binding, etc. The results are shown in Figure 3. Moreover, as revealed by the KEGG pathway analysis, the DEARGs mainly showed enrichment within the P53 signal transduction pathway, platinum resistance, apoptosis, ErbB signal transduction pathway, and HIF–1 signal transduction pathway (Figure 4B). The heatmap concerning the association of ARGs with the pathways is presented in Figure 4B.
Table 1.
GO and KEGG Analysis of Differentially Expressed Autophagy-Related Genes.
| Category | ID | Description | P-values | Gene ID |
|---|---|---|---|---|
| BP | GO:0006914 | autophagy | 7.59E-11 | ITPR1/TP53INP2/IFNG/GABARAP/PINK1/BCL2/MAP1LC3C/ATG9B/TMEM74/PRKN/SESN2/HSPB8C |
| BP | GO:0061919 | process utilizing autophagic mechanism | 7.59E-11 | ITPR1/TP53INP2/IFNG/GABARAP/PINK1/BCL2/MAP1LC3C/ATG9B/TMEM74/PRKN/SESN2/HSPB8 |
| BP | GO:0001836 | release of cytochrome c from mitochondria | 1.39E-09 | PINK1/BID/BCL2L1/BCL2/TNFSF10/PRKN |
| BP | GO:0070482 | response to oxygen levels | 2.44E-09 | CAPN2/ITPR1/MYC/CDKN1A/PINK1/BCL2/VEGFA/EIF4EBP1/ERO1A/FAS |
| BP | GO:0097193 | intrinsic apoptotic signaling pathway | 2.94E-09 | ITPR1/CDKN1A/PINK1/BID/BCL2L1/BCL2/TP73/PRKN/ERO1A |
| BP | GO:0008637 | apoptotic mitochondrial changes | 3.42E-09 | PINK1/BID/BCL2L1/BCL2/TP73/TNFSF10/PRKN |
| BP | GO:0016236 | macroautophagy | 3.52E-09 | TP53INP2/GABARAP/PINK1/MAP1LC3C/ATG9B/TMEM74/PRKN/SESN2/HSPB8 |
| BP | GO:0008625 | extrinsic apoptotic signaling pathway via death domain receptors | 1.40E-08 | GABARAP/BID/BCL2L1/BCL2/TNFSF10/FAS |
| BP | GO:0090199 | regulation of release of cytochrome c from mitochondria | 3.22E-08 | PINK1/BID/BCL2L1/TNFSF10/PRKN |
| BP | GO:0061912 | selective autophagy | 3.58E-08 | PINK1/MAP1LC3C/PRKN/SESN2/HSPB8 |
| CC | GO:0000421 | autophagosome membrane | 5.29E-07 | GABARAP/MAP1LC3C/ATG9B/TMEM74 |
| CC | GO:0005776 | autophagosome | 7.03E-07 | TP53INP2/GABARAP/MAP1LC3C/ATG9B/TMEM74 |
| CC | GO:0005741 | mitochondrial outer membrane | 0.000301842 | PINK1/BID/BCL2L1/BCL2 |
| CC | GO:0016234 | inclusion body | 0.000448337 | PINK1/HSP90AB1/PRKN |
| CC | GO:0031968 | organelle outer membrane | 0.000478227 | PINK1/BID/BCL2L1/BCL2 |
| CC | GO:0019867 | outer membrane | 0.000496406 | PINK1/BID/BCL2L1/BCL2 |
| CC | GO:0101031 | chaperone complex | 0.000731713 | HSP90AB1/HSPB8 |
| CC | GO:0005774 | vacuolar membrane | 0.000859549 | GABARAP/HSP90AB1/MAP1LC3C/ATG9B/TMEM74 |
| MF | GO:0031625 | ubiquitin protein ligase binding | 7.57E-08 | GABARAP/CDKN1A/PINK1/HSP90AB1/BID/BCL2/MAP1LC3C/PRKN |
| MF | GO:0044389 | ubiquitin-like protein ligase binding | 1.20E-07 | GABARAP/CDKN1A/PINK1/HSP90AB1/BID/BCL2/MAP1LC3C/PRKN |
| MF | GO:0019887 | protein kinase regulator activity | 2.61E-05 | NRG1/CDKN1A/HSP90AB1/NRG3/CDKN2A |
| ME | GO:0051721 | protein phosphatase 2A binding | 3.38E-05 | SPHK1/BCL2/EIF4EBP1 |
| MF | GO:0019207 | kinase regulator activity | 5.09E-05 | NRG1/CDKN1A/HSP90AB1/NRG3/CDKN2A |
| MF | GO:0016248 | channel inhibitor activity | 5.70E-05 | ITPR1/BCL2/FKBP1B |
| MF | GO:0051400 | BH domain binding | 0.000169 | BCL2L1/BCL2 |
| MF | GO:0070513 | death domain binding | 0.000169 | BCL2L1/BCL2 |
| MF | GO:0019855 | calcium channel inhibitor activity | 0.000207 | ITPR1/FKBP1B |
| MF | GO:0030546 | receptor activator activity | 0.000207 | NRG1/NRG3 |
| Pathway | hsa04115 | p53 signaling pathway | 1.90E-10 | CDKN1A/BID/BCL2L1/BCL2/CDKN2A/TP73/SESN2/FAS |
| Pathway | hsa01524 | Platinum drug resistance | 8.55E-09 | BIRC5/CDKN1A/BID/BCL2L1/BCL2/CDKN2A/FAS |
| Pathway | hsa04210 | Apoptosis | 3.17E-08 | CAPN2/ITPR1/BIRC5/BID/BCL2L1/BCL2/TNFSF10/FAS |
| Pathway | hsa01521 | EGFR tyrosine kinase inhibitor resistance | 4.57E-07 | NRG1/BCL2L1/NRG2/BCL2/VEGFA/EIF4EBP1 |
| Pathway | hsa04012 | ErbB signaling pathway | 7.08E-07 | NRG1/MYC/CDKN1A/NRG3/NRG2/EIF4EBP1 |
| Pathway | hsa05163 | Human cytomegalovirus infection | 1.54E-06 | ITPR1/MYC/CDKN1A/BID/CDKN2A/VEGFA/EIF4EBP1/FAS |
| Pathway | hsa04217 | Necroptosis | 2.11E-06 | CAPN2/IFNG/HSP90AB1/BID/BCL2/TNFSF10/FAS |
| Pathway | hsa04137 | Mitophagy—animal | 4.33E-06 | GABARAP/PINK1/BCL2L1/ATG9B/PRKN |
| Pathway | hsa05167 | Kaposi sarcoma-associated herpesvirus infection | 5.30E-06 | ITPR1/MYC/GABARAP/CDKN1A/BID/VEGFA/FAS |
| Pathway | hsa04215 | Apoptosis—multiple species | 6.10E-06 | BIRC5/BID/BCL2L1/BCL2 |
Figure 3.
Bubble plot showing the enriched GO terms. X-axis in barplot stood for GeneRatio, while y-axis indicated different biological processes, including BP, CC, and MF. The size of the circles displayed by different biological processes is positively correlated with the number of genes involved in each semester. In addition, the closer the color is to red, the higher their significance is.
Figure 4.
KEGG analysis on those DEARGs. (A) The outer circle presents the scatter plot of assigned gene logFC for all terms, the red ones stand for increased expression, whereas the blue ones represent decreased expression. The inner circle indicates the z-score value and the number of genes. The larger the area, the more the number of genes enriched in the pathway. The color is biased toward red, which means the greater the z-score value, and the color biased toward purple, the smaller the z-score value. (B) Histogram showing the associations of ARGs with pathways. The bar color was determined by logFC value and the bar length was determined by gene counts.
Construction and Evaluation of Autophagy Prognosis Model in CRC
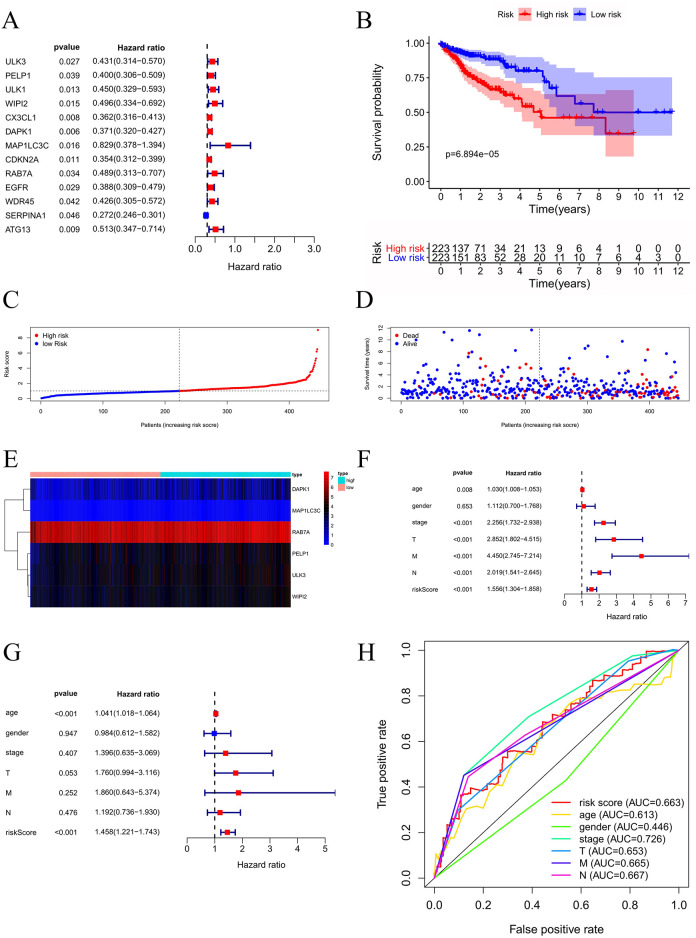
Univariate Cox regression analysis screened out 13 prognosis-related genes and constructed the autophagy prognostic model (Figure 5A). Our model was optimized by multivariate Cox regression, and 6 key genes were obtained. The prognosis-related genes are shown in Table 2. Patient survival rates at 3 and 5 years in the H and L groups were 64.6% and 84.8%, and 46.1% and 75.9%, respectively, determined using the K–M survival curve analysis. The survival rate among the patients in the L group remarkably increased relative to the H group (P < 0.001) (Figure 5B). As shown by the risk curve results, gene expression in the H group increases as the risk value increases, suggesting whether the gene is a high-risk or low-risk gene (Figure 5C-E). The relationship between clinical-pathological characteristics and risk scores was studied, and the independent prognostic analysis of univariate and multivariate Cox was performed (Figure 5F-G). Based on these observations, risk score might be used as a factor to independently predict prognosis (P < 0.001). The clinicopathological features, such as age (P < 0.001), grade (P < 0.001), T stage (P < 0.001), M stage (P < 0.001), and N stage (P < 0.001), could be used as factors to independently predict CRC prognosis. Finally, the ROC curve was plotted by combining the risk score with the clinicopathological features, and the accuracy of the model was evaluated (Figure 5H). The larger the area under the ROC curve, the more accurate was the prognosis model constructed.
Figure 5.
Construction and evaluation of autophagy prognosis model in CRC. (A) Forest map of 13 ARGs. (B) KM curve indicated apparently shortened OS in H group relative to L group. (C) Risk score distribution for CRC cases. (D) OS for CRC patients. (E) Heatmap displaying the expression patterns of those 6 key genes. (F-G) Cox independent prognosis analysis. (H) ROC curve of clinicopathological features.
Table 2.
Coefficients of Cox Regression Analysis Based on Key Genes.
| Gene-ID | Coef | HR | HR.95L | HR.95H | P-value |
|---|---|---|---|---|---|
| ULK3 | 0.487140513 | 1.6276553 | 1.002861359 | 2.641702916 | 0.048663539 |
| PELP1 | 0.399891374 | 1.491662656 | 0.965649747 | 2.304207594 | 0.071479884 |
| WIPI2 | 0.60434954 | 1.83006144 | 0.96837598 | 3.458496434 | 0.062742875 |
| DAPK1 | 0.265015269 | 1.303450878 | 1.045363764 | 1.625256441 | 0.018570466 |
| MAP1LC3C | 1.572033425 | 4.816432097 | 1.091767899 | 21.24812258 | 0.037902876 |
| RAB7A | 1.011611924 | 2.750030284 | 1.32215889 | 5.719937764 | 0.006782104 |
Prediction of the Prognostic ARGs
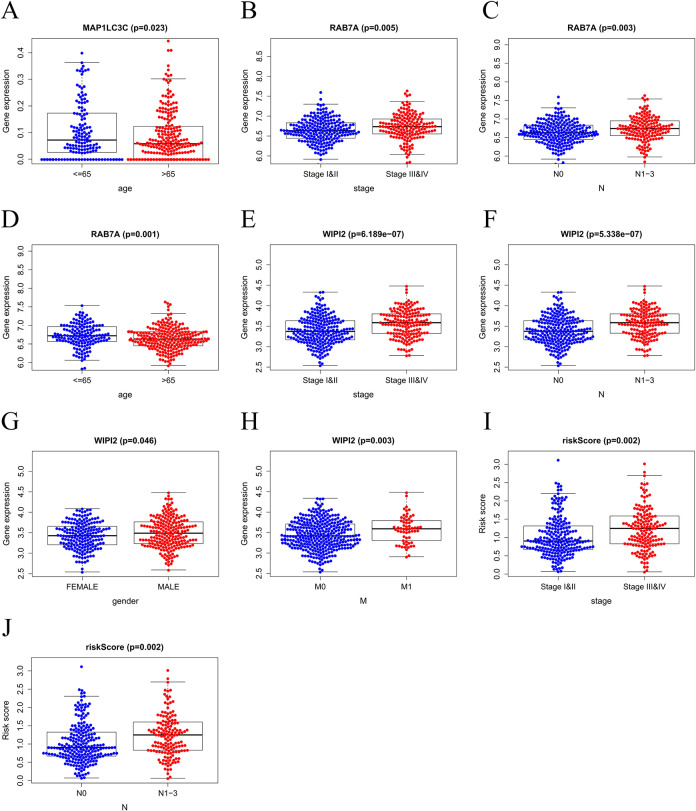
An independent sample T-test was performed, and a scatter plot was drawn (Figure 6) to explore the relationship between the clinicopathological characteristics and the expression levels with risk scores and 6 key genes, and 3 genes were identified: MAP1LC3C, RAB7A, and WIPI2. The overexpression of MAP1LC3C was shown to be closely related to the patient’s age (age ≤ 65, P = 0.023) (Figure 6A), while the overexpression of RAB7A was closely related to the patient’s age (age ≤ 65, P = 0.001), N1–3 stage (P = 0.003), and tissue grade Stage III & IV (P = 0.005) (Figure 6B-6D). WIPI2 overexpression was closely related to the patient’s gender (Male, P = 0.046), M1 stage (P = 0.003), N1–3 stage (P = 5.338e–07), and tissue grade stage III&IV (P = 6.189e–07) (Figure 6E-6H). The overexpression of risk value was closely related to clinical features N1–3(P = 0.002) and stage III&IV(P = 0.002) (Figure 6I and J). These results indicated that MAP1LC3C, RAB7A, and WIPI2 may serve as biomarkers for predicting the prognosis of CRC, and the risk score may serve as a negative marker for the prognosis of CRC.
Figure 6.
The clinical correlation analysis in Colorectal cancer. (A) MAP1LC3C expression in ages. (B-D) RAB7A expression in pathological stages, pathological N stages, ages. (E-H) WIPI2 expression in pathological stages, pathological N stages, genders, pathological M stages. (I-J) Risk scores expressed in grades of pathological N stages.
Discussion
Autophagy is a complex mechanism that promotes the degradation of damaged or excess proteins and organelles, thereby promoting metabolic pathways. The tumor-related processes pathological changes are related to abnormal autophagy.10 However, studies show that the development of tumors, such as tumor formation, development, metastasis, or even recurrence, is induced by autophagy gene overexpression and mutations. In addition, abnormal autophagy genes are involved in the clinicopathological characteristics and poor prognosis of cancer. Some RNA-binding proteins, such as DDX17, SETDB1, and POLR3, regulate autophagy in CRC by developing tumors and then searching for potential therapeutic targets in CRC.11 Abnormal expression of NTF4 in CRC also affects autophagy. Knock-out of NTF4 prevents the transition of epithelial cells into mesenchyme in CRC and activates autophagy through the interaction of autophagy-related gene 5 (ATG5) with the mitogen-activated protein kinase pathway, thereby inhibiting the proliferation, migration, and invasion of the cells, along with clone-forming capacity, while promoting the arrest of cell cycle. NTF4 might also act as a biomarker for predicting OS and prognosis for CRC cases.12
Abnormal expression of genes may play an important role in CRC occurrence, progression, or prognosis. Therefore, an autophagy prognosis model was constructed and optimized in the present study to determine the significant genes. In addition, patient risk score, univariate/multivariate independent prognostic analysis, and clinical correlation analysis were used to clarify the relationship between gene expression level and clinical prognosis based on the autophagy prognostic model, and the K–M survival curve, risk curve, and ROC multi-index curve were obtained. The results indicated that among the clinical-pathological features, age, stage, and TMN classification can serve as independent prognostic factors. Three of the important genes, MAP1LC3C, RAB7A, and WIPI2 are related to the clinicopathological characteristics (P < 0.05) and can predict the prognosis of CRC.
MAP1LC3C, the key structural protein in the autophagosome membrane, is used as a biomarker for the autophagy mechanism. Studies have shown that MAP1LC3C mediates the MET/HGF-RTK signal axis in cancer. The MAP1LC3C and MET complex recruits HGF and activates MET-RTK for autophagic degradation, such that the changes in the MAP1LC3C expression affect tumor metastasis.13
RAB7A, the small GTPase belonging to the RAB family, plays a key role in late endosome/lysosome transport.14 Studies have shown that RAB7A participates in various regulatory mechanisms, such as lysosomal biosynthesis and phagocytosis, by interacting with upstream regulators/downstream effector molecules. In addition, various cellular functions, including autophagy, cell signal transduction, apoptosis, and survival are reported for RAB7A.15-18 However, metastasis or occurrence of human cancer may be caused by RAB7A mutation or dysfunction. RAB7A is more deeply studied in tumor growth, mainly related to cell autophagy14. The study by Dorayappan KDP19 demonstrated that RAB7A is downregulated in hypoxic ovarian cancer cells, and knocks down its upstream factor STAT3 to regulate the RAB7A expression, significantly increasing apoptosis and reducing the proliferation of tumor cell. An in vivo experiment by Tian She20 showed that hypoxia-induced miR-138-5p can inhibit cancer growth as well as autophagy by inhibiting the SIRT1/FoxO1/Rab7 signaling pathway.
WD-repeat domain protein interacting with phosphoinositides (WIPI2), a member of the WIPI family, is a mammalian homolog of the yeast ATG18 gene. WIPI2 combines ω-body and the phosphatidylinositol 3-phosphate [PI(3)P] enrichment domain of the endoplasmic reticulum, forming autophagosomes.21,22 Some studies show that autophagy dysregulation and abnormal expression in various cancers are caused by WIPI.23,24 Yu25 found that WIPI1 is highly expressed in PKO cells in CRC. RT-PCR shows that knockdown of WIPI1 affects the cells, particularly proliferation and apoptosis, thereby inhibiting the occurrence and development of CRC cells. Liao26 found that the production of LC3-associated autophagosomes through WIPI1 together with WIPI2 is increased by Rvp1, thereby promoting the migration of macrophages by upregulating autophagy, increasing the phosphorylated level of MAPK1/3, while enhancing the MMP9 effect, causing Rvp1 to induce cell apoptosis and inhibit the migration of tumor cells. Another study showed that different cancer samples present an abnormally-expressed human WIPI gene. For example, the expression of WIPI2 and WIPI4 mRNA is significantly different in advanced pancreatic cancer. Further experiments showed that increased ability of WIPI gene-mediated autophagy in the precancerous stage gradually decreased during the transition from pancreatic tumor to adenocarcinoma, indicating that the abnormal expression of the WIPI gene and the change in the autophagy activity play a vital part in cancer genesis and progression.27
In China, the incidence of CRC is increasing every year. Even when the patient receives surgical treatment, a high possibility of recurrence remains. At present, the assessment of the recurrence or prognosis of CRC patients is mainly related to clinicopathological characteristics and tumor staging.28 However, due to differences in genetics and other reasons, this method cannot be considered an ideal assessment of the prognosis of patients.29,30 Although some studies have explored the relationship between autophagy genes and CRC, they are mainly based on the discovery of a certain gene. Few people have attempted to establish autophagy prognosis models and explore the relationship between multiple autophagy genes and the prognosis of CRC patients.31,32 Therefore, this study analyzed multiple autophagy genes and clinicopathological characteristics using the Cox regression model on the TCGA and HADb databases and then applying the autophagy prognosis model to analyze the clinical prognosis of CRC. Various tools and software were employed in this study to process and analyze large amounts of data. Nonetheless, this study has certain limitations. First, this is a retrospective study. The sample size should be increased and prospective research should be conducted. Second, the information on the expression levels of genes such as LncRNA and miRNA should be included. More prognostic factors should be included, which may further improve the credibility of the results for future in-depth research.
Conclusions
In summary, a prognostic model was constructed based on 13 ARGs using information obtained from the TCGA and HADb databases, and the clinical characteristics of CRC were analyzed. Finally, 3 high-risk genes, namely, MAP1LC3C, RAB7A, and WIPI2, were identified as prognostic biomarker genes for CRC. These genes may represent a novel approach to treat CRC.
Acknowledgments
The authors thank The Cancer Genome Atlas (TCGA), The Human Autophagy Database (HADb, http://www.autophagy.lu/index.html) for providing the data. The authors also want to thank Zhou Qi for her assistance in data processing.
Abbreviations
- ARGs
Autophagy-Related Genes
- BP
Biological Processes
- CC
Cellular Components
- CRC
Colorectal Cancer
- CI
95% Confidence Interval
- DC
Decyl Caffeic Acid
- DEARGs
Differentially Expressed ARGs
- GO
Gene Ontology
- FDR
False Discovery Rate
- HADd
Human Autophagy-dedicated
- HR
Hazard Ratio
- KEGG
he Kyoto Protocol Encyclopedia of Genes and Genomes
- K–M
Kaplan–Meier
- MAP1LC3C
Microtubule-Associated Protein 1 Light Chain 3
- MF
Molecular Function
- RA7BA
Small GTPase Superfamily and Rab Family
- ROC
Time-Dependent Receiver Operating Characteristic
- TCGA
The Cancer Genome Atlas
- WIPI2
WD-Repeat Domain Phosphoinositide-Interacting Protein 2
Authors’ Note: All authors contributed to data analysis, drafting and revising the article, gave final approval of the version to be published, and agree to be accountable for all aspects of the work. All data generated or analyzed in this study are included in this published article. The transcriptome data and clinical information of CRC analyzed in this study can be downloaded from The Cancer Genome Atlas (TCGA). The autophagy genes in this study can be downloaded from The Human Autophagy Database (HADb).
Declaration of Conflicting Interests: The author(s) declared no potential conflicts of interest with respect to the research, authorship, and/or publication of this article.
Funding: The author(s) received no financial support for the research, authorship, and/or publication of this article.
ORCID iD: Shu-min Liu  https://orcid.org/0000-0003-4327-0468
References
- 1. Towers CG, Thorburn A. Therapeutic targeting of autophagy. EBioMedicine. 2016;14:15–23. [DOI] [PMC free article] [PubMed] [Google Scholar]
- 2. Gafar AA, Draz HM, Goldberg AA. Lithocholic acid induces endoplasmic reticulum stress, autophagy and mitochondrial dysfunction in human prostate cancer cells. PeerJ. 2016;4:e2445. [DOI] [PMC free article] [PubMed] [Google Scholar]
- 3. Zhong Z, Sanchez-Lopez E, Karin M. Autophagy, inflammation, and immunity: a troika governing cancer and its treatment. Cell. 2016;166(2):288–298. [DOI] [PMC free article] [PubMed] [Google Scholar]
- 4. Mowers EE, Sharifi MN, Macleod KF. Autophagy in cancer metastasis. Oncogene. 2017;36(12):1619–1630. [DOI] [PMC free article] [PubMed] [Google Scholar]
- 5. Brody H. Colorectal cancer. Nature. 2015;521(7551):S1–S2. [DOI] [PubMed] [Google Scholar]
- 6. Zhou H, Yuan M, Yu Q, Zhou X, Min W, Gao D. Autophagy regulation and its role in gastric cancer and colorectal cancer. Cancer Biomark. 2016;17(1):1–10. [DOI] [PubMed] [Google Scholar]
- 7. Devenport SN, Shah YM. Functions and implications of autophagy in colon cancer. Cells. 2019;8(11):1349. [DOI] [PMC free article] [PubMed] [Google Scholar]
- 8. Chen C, Kuo YH, Lin CC. Decyl caffeic acid inhibits the proliferation of colorectal cancer cells in an autophagy-dependent manner in vitro and in vivo. PLoS One. 2020;15(5):e0232832. [DOI] [PMC free article] [PubMed] [Google Scholar]
- 9. He Y, Zhang L, Tan F. MiR-153-5p promotes sensibility of colorectal cancer cells to oxaliplatin via targeting Bcl-2-mediated autophagy pathway. Biosci Biotechnol Biochem. 2020;84(8):1645–1651. [DOI] [PubMed] [Google Scholar]
- 10. Towers CG, Wodetzki D, Thorburn A. Autophagy and cancer: modulation of cell death pathways and cancer cell adaptations. J Cell Biol. 2020;219(1):e201909033. [DOI] [PMC free article] [PubMed] [Google Scholar]
- 11. Zhang C, Jiang J, Wang L. Identification of autophagy-associated biomarkers and corresponding regulatory factors in the progression of colorectal cancer. Front Genet. 2020;11:245. [DOI] [PMC free article] [PubMed] [Google Scholar]
- 12. Yang Z, Chen Y, Wei X, Wu D, Min Z, Quan Y. Upregulated NTF4 in colorectal cancer promotes tumor development via regulating autophagy. Int J Oncol. 2020;56(6):1442–1454. [DOI] [PMC free article] [PubMed] [Google Scholar]
- 13. Bell ES, Coelho PP. LC3C mediates selective autophagy of the MET RTK, inhibiting cancer cell invasion. Autophagy. 2020;16(5):959–961. [DOI] [PMC free article] [PubMed] [Google Scholar]
- 14. Guerra F, Bucci C. Role of the RAB7 protein in tumor progression and cisplatin chemoresistance. Cancers (Basel). 2019;11(8):1096. [DOI] [PMC free article] [PubMed] [Google Scholar]
- 15. Kuchitsu Y, Fukuda M. Revisiting Rab7 functions in mammalian autophagy: Rab7 knockout studies. Cells. 2018;7(11):215. [DOI] [PMC free article] [PubMed] [Google Scholar]
- 16. Guerra F, Bucci C. Multiple roles of the small GTPase Rab7. Cells. 2016;5(3):34. [DOI] [PMC free article] [PubMed] [Google Scholar]
- 17. González-Gaitán M, Stenmark H. Endocytosis and signaling: a relationship under development. Cell. 2003;115(5):513–521. [DOI] [PubMed] [Google Scholar]
- 18. Snider MD. A role for rab7 GTPase in growth factor-regulated cell nutrition and apoptosis. Mol Cell. 2003;12(4):796–797. [DOI] [PubMed] [Google Scholar]
- 19. Dorayappan KDP, Wanner R, Wallbillich JJ. Hypoxia-induced exosomes contribute to a more aggressive and chemoresistant ovarian cancer phenotype: a novel mechanism linking STAT3/Rab proteins. Oncogene. 2018;37(28):3806–3821. [DOI] [PMC free article] [PubMed] [Google Scholar]
- 20. Tian S, Guo X, Yu C, Sun C, Jiang J. miR-138-5p suppresses autophagy in pancreatic cancer by targeting SIRT1. Oncotarget. 2017;8(7):11071–11082. [DOI] [PMC free article] [PubMed] [Google Scholar]
- 21. Polson HE, de Lartigue J, Rigden DJ. Mammalian Atg18 (WIPI2) localizes to omegasome-anchored phagophores and positively regulates LC3 lipidation. Autophagy. 2010;6(4):506–522. [DOI] [PubMed] [Google Scholar]
- 22. Dooley HC, Razi M, Polson HE, Girardin SE, Wilson MI, Tooze SA. WIPI2 links LC3 conjugation with PI3P, autophagosome formation, and pathogen clearance by recruiting Atg12-5-16L1. Mol Cell. 2014;55(2):238–252. [DOI] [PMC free article] [PubMed] [Google Scholar]
- 23. Bakula D, Takacs Z, Proikas-Cezanne T. WIPI β-propellers in autophagy-related diseases and longevity. Biochem Soc Trans. 2013;41(4):962–967. [DOI] [PubMed] [Google Scholar]
- 24. Grimmel M, Backhaus C, Proikas-Cezanne T. WIPI-Mediated autophagy and longevity. Cells. 2015;4(2):202–217. [DOI] [PMC free article] [PubMed] [Google Scholar]
- 25. Yu J, Ma S, He ZJ. Expression and function of autophagy related WIPI1 gene in colon cancer cells. Modern Oncol Med. 2019;27(12):2055–2060. [Google Scholar]
- 26. Liao CC, Ho MY, Liang SM, Liang CM. Recombinant protein rVP1 upregulates BECN1-independent autophagy, MAPK1/3 phosphorylation and MMP9 activity via WIPI1/WIPI2 to promote macrophage migration. Autophagy. 2013;9(1):5–19. [DOI] [PMC free article] [PubMed] [Google Scholar]
- 27. Proikas-Cezanne T, Waddell S, Gaugel A, Frickey T, Lupas A, Nordheim A. WIPI-1alpha (WIPI49), a member of the novel 7-bladed WIPI protein family, is aberrantly expressed in human cancer and is linked to starvation-induced autophagy. Oncogene. 2004;23(58):9314–9325. [DOI] [PubMed] [Google Scholar]
- 28. Martin RW, Mithat G, Joanne FC, Michael WK, Deborah S. Predicting survival after curative colectomy for cancer: individualizing colon cancer staging. J Clin Oncol. 2011;29(36):4796–4802. [DOI] [PMC free article] [PubMed] [Google Scholar]
- 29. Oliver B, Farshad F. From genotype to functional phenotype: unraveling the metabolomic features of colorectal cancer. Genes (Basel). 2014;5:536–560. [DOI] [PMC free article] [PubMed] [Google Scholar]
- 30. Mo SB, Dai WX, Xiang WQ, et al. Prognostic and predictive value of an autophagy-related signature for early relapse in stages I-III colon cancer. Carcinogenesis. 2019;40(7):861–870. [DOI] [PubMed] [Google Scholar]
- 31. Liu PF, Leung CM, Chang YH, et al. ATG4B promotes colorectal cancer growth independent of autophagic flux. Autophagy. 2014;10(8):1454–1465. [DOI] [PMC free article] [PubMed] [Google Scholar]
- 32. Liang XH, Yu J, Brown K, Levine B. Beclin 1 contains a leucine-rich nuclear export signal that is required for its autophagy and tumor suppressor function. Cancer Res. 2001;61(8):3443–3349. [PubMed] [Google Scholar]


