Abstract
Background
Soft-tissue sarcomas are a group of heterogeneous and rare mesenchymal tumors with aggressive behavior. We aimed to identify the molecular signatures of N6-methyladenosine (m6A) methylation regulators associated with patient prognosis using The Cancer Genome Atlas (TCGA) database.
Material/Methods
To evaluate the role of m6A in soft-tissue sarcomas, genomic and clinical data were downloaded from TCGA. The copy number variations (CNVs) and mutations of m6A regulators were analyzed.
Results
Alterations of m6A regulators were common, and ALKBH5 showed the highest frequency of copy number gain, while ZC3H13 had the highest frequency of loss. CNVs and mutations were closely correlated with histology (P<0.001) and tumor size (P=0.040), and CNVs were correlated with mRNA expression. Furthermore, patients with gains of METTL16, RMB15, RMB15B, YTHDC, and YTHDF3 displayed poorer overall survival (OS), and patients with gains of RBM15 and YTHDC2 and loss of IGF2BP1 had poorer disease-free survival (DFS). Further analysis indicated that CNVs and mutations of KIAA1429, YTHDF3, and IGF2BP1 were independent risk factors predicting OS and DFS. Gain of “writers” with loss of “erasers” led to worse OS than gain of “writers”. Genes involved in JAK2 oncogenic signature were enriched in cases of higher expressions of METTL16, YTHDC2, and YTHDF3. Similarly, the core serum response signature was enriched in patients with higher expressions of IGF2BP1, METTL16, RBM15, and YTHDC2.
Conclusions
Our study provides a useful molecular tool to predict the outcome of soft-tissue sarcomas and deepens our understanding of the molecular mechanisms of the development of the disease.
MeSH Keywords: DNA Copy Number Variations, Methylation, Mutation, Prognosis, Sarcoma
Background
Soft-tissue sarcomas are a group of heterogeneous and rare mesenchymal tumors with aggressive behavior. Tumor resection and radiotherapy are still the main treatments for non-metastatic sarcomas [1]. Although the 5-year overall survival (OS) rate is about 70% in sarcomas [2], poor prognosis is common with local recurrence [3]. Currently, the most useful features to predict prognosis and recurrence are tumor grade, tumor size, histology, margin status, and tumor aggressiveness [4,5]. However, there is much heterogeneity even among localized high-risk tumors. It has been shown that approximately 50% of patients with these tumors achieve long-term remission, while the other 50% develop recurrence within 5 years [6]. Therefore, it is imperative to identify molecular tools to treat sarcomas and predict patient prognosis.
Methylation of N6-adenosine (m6A) is the most common type of RNA modification and is involved in a variety of cancer behaviors [7]. m6A is controlled by various types of regulators, including methyltransferases (“writers”), RNA-binding proteins (“readers”), and demethylases (“erasers”). The m6A mediated by these regulators plays crucial roles in cancer cell malignancy and leads to many disorders [8]. Identification of these different m6A regulators has helped elucidate the effect of RNA methylation on gene regulation [9].
However, there are few studies on m6A in sarcomas. In this study, we evaluated the copy number variations (CNVs) and mutations of these m6A regulators and aimed to provide a useful molecular tool to predict the outcome of sarcomas and deepen our understanding of the molecular mechanisms of the development of sarcomas.
Material and Methods
Ethics statement
Soft-tissue sarcomas (leiomyosarcoma, liposarcoma, pleomorphic sarcoma, myxofibrosarcoma, synovial sarcoma, and malignant peripheral nerve sheath tumor) clinical data and genomic data were downloaded from the adult soft-tissue sarcomas program of The Cancer Genome Atlas (TCGA, Cell 2017) from the cBioportal platform (https://www.cbioportal.org/), which is publicly available. Therefore, all written informed consent was obtained. According to the Cancer Genome Atlas Research Network (https://www.cancer.gov/about-nci/organization/ccg/research/structural-genomics/tcga/history/timeline), participants were recruited into the study in November 2017 and participants’ data and samples were collected. The present study was conducted from July 1 to 22, 2020. Authors had no access to information that could identify individual participants during or after data collection.
Data processing
A total of 18 m6A regulators, which had been identified in previous papers [10,11], were analyzed in this study: writers, METTL3, METTL14, METTL16, WTAP, RBM15, RBM15B, ZC3H13, and KIAA1429; erasers, FTO and ALKBH5; and readers, YTHDC1, YTHDC2, YTHDF1, YTHDF2, YTHDF3, HNRNPC, HNRNPA2B1, and IGF2BP1. We collected and identified 206 soft-tissue sarcoma patient cases with genomic and clinical data from the TCGA project. The GISTIC segmentation algorithm was used to identify the CNV status of the m6A regulators. The 206 patients were divided into 2 groups according to the presence of CNVs and mutations in the m6A regulators. Clinicopathological features were compared between the 2 groups. The relationship between CNVs and mRNA was evaluated after calculating and log scaling of mRNA expression data from the V2 RNA-Seq by expectation-maximization (RSEM).
Gene set enrichment analysis
Gene set enrichment analysis (GSEA) application was available with Java software with MSigDB v6.1 and was downloaded from the Broad Institute website. Subjects were divided into 2 groups based on the median mRNA expression value. Hallmark gene set “c6.all.v7.1.symbols.gmt” was applied in our research. Gene sets with a normalized P value <0.05, and a false discovery rate <0.25 were considered to be significantly enriched.
Statistical analysis
Statistical analysis was performed with R version 4.0.2 or SPSS 20.0 (IBM, Chicago, IL, USA). Figures were produced by R (version 4.0.2) or GraphPad Prism 6.0 (GraphPad Software, La Jolla, CA, USA). The chi-square test and Fisher exact test were used to analyze categorical variables. The log-rank and Kaplan-Meier method were used to analyze survival data. All statistical results with a P value <0.05 were considered to be significant.
Results
CNVs and mutations of m6A regulators in soft-tissue sarcoma
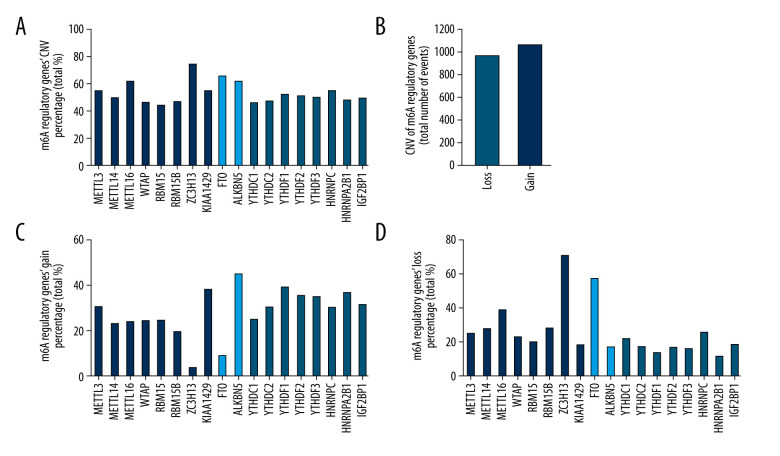
Mutations of m6A regulators were detected in only 11 of the 206 samples of patients with genomic data (Table 1). However, CNVs of the 18 m6A regulators were commonly found in all 206 samples of patients with CNV data (Figure 1A), with the number of events of loss (941/3708) and gain (1023/3708) being similar (Figure 1B) (Table 2). The loss and gain percentages of each m6A regulator were also analyzed (Figure 1C, 1D). Among all regulators, ALKBH5 had the highest frequency of copy number gain (Figure 1C), while ZC3H13 had the highest frequency of copy number loss (Figure 1D).
Table 1.
Mutations of m6A regulatory genes in 206 patients with soft-tissue sarcoma.
| SST sample ID | KIAA1429 | RBM15 | ZC3H13 | YTHDC1 | YTHDC2 | YTHDF3 | IGF2BP1 |
|---|---|---|---|---|---|---|---|
| TCGA-FX-A48G-01 | p.V128E | ||||||
| TCGA-DX-A8BK-01 | p.V28= | ||||||
| TCGA-DX-AB32-01 | p.R1640H | ||||||
| TCGA-FX-A76Y-01 | p.E387D | ||||||
| TCGA-3B-A9HT-01 | p.Q935H | ||||||
| TCGA-DX-A6BA-01 | p.I420T | ||||||
| TCGA-IW-A3M6-01 | p.T249S | ||||||
| TCGA-DX-A8BM-01 | p.R174Q | ||||||
| TCGA-X6-A7W8-01 | p.E240= | ||||||
| TCGA-X6-A8C2-01 | p.S347Y | ||||||
| TCGA-IF-A4AJ-01 | p.E572= |
Figure 1.
Mutations and copy number variations (CNVs) of m6A regulatory genes in patients with soft-tissue sarcoma. (A) CNV percentages of the 18 m6A regulators. (B) Loss and gain events of the 18 m6A regulators. (C, D) Gain and loss percentages of the 18 m6A regulators.
Table 2.
Different copy number variation (CNV) patterns occurring in soft-tissue sarcoma samples (n=206).
| Diploid | Deep deletion | Shallow deletion | Copy number gain | Amplification | CNV* sum | Percentage | ||
|---|---|---|---|---|---|---|---|---|
| Writer | METTL3 | 94 | 0 | 50 | 57 | 5 | 112 | 54.37% |
| METTL14 | 104 | 1 | 55 | 44 | 2 | 102 | 49.51% | |
| METTL16 | 79 | 0 | 79 | 45 | 3 | 127 | 61.65% | |
| WTAP | 111 | 0 | 46 | 45 | 4 | 95 | 46.12% | |
| RBM15 | 116 | 4 | 36 | 50 | 0 | 90 | 43.69% | |
| RBM15B | 110 | 2 | 55 | 39 | 0 | 96 | 46.60% | |
| ZC3H13 | 54 | 2 | 143 | 7 | 0 | 152 | 73.79% | |
| KIAA1429 | 93 | 2 | 34 | 73 | 4 | 113 | 54.85% | |
| Eraser | FTO | 71 | 4 | 113 | 17 | 1 | 135 | 65.53% |
| ALKBH5 | 80 | 0 | 35 | 73 | 18 | 126 | 61.17% | |
| Reader | YTHDC1 | 111 | 0 | 44 | 50 | 1 | 95 | 46.12% |
| YTHDC2 | 110 | 1 | 33 | 57 | 5 | 96 | 46.60% | |
| YTHDF1 | 99 | 0 | 27 | 76 | 4 | 107 | 51.94% | |
| YTHDF2 | 101 | 1 | 32 | 70 | 2 | 105 | 50.97% | |
| YTHDF3 | 104 | 1 | 30 | 66 | 5 | 102 | 49.51% | |
| HNRNPC | 94 | 0 | 51 | 57 | 4 | 112 | 54.37% | |
| HNRNPA2B1 | 108 | 0 | 23 | 68 | 7 | 98 | 47.57% | |
| IGF2BP1 | 105 | 0 | 37 | 61 | 3 | 101 | 49.03% |
CNV – copy number variation.
Relationship between CNVs and mutations of m6A regulators and clinicopathological features
To determine the role of m6A regulators in soft-tissue sarcoma, we analyzed the correlation of CNVs and mutations of m6A regulators with patient clinicopathological characteristics including age, sex, histologic diagnosis, presence of metastasis, tumor size, and FNCLCC grade. The results showed that m6A regulators were closely correlated with histologic diagnosis (P<0.001) and tumor size (P=0.040), but not with age, sex, metastatic status, and FNCLCC grade (Table 3).
Table 3.
Clinical pathological parameters of patients with soft-tissue sarcoma with or without mutations and CNVs of m6A regulatory genes.
| With mutation and/or CNV* | Without mutation and CNV* | P | ||
|---|---|---|---|---|
| Sex | Female | 105 | 7 | 0.313 |
| Male | 84 | 10 | ||
| Age | ≤60 | 93 | 11 | 0.312 |
| >60 | 96 | 6 | ||
| Histologic diagnosis | DDLPS | 40 | 10 | <0.001 |
| UPS | 43 | 1 | ||
| MFS | 17 | 0 | ||
| LMS | 79 | 1 | ||
| MPNST | 4 | 1 | ||
| SS | 6 | 4 | ||
| Metastatic | YES | 45 | 1 | 0.264 |
| NO | 82 | 7 | ||
| N/A** | 62 | 9 | ||
| Tumor size (cm) | ≥12.7*** | 69 | 11 | 0.040 |
| <12.7 | 112 | 6 | ||
| N/A** | 8 | 0 | ||
| FNCLCC grade | 1 | 13 | 1 | 0.322 |
| 2 | 100 | 12 | ||
| 3 | 76 | 4 |
N/A – not applicable.
With mutation and/or copy number variation (CNV): The Cancer Genome Atlas (TCGA) soft tissue sarcoma patients with mutant or CNV or mutant + CNV; Without mutation and CNV: TCGA soft tissue sarcoma patients with neither mutant nor CNV;
ambiguous variables (N/A) were excluded from chi-square test or Fisher exact test;
the average of tumor size is 12.7 cm.
Correlation of CNVs with mRNA expression
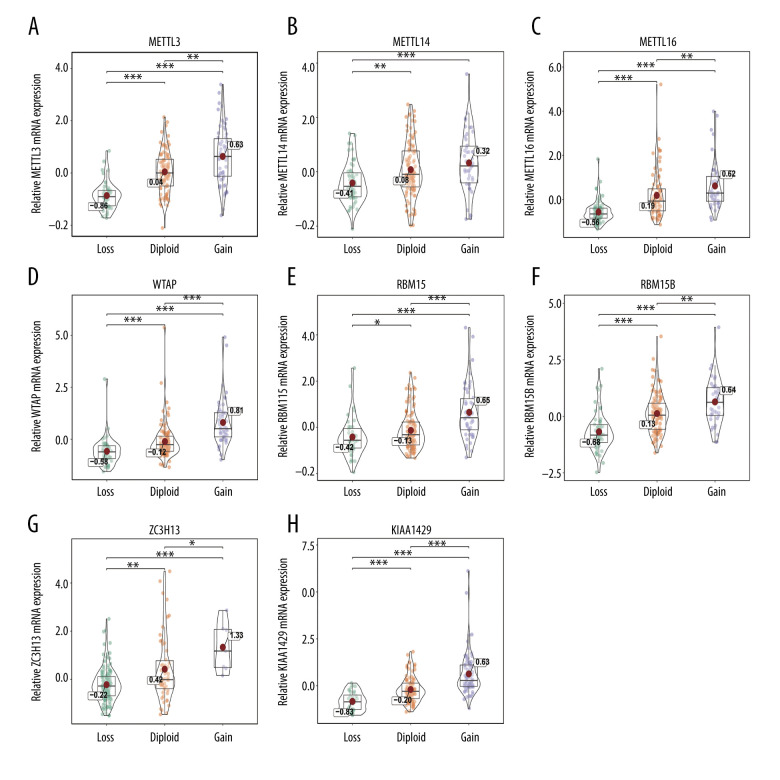
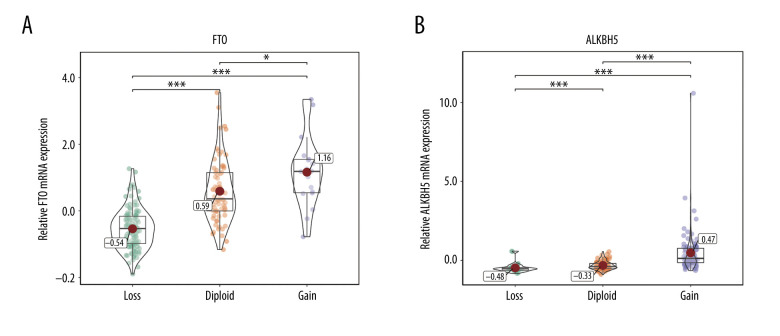
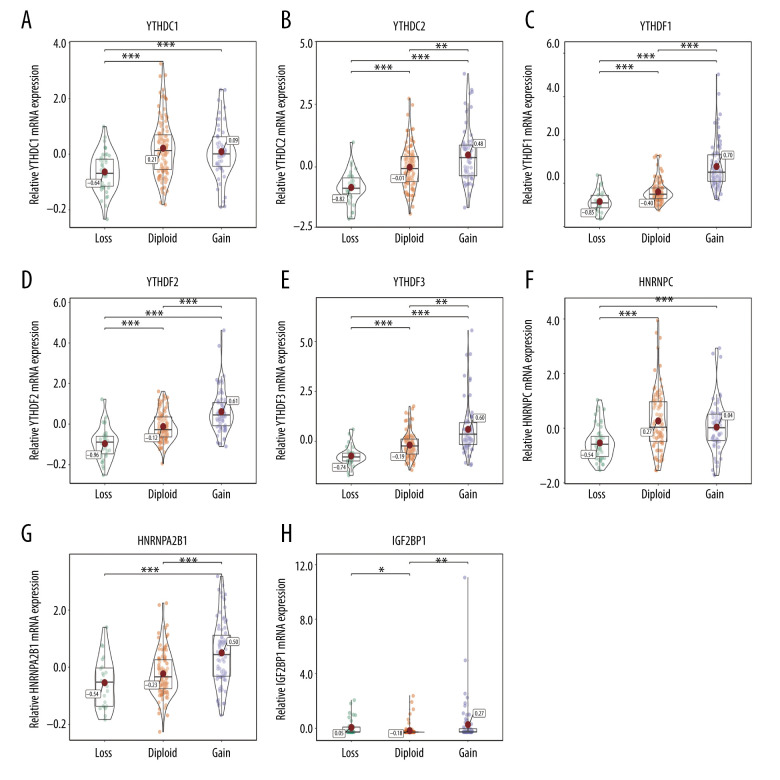
The relationship between alterations in m6A regulators and corresponding mRNA expression levels was then analyzed. The data showed that various CNV levels were correlated with mRNA expression in the 206 patients with soft-tissue sarcoma. Copy number gains were correlated with higher mRNA expression, while copy number status loss was correlated with a decrease in mRNA expression (Figures 2–4). We also validated the findings in bladder cancer and found that copy number gains were correlated with higher mRNA expression in bladder cancer (Supplementary Figure 1).
Figure 2.
(A–H) Correlation of writer copy number variations (CNVs) with mRNA expression. The writer mRNA expression differences among cases with different CNVs. * P<0.05; ** P<0.01; *** P<0.001.
Figure 3.
(A, B) Correlation of eraser copy number variations (CNVs) to mRNA expression. The eraser mRNA expression differences among cases with different CNVs. * P<0.05; ** P<0.01; *** P<0.001.
Figure 4.
(A–H) Correlation of reader copy number variations (CNVs) to mRNA expression. The reader mRNA expression differences among cases with different CNVs. * P<0.05; ** P<0.01; *** P<0.001.
Role of CNVs of m6A regulators in survival of patients with soft-tissue sarcoma
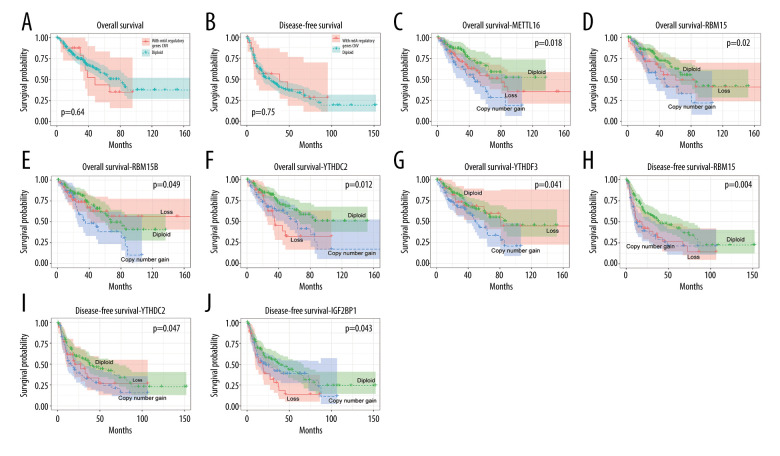
The roles of CNVs in the disease-free survival (DFS) and OS of patients with soft-tissue sarcoma were then explored to analyze the prognostic value of the m6A regulators. The results showed no difference between patients with and without CNVs of m6A regulators in terms of OS (P=0.64) and DFS (P=0.75) (Figure 5A, 5B). Interestingly, patients affected by gains of the m6A writer genes METTL16, RMB15, and RMB15B and reader genes YTHDC and YTHDF3 separately displayed poorer OS (Figure 5C–5G), and patients with gains of writers RBM15 and YTHDC2 and loss of reader IGF2BP1 had poorer DFS (Figure 5H–5J). Multivariate Cox regression analyses indicated that CNVs and mutations of writer KIAA1429 and readers YTHDF3 and IGF2BP1 were independent risk factors predicting OS and DFS (Table 4). To further validate the results in other cancers, a similar analysis was conducted on bladder cancer data, which showed that gains of some of the regulators were also related with poor survival of bladder cancer cases (Supplementary Figure 2).
Figure 5.
Association between copy number variation (CNVs) of m6A regulatory genes and survival of patients with soft-tissue sarcoma. Effects of CNVs (diploid vs. nondiploid) of m6A regulators on (A) overall survival (OS) and (B) disease-free survival (DFS). Effect of CNVs of (C) METTL16, (D) RBM15, (E) RBM15B, (F) YTHDC2, and (G) YTHDF3 on OS. Effect of CNVs of (H) RBM15, (I) YTHDC2, and (J) IGF2BP1 on DFS.
Table 4.
Univariate and multivariate Cox regression analysis of m6A regulatory genes for the overall survival (OS) and disease-free survival (DFS) of patients with soft-tissue sarcoma.
| Variable | OS | |||
|---|---|---|---|---|
| Univariate | Multivariate | |||
| HR (95% CI) | P | HR (95% CI) | P | |
| Age (continuous) | 1.02 (1.00–1.03) | 0.049 | 1.05 (1.02–1.08) | 0.002 |
| Sex (Male vs. Female) | 0.95 (0.60–1.49) | 0.817 | ||
| Pathological tumour size (mm) (continuous) | 1.04 (1.02–1.07) | 0.001 | ||
| Residual tumour (R1/R2/RX vs. R0) | 2.72 (1.73–4.26) | <0.001 | 2.76 (1.17–6.51) | 0.018 |
| Pharmaceutical drug adjuvant (no vs. yes) | 0.85 (0.51–1.40) | 0.521 | ||
| Radiation treatment adjuvant (no vs. yes) | 1.31 (0.79–2.18) | 0.300 | ||
| FNCLCC grade (3 vs. 1/2) | 1.64 (1.05–2.57) | 0.029 | 2.42 (1.03–5.71) | 0.040 |
| Metastatic disease (no vs. yes) | 3.02 (1.68–5.43) | <0.001 | 4.63 (1.95–10.99) | 0.001 |
| m6A regulator alteration (writer loss+eraser deletion vs. others) | 1.62 (1.03–2.54) | 0.036 | 0.79 (0.31–2.05) | 0.631 |
| METTL16 (vs. diploid) | ||||
| Gain | 2.27 (1.27–4.06) | 0.006 | ||
| Loss | 1.52 (0.88–2.61) | 0.133 | ||
| RBM15 (vs. diploid) | ||||
| Gain | 2.07 (1.23–3.47) | 0.006 | ||
| Loss | 1.39 (0.78–2.48) | 0.259 | ||
| RBM15B (vs. diploid) | ||||
| Gain | 1.86 (1.10–3.15) | 0.021 | ||
| Loss | 1.04 (0.59–1.82) | 0.890 | ||
| KIAA1429 (vs. diploid) | ||||
| Gain | 1.59 (0.97–2.61) | 0.066 | 0.17 (0.04–0.62) | 0.007 |
| Loss | 1.48 (0.78–2.79) | 0.227 | 0.85 (0.16–4.35) | 0.842 |
| YTHDC2 (vs. diploid) | ||||
| Gain | 1.82 (1.11–2.99) | 0.018 | ||
| Loss | 2.19 (1.18–4.07) | 0.013 | ||
| YTHDF1 (vs. diploid) | ||||
| Gain | 1.42 (0.87–2.31) | 0.160 | 1.10 (0.37–3.23) | 0.869 |
| Loss | 2.06 (1.08–3.93) | 0.029 | 3.12 (0.85–11.45) | 0.086 |
| YTHDF3 (vs. diploid) | ||||
| Gain | 1.79 (1.11–2.89) | 0.016 | 4.15 (1.06–16.27) | 0.041 |
| Loss | 1.06 (0.52–2.15) | 0.866 | 0.60 (0.10–3.58) | 0.577 |
| IGF2BP1 (vs. diploid) | ||||
| Gain | 1.20 (0.72–2.02) | 0.484 | 1.00 (0.38–2.59) | 0.996 |
| Loss | 1.76 (1.00–3.11) | 0.051 | 3.02 (0.93–9.80) | 0.066 |
| Variable | DFS | |||
|---|---|---|---|---|
| Univariate | Multivariate | |||
| HR (95% CI) | P | HR (95% CI) | P | |
| Age (continuous) | 1.00 (0.99–1.01) | 0.795 | ||
| Sex (Male vs. Female) | 1.10 (0.77–1.57) | 0.592 | ||
| Pathological tumour size (mm) (continuous) | 1.03 (1.01–1.05) | 0.002 | 1.07 (1.03–1.11) | <0.001 |
| Residual tumour (R1/R2/RX vs. R0) | 2.24 (1.57–3.21) | <0.001 | 3.00 (1.21–7.44) | 0.010 |
| Pharmaceutical drug adjuvant (no vs. yes) | 0.59 (0.40–0.88) | 0.009 | ||
| Radiation treatment adjuvant (no vs. yes) | 0.94 (0.63–1.39) | 0.753 | ||
| FNCLCC grade (3 vs. 1/2) | 1.53 (1.07–2.19) | 0.020 | 2.76 (1.41–5.38) | 0.002 |
| Metastatic disease (no vs. yes) | 5.05 (3.17–8.05) | <0.001 | 5.59 (2.81–11.13) | <0.001 |
| m6A regulator alteration (writer loss+eraser deletion vs. others) | 1.39 (0.97–1.99) | 0.070 | ||
| METTL16 (vs. diploid) | ||||
| Gain | 1.53 (0.95–2.44) | 0.077 | ||
| Loss | 1.33 (0.88–2.00) | 0.174 | ||
| RBM15 (vs. diploid) | ||||
| Gain | 1.88 (1.23–2.88) | 0.003 | ||
| Loss | 1.72 (1.10–2.68) | 0.017 | ||
| RBM15B (vs. diploid) | ||||
| Gain | 1.24 (0.79–1.96) | 0.348 | ||
| Loss | 0.96 (0.62–1.47) | 0.840 | ||
| KIAA1429 (vs. diploid) | ||||
| Gain | 1.42 (0.96–2.10) | 0.076 | 0.11 (0.04–0.33) | <0.001 |
| Loss | 1.27 (0.76–2.11) | 0.365 | 0.51 (0.16–1.60) | 0.292 |
| YTHDC2 (vs. diploid) | ||||
| Gain | 1.62 (1.10–2.40) | 0.016 | ||
| Loss | 1.37 (0.83–2.29) | 0.221 | ||
| YTHDF1 (vs. diploid) | ||||
| Gain | 1.14 (0.78–1.68) | 0.502 | ||
| Loss | 1.40 (0.82–2.38) | 0.216 | ||
| YTHDF3 (vs. diploid) | ||||
| Gain | 1.43 (0.97–2.09) | 0.068 | 7.33 (2.48–21.69) | <0.001 |
| Loss | 0.95 (0.55–1.66) | 0.863 | 1.15 (0.32–4.11) | 0.832 |
| IGF2BP1 (vs. diploid) | ||||
| Gain | 1.26 (0.84–1.90) | 0.264 | 1.72 (0.83–3.53) | 0.142 |
| Loss | 1.79 (1.13–2.84) | 0.013 | 3.14 (1.27–7.81) | 0.014 |
Ambiguous variables (N/A, discrepancy) were excluded.
OS – overall survival; DFS – disease free survival.
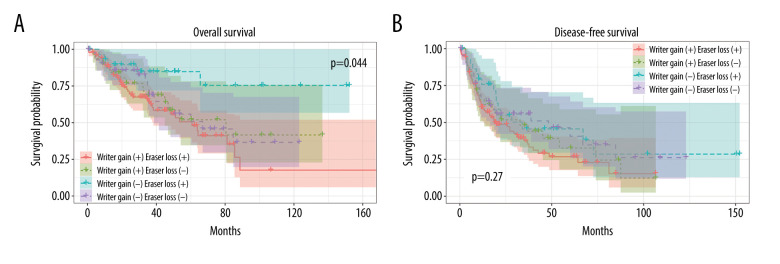
Writers are a cluster of methyltransferases that play crucial roles in the m6A modification process. The above findings suggest that a higher expression of writers could result in poor prognosis. To validate the above conclusion, we then tested it in patients who were affected by 2 types of CNVs, copy number gain of writers and copy number loss of erasers.
Patients were further divided into 4 groups based on writer gain status and eraser loss status. As shown in Figure 6A, patients with a copy number gain of writers in combination with a loss of erasers had worse OS than those with only a copy number gain of writers (Figure 6A, 6B, Table 4). This provided more evidence for the link between an upregulated m6A level of writer genes and poor survival.
Figure 6.
Association between copy number variations (CNVs) of m6A regulatory genes and survival of patients with soft-tissue sarcoma. Effects of writer gain status and eraser loss status on (A) overall survival (OS) and (B) disease-free survival (DFS).
Pathways enriched in m6A regulation
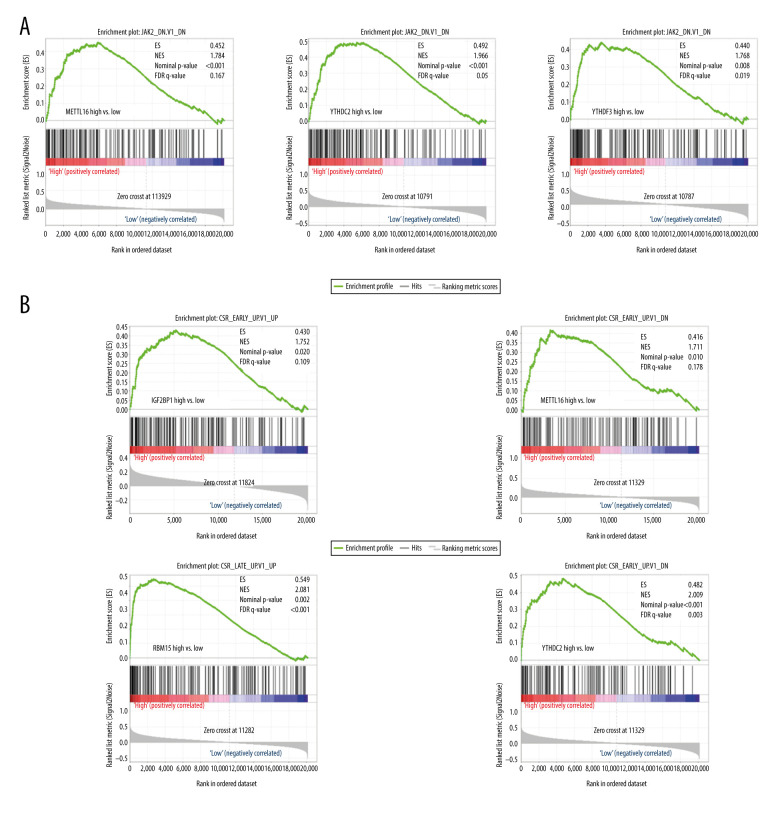
To further understand the role of m6A regulators in the regulation of oncogenic pathways, we performed GSEA analysis. Patients were divided into 2 groups based on the median expression of mRNA. As shown in Figure 7A, the genes involved in the JAK2 oncogenic signature were enriched in patients with higher expressions of METTL16, YTHDC2, and YTHDF3 and were not enriched in patients with lower expressions. Similarly, the core serum response (CSR) signature was also enriched only in patients with higher expressions of IGF2BP1, METTL16, RBM15, and YTHDC2 (Figure 7B).
Figure 7.
Pathways enriched in m6A regulation. (A) Gene set enrichment analysis (GSEA) results of group with higher expression vs. group with lower expression of METTL16, YTHDC2, or YTHDF3. (B) GSEA results of group with higher expression vs. group with lower expression of IGF2BP1, METTL16, RBM15, or YTHDC2.
Discussion
Previous studies have described the role of m6A regulators in sarcoma. For example, METTL3 can promote osteosarcoma progression by regulating the m6A level of LEF1 [12]. Despite these data, there is still a lack of studies on m6A regulators in sarcoma. In the present study, we systematically evaluated the roles of the CNVs of m6A regulators in sarcoma, especially in the prognosis of sarcoma. To the best of our knowledge, this is the first study to analyze the effects of CNVs of m6A regulators in sarcoma, and we hope to provide useful information to future researchers.
As indicated by our analysis, all genes of the m6A regulators developed CNVs in sarcoma; in particular, more than 60% of patients acquired METTL16, ZC3H13, FTO, and ALKBH5 CNVs, showing that CNVs of m6A regulators are common in sarcoma. In fact, genetic alteration is considered one of many features of sarcomas, and it has been demonstrated that CNVs and other alterations could result in dysregulated gene expression, subsequently leading to the development of sarcoma [13]. Our results consistently showed that CNVs closely correlate with mRNA expression and an outcome of sarcoma.
When we focus on high-risk soft-tissue sarcoma (high-grade, deep, large tumors), the mortality rate exceeds 50% [14]. Local recurrences of soft-tissue sarcoma of the trunk and extremities ranges from 7% to 15% and are associated with a poor prognosis, with a 2-year survival rate ranging from 50% to 70% [15]. In the soft-tissue sarcoma cohort of the present study, we found the m6A regulator genes correlated with tumor size and histology. According to previous studies, the most important clinical risk factors for recurrence are high-grade, larger tumor size, and aggressive histology, as found in undifferentiated pleomorphic sarcoma, leiomyosarcoma, and dedifferentiated liposarcoma [16]. Further, the present analysis revealed the alterations of RBM15 (writer), YTHDC2 (reader), and IGF2BP1 (reader) were associated with an adverse prognosis.
These data can potentially help stratify patients at the highest risk of relapse and patients who would benefit from adjuvant chemotherapy. Especially in soft-tissue sarcoma, a high degree of heterogeneity contributes to considerable uncertainty about the clinical value of adjuvant chemotherapy on unselected patients.
Previous researchers have identified many other potentially prognostic molecules in sarcoma. The prognosis of patients with dedifferentiated liposarcoma and soft-tissue leiomyosarcoma from TCGA was evaluated and prognostic markers were identified, showing that hypermethylation and certain chromosomal amplifications were associated with poor outcomes of dedifferentiated liposarcoma, while miRNA-181b was related to the shorter survival time of soft-tissue leiomyosarcoma [17]. Also, researchers developed a set of gene-expression signatures using the high-throughput method, which can identify patients at high-risk [18,19]. In the present study, we found that the CNV level of several m6A regulators, namely METTL16, RBM15, RBM15B, YTHDC2, YTHDF3, and IGF2BP1, are significantly associated with DFS and OS. The CNVs of YTHDC2 and RBM15, in particular, are correlated with both DFS and OS. As these molecules are mainly writers and erasers, we further stratified patients according to the CNVs of the writers and erasers. Interestingly, patients with writer gain and eraser deletion had worse OS than the other groups. Because an eraser functions as an adverse regulator of a writer, the above result makes sense and indicates that writer gain is a powerful indicator of poor prognosis. As shown in Figure 2, copy number gain was significantly correlated with mRNA expression. Higher writer mRNA is expected to predict the poor outcome of sarcoma patients. Consistently, the expression levels of mRNA writers, in contrast to those of readers and erasers, were indicated as risk factors of patients’ survival [10].
Based on the influence of the CNVs of these m6A regulators on prognosis, we further evaluated their underling mechanisms. Patients were divided into 2 groups according to the median value of the m6A regulators following GSEA analysis of the 2 groups. We mainly focused on the GSEA results of IGF2BP1, METTL16, RBM15, RBM15B, YTHDC2, and YTHDF3 owing to their performance in predicting survival. Among the dysregulated pathways and hallmarks, JAK2 (genes downregulated in HEL cells [erythroleukemia] after the knockdown of JAK2) and CSR were the most commonly upregulated oncogenic signatures. JAK2 is a key component of the JAK family of protein tyrosine kinases and is an important intracellular mediator of cytokine and hormone signaling. Also, JAK2 is ubiquitously expressed in almost every cancer cell type [20]. JAK2 signaling plays crucial roles in both pathology and physiology processes and is involved in inflammation and hemopoiesis, especially in cancer [21,22]. The CSR signature includes genes that are induced in the fibroblast serum-response program, and these genes are expressed in tumor cells and tumor-associated fibroblasts [23]. The genes from the CSR signature are related to metastasis and death in various types of cancer [24]; thus, the CSR signature is considered to be a useful predictor of the clinical course in several cancers. Therefore, more detailed studies about the mechanisms of CNVs of m6A regulators in sarcoma are warranted, and the CNVs of these m6A regulators might be used as targets to develop drugs to treat cancers.
Our study has some limitations. First, we studied the role of m6A regulators in the whole of soft-tissue sarcomas, and there are many types of sarcomas with varied clinical behaviors. Therefore, future studies should evaluate m6A methylation regulators in different types of sarcomas, such as angiosarcoma and liposarcoma. Second, the results from our study are based on data analysis and not experimental findings. In future studies, genomic methods could be used to specifically modify the m6A regulators and determine the effect of m6A regulator alterations on cancer cells in vitro. Third, to validate the definite target mRNAs of the m6A modification during the initiation and progression of soft-tissue sarcoma, future studies should include a different study cohort with m6A-Seq and m6A MeRIP. Lastly, we used TCGA retrospective data and should validate our findings using prospective studies in the future.
Conclusions
In conclusion, we analyzed the mutation and CNV status of m6A regulators in sarcoma and found that CNVs were closely correlated with mRNA expression. These m6A regulators could also predict survival of patients with sarcoma and are involved in various oncogenic signatures. Our study provides a useful survival prediction model and contributes to the area of cancer drug development.
Supplementary Data
(A–F) Correlation of copy number variations (CNVs) with mRNA expression in bladder cancer. The relative mRNA expression differences among bladder cancer cases with different CNVs. * P<0.05; ** P<0.01; *** P<0.001.
Association between copy number variations (CNVs) of m6A regulatory genes and survival of patients with bladder cancer. Effect of CNVs of (A) HNRNPC and (B) METTL3 on overall survival (OS). Effects of CNVs of (C) HNRNPC, (D) METTL3, (E) METTL14, and (F) YTHDF2 on disease-free survival (DFS).
Footnotes
Source of support: Departmental sources
References
- 1.Hu Q, Zhou S, Hu X, et al. Systematic screening identifies a 2-gene signature as a high-potential prognostic marker of undifferentiated pleomorphic sarcoma/myxofibrosarcoma. J Cell Mol Med. 2020;24(1):1010–21. doi: 10.1111/jcmm.14814. [DOI] [PMC free article] [PubMed] [Google Scholar]
- 2.Schaefer IM, Hornick JL, Barysauskas CM, et al. Histologic appearance after preoperative radiation therapy for soft tissue sarcoma: Assessment of the European Organization for Research and Treatment of Cancer-Soft Tissue and Bone Sarcoma Group Response Score. Int J Radiat Oncol Biol Phys. 2017;98(2):375–83. doi: 10.1016/j.ijrobp.2017.02.087. [DOI] [PubMed] [Google Scholar]
- 3.Henderson MT, Hollmig ST. Malignant fibrous histiocytoma: Changing perceptions and management challenges. J Am Acad Dermatol. 2012;67(6):1335–41. doi: 10.1016/j.jaad.2012.04.013. [DOI] [PubMed] [Google Scholar]
- 4.Look Hong NJ, Hornicek FJ, Raskin KA, et al. Prognostic factors and outcomes of patients with myxofibrosarcoma. Ann Surg Oncol. 2013;20(1):80–86. doi: 10.1245/s10434-012-2572-3. [DOI] [PMC free article] [PubMed] [Google Scholar]
- 5.Kasper B, Ouali M, van Glabbeke M, et al. Prognostic factors in adolescents and young adults (AYA) with high risk soft tissue sarcoma (STS) treated by adjuvant chemotherapy: A study based on pooled European Organisation for Research and Treatment of Cancer (EORTC) clinical trials 62771 and 62931. Eur J Cancer. 2013;49(2):449–56. doi: 10.1016/j.ejca.2012.08.007. [DOI] [PubMed] [Google Scholar]
- 6.Bui NQ, Przybyl J, Trabucco SE, et al. A clinico-genomic analysis of soft tissue sarcoma patients reveals CDKN2A deletion as a biomarker for poor prognosis. Clin Sarcoma Res. 2019;9:12. doi: 10.1186/s13569-019-0122-5. [DOI] [PMC free article] [PubMed] [Google Scholar]
- 7.Yang Y, Hsu PJ, Chen YS, Yang YG. Dynamic transcriptomic m(6)A decoration: writers, erasers, readers and functions in RNA metabolism. Cell Res. 2018;28(6):616–24. doi: 10.1038/s41422-018-0040-8. [DOI] [PMC free article] [PubMed] [Google Scholar]
- 8.Fu Y, Dominissini D, Rechavi G, He C. Gene expression regulation mediated through reversible m(6)A RNA methylation. Nat Rev Genet. 2014;15(5):293–306. doi: 10.1038/nrg3724. [DOI] [PubMed] [Google Scholar]
- 9.Roundtree IA, Evans ME, Pan T, He C. Dynamic RNA modifications in gene expression regulation. Cell. 2017;169(7):1187–200. doi: 10.1016/j.cell.2017.05.045. [DOI] [PMC free article] [PubMed] [Google Scholar]
- 10.Li Y, Xiao J, Bai J, et al. Molecular characterization and clinical relevance of m(6)A regulators across 33 cancer types. Mol Cancer. 2019;18(1):137. doi: 10.1186/s12943-019-1066-3. [DOI] [PMC free article] [PubMed] [Google Scholar]
- 11.Lan Q, Liu PY, Haase J, et al. The critical role of RNA m(6)A methylation in cancer. Cancer Res. 2019;79(7):1285–92. doi: 10.1158/0008-5472.CAN-18-2965. [DOI] [PubMed] [Google Scholar]
- 12.Miao W, Chen J, Jia L, et al. The m6A methyltransferase METTL3 promotes osteosarcoma progression by regulating the m6A level of LEF1. Biochem Biophys Res Commun. 2019;516(3):719–25. doi: 10.1016/j.bbrc.2019.06.128. [DOI] [PubMed] [Google Scholar]
- 13.Smida J, Xu H, Zhang Y, et al. Genome-wide analysis of somatic copy number alterations and chromosomal breakages in osteosarcoma. Int J Cancer. 2017;141(4):816–28. doi: 10.1002/ijc.30778. [DOI] [PubMed] [Google Scholar]
- 14.Pervaiz N, Colterjohn N, Farrokhyar F, et al. A systematic meta-analysis of randomized controlled trials of adjuvant chemotherapy for localized resectable soft-tissue sarcoma. Cancer. 2008;113(3):573–81. doi: 10.1002/cncr.23592. [DOI] [PubMed] [Google Scholar]
- 15.Abatzoglou S, Turcotte RE, Adoubali A, et al. Local recurrence after initial multidisciplinary management of soft tissue sarcoma: Is there a way out? Clin Orthop Relat Res. 2010;468(11):3012–18. doi: 10.1007/s11999-010-1481-7. [DOI] [PMC free article] [PubMed] [Google Scholar]
- 16.Callegaro D, Miceli R, Bonvalot S, et al. Development and external validation of two nomograms to predict overall survival and occurrence of distant metastases in adults after surgical resection of localised soft-tissue sarcomas of the extremities: A retrospective analysis. Lancet Oncol. 2016;17(5):671–80. doi: 10.1016/S1470-2045(16)00010-3. [DOI] [PubMed] [Google Scholar]
- 17.Cancer Genome Atlas Research Network, Cancer Genome Atlas Research Network. Comprehensive and integrated genomic characterization of adult soft tissue sarcomas. Cell. 2017;171(4):950–65.e28. doi: 10.1016/j.cell.2017.10.014. [DOI] [PMC free article] [PubMed] [Google Scholar]
- 18.Lagarde P, Perot G, Kauffmann A, et al. Mitotic checkpoints and chromosome instability are strong predictors of clinical outcome in gastrointestinal stromal tumors. Clin Cancer Res. 2012;18(3):826–38. doi: 10.1158/1078-0432.CCR-11-1610. [DOI] [PubMed] [Google Scholar]
- 19.Lagarde P, Przybyl J, Brulard C, et al. Chromosome instability accounts for reverse metastatic outcomes of pediatric and adult synovial sarcomas. J Clin Oncol. 2013;31(5):608–15. doi: 10.1200/JCO.2012.46.0147. [DOI] [PubMed] [Google Scholar]
- 20.Lai SY, Johnson FM. Defining the role of the JAK-STAT pathway in head and neck and thoracic malignancies: implications for future therapeutic approaches. Drug Resist Updat. 2010;13(3):67–78. doi: 10.1016/j.drup.2010.04.001. [DOI] [PubMed] [Google Scholar]
- 21.Qian CJ, Yao J, Si JM. Nuclear JAK2: Form and function in cancer. Anat Rec (Hoboken) 2011;294(9):1446–59. doi: 10.1002/ar.21443. [DOI] [PubMed] [Google Scholar]
- 22.Britschgi A, Radimerski T, Bentires-Alj M. Targeting PI3K, HER2 and the IL-8/JAK2 axis in metastatic breast cancer: Which combination makes the whole greater than the sum of its parts? Drug Resist Updat. 2013;16(3–5):68–72. doi: 10.1016/j.drup.2013.10.001. [DOI] [PubMed] [Google Scholar]
- 23.Chang HY, Sneddon JB, Alizadeh AA, et al. Gene expression signature of fibroblast serum response predicts human cancer progression: Similarities between tumors and wounds. PLoS Biol. 2004;2(2):E7. doi: 10.1371/journal.pbio.0020007. [DOI] [PMC free article] [PubMed] [Google Scholar]
- 24.Sorlie T, Perou CM, Tibshirani R, et al. Gene expression patterns of breast carcinomas distinguish tumor subclasses with clinical implications. Proc Natl Acad Sci USA. 2001;98(19):10869–74. doi: 10.1073/pnas.191367098. [DOI] [PMC free article] [PubMed] [Google Scholar]
Associated Data
This section collects any data citations, data availability statements, or supplementary materials included in this article.
Supplementary Materials
(A–F) Correlation of copy number variations (CNVs) with mRNA expression in bladder cancer. The relative mRNA expression differences among bladder cancer cases with different CNVs. * P<0.05; ** P<0.01; *** P<0.001.
Association between copy number variations (CNVs) of m6A regulatory genes and survival of patients with bladder cancer. Effect of CNVs of (A) HNRNPC and (B) METTL3 on overall survival (OS). Effects of CNVs of (C) HNRNPC, (D) METTL3, (E) METTL14, and (F) YTHDF2 on disease-free survival (DFS).


