

Abstract
Background and objective:
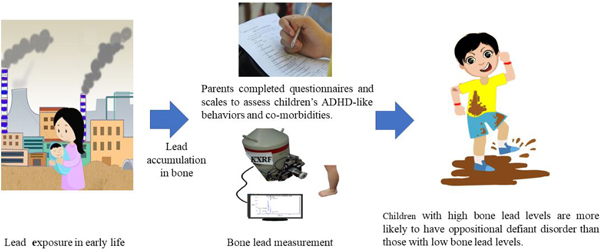
Mounting evidence showed that lead exposure increased the risk of child attention-deficit-hyperactivity disorder (ADHD). Epidemiologic studies have typically used the blood-lead as a biomarker of lead exposure; blood-lead levels mostly reflect recent lead exposure. However, few studies have examined the relationship between bone-lead, a biomarker of cumulative exposure, and ADHD. Therefore, we aimed to compare the associations of bone-lead vs blood-lead levels with child ADHD symptoms and comorbidities.
Methods:
A total of 164 children aged 3–15 years were enrolled during 2014–2015. The Vanderbilt-ADHD-Diagnostic-Parent-Rating Scale (VADPRS) was used to evaluate the children’s ADHD symptoms and comorbidities. Children’s blood and bone lead concentrations were assessed, the latter using a non-invasive K-X-ray-fluorescence technique. According to blood-lead levels, children were classified into high (blood-lead ≥ 10.0 μg/dL) and low (blood-lead < 10.0 μg/dL) blood-lead groups. According to bone-lead levels, children were classified into high (bone-lead ≥ 2.66 μg/g) and low (bone-lead < 2.66 μg/g) bone-lead groups. We associated blood/bone lead with VADPRS data using multi-variable binary logistic regression models.
Results:
Children in the high blood-lead group had higher hyperactivity/impulsivity (P = 0.02) scores than the corresponding low blood-lead group. Children in the high bone-lead group had higher hyperactivity/impulsivity (P = 0.02) and oppositional-defiant-disorder (ODD) (P = 0.03) scores than the corresponding low bone-lead group. After adjusting for relevant confounders, children in the high bone-lead group were more likely to have ODD-behavior than the low group (OR = 6.7, 95%CI: 1.2–36.5). However, no adjusted association was observed between blood-lead and any ADHD-domain score.
Conclusion:
High levels of cumulative lead exposure in children may be an independent risk factor of ODD-behavior.
Keywords: Lead, Bone, Blood, ADHD, ODD
Graphical Abstract
1. Introduction
Although overall blood lead levels in children have been declining throughout the past several decades (Yan et al., 2013), many school-aged children and adolescents continue to experience lead exposure (Naicker et al., 2010; Taylor et al., 2015). Previous study showed that, after the phasing out of leaded gasoline, atmospheric lead particulates in Shanghai were mainly from coal combustors (Liang et al., 2010; Tan et al., 2006). Recent studies demonstrated that industrial pollution, Chinese traditional popcorn or fried food, folk medicines, parental smoking, and caregivers’ low education were factors associated with children’s high exposure to lead (Cao et al., 2014; Ying et al., 2018). In addition, many children with low lead exposure in the present may have had high lead exposure in their past, as a result, may have relatively high cumulative lead exposure (Ahlgren et al., 1980; Ji et al., 2014).
The blood lead level is considered as a biomarker of recent lead exposure due to its relatively short half-life in blood (approximate 30 days) (Hu et al., 2007). Under normal circumstances, lead is mainly stored in calcified tissues in the body, and 90% or more of the lead body burden is stored in bone in adults (for children about 70% or more) with an average half-life of years to decades (Specht et al., 2018). The rate of lead turnover between blood and bone is usually low except that bone metabolisms undergo significant changes (Theppeang et al., 2008). Therefore, through multiple stages of life, environmental lead exposure brings about an increased lead concentration in the bone. The bone-lead concentration thus becomes a useful surrogate indicator of the level of cumulative exposure to lead.
Attention deficit/hyperactivity disorder (ADHD) is one of the most common neurodevelopmental disorders among children with worldwide prevalence of 5%–10% (Polanczyk et al., 2007). According to the Diagnostic and Statistical Manual of Mental Disorders-V (DSM-V) criteria, ADHD is characterized by inattention, hyperactivity/impulsivity often accompanied by the comorbidities including oppositional defiant disorder (ODD), conduct disorder (CD) and anxiety/depression (APA, 2000; Larson et al., 2011). Among the comorbidities, ODD and CD are most prevalent (Cuffe et al., 2015). The DSM-V is the current gold standard for the diagnosis of childhood ADHD, but complex to use for both parents and clinicians. The Vanderbilt ADHD Diagnostic Parent Rating Scale (VADPRS) is therefore developed based on the DSM-V ADHD diagnostic criteria to help pediatricians identify which children are at-risk or not at-risk for the diagnoses of the ADHD symptoms and co-morbidities (Wolraich et al., 2011), and is widely used in school or pre-school aged children (Garg and Arun, 2013; Garg et al., 2015).
The association of blood lead with child ADHD has been extensively investigated (Braun et al., 2006; Brondum, 2009; Liu et al., 2014; Wang et al., 2008). Recent studies showed that increased blood lead levels were especially associated with child hyperactivity/impulsivity symptoms (Hong et al., 2015; Huang et al., 2016), while others found that increased blood lead levels were linked with child inattention symptom (Chiodo et al., 2007; Joo et al., 2017). Because blood lead measurement was easier to perform and therefore more prevalent than bone lead measurement, previous studies typically assessed the relationship between blood lead levels and child ADHD behavior, and few studies have analyzed the relationship between bone lead levels and child ADHD behavior. Only two studies 14 years ago focused on the association of bone lead levels with child ADHD-like behavior (Needleman et al., 2002; Needleman et al., 1996), however, the limitation of the technology brought relatively low accuracy, sensitivity and precision of bone lead measures in previous studies (usually performed using a non-invasive K-shell X-ray fluorescence instrument). Fortunately, the bone lead measurement technology has advanced considerably in recent years, thereby providing an improved ability to examine the relationship between bone lead and child ADHD-like behavior. In addition, in previous studies, bone lead measurement on the subjects was after the ADHD assessment or development of children’s behavioral problems (Needleman et al., 2002; Needleman et al., 1996). Therefore, to better characterize the associations of recent and cumulative lead exposures with child ADHD-like behavior and the comorbidities, we conducted this study to compare the associations of bone lead vs blood lead with child ADHD-like behavior and the comorbidities in Shanghai, China.
2. Methods
2.1. Study design and subjects
A total of 164 children aged 3–15 years who visited a lead specialty clinic of Xinhua Hospital from August 2014 to August 2015 were enrolled in this study. A face-to-face interview using structured questionnaires was conducted with parents of these children to collect information on children’s social and demographic characteristics, diseases, environmental exposure histories, and living habits. Blood lead and bone lead levels were evaluated for each enrolled child. We were unable to collect the blood sample in 10 children and failed to measure the bone lead levels in 4 children. Then the VADPRS was administered to parents to evaluate the children’s ADHD symptoms and the comorbidities (Fig. 1). We obtained written informed consent from parents of all the children, and if children were 7 years or older, also from children themselves. The study protocol was approved by the Medical Ethics Committee of Xinhua Hospital affiliated with the Shanghai Jiao Tong University School of Medicine (China), Purdue University (United States) and University of Toronto (Canada).
Fig. 1.
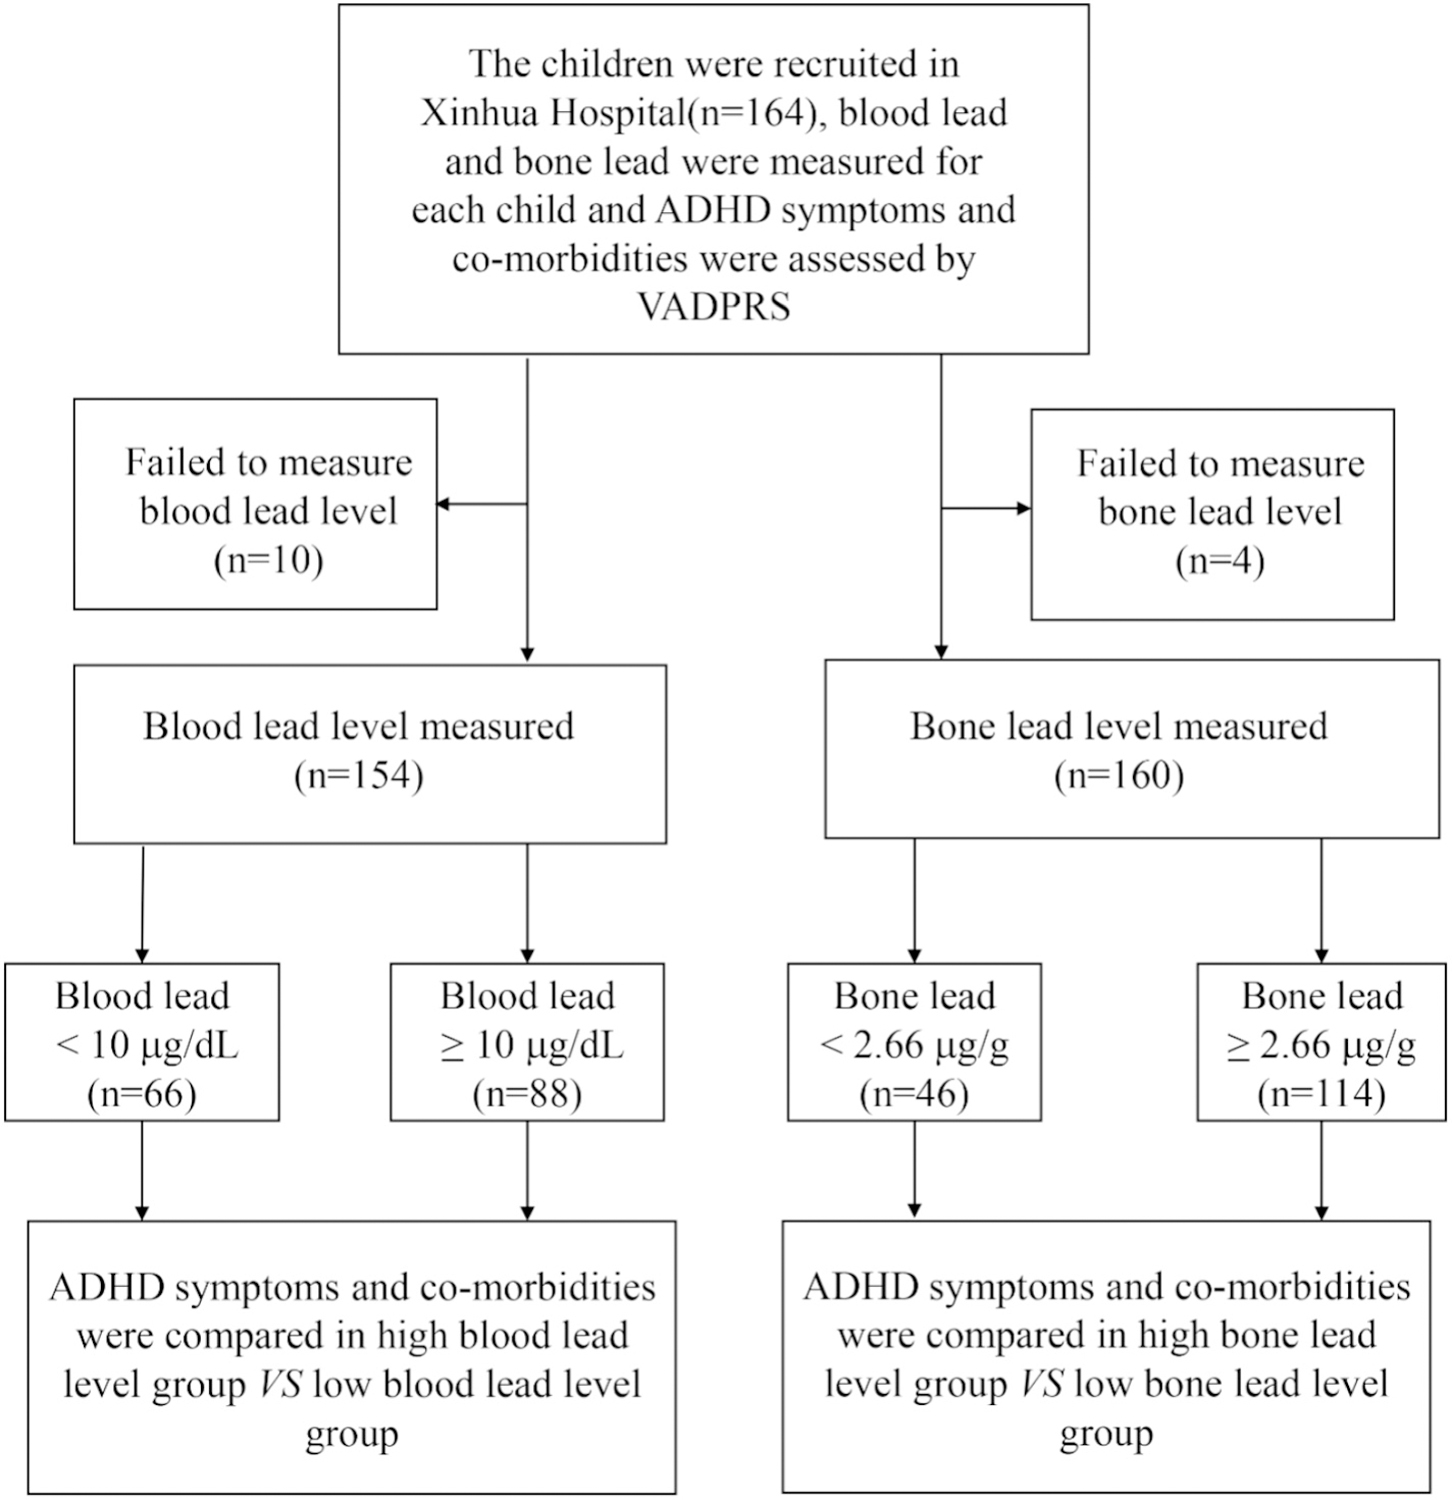
Study flow chart. Abbreviation: VADPRS: Vanderbilt ADHD (Attention Deficit Hyperactivity Disorder Diagnostic Parent Rating Scale).
2.2. The assessment of children’s ADHD symptoms and the co-morbidities
The VADPRS assessed symptoms including inattentive (items 1–9), hyperactivity/impulsivity (items 10–18) symptoms and 3 comorbidities (ODD, items 19–26; CD, items 27–40; and ANX/DEP, items 41–47). The internal consistency and factor structure of the VADPRS are acceptable and consistent with the DSM (Wolraich et al., 2003). All symptoms were rated on a 4-point scale that indicated how frequently each symptom occurred. Parents were asked to report on their children’s behavior during the past 6 months. The Vanderbilt Assessment Scale–Parent Informant and Scoring Instructure was provided in Supplementary Files 1 and 2.
2.3. Blood lead measurement
For each child, three milliliters of venous blood were collected by experienced staff nurses in a clean room. The wall and floor inside the room as well as the sampling procedures and containers were kept lead-free (measured by a Portable XRF device, XL3t GOLDD+, Thermo Fisher Scientific Inc., Billerica, MA) (Specht et al., 2014). Before blood sampling, 75% alcohol and 2% EDTA (Ethylene Diamine Tetraacetic Acid) cotton balls were used to remove the potential lead contamination from the subjects’ skin. Atomic absorption spectroscopy (PinAAcle 900Z, PerkinElmer) was used to determine the subjects’ blood lead levels with a limit of detection of 0.1 μg/L.
2.4. Bone lead measurement
Children’s bone lead levels were measured by a trained researcher. The lead levels on the surface of the wall and floor in the room were measured using the same methods described in Section 2.3. Tibia lead levels were measured in vivo using a Cd-109 K-shell X-ray fluorescence instrument (KXRF) (Nie et al., 2006). The KXRF bone Pb measurement system consists of four high-purified germanium detectors, four feedback resistance pre-amplifiers, four digital signal processing systems, and a 135 mCi Cd-109 source with a 0.8 mm copper filter. The system has a detection limit of about 2 μg/g for in vivo bone Pb measurements (Nie et al., 2006). Prior to the 30-minute measurement, tibia sites (the midpoint between the medial malleolus and the tibia plateau) were cleaned using 75% alcohol and 2% EDTA to remove potential lead contamination on the surface of the site. The procedure of bone lead measurement has been described in detail previously, and the average uncertainty of the measurement was estimated to be 2.66 μg/g (Specht et al., 2016). The total body effective radiation dose was estimated to be <5 μSv (Nie et al., 2006).
2.5. Potential confounders
Because of potential association with the exposure (blood/bone lead levels) or the outcomes (VADPRS scores) based on biological considerations or statistical analyses, the following covariates collected using constructed questionnaires were adjusted in our multivariable binary logistic regression models: children’s age, sex, passive smoking (the frequency of smoking by parents and other household members in the presence of children), parity, maternal education levels and family yearly income. Because all the children in our study were of the Han ethnicity, and none came from divorced parents or a digamous family (children were all living with their birth parents in our study), we didn’t adjust for ethnicity and parents’ marital status in our analyses.
2.6. Statistical analysis
The 164 children were examined on their socio-demographic characteristics and VADPRS domain scores and were grouped based on their blood-lead or bone-lead levels respectively. Because the blood lead and bone lead data followed log-normal distributions, the geometric means of the blood lead and bone lead levels were calculated. Between our study boys and girls, the differences in the percentages of the ADHD-like behavior and co-morbidities were analyzed by Chi-Square, and the differences in the VADPRS scores were analyzed by Mann-Whitney U test.
According to the current Chinese standard for children’s blood lead levels (Li et al., 2014), blood lead levels <10 μg/dL were considered within the reference range. Therefore, in this study, children with blood lead levels ≥10 μg/dL were classified into the high blood-lead group, and the others with blood lead levels <10 μg/dL into the low blood-lead group. Because the US Centers for Disease Control and Prevention (CDC) recommended 5 μg/dL as the reference level of blood lead in children aged 1 to 5 years (Grigoryan et al., 2016), our study also used the American reference level of 5 μg/dL to classify children [high (≥5 μg/dL) and low (<5 μg/dL) blood-lead groups].
Meanwhile, based on the uncertainty of the bone-lead measurement from our previous study (Specht et al., 2016), children with bone lead levels ≥2.66 μg/g were classified into high bone-lead group, and the others with bone lead levels <2.66 μg/g into the low bone-lead group.
ANOVA was used to compare children’s ages and birth weights between the high and low blood-lead/bone-lead groups, and Chi-square test was used for the comparisons on sex, parity, passive smoking, maternal education and family yearly incomes between the high and low blood-lead/bone-lead groups. Because the distributions of the VADPRS data were skewed, the Mann-Whitney U test was used to examine the differences of the VADPRS scores between the high and low blood-lead/bone-lead groups. Two separate multivariate binary logistic regression analyses were used to evaluate the adjusted odds ratios of the ADHD symptoms/comorbidities for the high blood/bone lead group, using the corresponding low blood-lead or bone-lead groups as the reference. Because only 6 children (3.7%) had anxiety/depression problems and 3 children (1.8%) had conduct disorder in our study sample, the risks of anxiety/depression problems and conduct disorder were not analyzed. All the statistical analyses were conducted using SAS 9.4 software package (SAS Institute, Cary, NC).
3. Results
3.1. Basic characteristics of the study population
Among the 164 study children, 119 children had lead exposure histories (recent or past histories), while the other 45 children had no. The exposure pathways of the 119 lead-exposed children were mainly as follows: industrial sources, using tin-pots for drinking, and an internal or external use of lead-contained Chinese traditional medicine (Supplementary Fig. 1).
The geometric means (calculated based on the equation of of blood lead levels in the high and low blood-lead groups were 19.6 μg/dL and 4.3 μg/dL, respectively. The geometric means of bone lead levels in the high and low bone-lead groups were 12.8 μg/g and 0.3 μg/g, respectively. The maternal education and family yearly income levels were higher in the low blood-lead group than those in the high blood-lead group (all P values <0.05). However, although the low bone-lead group had higher maternal educational levels compared with the high bone-lead group, the difference did not reach a statistically significant level (P = 0.103) (Table 1). Consistent with the former study (Specht et al., 2016), blood lead levels were highly correlated with bone lead levels (r = 0.717, P < 0.001).
Table 1.
Socio-demographic characteristics of the study children.
| Variables | Grouped based on blood lead criteriad |
Grouped based on bone lead criteriae |
||||
|---|---|---|---|---|---|---|
| Low blood lead (n = 66) | High blood lead (n = 88) | P-value | Low bone lead (n = 46) | High bone lead (n = 114) | P-value | |
| Children’s age (years)a,f | 6.6 (2.9) | 6.3 (3.1) | 0.519 | 6.8 (2.9) | 6.3 (3.1) | 0.357 |
| Children’s sexb,g | 0.880 | 0.680 | ||||
| Boys | 45 (68%) | 61 (69%) | 33 (72%) | 78 (68%) | ||
| Girls | 21 (32%) | 27 (31%) | 13 (28%) | 36 (32%) | ||
| Birth weight (kg)a,f | 3.4 (0.4) | 3.3 (0.6) | 0.338 | 3.2 (0.5) | 3.4 (0.6) | 0.094 |
| Blood lead levels (μg/dL)c,h | 4.3 (3.7, 5.1) | 19.6 (17.8, 21.6) | <0.001 | 3.4 (2.7, 4.4) | 14.1 (12.4, 16.0) | <0.001 |
| Bone lead levels (μg/g)c,h | 2.8 (1.6, 4.9) | 15.3 (12.2, 19.3) | <0.001 | 0.3 (0.1, 0.6)i | 12.8 (10.9, 15.2) | <0.001 |
| Passive smokingb,g | 0.485 | 0.504 | ||||
| Never | 17 (26%) | 19 (22%) | 14 (31%) | 27 (24%) | ||
| Occasionally | 32 (49%) | 44 (50%) | 19 (42%) | 57 (50%) | ||
| Sometimes | 13 (20%) | 14 (16%) | 10 (22%) | 19 (17%) | ||
| Often or always | 3 (5%) | 11 (12%) | 2 (5%) | 11 (9%) | ||
| Parityb,g | 0.266 | 0.602 | ||||
| First child | 45 (70%) | 52 (60%) | 31 (70%) | 68 (60%) | ||
| Second child | 18 (28%) | 29 (33%) | 11 (25%) | 39 (34%) | ||
| Third and more | 1 (2%) | 7 (8%) | 2 (5%) | 7 (6%) | ||
| Maternal educationb,g | 0.016 | 0.127 | ||||
| Primary school or lower | 11 (17%) | 17 (19%) | 5 (11%) | 23 (20%) | ||
| Junior high school | 17 (26%) | 43 (49%) | 15 (33%) | 48 (42%) | ||
| Senior high school | 14 (22%) | 15 (17%) | 13 (29%) | 18 (16%) | ||
| College or university level and above | 23 (35%) | 13 (15%) | 12 (27%) | 25 (22%) | ||
| Family yearly income (RMB/year)b,g | 0.036 | 0.378 | ||||
| <30,000 | 16 (25%) | 10 (11%) | 12 (27%) | 17 (15%) | ||
| 30,000–50,000 | 8 (13%) | 27 (31%) | 8 (18%) | 28 (25%) | ||
| 50,000–100,000 | 23 (37%) | 30 (34%) | 15 (34%) | 41 (36%) | ||
| >100,000 | 16 (25%) | 21 (24%) | 9 (21%) | 27 (24%) | ||
Mean (SD) was used for children’s age and birth weight.
n (%) was used for children’s sex, passive smoking (the frequency of smoking by parents and other household members in the presence of children), parity, maternal education, and family yearly income.
Geometric mean (95%CI) was used for blood lead and bone lead levels.
Children were divided into the high blood-lead group (blood lead ≥ 10.0 μg/dL) and the low blood-lead group (blood lead < 10.0 μg/dL) according to their blood lead levels.
Children were divided into the high bone-lead group (bone lead ≥ 2.66 μg/g) and the low bone-lead group (bone lead < 2.66 μg/dL) according to their bone lead levels.
ANOVA was used for the comparisons on children’s ages and birth weights.
Chi-square test was used to compare passive smoking, parity, maternal education, family yearly incomes and children’s sex between the high and low blood-lead/bone-lead groups.
Mann-Whitney U test was used to compare children’s blood lead and bone lead levels between the high and low blood-lead/bone-lead groups.
For reference, bone lead levels in the low bone lead group were below detective limitation.
We found that the percentage of the abnormal hyperactivity/impulsivity behavior was higher in boys than in girls (P = 0.014, Supplementary Table 1). In addition, boys had higher inattention (P = 0.031), hyperactivity/impulsivity (P < 0.001) and ODD (marginally significant, P = 0.052) scores than girls (Supplementary Table 2). No significant differences were observed in blood lead levels (geometric mean, boys vs girls: 10.9 μg/dL vs 9.1 μg/dL) and bone lead levels (geometric mean, boys vs girls: 7.66 μg/g vs 8.64 μg/g) between boys and girls. Because of limited sample size in girls, we failed in comparing the adjusted associations between bone/blood lead and child ADHD-like behavior and comorbidities between girls and boys.
3.2. Comparisons of ADHD-like behavior and comorbidities in the high vs low blood/bone lead groups
Table 2 described the rates of children having inattention, hyperactivity/impulsivity and ODD symptoms in the high vs low blood-lead groups and high vs low bone-lead groups. The rates of children having inattention, hyperactivity/impulsivity and ODD symptoms were higher in the high blood/bone-lead group than those in the low blood/bone-lead group, but the differences did not reach a significant level (P values > 0.05) (Table 2).
Table 2.
The percentages (N%) of children with and without ADHD-like behavior and co-morbidities.a
| Characteristics | Grouped based on blood lead levelsb |
Grouped based on bone lead levelsc |
||||
|---|---|---|---|---|---|---|
| Low blood lead group | High blood lead group | P-value | Low bone lead group | High bone lead group | P-value | |
| Inattention | 0.226 | 0.579 | ||||
| Normal | 59 (91%) | 74 (84%) | 41 (89%) | 97 (86%) | ||
| Abnormal | 6 (9%) | 14 (16%) | 5 (11%) | 16 (14%) | ||
| Hyperactivity/impulsivity | 0.403 | 0.505 | ||||
| Normal | 59 (91%) | 76 (86%) | 41 (91%) | 99 (88%) | ||
| Abnormal | 6 (9%) | 12 (14%) | 4 (9%) | 14 (12%) | ||
| Oppositional defiant disorder | 0.506 | 0.116 | ||||
| Normal | 58 (88%) | 74 (84%) | 43 (93%) | 96 (84%) | ||
| Abnormal | 8 (12%) | 14 (16%) | 3 (7%) | 18 (16%) | ||
ADHD: Attention Deficit Hyperactivity Disorder, Chi-square test.
Low blood lead group was defined as children with blood lead levels <10 μg/dL, and high blood lead group was defined as children with blood lead levels ≥10 μg/dL.
Low bone lead group was defined as children with bone lead levels <2.66 μg/g, and high bone lead group was defined as children with bone lead levels ≥2.66 μg/g.
Table 3 showed the scores of children’s ADHD symptoms and comorbidities among the high/low blood-lead/bone-lead groups. The hyperactivity/impulsivity scores were higher in the high blood or bone lead group than those in the corresponding low blood or bone lead group (P values < 0.05), and the hyperactivity/impulsivity and ODD scores were significantly higher in the high bone-lead group than those in the low group (all P values < 0.05) (Table 3).
Table 3.
The VADPRS scores in children among the high and low blood/bone lead groups [median (the 25th percentile–the 75th percentile)].a,b
| Characteristics | Grouped based on blood lead levelsc |
Grouped based on bone lead levelsd |
||||
|---|---|---|---|---|---|---|
| Low blood lead group | High blood lead group | P-value | Low bone lead group | High bone lead group | P-value | |
| Inattention | 8.0 (4.0–11.0) | 8.0(6.0–12.5) | 0.094 | 8.5 (5.0–11.0) | 8 (5.0–11.0) | 0.279 |
| Hyperactivity/Impulsivity | 5.0 (3.0–10) | 8.0 (3.5–13.0) | 0.025 | 4.5 (3.0–10.0) | 7.0 (3.0–12.0) | 0.022 |
| Oppositional defiant disorder | 5.0 (2.5–8.0) | 6.0 (3.0–9.0) | 0.472 | 5.0 (2.0–7.0) | 6.0 (3.0–9.0) | 0.034 |
VADPRS: Vanderbilt ADHD (Attention Deficit Hyperactivity Disorder) Diagnostic Parent Rating Scale.
Mann-Whitney U test was used to compare the VADPRS scores between the high and low blood-lead/bone-lead groups.
Low blood group was defined as children with blood lead levels <10 μg/dL, and high blood lead group was defined as children with bone lead levels ≥10 μg/dL.
Low bone lead group was defined as children with bone lead levels <2.66 μg/g, and high bone lead group was defined as children with bone lead levels ≥2.66 μg/g.
Table 4 displayed the adjusted relationship between high blood/bone lead and the risks of ADHD symptoms and comorbidities. After adjusting for potential confounders mentioned above, children in the high bone-lead group were more likely to have ODD than those in the low bone-lead group (OR = 6.7, 95%CI: 1.2, 36.5, P = 0.027). However, no significant association was found between blood lead levels and any of child ADHD symptoms and comorbidities.
Table 4.
The adjusted associations between child blood lead, bone lead levels and ADHD-like behavior and co-morbidities.a,b
| Characteristics | Inattention |
Hyperactivity/impulsivity |
Oppositional defiant disorder |
|||
|---|---|---|---|---|---|---|
| OR (95%CI) | P-value | OR (95%CI) | P-value | OR (95%CI) | P-value | |
| Grouped based on blood lead levelsc | ||||||
| Low blood lead group | Ref | Ref | Ref | |||
| High blood lead group | 3.3 (0.9, 12.4) | 0.075 | 2.0 (0.5, 7.5) | 0.299 | 2.7 (0.8, 8.9) | 0.102 |
| Grouped based on bone lead levelsc | ||||||
| Low blood lead group | Ref | Ref | Ref | |||
| High blood lead group | 1.9 (0.5, 7.0) | 0.345 | 2.3 (0.5, 9.9) | 0.275 | 6.7 (1.2, 36.5) | 0.027d |
Adjusting for children’s sex, age, birth weight, passive smoking (the frequency of smoking by parents and other household members in the presence of children), parity, maternal education and family yearly income.
ADHD: Attention Deficit Hyperactivity Disorder.
Low blood lead group was defined as children with blood lead levels <10 μg/dL, and high blood lead group was defined as children with blood lead levels ≥10 μg/dL. Low bone lead group was defined as children with bone lead levels <2.66 μg/g, and high bone lead group was defined as children with bone lead levels ≥2.66 μg/g.
P < 0.05 was considered statistically significant.
When the cut-off point of blood lead was set at 5 μg/dL, the results showed a similar trend (Supplementary Tables 3–5). Because the 10 μg/dL was more frequently used than the 5 μg/dL in the upper limit of the reference range of children’s blood lead levels in China, we finally used the cut-off of 10 μg/dL in the grouping of the high/low blood lead.
4. Discussion
As far as we know, our study was among the first to compare the associations of ADHD-like behavior with blood lead vs bone lead levels in children. We found that although higher blood lead and bone lead levels were both related to higher hyperactivity/impulsivity levels, only high bone lead was independently associated with child ODD behavior.
ODD was considered as a predictor of antisocial and criminal behavior in youths (Aebi et al., 2013). Children with concurrent low-lead exposure but relatively high body burden of lead may have low blood lead but high bone lead levels (Weuve et al., 2009). Consistent with the lead-crime hypothesis, which suggested a potential association between lead exposure in early life and subsequent crime rate trends (Boutwell et al., 2016; Wright et al., 2008), our study suggested that children with high cumulative lead exposure (may be due to long history of lead exposure or high exposure in early life) deserved special attention for their subsequent behavioral problems. Our study was also consistent with previous studies that found that bone lead might be associated with delinquent behavior (Needleman et al., 2002; Needleman et al., 1996), and with another study that found that bone lead was a more important factor than concurrent blood lead levels in the development of depression, anxiety or other psychiatric symptoms (Rhodes et al., 2003). One possible explanation for this “bone lead-ODD” relationship may be that the mechanisms underlying the associations of blood lead and bone lead with the central nervous system are different from each other. Based on literature reports, bone lead may have a more significant long-term and cumulative effect than blood lead on the brain regions closely related with the development of ODD or antisocial behavior (Rhodes et al., 2003) and might affect neurotransmitter concentrations during a long period that may be involved in the development of ODD behavior by inducing neuronal chronic injury or death through cumulative oxidative effects, while blood lead might induce acute interaction with neuron/gap junctions and directly interfere with neurotransmitter release (Rhodes et al., 2003; Weisskopf et al., 2004; Weuve et al., 2009). Thus, we speculated that, the bone lead level may be a predictor of child ODD behavior through long-term interaction of lead with neurons (Rhodes et al., 2003).
Although there was still no consensus on the association between lead exposure and children’s hyperactivity/impulsivity, an adverse association between lead exposure and child hyperactivity/impulsivity has been reported more often than a null association (Daneshparvar et al., 2016). Consistent with most of previous studies, our study confirmed higher levels of hyperactivity/impulsivity in the high blood/bone lead groups than in the low blood/bone lead groups. The dopaminergic pathway might be one of the main factors involved (Bellgrove et al., 2005; Swanson et al., 2000). Lead may result in the acceleration of dopaminergic neuron loss by inducing oxidative stress (Acharya and Acharya, 1997; Adonaylo and Oteiza, 1999), and disturbed homeostasis of dopamine neurotransmitters by competing with calcium at its binding sites in the frontal cortex, as well as subcortical regions like striatum, and other brain regions that were associated with the development of ADHD symptoms (Holmboe et al., 2010).
Inconsistent with most of the previous studies that showed that the blood lead level had an independent effect on child ADHD core symptoms, our study found high blood lead levels were associated with higher hyperactivity/impulsivity levels in the unadjusted models but not significantly associated in adjusted models. The difference between previous studies and ours may be due to the small sample size. Our relatively small sample size (88 of them had blood lead levels ≥10 μg/dL and 66 of them had blood levels <10 μg/dL) could limit the statistical power of the findings.
Our study was consistent with previous studies that found non-significant association between blood lead and parent-reported inattention behavior (Huang et al., 2016; Nigg et al., 2010). However, other studies reported that higher levels of blood lead were significantly associated with higher teacher-reported inattention scores (Chiodo et al., 2007; Roy et al., 2009). This disagreement may be due to that teachers may have more opportunities to observe children’s inattention symptoms (relevant to classroom behavior) than parents, and teachers’ perceptions of child behavior may be more objective or stricter than parents’ perceptions (Liu et al., 2014).
Our study was consistent with previous study that reported that boys were more vulnerable than girls to ADHD when suffering from high lead exposure in early childhood (Ji et al., 2018). In this study, although we didn’t compare independent associations between blood/bone lead and ADHD-like behavior and co-morbidities between boys and girls due to limited sample size, we found a higher percentage of the abnormal hyperactivity/impulsivity behavior, higher inattention, hyperactivity/impulsivity and ODD scores in boys than in girls even when no significant differences in blood lead and bone lead were observed between girls and boys.
There are several limitations in this study. Our relatively small sample size (164 children) may limit the statistical power of the findings. Child ADHD symptoms were not assessed simultaneously by teachers’ reports, thus there may be a bias in the rating of child ADHD-like behavior in our study. Although the VADPRS was based on the DSM-V criteria for ADHD diagnosis, we used only one assessment tool to evaluate child ADHD-like behavior, and our failure to apply other tools simultaneously and the limited predictive value of the VADPRS among children aged 3–6 years may make our study results unstable, and we considered our results preliminary until being replicated. Our study used a cross-sectional study design, and behavioral problems may precede lead exposure and even cause lead exposure through some certain behavioral pathways such as increased hand-to-mouth behavior. However, David et al. found that hyperactivity was not responsible for the acquisition of elevated lead levels (David et al., 1977). In addition, we did not adjust for genetic factors of ADHD. However, because maternal education levels were associated with their ADHD symptoms (Biederman et al., 2008), and we included maternal education in our adjusted analyses, the confounding effect induced by genetic factors may be partially controlled because we have adjusted for maternal education level in our analyses. Since the children in our study were all of the Han ethnicity, caution should be taken when generalizing these results to other ethnicities (Needleman et al., 2002). Finally, except for the social and environmental factors that have been taken into consideration in our analyses, some factors associated with blood/bone lead or child ADHD-like behavior may not be included in this study.
5. Conclusion
In conclusion, our study suggested that higher blood and bone lead levels were both associated with higher hyperactivity/impulsivity levels in children, however, bone lead levels may be independently associated with child ODD. High levels of cumulative lead exposure may be an independent predictor of ODD in children. Although significant decreases in child blood lead levels have occurred over the last several decades, lead exposure, especially cumulative lead exposure, remains a challenge for subsequent child development (Yan et al., 2013). Efforts should be made to minimize children’s concurrent lead exposure, and to look out for the ODD development among children who had high bone lead levels, had long histories of lead exposure or lived in areas with high lead pollution during their early life.
Supplementary Material
HIGHLIGHTS.
High cumulative lead exposure was reported to associate with high past exposure to lead.
Limited studies explored the association of bone lead with child ADHD-like behavior.
Bone lead levels represent levels of cumulative lead exposure.
High levels of cumulative lead exposure are independently associated with oppositional-defiant-disorder in children.
Acknowledgement
Funding source: This study was supported by the National Natural Science Foundation of China [81673189, 30901205, 81373016]; Shanghai Municipal Education Commission—Gaofeng Clinical Medicine Grant Support [20172016]; Shanghai Health and Family Planning Commission [201640363]; The National Basic Research Program of China [“973” Program, 2012CB525001]. The funding sources had no role in the design and conduct of the study; collection, management, analysis, and interpretation of the data; preparation, review, or approval of the manuscript; and decision to submit the manuscript for publication.
Abbreviations:
- ADHD
Attention Deficit Hyperactivity Disorder
- ODD
oppositional defiant disorder
- CD
conduct disorder
- ANX/DEP
anxiety/depress
- VADPRS
Vanderbilt ADHD Diagnostic Parent Rating Scale
- DSM-V
Diagnostic and Statistical Manual of Mental Disorders-V
- EDTA
Ethylene Diamine Tetraacetic Acid
Footnotes
Supplementary data to this article can be found online at https://doi.org/10.1016/j.scitotenv.2018.12.219.
Financial disclosure: The authors have indicated they have no financial relationships relevant to this article to disclose.
Conflict of interest: The other authors have indicated they have no potential conflicts of interest to disclose.
References
- Acharya S, Acharya UR, 1997. In vivo lipid peroxidation responses of tissues in lead-treated Swiss mice. Ind. Health 35, 542–544. [DOI] [PubMed] [Google Scholar]
- Adonaylo VN, Oteiza PI, 1999. Pb2+ promotes lipid oxidation and alterations in membrane physical properties. Toxicology 132, 19–32. [DOI] [PubMed] [Google Scholar]
- Aebi M, Plattner B, Metzke CW, Bessler C, Steinhausen HC, 2013. Parent-and self-reported dimensions of oppositionality in youth: construct validity, concurrent validity, and the prediction of criminal outcomes in adulthood. J. Child Psychol. Psychiatry 54, 941–949. [DOI] [PubMed] [Google Scholar]
- Ahlgren L, Haeger-Aronsen B, Mattsson S, Schutz A, 1980. In-vivo determination of lead in the skeleton after occupational exposure to lead. Br. J. Ind. Med 37, 109–113. [DOI] [PMC free article] [PubMed] [Google Scholar]
- APA, 2000. Diagnostic and Statistical Manual of Mental Disorders DSM-IV-TR Fourth Edition (Text Revison). American Psychiatric Association. [Google Scholar]
- Bellgrove MA, Hawi Z, Lowe N, Kirley A, Robertson IH, Gill M, 2005. DRD4 gene variants and sustained attention in attention deficit hyperactivity disorder (ADHD): effects of associated alleles at the VNTR and −521 SNP. Am. J. Med. Genet. B Neuropsychiatr. Genet 136b, 81–86. [DOI] [PubMed] [Google Scholar]
- Biederman J, Petty CR, Fried R, Kaiser R, Dolan CR, Schoenfeld S, et al. , 2008. Educational and occupational underattainment in adults with attention-deficit/hyperactivity disorder: a controlled study. J. Clin. Psychiatry 69, 1217–1222. [DOI] [PubMed] [Google Scholar]
- Boutwell BB, Nelson EJ, Emo B, Vaughn MG, Schootman M, Rosenfeld R, et al. , 2016. The intersection of aggregate-level lead exposure and crime. Environ. Res 148, 79–85. [DOI] [PubMed] [Google Scholar]
- Braun JM, Kahn RS, Froehlich T, Auinger P, Lanphear BP, 2006. Exposures to environmental toxicants and attention deficit hyperactivity disorder in U.S. children. Environ. Health Perspect 114, 1904–1909. [DOI] [PMC free article] [PubMed] [Google Scholar]
- Brondum J, 2009. Attention deficit hyperactivity disorder and blood lead levels in Chinese children. Environ. Health Perspect 117, A286. [DOI] [PMC free article] [PubMed] [Google Scholar]
- Cao J, Li M, Wang Y, Yu G, Yan C, 2014. Environmental lead exposure among preschool children in Shanghai, China: blood lead levels and risk factors. PLoS One 9, e113297. [DOI] [PMC free article] [PubMed] [Google Scholar]
- Chiodo LM, Covington C, Sokol RJ, Hannigan JH, Jannise J, Ager J, et al. , 2007. Blood lead levels and specific attention effects in young children. Neurotoxicol. Teratol 29, 538–546. [DOI] [PubMed] [Google Scholar]
- Cuffe SP, Visser SN, Holbrook JR, Danielson ML, Geryk LL, Wolraich ML, et al. , 2015. ADHD and psychiatric comorbidity: functional outcomes in a school-based sample of children. J. Atten. Disord. epub ahead of print. [DOI] [PMC free article] [PubMed] [Google Scholar]
- Daneshparvar M, Mostafavi SA, Zare Jeddi M, Yunesian M, Mesdaghinia A, Mahvi AH, et al. , 2016. The role of lead exposure on attention-deficit/hyperactivity disorder in children: a systematic review. Iran J. Psychiatry 11, 1–14. [PMC free article] [PubMed] [Google Scholar]
- David OJ, Hoffman SP, Sverd J, Clark J, 1977. Lead and hyperactivity: lead levels among hyperactive children. J. Abnorm. Child Psychol 5, 405–416. [DOI] [PubMed] [Google Scholar]
- Garg J, Arun P, 2013. A follow-up study of academic functioning and social adjustment in children with attention deficit hyperactivity disorder. Indian J. Psychol. Med 35, 47–52. [DOI] [PMC free article] [PubMed] [Google Scholar]
- Garg J, Arun P, Chavan BS, 2015. Comparative efficacy of methylphenidate and atomoxetine in oppositional defiant disorder comorbid with attention deficit hyperactivity disorder. Int. J. Appl. Basic Med. Res 5, 114–118. [DOI] [PMC free article] [PubMed] [Google Scholar]
- Grigoryan R, Petrosyan V, Melkom Melkomian D, Khachadourian V, McCartor A, Crape B, 2016. Risk factors for children’s blood lead levels in metal mining and smelting communities in Armenia: a cross-sectional study. BMC Public Health 16, 945. [DOI] [PMC free article] [PubMed] [Google Scholar]
- Holmboe K, Nemoda Z, Fearon RM, Csibra G, Sasvari-Szekely M, Johnson MH, 2010. Polymorphisms in dopamine system genes are associated with individual differences in attention in infancy. Dev. Psychol 46, 404–416. [DOI] [PMC free article] [PubMed] [Google Scholar]
- Hong SB, Im MH, Kim JW, Park EJ, Shin MS, Kim BN, et al. , 2015. Environmental lead exposure and attention deficit/hyperactivity disorder symptom domains in a community sample of South Korean school-age children. Environ. Health Perspect 123, 271–276. [DOI] [PMC free article] [PubMed] [Google Scholar]
- Hu H, Shih R, Rothenberg S, Schwartz BS, 2007. The epidemiology of lead toxicity in adults: measuring dose and consideration of other methodologic issues. Environ. Health Perspect 115, 455–462. [DOI] [PMC free article] [PubMed] [Google Scholar]
- Huang S, Hu H, Sanchez BN, Peterson KE, Ettinger AS, Lamadrid-Figueroa H, et al. , 2016. Childhood blood Lead levels and symptoms of attention deficit hyperactivity disorder (ADHD): a cross-sectional study of Mexican children. Environ. Health Perspect 124, 868–874. [DOI] [PMC free article] [PubMed] [Google Scholar]
- Ji JS, Schwartz J, Sparrow D, Hu H, Weisskopf MG, 2014. Occupational determinants of cumulative lead exposure: analysis of bone lead among men in the VA normative aging study. J. Occup. Environ. Med 56, 435–440. [DOI] [PMC free article] [PubMed] [Google Scholar]
- Ji Y, Hong X, Wang G, Chatterjee N, Riley AW, Lee LC, et al. , 2018. A prospective birth cohort study on early childhood lead levels and attention deficit hyperactivity disorder: new insight on sex differences. J. Pediatr 199, 124–131.e8. [DOI] [PMC free article] [PubMed] [Google Scholar]
- Joo H, Lim MH, Ha M, Kwon HJ, Yoo SJ, Choi KH, et al. , 2017. Secondhand smoke exposure and low blood lead levels in association with attention-deficit hyperactivity disorder and its symptom domain in children: a community-based case-control study. Nicotine Tob. Res 19, 94–101. [DOI] [PMC free article] [PubMed] [Google Scholar]
- Larson K, Russ SA, Kahn RS, Halfon N, 2011. Patterns of comorbidity, functioning, and service use for US children with ADHD, 2007. Pediatrics 127, 462–470. [DOI] [PMC free article] [PubMed] [Google Scholar]
- Li MM, Cao J, Xu J, Cai SZ, Shen XM, Yan CH, 2014. The national trend of blood lead levels among Chinese children aged 0–18 years old, 1990–2012. Environ. Int 71, 109–117. [DOI] [PubMed] [Google Scholar]
- Liang F, Zhang G, Tan M, Yan C, Li X, Li Y, et al. , 2010. Lead in children’s blood is mainly caused by coal-fired ash after phasing out of leaded gasoline in Shanghai. Environ. Sci. Technol 44, 4760–4765. [DOI] [PubMed] [Google Scholar]
- Liu J, Liu X, Wang W, McCauley L, Pinto-Martin J, Wang Y, et al. , 2014. Blood lead concentrations and children’s behavioral and emotional problems: a cohort study. JAMA Pediatr 168, 737–745. [DOI] [PMC free article] [PubMed] [Google Scholar]
- Naicker N, Norris SA, Mathee A, von Schirnding YE, Richter L, 2010. Prenatal and adolescent blood lead levels in South Africa: child, maternal and household risk factors in the Birth to Twenty cohort. Environ. Res 110, 355–362. [DOI] [PubMed] [Google Scholar]
- Needleman HL, Riess JA, Tobin MJ, Biesecker GE, Greenhouse JB, 1996. Bone lead levels and delinquent behavior. JAMA 275, 363–369. [PubMed] [Google Scholar]
- Needleman HL, McFarland C, Ness RB, Fienberg SE, Tobin MJ, 2002. Bone lead levels in adjudicated delinquents. A case control study. Neurotoxicol. Teratol 24, 711–717. [DOI] [PubMed] [Google Scholar]
- Nie H, Chettle D, Luo L, O’Meara J, 2006. In vivo investigation of a new 109Cd gamma-ray induced K-XRF bone lead measurement system. Phys. Med. Biol 51, 351–360. [DOI] [PubMed] [Google Scholar]
- Nigg JT, Nikolas M, Mark Knottnerus G, Cavanagh K, Friderici K, 2010. Confirmation and extension of association of blood lead with attention-deficit/hyperactivity disorder (ADHD) and ADHD symptom domains at population-typical exposure levels. J. Child Psychol. Psychiatry 51, 58–65. [DOI] [PMC free article] [PubMed] [Google Scholar]
- Polanczyk G, de Lima MS, Horta BL, Biederman J, Rohde LA, 2007. The worldwide prevalence of ADHD: a systematic review and metaregression analysis. Am. J. Psychiatry 164, 942–948. [DOI] [PubMed] [Google Scholar]
- Rhodes D, Spiro A 3rd, Aro A, Hu H, 2003. Relationship of bone and blood lead levels to psychiatric symptoms: the normative aging study. J. Occup. Environ. Med 45, 1144–1151. [DOI] [PubMed] [Google Scholar]
- Roy A, Bellinger D, Hu H, Schwartz J, Ettinger AS, Wright RO, et al. , 2009. Lead exposure and behavior among young children in Chennai, India. Environ. Health Perspect 117, 1607–1611. [DOI] [PMC free article] [PubMed] [Google Scholar]
- Specht AJ, Weisskopf M, Nie LH, 2014. Portable XRF technology to quantify Pb in bone in vivo. J. Biomark 2014, 398032. [DOI] [PMC free article] [PubMed] [Google Scholar]
- Specht AJ, Lin Y, Weisskopf M, Yan C, Hu H, Xu J, et al. , 2016. XRF-measured bone lead (Pb) as a biomarker for Pb exposure and toxicity among children diagnosed with Pb poisoning. Biomarkers 21, 347–352. [DOI] [PMC free article] [PubMed] [Google Scholar]
- Specht AJ, Lin Y, Xu J, Weisskopf M, Nie LH, 2018. Bone lead levels in an environmentally exposed elderly population in shanghai, China. Sci. Total Environ 626, 96–98. [DOI] [PMC free article] [PubMed] [Google Scholar]
- Swanson JM, Flodman P, Kennedy J, Spence MA, Moyzis R, Schuck S, et al. , 2000. Dopamine genes and ADHD. Neurosci. Biobehav. Rev 24, 21–25. [DOI] [PubMed] [Google Scholar]
- Tan MG, Zhang GL, Li XL, Zhang YX, Yue WS, Chen JM, et al. , 2006. Comprehensive study of lead pollution in Shanghai by multiple techniques. Anal. Chem 78, 8044–8050. [DOI] [PubMed] [Google Scholar]
- Taylor CM, Humphriss R, Hall A, Golding J, Emond AM, 2015. Balance ability in 7-and 10-year-old children: associations with prenatal lead and cadmium exposure and with blood lead levels in childhood in a prospective birth cohort study. BMJ Open 5, e009635. [DOI] [PMC free article] [PubMed] [Google Scholar]
- Theppeang K, Glass TA, Bandeen-Roche K, Todd AC, Rohde CA, Links JM, et al. , 2008. Associations of bone mineral density and lead levels in blood, tibia, and patella in urban-dwelling women. Environ. Health Perspect 116, 784–790. [DOI] [PMC free article] [PubMed] [Google Scholar]
- Wang HL, Chen XT, Yang B, Ma FL, Wang S, Tang ML, et al. , 2008. Case-control study of blood lead levels and attention deficit hyperactivity disorder in Chinese children. Environ. Health Perspect 116, 1401–1406. [DOI] [PMC free article] [PubMed] [Google Scholar]
- Weisskopf MG, Wright RO, Schwartz J, Spiro A 3rd, Sparrow D, Aro A, et al. , 2004. Cumulative lead exposure and prospective change in cognition among elderly men: the VA Normative Aging Study. Am. J. Epidemiol 160, 1184–1193. [DOI] [PubMed] [Google Scholar]
- Weuve J, Korrick SA, Weisskopf MG, Ryan LM, Schwartz J, Nie H, et al. , 2009. Cumulative exposure to lead in relation to cognitive function in older women. Environ. Health Perspect 117, 574–580. [DOI] [PMC free article] [PubMed] [Google Scholar]
- Wolraich ML, Lambert W, Doffing MA, Bickman L, Simmons T, Worley K, 2003. Psychometric properties of the Vanderbilt ADHD diagnostic parent rating scale in a referred population. J. Pediatr. Psychol 28, 559–567. [DOI] [PubMed] [Google Scholar]
- Wolraich M, Brown L, Brown RT, Dupaul G, Earls M, Feldman HM, et al. , 2011. ADHD: clinical practice guideline for the diagnosis, evaluation, and treatment of attention-deficit/hyperactivity disorder in children and adolescents. Pediatrics 128, 1007–1022. [DOI] [PMC free article] [PubMed] [Google Scholar]
- Wright JP, Dietrich KN, Ris MD, Hornung RW, Wessel SD, Lanphear BP, et al. , 2008. Association of prenatal and childhood blood lead concentrations with criminal arrests in early adulthood. PLoS Med 5, e101. [DOI] [PMC free article] [PubMed] [Google Scholar]
- Yan CH, Xu J, Shen XM, 2013. Childhood lead poisoning in China: challenges and opportunities. Environ. Health Perspect 121, A294. [DOI] [PMC free article] [PubMed] [Google Scholar]
- Ying XL, Gao ZY, Yan J, Zhang M, Wang J, Xu J, et al. , 2018. Sources, symptoms and characteristics of childhood lead poisoning: experience from a lead specialty clinic in China. Clin. Toxicol. (Phila.) 56, 397–403. [DOI] [PubMed] [Google Scholar]
Associated Data
This section collects any data citations, data availability statements, or supplementary materials included in this article.