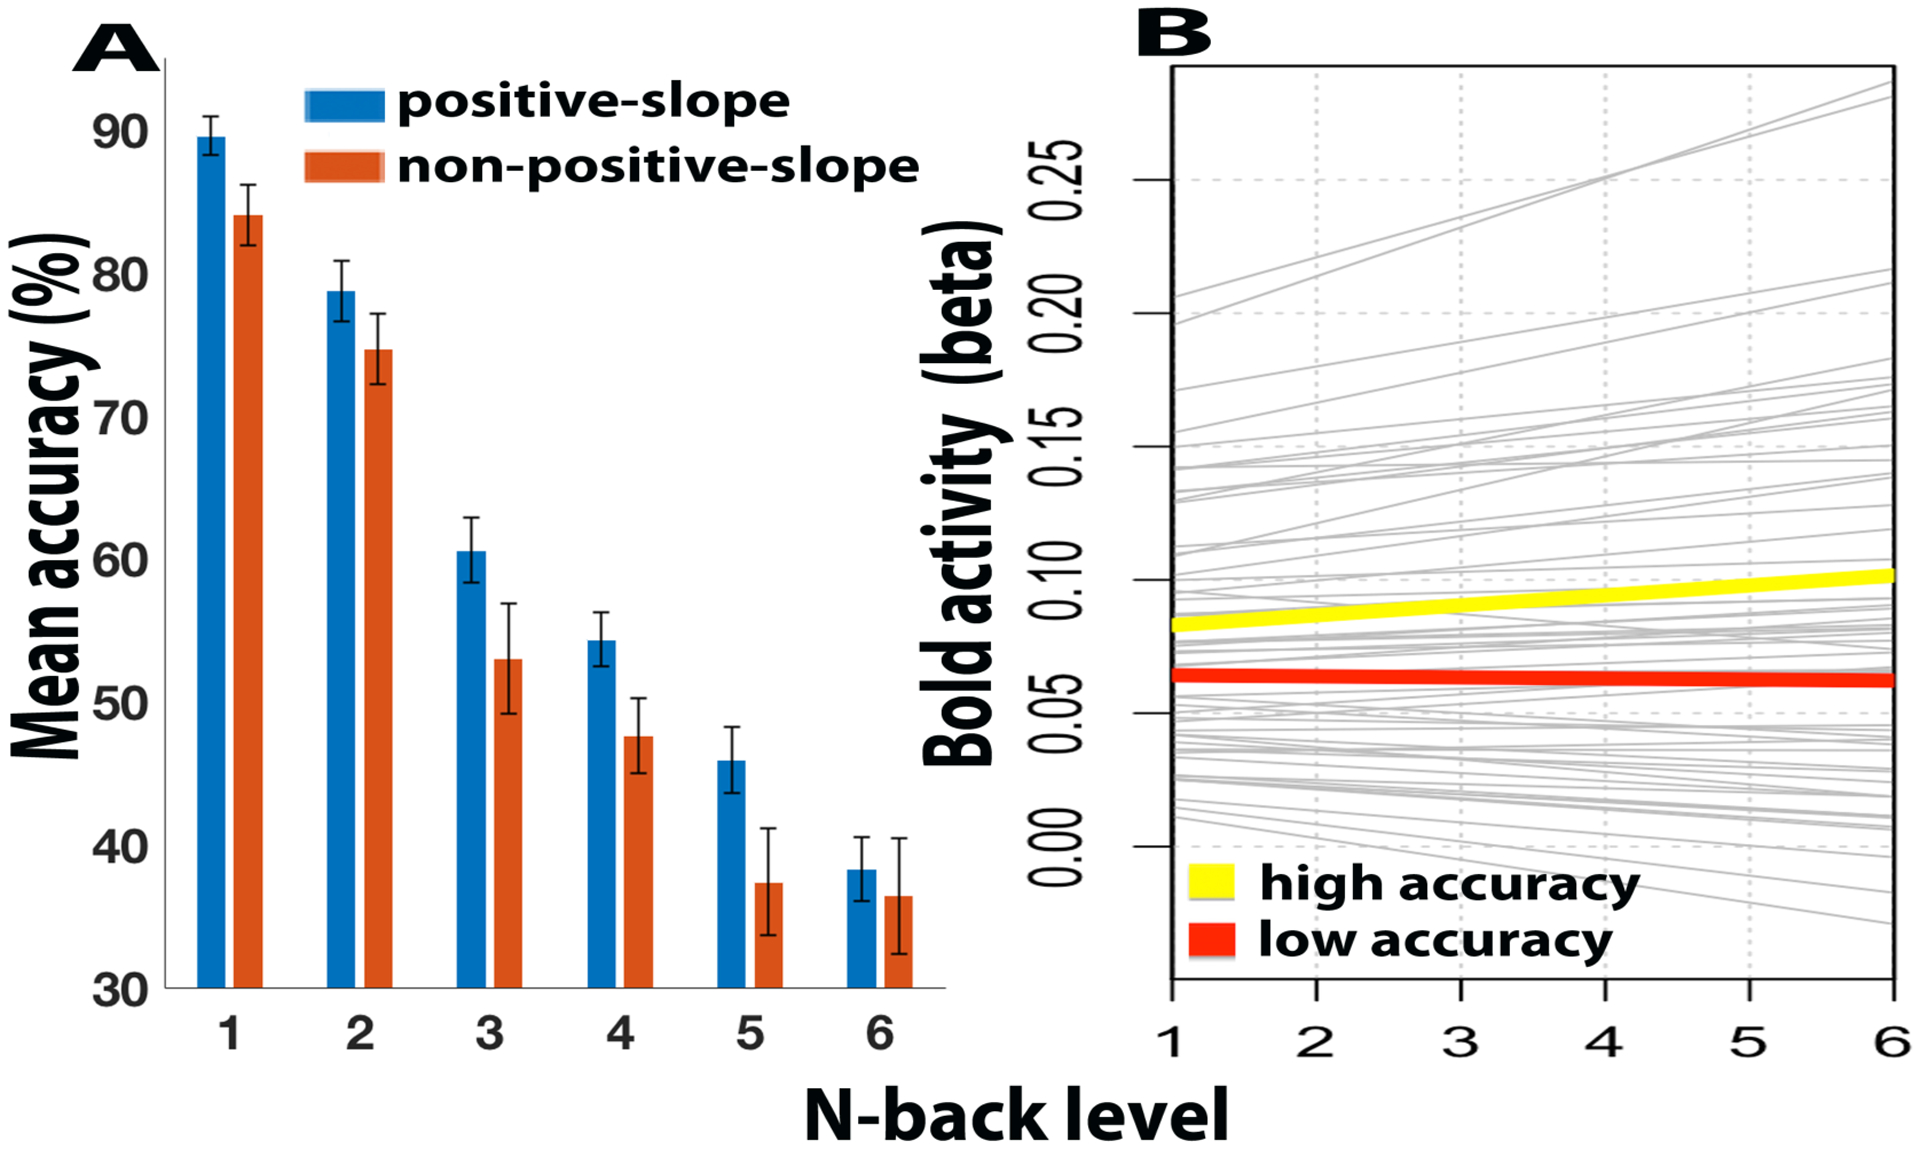
Figure 5.

(A) Participants are divided into subgroups based on whether they exhibited load-related increases in LPFC BOLD activity (positive linear slope; blue), or flat/decreasing activity (nonpositive linear slope; red). Bar plots display mean target accuracy of the two participant subgroups for 1:6 back tasks, and demonstrate generally better performance across all load levels in the (blue) subgroup showing load-related increases. Error bars indicate standard error of the mean. (B) Plot of fitted bold activity of N-back levels. Gray thin lines represent the linear slope of BOLD load effects in all individual participants. Mean slope of the high accuracy participants (top third, n = 19; yellow) and low accuracy participants (bottom third, n = 19; red).
