

Abstract
RNA synthesis occurs through the multi-step process of transcription which consists of initiation, elongation, termination, and cleavage of the nascent RNA. In recent years, post-initiation events have attracted considerable attention as regulatory steps in gene expression. In particular, changes in elongation rate have been proposed to alter RNA fate either through changes in RNA secondary structure or recruitment of trans-acting factors, but systematic approaches for perturbing and measuring elongation rate are currently lacking. Here, we describe a system for precisely measuring elongation dynamics for single nascent transcripts at a single gene locus in human cell lines. The system is based on observing the production of fluorescently labeled RNA stem loops which flank a region of interest. The region of interest can be altered using flp recombinases, thus allowing one to study the effects of cis-acting sequences on transcription rate. The dual-color RNAs which are made during this process are exported and translated, thus enabling visualization of each step in gene expression.
Keywords: Single-molecule, RNA, Fluorescence, Transcription, Quantitative, Single-gene
1. Introduction
mRNA, the final product of transcription and that serves as the template for protein synthesis plays a central role in gene expression in all living beings. Therefore, mRNA synthesis and its regulation (the first step in gene expression), its structure and function and its degradation deserve in depth examination in order to understand the control of gene expression in single celled prokaryotes to multicellular eukaryotes. Although there is a vast amount of knowledge on the structure and function of RNAs in isolation using biochemical and genetic approaches, the factors (nucleic acids sequences or protein factors) and mechanisms that control the synthesis of RNA and the dynamic nature of its existence in individual cells is not well understood. In recent years, significant advances have been made to understand RNA synthesis in vivo using genome wide [1–4] and single-molecule approaches [5,6]. These genome-wide studies were population based and single-molecule approaches took advantage of multi-copy gene insertions to address these questions. However, a single-gene approach that would more closely recapitulate the in vivo context is lacking.
The ability to visualize RNA dynamics in its native form can provide insights into the role of RNA structure, protein-RNA interactions and how they control the fate of RNA and consequently gene expression. For example, the dominant paradigm of gene regulation in bacteria hinges on the relationship between nascent RNA structures and elongation rate, leading to formation of functional RNA secondary structures. It is well established that the interactions between nascent RNA structure and RNA polymerase or other regulatory proteins can result in pausing or termination (for a comprehensive review, see [7]). Although such mechanisms are not widespread or are yet to be discovered in eukaryotes, there is evidence to implicate the interplay between RNA secondary structures and transcript elongation in gene activation from the HIV-LTR [7,8], the role of RNA secondary structures in splicing decisions [9], and more recently in the biogenesis of miRNA [10]. However, these are ensemble experiments done in populations of cells, and the contribution of cell-to-cell variation within these populations is not known. In order to get a better understanding of transcription kinetics, it is essential to make these measurements in single cells. Although elongation rates in vivo have been measured in ensemble studies [1–4], a more accurate measure of elongation rate is possible only at the single-gene level in single cells. Such an approach would then allow one to better understand the interplay between transcript elongation and RNA secondary structure formation and how these processes are regulated.
Several laboratories have developed technologies to label RNA in vivo by fluorescently labeling proteins that bind RNA enabling visualization of RNA at sites of transcription of a gene in living cells [11–15]. These studies have been instrumental in advancing our understanding of transcription dynamics. Despite these advances, technical challenges still remain to visualize, resolve, and track the dynamic processes that occur during RNA synthesis in living cells in real time. In particular, we note that achieving single-gene labeling, identifying insertion position, and characterizing single gene behavior in human cells is still a daunting task. The experimental tools have not been described in any depth. Moreover, as gene editing becomes more ubiquitous, we expect the need for benchmark experimental protocols will increase.
Here we describe a method to establish an inducible single-gene two-color transcription reporter assay system to visualize nascent RNA synthesis from a single genomic locus. This has been achieved by fusing to the 3′-end of a reporter gene, a DNA cassette that codes for stable viral RNA hairpins [13,14], which when synthesized can bind its cognate coat protein that is fluorescently labeled [16–18]. This inducible two-color single gene reporter assay system was developed to study the effect of nucleotide sequences and or trans-acting protein factors on the kinetics of transcript elongation by human RNA polymerase II. From the perspective of this article we will be focusing only on the development of the system to visualize RNA in living cells as an in depth treatise of the algorithms, models and other computational software tools developed to analyze RNA dynamics has already been published by our colleagues elsewhere [15,19].
2. Methods
The reporter gene system was chosen based on one primary design criterion: we desired a gene whose activity was regulated independently of endogenous activators and which could be titrated based on the level of an externally-applied agonist. The re-constituted ecdysone reporter gene system described in [20] meets this requirement. The ecdysone receptor is a unique insect steroid receptor and is not expressed in human cells. We took advantage of this property and used a human U2OS cell line that stably expresses the exogenous chimeric ecdysone receptor and its heterodimeric partner the retinoid X receptor to create the inducible reporter system [6]. The ecdysone receptor has a number of natural and synthetic agonists, but the most potent is Ponasterone A (PonA). As described previously [6], a highly-inducible parent line was selected by luciferase screening in response to PonA, and this line was the basis for all subsequent manipulations.
The single-gene two-color assay system was developed in the parent line in two steps. In the first step we introduced into the parent line at a single locus a DNA acceptor construct with a transcription unit coding for the PP7 RNA hairpin cassette and with a flp recombinase recognition site. Into this stable cell line, we then introduced by recombination the donor plasmid coding for the sequence of interest followed by the MS2 hairpin cassette. The resulting RNA from this transcription unit would be labeled in two fluorescently distinct colors when bound by the coat protein to their cognate RNA hairpins.
2.1. DNA constructs
2.1.1. Acceptor and donor plasmids for the dual color transcription reporter
The acceptor DNA construct (Fig. 1A), derived from a previously constructed reporter [6], encodes for a PonA inducible promoter driving the expression of Cyan Fluorescent Protein (CFP) with a peroxisome localization signal (SKL) followed by a DNA cassette coding for 24 copies of the PP7 RNA hairpins (24× PP7). A flp recombinase recognition site is encoded downstream of the hairpin cassette to introduce a DNA element of interest and the second hairpin cassette. The DNA element of interest, a selection marker and the cassette coding for 24 copies of the MS2 RNA hairpin (24× MS2) are encoded downstream of a flp recombinase recognition site in a donor DNA construct (Fig. 1B).
Fig. 1.
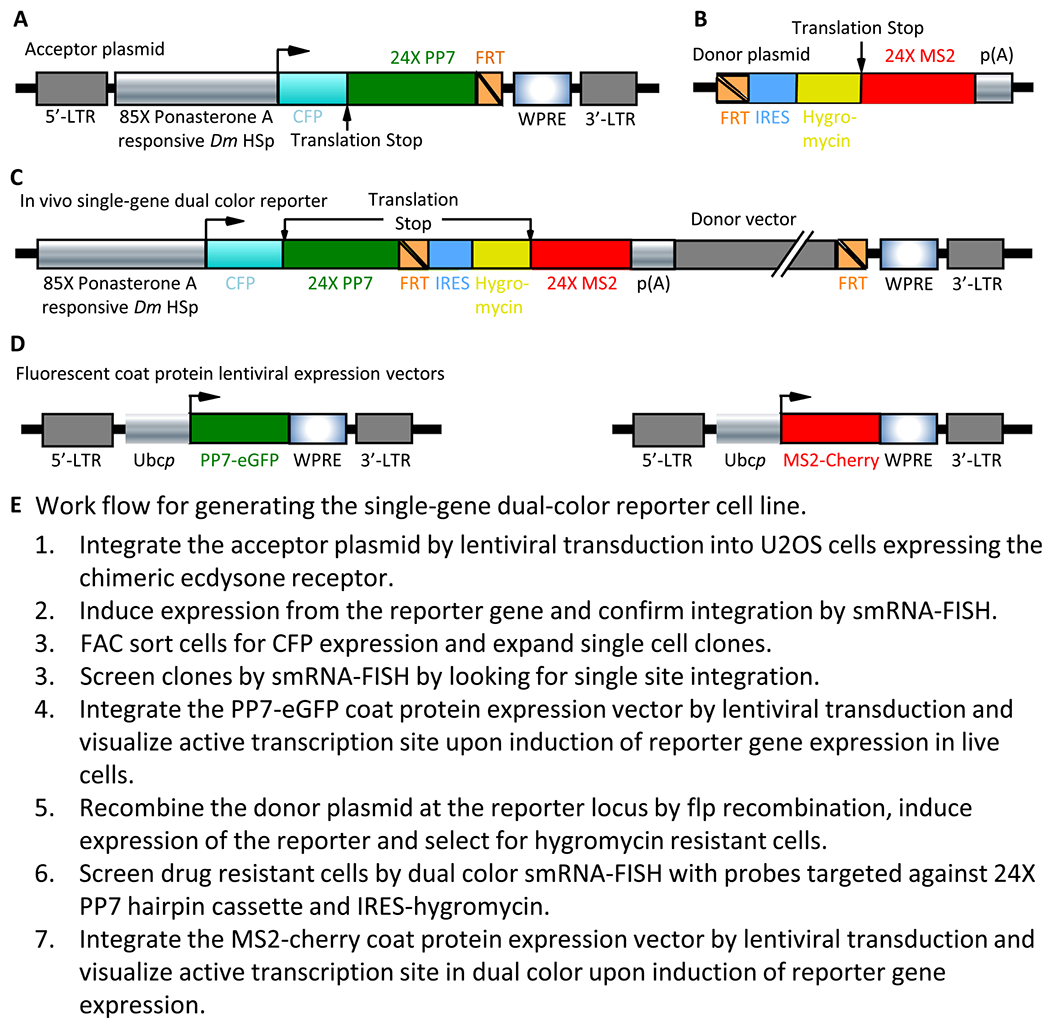
Construction of the single-gene dual color reporter cell line. A. Schematic representation of the acceptor lentiviral vector with the LTR’s, hormone responsive promoter, CFP coding region, PP7 hairpin cassette, FRT site and WPRE indicated. B. Schematic representation of the donor plasmid with the FRT site, IRES, Hygromycin resistance coding sequence, 24× MS2 hairpin cassette and p(A) signal indicated. C. Schematic representation of the single-gene dual color reporter after recombination. D. Schematic representation of the lentiviral expression vectors coding for the PP7-eGFP and MS2-mCherry coat proteins. E. Work flow for generating the single-gene dual-color reporter cell line.
2.1.2. Fluorescent coat protein expression vector
The cDNA coding for a single copy of PP7 viral coat protein that binds the PP7 RNA hairpins encoded in the reporter construct is fused to a single copy of eGFP (Fig. 1D). This construct serves as the first color. Similarly, a single copy of the cDNA coding for the second coat protein, MS2, is fused to a single copy of mCherry (Fig. 1D). Both the fluorescent coat proteins are under the control of the ubiquitin promoter and encoded in separate lentiviral expression vectors. The sequence of the coat proteins and the fluorescent protein are identical to the ones published by us previously [15], but differ only in the combination of coat protein to fluorescent protein fusion.
2.2. Construction of a single-gene dual-color stable U2OS reporter cell line
2.2.1. Lentiviral transduction of U2OS cells
Lentiviral acceptor plasmid along with the helper plasmids were transfected into 293T cells plated in a 10 cm dish. The packaged lentiviral particles were purified from the media (collected every 12 h between 24 and 48 h after transfection) using the Vira-bind Lentivirus purification kit. Cells were plated in 12-well plates the night before at ~10% confluency and cultured in DMEM with low glucose supplemented with 10% FBS. Two hours before infection, the cells were washed with serum free media and maintained at 37 °C and 5% CO2 in an incubator. The purified virus (0.5, 1.0, 5.0 or 10.0 μL virus) was reconstituted in serum free medium (200 μL/well of a 12 well plate) containing 1 μg/mL polybrene. The serum free medium was replaced with viral mix and the cells incubated at 37 °C for 2 h with intermittent shaking. After the 2 h incubation period, the viral mixture was replaced with complete medium and cells cultured until they reached full confluency. Upon confluency, the cells were trypsinized and plated on to a 10 cm dish. Upon reaching ~90% confluency, cells were trypsinized and frozen down for master stocks and aliquots plated for detection of reporter gene expression using single molecule RNA-FISH (smRNA-FISH) with two probes directed against the linker regions within the 24 repeats of the PP7 RNA hairpin cassette.
2.2.2. Single molecule RNA-FISH for detection of transcription from the hormone induced reporter
2.2.2.1. Single molecule RNA-FISH probes for detection of nascent transcripts.
To visualize expression of the reporter and the number of integration sites within a nucleus, we took advantage of the 24× PP7 hairpin cassette in the RNA and targeted Cy3 labeled RNA-FISH probes to detect synthesis of the RNA at the site of transcription. Since the 24× PP7 cassette is a sequence repeat, only two probes sets (5′-TTTCTAGGCAATTAGGTACCT and 5′-TTTCTAGAGTCGACCTGC) against the two linker regions repeated six times each within the 24 repeats of the PP7 RNA hairpin cassette were used for the detection of the PP7 cassette in the RNA. The commercially obtained probes (IDT Coralville, IA) were dissolved in RNAse free TE buffer to obtain a final probe stock concentration of 25 μM. Working dilution of 2.5 μM was made in TE buffer.
2.2.2.2. Hybridization buffer.
All reagents are prepared in RNAse free water.
2× SSC (v/v), dextran sulfate 10% (w/v) and deionized formamide 10% (v/v).
The buffer was aliquoted and stored at −20 °C. smRNA-FISH probes were added to a final concentration of 100 nM.
2.2.2.3. Wash buffer.
2× SSC (v/v) and deionized formamide 10% (v/v)
2.2.2.4. Single molecule RNA-FISH.
The U2OS cells transduced with the Ponasterone inducible reporter were plated on glass coverslips at ~30% confluency and grown in 12 well plates for 24 h. Transcription from the reporter was induced with PonA (40 μM) for another 12 h. Cells were washed in PBS and fixed in 4% paraformaldehyde (in PBS) for 15 min at RT. Cells were washed for 5 min each in PBS (two times) and then permeabilized in 70% ethanol at 4 °C overnight. The permeabilized samples were washed twice for 5 min each in PBS followed by once in wash buffer. The smRNA-FISH probes were hybridized in 10 cm tissue culture dishes layered with parafilm. 50 μL of the smRNA-FISH probes (100 nM in hybridization buffer) per coverslip was spotted on the parafilm. The coverslips were gently blotted on its edges with kimwipes to remove excess wash buffer and placed cells face down onto the aliquot of FISH probe. Care was taken to avoid trapping air bubbles in the probe. A tightly folded kimwipe soaked in distilled H2O was placed inside the tissue culture dish to provide humidity and the dish sealed with parafilm. Hybridization was done in a humidified incubator at 37 °C for 4 h. All subsequent manipulations were done with minimal exposure of the coverslips to light to reduce any photobleaching of the fluorophores. After the incubation period, the coverslips were washed twice for 30 min each in wash buffer pre-warmed to 37 °C followed by a wash in 2× SSC for 5 min at room temperature. The cover slips were rinsed in PBS for 5 min, briefly air dried to remove excess moisture and mounted on microscopic glass slides using a mounting media containing DAPI (Prolong Gold with DAPI, Invitrogen) and cured at least for 14 h at room temperature in the dark. The FISH slides were either imaged or stored at −20 °C. The slides were imaged on an epifluorescence Rapid Automated Modular Mounting (RAMM Scope, Applied Scientific Instruments, USA) base mounted with a Plan-Apochromat 40× (NA 1.4) objective (Zeiss, USA), illuminated with a Lumencor LED light source (Model Spectrax-6LCR-SA, Lumencor, USA) and the emitted fluorescence collected with a Hamamatsu ORCA-Flash4.0 CMOS camera (Hamamatsu, Japan). Z-stacks were acquired to cover the entire thickness of the cell. Maximum intensity projections of the Z-stacks were used to score for the number of transcription sites in the nucleus to determine the number of reporter gene insertions.
2.2.3. Fluorescence Activated Cell Sorting and single cell cloning of U2OS cells with single integration of the reporter gene
The U2OS cells integrated with the reporter gene were induced with 40 μM PonA for 48 h under normal growth conditions. After 48 h, cells were trypsinized, washed once in media, once in PBS and suspended in ice cold PBS. The cells were sorted for CFP expression, collected and were then single cell cloned. Thirty clonal lines were plated on microscopic cover glass each and grown in 12 well tissue culture plates, induced with PonA (40 μM) for 24 h and probed for PP7 RNA by smRNA-FISH as described above (Section 2.2.2.4). Clonal lines with a single transcription site as detected by smRNA-FISH were selected, outgrown and frozen down for stocks. Clone #21 was selected to introduce the second RNA hairpin cassette based on CFP expression levels and the presence of a single transcription site.
2.2.4. Introduction of the second RNA hairpin cassette at the single gene reporter locus
The donor plasmid coding for the resistance marker and the 24× MS2 RNA hairpin cassette was integrated at the reporter gene locus into clone #21 with a single integration of the PonA responsive reporter construct by recombination using the flp recombinase system (Invitrogen). The donor plasmid and the expression vector for the flp recombinase were transiently transfected into clone #21 cells carrying the single integration of the reporter gene. 48 h post transfection, cells were induced with Ponasterone A (40 ×M) and after 48 h of induction, cells were selected with 250 ×g/mL Hygromycin. Induction and selection continued for 14 days. At the end of the selection period, Hygromycin resistant cells were grown in media without selection and cells outgrown for making stocks. Correct recombination of the donor plasmid at the acceptor locus was confirmed by dual color smRNA-FISH using FISH probes against the PP7 RNA cassette in Cy3 and the IRES-Hygromycin cassette in Cy5 respectively as described in Section 2.2.2.4. RNA-FISH probes can be designed and procured against any sequence of interest provided it is long (>500 bp) and does not code for highly GC rich sequences, using proprietary software freely available from Biosearch Technologies (Petaluma, CA).
2.2.5. Identifying the genomic locus of the single-gene dual color reporter
The genomic locus of the dual color reporter gene was identified using splinkerette PCR [21]. Genomic DNA isolated from the reporter cell line was digested with the enzyme FatI and the restriction fragments were purified. A unique double stranded splinkerette adapter with FatI compatible ends was ligated to the restriction fragments and PCR amplified using a 3′-LTR specific and an adapter specific primer. The product of the expected size was gel purified and sequenced to determine the precise integration site of the reporter. The location was further confirmed by PCR amplifying the 5′-end of the construct across the junction and the sequence verified.
2.2.6. Introduction of the fluorescent coat proteins into U2OS cells with the dual color reporter
Lentiviral particles packaged with expression vector coding for PP7 coat protein fused to eGFP or MS2 coat protein fused to mCherry [15] were made by the Protein Expression Labs at SAIC, (Frederick, MD) using standard viral packaging methodologies. Briefly, lentiviral vectors and helper plasmids were transfected into 293T cells and virus particles purified from the cell supernatants using Vira-bind Lentiviral purification kit. The purified coat protein virus had a titer of ~3.5 × 10⁶/mL. The single-gene dual-color reporter cells were sequentially infected with the PP7-eGFP and MS2-mCherry packaged virus at an MOI of 1.0 as described in Section 2.2.1. After the introduction of both coat proteins, cells were FAC sorted for a combination of low GFP fluorescence to low, medium or high levels of mCherry fluorescence.
2.2.7. Live cell imaging of transcription from a single gene reporter
The dual color fluorescent reporter cells were plated on 3 cm Mat-Tek dishes with glass bottom at ~40% confluency and cultured overnight. The cells were then induced with PonA (40 μM) for 12 h in L15 media (supplemented with 10% FBS and no phenol red) at 37 °C in a humidified incubator without CO2. The cells were imaged on a Zeiss AxioObserver epifluorescence microscope with Plan-Apochromat 63× (NA 1.46) objective. The dish was held in a humidified heated stage incubator (Tokai Hit, Japan). The GFP and mCherry fluorophores were simultaneously excited using two separate lasers at 488 (100 mW) and 594 (50 mW) nm (Spectra Physics, USA) respectively. Power from the 488 and 594 nm lasers was set using an acousto-optic tunable filter (AA Opto Electronic, France). Typical illumination conditions are 0.1 mW of collimated laser light after the objective, resulting in an excitation light intensity in the object plane of 10 mW/mm2. The emitted green and red fluorescence was collected separately on two EMCCD cameras (Model Evolve, Photometrics Technology, USA). To measure fluorescence intensity of single molecules of RNA at the transcription site, cells were imaged every 10 s and a total of 512 frames were taken, each frame consisting of 13 z-slices, and each z-slice exposed for 200 ms. The images were processed in ImageJ for further analysis.
In order to potentially visualize single molecules of RNA in nucleoplasm or cytoplasm of cells, the cells were induced as above and imaged using a Zeiss LSM780 confocal microscope (Zeiss, USA) with the laser transmission set to 6% (488 nm) and 8% (594 nm) in the continuous wave mode, and the pinhole size set to 3. Cells were imaged every 2 s for 50 frames with an exposure time of 200 ms per frame.
2.3. Image processing and data analysis
All image processing was performed either using the freely available software ImageJ or custom tracking and correlation software written in IDL (Harris Geospatial Solutions, USA) and available at www.larsonlab.net. Live cell transcription site localization, transcription site tracking over time and cross-correlation analysis was performed using custom written codes in IDL and previously published from our laboratory [5,6,15,19]. Briefly, each individual z-stack was maximum intensity projected and a composite image of all the 512 frames created. The transcription site in each frame was localized and tracked over all 512 frames to generate a fluorescence intensity time trace for each color channel. A region in the nucleus similar in size to the transcription site that did not have any discernable spot was tracked in all 512 frames, and served as background and also to compute photobleaching correction curves over the time course of the experiment. Photobleaching was typically less than 10% over the course of the measurement. Fluorescence intensity time traces (corrected for photobleaching) from each individual experiment was subjected to cross correlation and then averaged. Twenty-four individual time traces were used to generate the final cross correlation analysis.
3. Results and discussion
3.1. Ponasterone A responsive single-gene reporter in vivo
The system described above allows one to directly visualize transcription kinetics of a gene that is completely under exogenous control. Ponasterone A is a unique insect ecdysteroid hormone, and the ecdysone receptor is not expressed in human cells. We took advantage of this property and used a human osteosarcoma cell line (U2OS) that constitutively expresses the ecdysone receptor [6] and introduced a reporter construct under the control of an ecdysone-responsive promoter using lentiviral transduction to achieve single copy integration [20]. The reporter construct (Fig. 1A) has three important features: 1, A fluorescent protein product (CFP) coding sequence used as a marker for expression. 2, A DNA cassette in the 3′-UTR of the reporter that codes for 24× PP7 RNA hairpins to visualize transcription from this reporter in real time; and 3, A flp recombinase recognition site (FRT, Fig. 1A) downstream of the RNA hairpin cassette to recombine a second RNA hairpin cassette.
Upon induction with PonA, the synthesized RNA codes for the 24× PP7 RNA hairpins in the 3′-UTR of the reporter and transcription from this reporter was visualized in vivo by transient expression of the PP7 coat protein fused to GFP (Figs. 1A & 2A). The protein product CFP, that has a peroxisome targeting sequence at its c-terminus, is targeted to peroxisomes and can be visualized as fluorescent peroxisome globules in the cytoplasm (Fig. 2A). Sorting for CFP expression enriched for transcriptionally active cells. The sorted cells were single cell cloned and then used to recombine the second 24× MS2 RNA hairpin cassette.
Fig. 2.
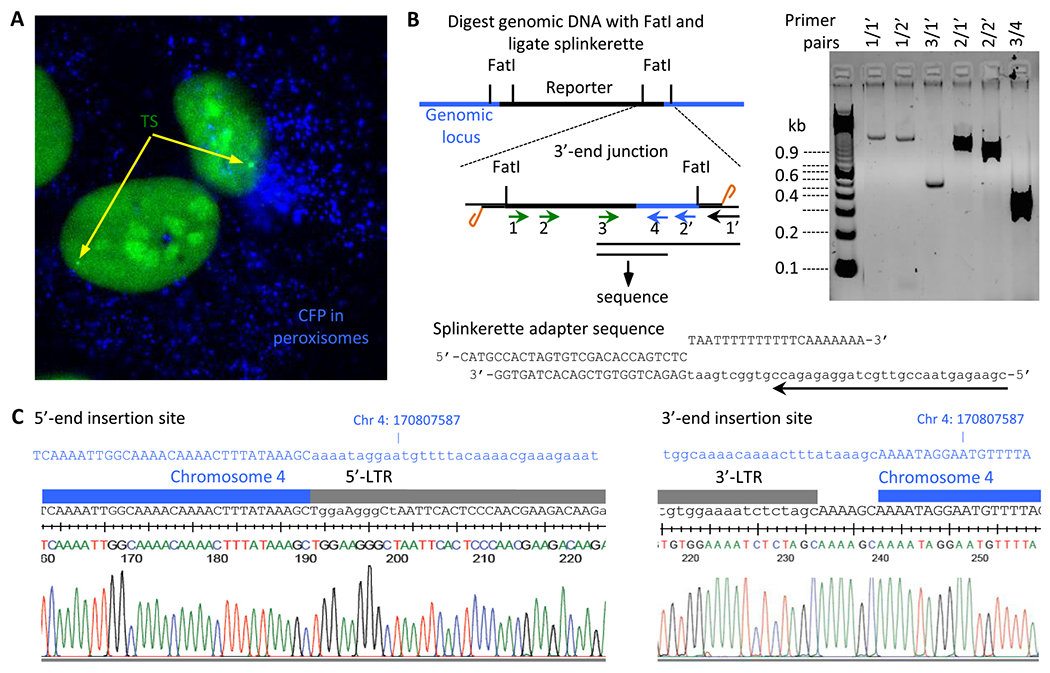
Expression from the single-gene reporter and identification of its genomic locus. A. Epifluorescence image of U2OS cells with a single integrated reporter showing a diffraction limited transcription site (TS) upon transient transfection of the PP7-eGFP coat protein expression vector and induction with PonA (40 μM) for 48 h. CFP localized in peroxisomes is shown in blue. B. Schematic representation of the splinkerette PCR to determine the site of insertion in the genome and the PCR products from the corresponding PCR primer pairs. The sequence of the splinkerette adapter is shown with the splinkerette PCR primer indicated by the arrow. C. Sequence analysis of the splinkerette PCR product (PCR primer pairs 3/4) and alignment of the sequence to the genomic sequence on chromosome 14 with the site of insertion showing the junctions of the 5′- and 3′-LTR’s.
Although gene arrays consisting of several copies of a reporter construct have been established to study transcription in vivo [11,12], it is unclear how many copies in an array are active at any given time and how expression from the array is reflective of gene expression from a single gene. To circumvent these shortcomings, we chose to develop a single gene reporter system by controlling the number of virus copies in the transduction reaction to attain single copy insertion per cell. Moreover, this system is designed and developed to be able to introduce sequences of interest that alter the kinetics of RNA synthesis from a single locus. By incorporating an FRT site within the transcribed region of the reporter we established a single copy reporter cell line that is modular and can be used to introduce sequences of interest at the very same locus with a constant genetic background, thus normalizing for any potential effects of the chromatin context on transcription from the reporter.
3.2. Genomic location of the reporter
The genomic insertion site of the reporter construct was determined by splinkerette PCR followed by sequencing PCR products from the nested primers at the 3′-end of the construct (Fig. 2B). The ability to design functional primers at the 3′-end of the construct helped identify the locus. Once the 3′-end junction was identified, primers were designed flanking the genomic locus and verified the 5′-end junction using primers unique to the inserted construct and the genomic locus. We have determined the insertion site of the reporter construct to a genomic locus on chromosome 4 at position 170807587 (Fig. 2C). Sequencing results showed the signature insertion of a 5 bp sequence at the 3′-end, characteristic of lentiviral transductions. The nearest annotated gene on either side of the insertion site at this locus is ~30 kb away. Knowing the precise genomic insertion site of the reporter now opens the possibility of understanding any potential contributions the surrounding chromatin might have on transcription from this reporter. We isolated a collection of clones with the reporter inserted at different locations in the genome, which allows one to assess the generality of conclusions obtained in single clones.
3.3. Recombining the second RNA hairpin cassette
We recombined the 24 x MS2 RNA hairpin cassette at the FRT site by co-transfecting the donor vector and the expression vector for flp recombinase. The donor construct (Fig. 1B) was designed such that the resistance marker will be expressed only if integrated at the correct locus and upon induction of transcription from the PonA responsive promoter. The resulting reporter would have two RNA hairpin cassettes flanking the IRES-Hygromycin cassette and would be a single transcript with the IRES driving translation of the resistance marker (Fig. 1C). We traded efficiency for specificity and were successful in obtaining positive recombination events that resulted in hygromycin resistant cells. Although the hygromycin resistant cells were only a small fraction (<1%) of the total number of cells transfected, all the drug resistant cells were positive for correct integration as determined by smRNA-FISH using probes against the 24× PP7 cassette in Cy3 and against IRES-Hygromycin cassette in Cy5.
Upon induction of transcription with PonA, we detected robust expression of the reporter by smRNA-FISH as a single discrete diffraction limited bright spot in both Cy3 and Cy5 channels (Figs. 1C and 3A & B) at the site of transcription in the nucleus, consistent with our earlier observation of a single transcription site in cells (Fig. 2A). Moreover, the transcription site observed in each individual color co-localized within the diffraction limited spot indicating that the PP7 and IRES-Hygromycin cassettes were being detected at the same locus and consistent with correct recombination of the donor at the FRT site. We also observed many smaller Cy3 and Cy5 spots in the nucleoplasm and cytoplasm that co-localized in both colors suggesting that they were associated with the same transcript and were single molecules of RNA (Fig. 3B). The presence of the full length transcript with the two hairpin cassettes was also confirmed by northern blot analysis (Fig. 3C). The vast majority of the transcripts from the reporter was longer than the expected length of 2.5 kb in the cell line before recombination (Fig. 3C, lane 1). It is likely that the longer transcript was the result of read through resulting in termination further downstream than expected. However, upon recombination with the second hairpin cassette we observed the vast majority of the transcripts to be of the correct size of 5.6 kb (compare lanes 1 & 2), presumably, the termination defect was somehow rectified. Thus, we have established a reporter with two distinct RNA hairpin cassettes within the same transcript from a single gene reporter to measure transcription in vivo.
Fig. 3.
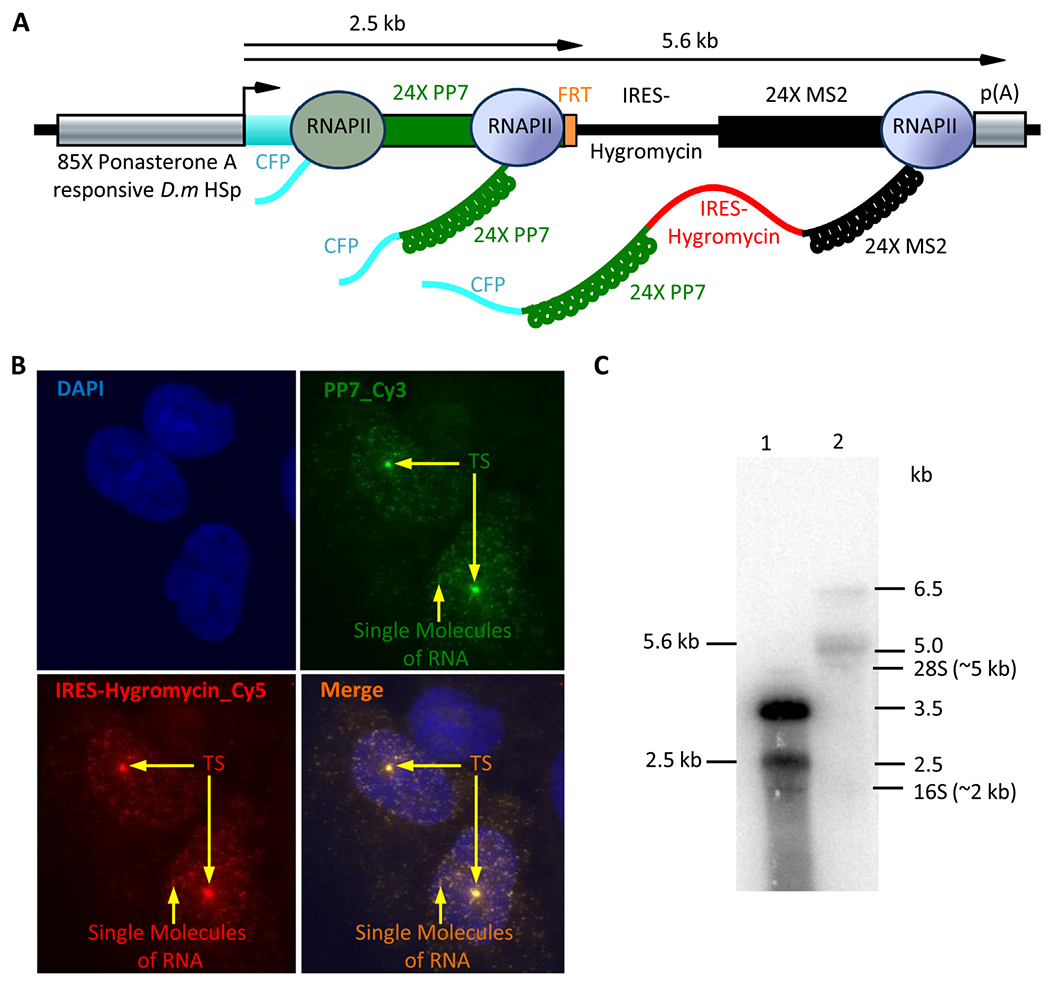
smRNA-FISH detects the single integration, correct recombination and co-localization of the PP7 RNA hairpin cassette with IRES-Hygromycin cassette at the site of transcription and on single molecules of RNA. A. Schematic representation of RNA synthesis from the dual color reporter in vivo. B. The U2OS cells that carry the dual color reporter were fixed in 4% PFA and probed for expression of the dual hairpin cassette by smRNA-FISH. The two 20 mer repetitive FISH probes against PP7 were labeled with Cy3 (green) and a set of 48 twenty mer probes against IRES-Hygromycin were labeled with Cy5 (red). The nucleus is stained with DAPI (blue). The single transcription site (TS) in each nucleus and single molecules of RNA are indicated with arrows. C. Northern blot analysis of total RNA isolated from U2OS carrying the acceptor reporter (Lane 1) or the recombined dual-color reporter (Lane 2). The position of the DNA markers, 28S and 16S RNA are indicated on the right.
3.4. Transcription in vivo from a single gene reporter in real time
Since our goal was to be able to visualize transcription and production of RNA in real time in live cells, we sequentially introduced the PP7-eGFP and MS2-mCherry coat protein expression vectors (Fig. 1D) into the dual color reporter cell line via lentiviral transduction. The fluorescent coat proteins are expressed constitutively, and after stable integration of the vectors, cells were arbitrarily sorted for low levels of PP7-eGFP in combination with low, medium and high levels of MS2-mCherry. We empirically determined the optimal levels of expression of coat proteins that gave the best signal to noise ratio under our imaging conditions by imaging transcription sites in the sorted cells at various laser power. Based on this criterion, cells sorted for the combination of low PP7-eGFP and a medium MS2-mCherry expression levels gave the best results and was chosen as the stock single-gene dual-color reporter cell line.
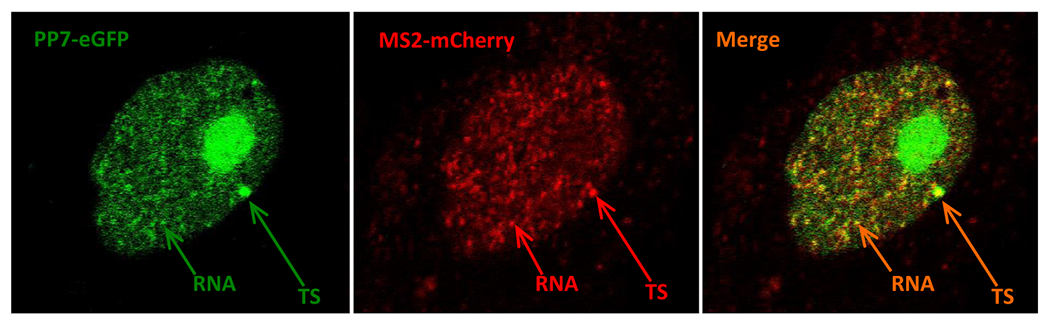
Transcription from the single-gene dual-color reporter cell line was imaged using a custom-built single-molecule epifluorescence microscope. Cells were imaged after 12 h of induction with PonA (40 μM). Since PP7 coat protein has a propensity to localize in nucleoli, cells with bright nucleoli were not imaged to avoid potential problems during subsequent analysis. In order to record transcriptional activity over an extended period of time, cells were imaged every 10 s for 512 frames and each frame consisted of 13 z-planes at 0.5 εm thickness to cover the entire nucleus and collected all the emitted fluorescence from the site of transcription. As the polymerase transcribes the reporter gene and the twenty four RNA hairpin structures are synthesized, up to 48 fluorescent coat protein molecules bind as homodimers to 24 RNA hairpins [16–18] to create a fluctuating diffraction limited fluorescent spot in the nucleus that is distinct from the surrounding background (Fig. 4A & B). By tagging the RNA orthogonally with two colors, and co-localization of the two colors within the diffraction limited spot validates the synthesis of RNA as the site of transcription (Fig. 4B). 3-D imaging of the transcription site over time reveals the fluctuations in fluorescence intensity in two colors within the diffraction limited spot (Fig. 4C and Movie 1), from which the rate of initiation of transcription, rate of transcript elongation and transcription termination times can be extracted.
Fig. 4.
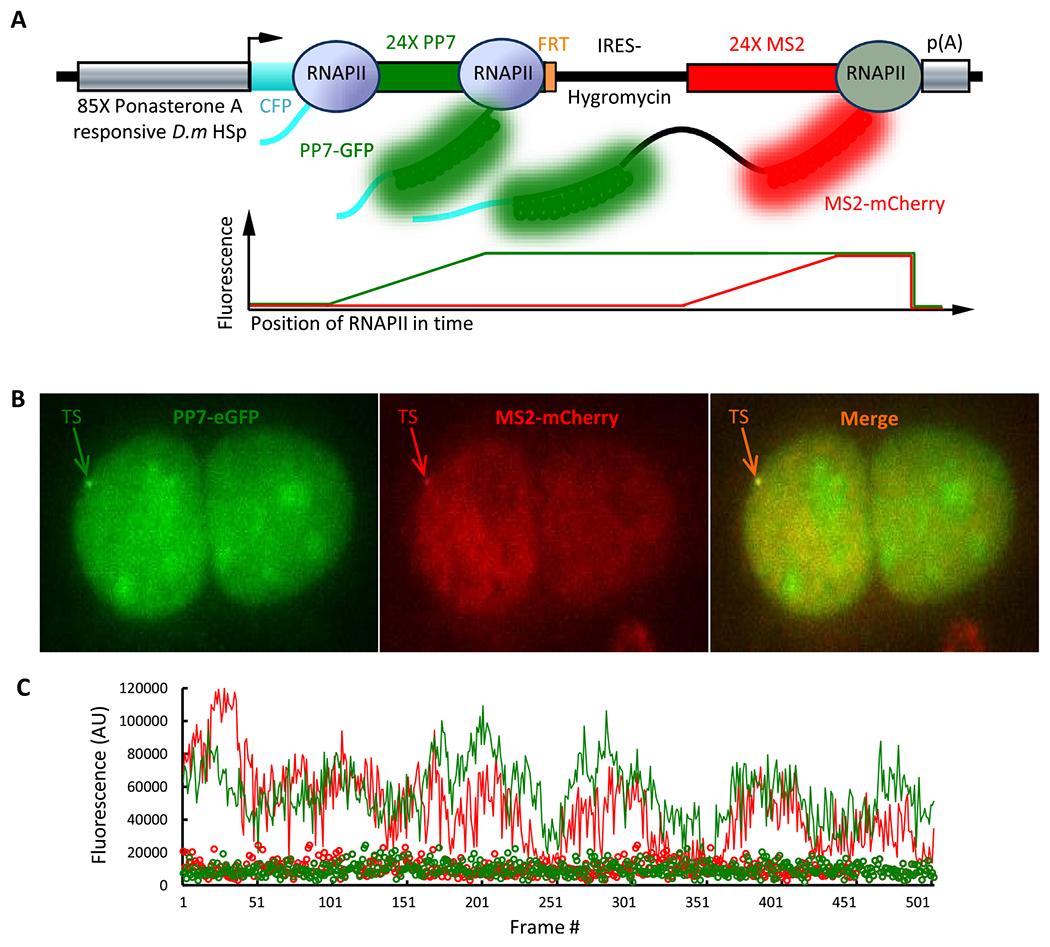
Transcription from the single-gene dual-color reporter in live U2OS cells. A. Schematic representation of transcription from the single-gene dual-color reporter in vvio. B. Max intensity projection of epifluorescence image of PP7-eGFP in green, MS2-mCherry in red and the merge of the two showing co-localization of the diffraction limited transcription site in two colors. C. Fluorescence intensity fluctuations time trace of the transcription site in green and red channels tracked over time (512 frames). The green and red circles represent the background fluorescence intensity of an identical sized area in the nucleus over the same time course.
3.5. Cross correlation analysis provides a measure of transcription elongation
Fluorescence Correlation Spectroscopy has been used to extract elongation rates from fluorescence intensity traces [5,6,15,17,19,22,23]. The plateau segment of the cross-correlation curve is indicative of forward cross-correlation between the green and red signal. The offset from time zero along the x-axis before the plateau of the cross correlation curve begins to decay is representative of the elongation time between the two hairpin cassettes (Fig. 5A & B). Given a distance of 3 kb between the hairpin cassettes and an elongation time of ~30 s, we estimate the elongation rate of the polymerase to be ~6 kb/min(Fig. 5A& B). Although the reporter gene is ~6 kb long and should take only a minute to transcribe, the total dwell time is ~500 s suggesting that the termination time dominates the total time taken to complete a single round of RNA synthesis. The elongation rate measured by this method is greater than those measured in vivo (2–4 kb/min) using ensemble methods (1–4). One explanation for this difference could be the in vivo measurements are on endogenous genes and an average measurement over several kilobases of varied sequence content in contrast to our measurements over a unique sequence. However, the system we have developed will be able to provide a relative measure of the effects of cis- and trans-acting factors on the elongation properties of RNA polymerase II.
Fig. 5.
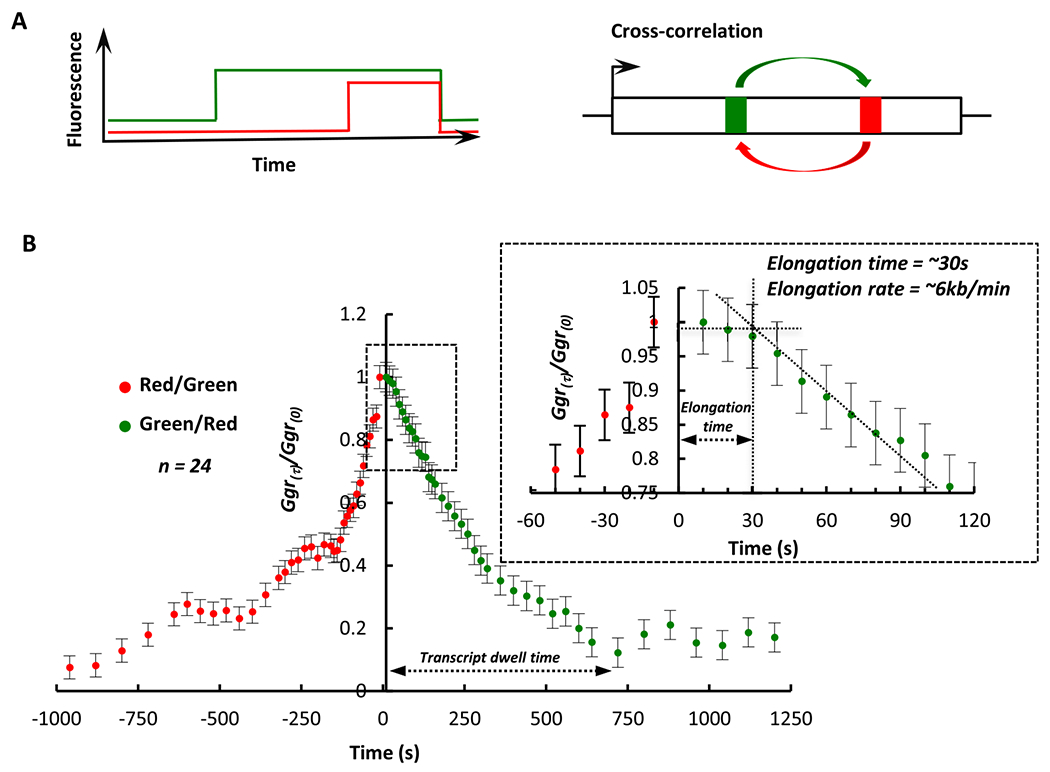
Cross-correlation analysis of fluorescence fluctuations provides a measure of transcript elongation. A. Schematic representation of fluorescence intensity over time at the transcription site and cross-correlation analysis. B. Cross-correlation function of PP7-eGFP vs MS2-mCherry (green) and MS2-mCherry vs PP7-eGFP (red) plotted as a function of time. The area marked by the box in dotted line is enlarged to show the plateau of the cross-correlation function for PP7 vs MS2. The elongation time and transcript dwell time are indicated on the plots.
3.6. Visualizing single molecules of RNA in live cells
Although transcription site imaging in live cells over extended periods of time (h) is readily accomplished using an epifluorescence microscope, other methods are preferable to visualize single molecules of the labeled RNA either in the nucleoplasm or cytoplasm. In order to visualize mature mRNA in live cells, we imaged cells at very high laser power using a confocal microscope. However, this imaging protocol resulted in rapid photobleaching and we were able to image the cells in a single z-plane for very short intervals of time. A representative image of the dual color reporter cell line imaged with a confocal microscope visualizing single molecules of RNA is presented in Fig. 6 and Movie 2. Similar to co-localization of the two colors at the site of transcription in Fig. 4 and Movie 1, we did observe co-localization of the two colors at the transcription site (compare Figs. 4 & 6), and also at the level of single molecules of RNA in the nucleoplasm (Figs. 3 & 6). This step is an important confirmation of the correct insertion, synthesis, and processing of the reporter. Although we were able to visualize transcripts in the cytosol in fixed cells (Fig. 3), we were able to visualize only very few transcripts in the cytoplasm in live cells (compare Figs. 3 & 6). This discrepancy may be due to the rapid motion of the free RNA in living cells and the RNA moving in and out of the focal plane, a problem non existent in fixed cells where single molecules of RNA can be readily visualized by smRNA-FISH (Fig. 3B). More rapid acquisition methods under higher laser power conditions might be necessary to image RNA for longer periods of time in vivo with limited photobleaching or damage. These data highlight the need to further develop existing imaging technology to image single molecules of RNA in live cells for extended periods of time to measure and understand the dynamic nature and behavior of RNA in vivo.
Fig. 6.
Dual color confocal image of transcription in live cells showing transcription site and single molecules of RNA. A single plane confocal image of the dual color reporter cell line showing transcription site (TS) and single molecules of RNA in the nucleoplasm.
4. Conclusions
We have developed a hormone inducible single-gene dual color reporter system to study RNA synthesis and its dynamic existence in vivo. The system takes advantage of the ability of fluorescently labeled viral coat proteins to specifically bind its target RNA hairpins. By incorporating these RNA hairpins into a reporter gene we are able to visualize the synthesis of the RNA in real time in living cells. There are two significant features to the system we have developed for expression and analysis of RNA in vivo. First, the inducible system we have established depends on an insect hormone-receptor interaction that is otherwise not present in mammalian cells. This orthogonality is highly desirable since mammalian cells do not have the hormone; in the absence of the inducer there is no transcription from the reporter. Second, in contrast to the commercially available flp-in cell lines to integrate and express a gene of interest from a unique locus, our system is designed to integrate and study cis- or trans acting sequence elements that alter transcript elongation using dual color fluorescent measurements in real time.
This system now provides a tool to label single molecules of RNA and study its dynamics as it is being synthesized, and post-transcriptionally within the nucleoplasm or cytosol. By introducing sequences that form functional RNA secondary structures between the two hairpin cassettes, one is able to directly analyze the effect of RNA secondary structures on transcription elongation rates, the dynamics of RNA protein interactions and how these interactions might alter RNA structure formation and or transcript elongation. This integrated approach also opens up possibilities to study the mechanisms that lead to and control of transcript initiation, elongation and termination by RNA polymerase II in vivo from a single genomic locus in real time.
Our conservative estimates suggest that this system would allow us to measure an elongation time of at least 40–60 s and a pause duration or change in elongation time of at least 30 s. At an elongation time of 60 s, a change in elongation time of 30 s will constitute a 50% change. However, at a longer elongation times of 2–3 min, a change in elongation time of 30 s will constitute only a 25% change. However, the sensitivity of the measurement can be tuned by changing the distance between the cassettes, thus enabling one to detect even subtle changes in elongation time induced by the effects of trans-acting protein factors or cis-acting nucleic acids on transcript elongation by human RNA polymerase II in vivo. Although these are conservative estimates, with faster acquisition times of five seconds or less we might be able to measure pauses with even shorter lifetime of up to 10–20 s. In the future, the single-gene dual color reporter system will allow us to integrate and systematically study cis-acting sequences or trans-acting proteins of interest that alter transcript elongation by human RNA polymerase II.
Supplementary Material
Acknowledgements
This research was supported by the Intramural Research Program of the NIH, National Cancer Institute, Center for Cancer Research. We would like to thank Kathy McKinnon from the FACS core for help with cell sorting.
Footnotes
Appendix A.: Supplementary data
Supplementary data associated with this article can be found, in the online version, at http://dx.doi.org/10.1016/j.ymeth.2016.04.009.
References
- [1].Singh J, Padgett RA, Rates of in situ transcription and splicing in large human genes, Nat. Struct. Mol. Biol 16 (2009) 1128–1133. [DOI] [PMC free article] [PubMed] [Google Scholar]
- [2].Core LJ, Waterfall JJ, Lis JT, Nascent RNA sequencing reveals widespread pausing and divergent initiation at human promoters, Science 322 (2008) 1845–1848. [DOI] [PMC free article] [PubMed] [Google Scholar]
- [3].Nechaev S, Fargo DC, dos Santos G, Liu L, Gao Y, Adelman K, Global analysis of short RNAs reveals widespread promoter-proximal stalling and arrest of Pol II in Drosophila, Science 15 (2010) 335–338. [DOI] [PMC free article] [PubMed] [Google Scholar]
- [4].Danko CG, Hah N, Luo X, Martins AL, Core L, Lis JT, Siepel A, Kraus WL, Signaling pathways differentially affect RNA polymerase II initiation, pausing and elongation rate in cells, Mol. Cell 25 (2013) 212–222. [DOI] [PMC free article] [PubMed] [Google Scholar]
- [5].Larson DR, Zenkulson D, Wu B, Chao JA, Singer RH, Real-time observation of transcription initiation and elongation on an endogenous yeast gene, Science 332 (2011) 475–478. [DOI] [PMC free article] [PubMed] [Google Scholar]
- [6].Larson DR, Fritzsch C, Sun L, Meng X, Lawrence DS, Singer RH, Direct observation of frequency modulation in single cells using light activation, eLife 2 (2013) e00750. [DOI] [PMC free article] [PubMed] [Google Scholar]
- [7].Zhang J, Landick R, A two-way street: regulatory interplay between RNA polymerase and nascent RNA structure, Trends Biochem. Sci 15 (2016) 259–265. [DOI] [PMC free article] [PubMed] [Google Scholar]
- [8].Feng S, Holland EC, HIV-1 tat trans-activation requires the loop sequence within TAR, Nature 334 (1988) 165–167. [DOI] [PubMed] [Google Scholar]
- [9].Melamed Z, Levy A, Ashwal-Fluss R, Lev-Maor G, Mekahel K, Atias N, Gilad S, Sharan R, Levy C, Kadener S, Ast G, Alternative splicing regulates biogenesis of miRNAs located across exon-intronjunctions, Mol. Cell 50 (2013) 869–881. [DOI] [PubMed] [Google Scholar]
- [10].Xie M, Li M, Vilborg A, Lee N, Shu M-D, Yartseva V, Sestan N, Steitz JA, Mammalian 50-capped microRNA precursors that generate a single micro RNA, Cell 155 (2013) 1568–1580. [DOI] [PMC free article] [PubMed] [Google Scholar]
- [11].Janicki SM, Tsukamoto T, Salghetti SE, Tansey WP, Sachidanandam R, Prasanth KV, Reid T, Shav-Tal Y, Bertrans E, Singer RH, Spector DL, From silencing to gene expression: real-time analysis in single cells, Cell 116 (2004) 683–698. [DOI] [PMC free article] [PubMed] [Google Scholar]
- [12].Darzacq X, Shav-Tal T, de Turris V, Brody Y, Shenoy SM, Phair RD, Singer RH, In vivo dynamics of RNA polymerase II transcription, Nat. Struct. Mol. Biol 14 (2007) 796–806. [DOI] [PMC free article] [PubMed] [Google Scholar]
- [13].Bertrand E, Chartrand P, Schaefer M, Shenoy SM, Singer RH, Long RM, Localization of ASH1 mRNA particles in living yeast, Mol. Cell 2 (1998) 437–445. [DOI] [PubMed] [Google Scholar]
- [14].Cha JA, Patskovsky Y, Almo SC, Singer RH, Structural basis for the coevolution of a viral RNA-protein complex, Nat. Struct. Mol. Biol 15 (2008) 103–105. [DOI] [PMC free article] [PubMed] [Google Scholar]
- [15].Coulon A, Ferguson ML, de Turrris V, Palangat M, Chow C, Larson D, Kinetic competition during the transcription cycle results in stochastic RNA processing, eLife 3 (2014) e03939. [DOI] [PMC free article] [PubMed] [Google Scholar]
- [16].Hocine S, Raymond P, Zenklusen D, Chao JA, Singer RH, Single-molecule analysis of gene expression using two-color RNA labeling in live yeast, Nat. Methods 10 (2013) 119–121. [DOI] [PMC free article] [PubMed] [Google Scholar]
- [17].Martin RM, Rino J, Carvalho C, Kirchhausen T, Carmo-Fonseca M, Live-cell visualization of pre-mRNA splicing with single-molecule sensitivity, Cell Rep. 4 (2013) 1144–1155. [DOI] [PMC free article] [PubMed] [Google Scholar]
- [18].Buenrostro JD, Araya CL, Chircus LM, Layton CJ, Chang HY, Snyder MP, Greenleaf WJ, Quantitative analysis of RNA-protein interactions on a massively parallel array reveals biophysical and evolutionary landscapes, Nat. Biotechnol 32 (2014) 562–568. [DOI] [PMC free article] [PubMed] [Google Scholar]
- [19].Ferguson ML, Larson D, Measuring transcription dynamics in living cells using fluctuation analysis, in: Shav-Tal Y (Ed.), Imaging Gene Expression, Humana Press, 2013, pp. 47–60. [DOI] [PMC free article] [PubMed] [Google Scholar]
- [20].No D, Yao T-P, Evans RM, Ecdysone-inducible gene expression in mammalian cells and transgenic mice, Proc. Natl. Acad. Sci. USA 93 (1996) 3346–3351. [DOI] [PMC free article] [PubMed] [Google Scholar]
- [21].Uren AG, Mikkers H, Kool J, van der Weyden L, Lund AH, Wilson CH, Rance R, Jonkers J, van Lohuizen M, Berns A, Adams DJ, A high-throughput splinkerette-PCR method for the isolation and sequencing of retroviral insertion sites, Nat. Protoc 4 (2009) 789–798. [DOI] [PMC free article] [PubMed] [Google Scholar]
- [22].Lenstra TL, Coulon A, Chow CR, Larson DR, Single-molecule imaging reveals a switch between spurious and functional ncRNA transcription, Mol. Cell 60 (2015) 597–610. [DOI] [PMC free article] [PubMed] [Google Scholar]
- [23].Day CR, Chen H, Coulon A, Meier JL, Larson DR, High-throughput single-molecule screen for small-molecule perturbation of splicing and transcription kinetics, Methods 96 (2016) 59–68. [DOI] [PMC free article] [PubMed] [Google Scholar]
Associated Data
This section collects any data citations, data availability statements, or supplementary materials included in this article.