

Abstract
Two mononuclear iron(II)–thiolate complexes have been prepared that represent structural models of the nonheme iron enzymes EgtB and OvoA, which catalyze the O2-dependent formation of carbon-sulfur bonds in the biosynthesis of thiohistidine compounds. The series of Fe(II) complexes reported here feature tripodal N4 chelates (LA and LB) that contain both pyridyl and imidazolyl donors (LA = (1H-imidazol-4-yl)-N,N-bis((pyridin-2-yl)methyl)methanamine; LB = N,N-bis((1-methylimidazol-2-yl)methyl)-2-pyridylmethylamine). Further coordination with monodentate aromatic or aliphatic thiolate ligands yielded the five-coordinate, high-spin Fe(II) complexes [FeII(LA)(SMes)]BPh4 (1) and [FeII(LB)(SCy)]BPh4 (2), where SMes = 2,4,6-trimethylthiophenolate and SCy = cyclohexanethiolate. X-ray crystal structures revealed that 1 and 2 possess trigonal bipyramidal geometries formed by the N4S ligand set. In each case, the thiolate ligand is positioned cis to an imidazole donor, replicating the arrangement of Cys- and His-based substrates in the active site of EgtB. The geometric and electronic structures of 1 and 2 were analyzed with UV-vis absorption and Mössbauer spectroscopies in tandem with density functional theory (DFT) calculations. Exposure of 1 and 2 to nitric oxide (NO) yielded six-coordinate FeNO adducts that were characterized with infrared and electron paramagnetic resonance (EPR) spectroscopies, confirming that these complexes are capable of binding diatomic molecules. Reaction of 1 and 2 with O2 causes oxidation of the thiolate ligands to disulfide products. The implications of these results for the development of functional models of EgtB and OvoA are discussed.
Graphical Abstract
Two nonheme iron-thiolate complexes that mimic that active-site structures of sulfoxide synthases have been prepared and characterized using crystallographic, spectroscopic, and computational methods.

Introduction
Several mononuclear nonheme iron (MNHI) enzymes involved in O2 activation employ L-cysteine (Cys) or its derivatives as substrates.1–3 The best-studied example is cysteine dioxygenase (CDO), which initiates Cys catabolism by catalyzing its oxidation to L-cysteine sulfinic acid (Scheme 1)4–6 Other members of the thiol dioxygenase family include cysteamine dioxygenase (ADO)7–8 and 3-mercaptopropionate dioxygenase (MDO).9–11 In addition to S-dioxygenation, certain bacterial MNHI enzymes catalyze the O2-dependent formation of S-C bonds in the biosyntheses of thiohistidine compounds.12–15 These enzymes are referred to as sulfoxide (SO) synthases because the reaction combines S-C bond formation with monooxygenation of the S-atom, thereby utilizing all four oxidizing equivalents of O2. Two sulfoxide synthases have been reported to date, EgtB and OvoA, which catalyze the key steps in the production of ergothioneine (Egt) and ovothiol A, respectively, from Cys and His building blocks (Scheme 1).16–21 The EgtB reaction results in formation of a S-C bond at the 2-position of the imidazole ring, whereas the OvoA reaction occurs at the 4-position of the ring. The precise functions of Egt and ovothiol A within organisms are not fully understood, but several reports have emphasized their antioxidant properties.15, 22–25
Scheme 1.
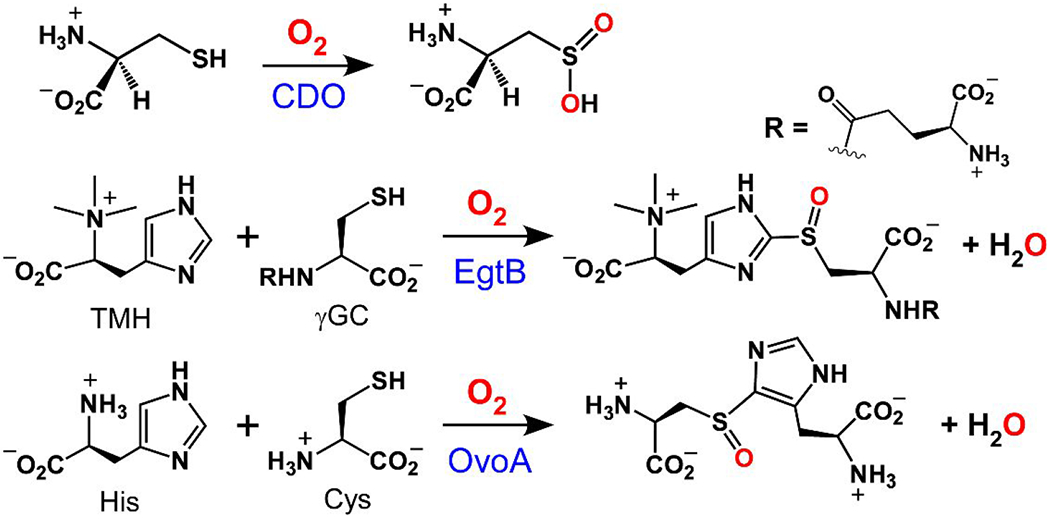
Crystallographic studies have revealed close similarities between the active-site structures of EgtB and CDO. In both cases, the mononuclear iron(II) center is facially ligated by three His residues (the 3His triad), resulting in three cis-labile sites for simultaneous binding of substrate(s) and O2.26–29 The structure of Mn-substituted EgtB suggests that the γ-glutamyl cysteine (γGC) and N-α-trimethyl histidine (TMH) substrates coordinate directly to iron (Fig. 1), and do not occupy outer-sphere binding sites as originally supposed.27 Seebeck and coworkers have explored the importance of a second-sphere tyrosine residue (Tyr377) in the catalytic function of EgtB from Mycobacterium thermoresistibile. Substitution of Tyr377 by Phe converts EgtB into a thiol dioxygenase that favors dioxygenation of γGC instead of S-C bond formation.30 Interestingly, the dioxygenase activity of Y377F EgtB still requires TMH, indicating that the same quaternary EgtB:Fe:γGC:TMH complex is formed in both pathways. Mutation of the analogous Tyr residue in OvoA (Tyr417) has also been shown to alter the product ratio in favor of cysteine sulfinic acid.31
Figure 1.
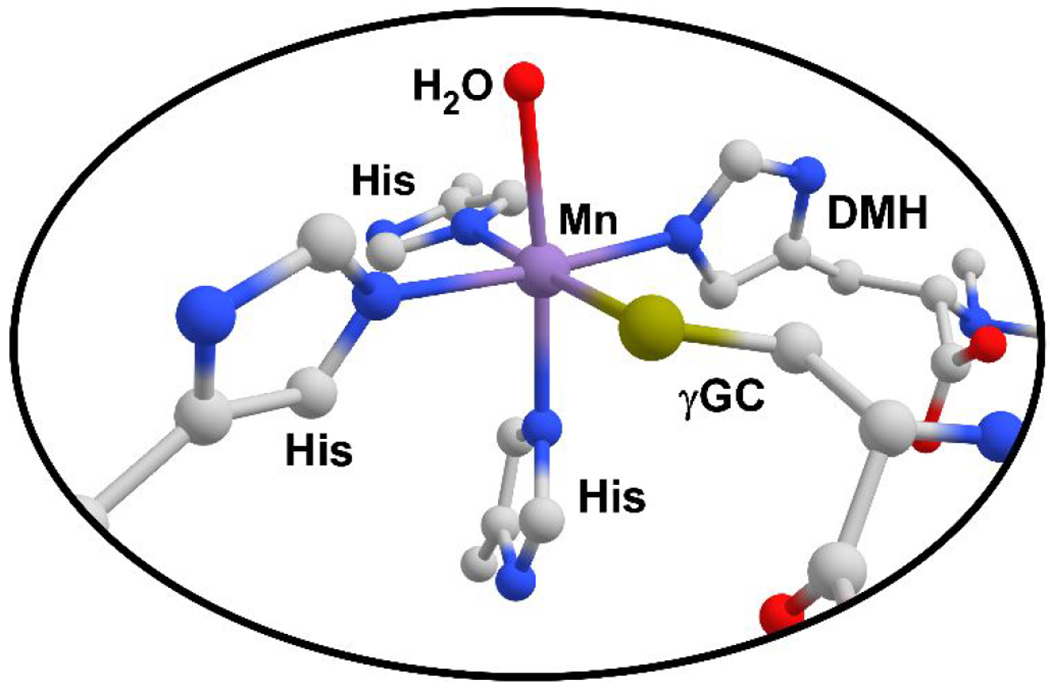
Metal coordination environment in the active site of Mn-substituted EgtB, as revealed by X-ray crystallography (PDB: 4X8D).27 The Mn(II) center is coordinated by the 3His triad, N,N-dimethyl histidine (DMH), γGC, and solvent-derived H2O. Dioxygen is presumed to bind to the site occupied by H2O.
The catalytic cycles of SO synthases remain poorly defined.15 An ordered mechanism is presumed in which the His- and Cys-based substrates coordinate to the Fe(II) center prior to O2 activation. In one proposed mechanism, H-atom transfer from an outer-sphere Tyr residue facilitates formation of an iron(III)-hydroperoxo species, which carries out sulfoxidation of the substrate after formation of the S-C bond.32 This mechanism is supported by QM/MM calculations recently published by de Visser and coworkers.33 In contrast, the computational studies of Liao34 and Liu35 favor an alternative mechanism in which sulfoxidation occurs prior to S-C bond formation. Unfortunately, to date, it has not been possible to observe intermediates derived from reaction of the enzymes with O2, which would allow one to discriminate between these mechanistic alternatives. It is also unclear how EgtB and OvoA direct the S-C bond formation towards the 2- and 4-positions, respectively, of the imidazole ring (Scheme 1).
The development of synthetic SO synthase models has the potential to elucidate key aspects of both enzymatic structure and mechanism. While numerous CDO models have been reported by us and others,36–44 to the best of our knowledge iron-thiolate complexes designed to mimic the structure of substrate-bound SO synthases are currently lacking in the literature. In this manuscript, we report the generation of two high-spin Fe(II) complexes that serve as structural models of the EgtB and OvoA active sites prior to O2 binding. As shown in Scheme 2, these complexes feature tetradentate N4 ligands (LA and LB) consisting of one or two pendant imidazole donors. The point of attachment for the imidazole donor is different in the LA and LB ligands in an effort to control the regioselectivity of the C-S bond formation reaction. Coordination of a monodentate aryl or alkyl thiolate ligand yields the desired five-coordinate N4S environment in complexes 1 and 2, as confirmed by X-ray crystallography. In these models, the facial amine and pyridyl/imidazolyl N-donors account for the 3His triad, while a pendant imidazole occupies a position adjacent to the thiolate (Scheme 2). This arrangement provides a vacant coordinate site cis to both the imidazole and thiolate ligands, similar to SO synthase active sites. Indeed, we demonstrate here that both SO synthase mimics are capable of binding small molecules like NO (a surrogate of O2), thereby yielding metastable intermediates that have been characterized with UV-vis absorption, electron paramagnetic resonance (EPR), and infrared spectroscopies. These results constitute a promising first step towards the development of structural and functional mimics of EgtB and OvoA.
Scheme 2.

Experimental Section
Materials and Methods:
Unless otherwise noted, solvents and reagents were purchased from commercial sources and used as received. Some solvents (CH2Cl2, CH3CN, THF, Et2O) were dried over CaH2 or NaH, followed by distillation. Multiple freeze-pump-thaw cycles were performed to remove oxygen and other gases, and the solvents were stored in the glovebox over activated molecular sieves. Sodium cyclohexanethiolate was prepared by the reaction of the thiol with NaH in THF and isolated as a white powder. The Fe(II) complexes were synthesized and handled under an inert atmosphere using a Vacuum Atmospheres Omni-Lab glovebox equipped with a freezer set to −30 °C. The LA chelate was generated using a previously-reported procedure.45
Physical Methods.
UV-vis absorption spectra were collected with an Agilent 8453 diode array spectrometer equipped with a Unisoku Scientific Instruments (Osaka, Japan) cryostat for low temperature measurements. 1H NMR spectra were measured on a Varian 400 MHz spectrometer featuring variable-temperature capabilities. This instrument was also used for magnetic susceptibility measurements carried out using the Evans NMR method. Elemental analyses were performed at Midwest Microlab, LLC in Indianapolis, IN. Infrared (IR) spectra of solid samples were measured with a Thermo Scientific Nicolet 670 FTIR spectrophotometer. Mass spectra were collected using a GC-MS instrument consisting of an Agilent 5973 mass spectrometer attached to a 6850 gas chromatography system. X-band EPR spectra were measured using a Bruker EMX instrument equipped with an ER4112 SHQ resonator. EPR data were collected at liquid He temperatures using a ColdEdge/Bruker RDK-408 Stinger recirculating cryocooler. Mossbauer spectra were recorded on a closed-cycle refrigerator spectrometer, model CCR4K (SeeCo, Edina, MN) equipped with a 0.07 T permanent magnet, maintaining temperatures between 6 and 300 K. The samples consisted of either solid powders suspended in degassed mineral oil or butyronitrile solutions of high concentration (~50 mM). These samples were placed in 1.00-mL Delrin cups and frozen in liquid nitrogen. The isomer shifts are quoted at 6 K with respect to an iron metal standard at 298 K. The Mossbauer spectra were analyzed using the software WMOSS4 (Ion Prisecaru, www.wmoss.org) and SpinCount (Dr. Michael Hendrich, Carnegie Mellon University).
Synthesis of [FeII(LA)(CH3CN)2](OTf)2 (3):
Equimolar amounts of the LA ligand (0.412 g, 1.48 mmol) and FeII(OTf)2 (0.522 g, 1.48 mmol) were added to CH3CN (20 mL). The resulting reddish-brown solution was stirred for 3 h until all of the solid material had dissolved. The solution was then filtered and concentrated under vacuum. Layering with Et2O provided brown crystalline product after one day. Yield = 0.70 g (66%). Anal. Calcd. for C22H23F6FeN7O6S2 (Mw = 715.4 g mol−1): C, 36.93; H, 3.24; N, 13.70. Found: C, 36.61; H, 3.18; N, 13.45. UV-vis [λmax, nm (ε, M−1cm−1) in CH3CN]: 387 (2700), 560 (130). FTIR (cm−1, solid): ν = 3236 [ν(N-H)], 1607, 1445, 1233, 1153. 1H NMR (CDC13, 400 MHz): δ = −6.2 (s, 2H, pyr-H), 16.9 (br s, 1H), 34.0 (s, 1H), 53.2 (s, 2H, pyr-H), 53.6 (s, 2H, pyr-H), 78.6 (br s, 2H, -CH2-), 82.6 (s, 1H), 85.6 (br s, 2H, -CH2-), 99.3 (br s, 2H, -CH2-125 (br s, 2H, pyr-H). 19F NMR (CD3CN, 400 MHz): δ = −76.6 ppm (OTf). μeff (Evans method) = 4.9 μB (CD2C12), 3.9 μB (CD3CN).
Synthesis of [FeII(LA)(S-Mes)]OTf (1-OTf)
Sodium methoxide (0.016 g, 0.30 mmol) and 2,4,6-trimethylthiophenol (0.044 g, 0.29 mmol) were dissolved in THF and stirred for 30 minutes, followed by dropwise addition of 1 (0.212 g, 0.297 mmol) in THF. The resulting orange mixture was stirred for 90 min, filtered, and the volume reduced under vacuum. Vapor diffusion of pentane into this solution yielded yellow crystals of 1-OTf suitable for X-ray crystallography. Yield = 0.13 g (69%). 19F NMR (CD3CN, 400 MHz): δ = −78.7 ppm (OTf).
Synthesis of [FeII(LA)(S-Mes)]BPh4 (1):
Complex 1 was prepared by dissolving 2,4,6-trimethylthiophenol (0.025 g, 0.17 mmol) and sodium methoxide (0.009 g, 0.17 mmol) in THF. Dropwise addition of 3 (0.119 g, 0.166 mmol) in THF gave an orange solution that was stirred for 1.5 h. The solution was filtered, the solvent was removed under vacuum, and the orange residue dissolved in MeOH (5 mL). Addition of NaBPh4 (0.057 g, 0.17 mmol) gave a yellow precipitate that was allowed to settle to the bottom. The solvent was decanted and the solid was washed with MeOH and Et2O. Drying under vacuum provided 1 as a yellow powder that was used without further purification. Yield = 0.080 g (60%). Anal. Calcd. for C49H48BFeN5S (Mw = 805.7 g mol−1): C, 73.05; H, 6.01; N, 8.69. Found: C, 72.80; H, 5.94; N, 8.78. UV-vis [λmax, nm (ε, M−1cm−1) in CH2C12]: 356 (1400), 402 (1300), 1010 (30). FTIR (cm−1, solid): ν = 3312 [ν(N-H)], 1607, 1477, 1262, 1155, 1050, 1030 cm−1. 1H NMR (CD3CN 400 MHz): δ = −9.8 (s, 2H, pyr-H), 6.86 (s, 4H, BPh4), 7.02 (s, 8H, BPh4), 7.29 (s, 8H, BPh4), 21.2 (s, 2H), 24.1 (br s, 6H, -CH3), 30.7 (s, 3H, -CH3), 33.2 (s, 1H), 51.7 (s, 1H), 56.4 (s, 2H, pyr-H), 65.2 (s, 2H, pyr-H), 68.5 (s, 1H), 72.0 (br s, 4H, -CH2-), 91.3 (br s, 2H, -CH2-), 128.2 (br s, 2H, pyr-H). μeff (Evans Method)= 4.8 μB (CD2C12), 4.7 μB (CD3CN).
Synthesis of LB:
1-methyl-2-imidazolcarboxaldehyde (0.193 g, 1.75 mmol) was dissolved in MeOH (20 mL) in a round bottom flask. To this solution was added N-(1-methyl-1H-imidazol-2-ylmethyl)pyrid-2-ylmethylamine46 (0.356 g, 1.75 mmol) in MeOH (30 mL), followed by addition of glacial acetic acid (2 mL). NaBH3CN was added to the cooled reaction mixture, which was then stirred under inert atmosphere for 24 h at room temperature. The reaction mixture was acidified with conc. HCl and the solvent removed under rotary evaporation. The resulting residue was dissolved in CH2Cl2 (50 mL) and washed multiple times with a saturated Na2CO3 solution. The organic fractions were combined, dried over MgSO4, and filtered. Evaporation gave a light yellow solid that was used without further purification. Yield = 0.31 g (65%). 1H NMR (CDCl3 300 MHz): δ = 3.35 (s, 6H), 3.71 (s, 4H), 3.83 (s, 2H), 6.78 (s, 2H), 6.92 (s, 2H), 7.16 (t, 1H), 7.27 (m, 1H), 7.61 (t, 1H), 8.54 (d, 1H) ppm.
Synthesis of [FeII(LB)(CH3CN)(OTf)](OTf) (4):
Equimolar amounts of the LB ligand (0.178 g, 0.600 mmol) and FeII(OTf)2 (0.214 g, 0.605 mmol) were combined CH3CN (20 mL) and stirred for 3 h. The resulting dark brown solution was filtered and the volume reduced under vacuum. Layering with Et2O yielded a brown crystalline product. Yield = 0.35 g (78%). Anal. Calcd. for C20H23F6FeN7O6S2 (Mw = 691.4 g mol−1): C, 34.74; H, 3.35; N, 14.18. Found: C, 34.98; H, 3.34; N, 14.25. UV-vis [λmax, nm (ε, M−1cm−1) in CH3CN]: 340 (400). FTIR (cm−1, solid): ν =1608, 1502, 1233, 1153, 1022. 1H NMR (CD3CN, 400 MHz): δ = −13.8 (s, 1H, pyr-H), 14.5 (s, 6H, -NCH3), 40.6 (br s, 2H), 50.6 (s, 1H, pyr-H), 56.7 (s, 1H, pyr-H), 63.4 (s, 2H), 78.8 (br s, 2H, -CH2-) 90.7 (br s, 2H, -CH2-) 93.8 (s, 2H, -CH2-), 112.8 (br s, 1H, pyr-H). 19F NMR (CD3CN, 400 MHz): δ = −77.9 ppm (OTf). μeff (Evans Method) = 4.9 μB (CD2Cl2), 4.2 μB (CD3CN).
Synthesis of [FeII(LB)(S-Cy)]BPh4 (2):
A solution of 4 (0.144 g, 0.21 mmol) in MeOH (10 mL) was added slowly to a methanolic solution of sodium cyclohexanethiolate (0.029 g, 0.21 mmol). The reddish-brown solution was stirred for 2 h, followed by addition of NaBPh4 (0.071 g, 0.21 mmol) to give a yellow precipitate. After allowing the precipitate to settle to the bottom of the flask, the solution removed by pipette and the remaining solvent was removed under vacuum. The material was washed with MeOH and Et2O, dried under vacuum, and used without further purification. Yield = 120 mg (73%). Crystals suitable for X-ray crystallography were obtained by vapor diffusion of Et2O into a concentrated 1,2-dichloroethane (DCE) solution. Anal. Calcd. for C46H51BFeN6S (Mw = 786.7 g mol−1): C, 70.23; H, 6.53; N, 10.68. Found: C, 67.41; H, 6.73; N, 10.51. The discrepancy in the carbon value is due to small amounts of NaOTf that were detected using 19F NMR spectroscopy. UV-vis |λmax, nm (ε, M−1cm−1) in CH2Cl2]: 328 (2530), 369 (sh), 425 (sh), 1030 (50). FTIR (cm−1, solid): ν = 3044, 2918, 1595, 1484, 1430, 1265, 1152, 957, 704. 1H NMR (CD2Cl2, 400 MHz): δ = −7.3 (s, 1H), 1.75 (s, 1H), 3.28 (s, 1H), 3.46 (s, 1H), 3.77 (s, 1H), 4.21 (br s, 2H), 4.72 (s, 2H), 6.11 (s, 2H), 6.69 (s, 4H, BPh4), 6.80 (s, 8H, BPh4), 7.22 (s, 8H, BPh4), 14.8 (s, 6H, -NCH3), 15.5 (br s, 1H), 41.8 (s, 2H), 53.8 (br s, 3H), 57.2 (s, 2H), 60.1 (s, 2H), 64.5 (s, 1H), 78.4 (br s, 1H), 121.7 (br s, 1H). μeff = 5.0 μB (CD2Cl2), 4.4 μB (CD3CN).
Crystallographic Studies.
Complexes 1-OTf and 2–4 were structurally characterized using an Oxford Diffraction SuperNova kappa-diffractometer (Rigaku Corp.) equipped with both Cu and Mo X-ray sources. Table S1 provides details concerning the data collection, analysis, and crystallographic parameters for each complex. Structures were solved using the SHELXS program47–48 and refined with the SHELXL program found within the Olex2 crystallographic package49 Additional information in CIF format can be obtained from the Cambridge Crystallographic Data Centre using the deposition numbers: 2034830 (1-OTf), 2034831 (2), 2034832 (3), and 2034833 (4). In the structure of complex 2, the LB ligand is rotationally disordered with ~22% interchange between one imidazole donor and the pyridyl ring. The cyclohexyl moiety of the thiolate ligand is disordered in a similar 22:78 ratio as a result.
Reactivity with O2 and NO.
Nitric oxide (NO) gas was generated in-situ by the aqueous reaction of NaNO2 (or Na15NO2) with ascorbic acid and CuCl2 catalyst under an Ar atmosphere.50 The resulting NO gas was transferred via cannula into the reaction vial containing the iron complex. The reaction of complex 1 with O2 was performed at room temperature in CH2Cl2. After stirring for one hour, the solution was filtered through a plug of silica to remove ionic species, including iron-containing by-products of the reaction. The solvent was evaporated under vacuum and the resulting residue was taken up in CDCl3. Yields were calculated using naphthalene as an internal standard (Figure S7). Yield of bis(2,4,6-trimethyl-phenyl)disulfide (MesS-SMes) = 79 %; 1H NMR (400 MHz, CDCl3): δ = 2.21 (12H, o-CH3), 2.26 (6H, p-CH3), 6.85 (4H, m-H-Ar) ppm. GC-MS data (m/z): {M}+ Calc. for C18H22S2 302.50, Found 302; {M – SMes}+ Calc, for C9H11S 151.25, Found 151. The reaction of 2 with O2 was carried out in CH3CN and the products were isolated by addition of acidified H2O (pH = 2–3), followed by stirring for 2 hours. The aqueous layer was extracted with CH2CH2 and methyl tert-butyl ether. The organic fractions were combined and filtered through a plug of silica gel to eliminate paramagnetic species. The solvent was removed under vacuum, and the resulting residue was taken up in CD2Cl2. 1H NMR data of the reaction products were analyzed by comparison to published spectra and/or spectra measured with commercially-available material (see Figure S8). Yields were calculated using p-benzoquinone as an internal standard. Two thiolate-derived products were observed for the reaction of 2 with O2. Dicyclohexyldisulfide (CyS-SCy): Yield = 35% (average of three trials). 1H NMR (400 MHz, CD2Cl2): δ = 1.2–1.4 (10H), 1.61 (2H), 1.76 (4H), 2.02 (4H), 2.68 (2H, S-CH) ppm. GC-MS data (m/z): {M}+ Calc, for C12H22S2 230.43, Found 230; {M – Cy + H}+ Calc, for C6H12S2 148.29, Found 148. Dicyclohexyl thiosulfonate (CyS-S(O)2Cy) : Yield = 14% (average of three trials). 1H NMR (400 MHz, CD2Cl2): δ = 1.2–2.2 (18H), 2.30 (2H), 3.08 (1H, S-CH), 3.44 (1H, O2S-CH). GC-MS data (m/z): (M}+ Calc, for C12H22O2S2 262.43, Found 262; {M – CySO2}+ Calc. for C6H11S 115.22, Found 115.
Computational Methods.
Density functional theory (DFT) calculations were carried out using the ORCA 4.0 software package developed by Dr. F. Neese (MPI-CEC).51–52 Unless otherwise noted, all calculations utilized Becke’s three-parameter hybrid functional for exchange and the Lee-Yang-Parr correlation functional (B3LYP).53–54 Geometry optimizations employed the Karlsruhe valence double-ζ basis set with polarization functions (def2-SVP), whereas singlepoint calculations of spectroscopic features used the corresponding valence triple-ζ basis set combined with polarization functions (def2-TZVP).55 The resolution of identity and chain of sphere (RIJCOSX) approximations56 were applied in conjunction with the appropriate auxiliary basis sets.57–58 Solvent effects in geometry optimizations were accounted for using the conductorlike polarizable continuum model (C-PCM).59 Calculations of MeCN-bound complexes used acetonitrile as the solvent, while optimizations of the Fe/NO adducts used CH2Cl2. Time-dependent DFT (TD-DFT) calculations employed the cam-B3LYP range-separated hybrid functional,60 which is known to provide excellent agreement between experimental and computed absorption spectra for CDO and iron-thiolate complexes.36–61 Absorption energies and intensities were computed for 40 excited states via the Tamm-Dancoff approximation.62–63 Isosurface plots of molecular orbitals and electron density difference maps were prepared using the ChemCraft program. For calculations of Mössbauer parameters,64 the “core properties” with extended polarization [CP(PPP)] basis set65 and a high resolution grid with an integration accuracy of 7.0 was used for the Fe atom; the def2-TZVP basis set was used for all other atoms. Isomer shifts (δ) and quadrupole splittings (ΔEQ) were derived from linear correlation functions reported by Gordon et al.41 For isomer shifts: δ = α(ρ(0) – C) + β, where ρ(0) is the computed electron density at the Fe nucleus (in units of a.u.−3), α = −0.440 mm a.u.3 s−1, β = 2.104 mm s−1, and C = 11813 a.u.−3. For quadrupole splittings: ΔEQ = η|(ΔEQ,DFT) – B0, where ΔEQ,DFT is the DFT-computed quadrupole splitting, η = 0.840, and B0 = −0.00193 mm s−1.
Results and Discussion
A. Synthesis and X-ray Crystal Structures.
The synthesis of LA was previously reported by Karlin and coworkers in their studies of Cu(I)/O2 chemistry.45 The LB supporting ligand, which features two pendant imidazole donors, was prepared by modifying the procedure described in Bowers et al.66 Reaction of FeII(OTf)2 with an equimolar amount of LA or LB in CH3CN yielded the precursor complexes 3 and 4, respectively, in good yields. Brown crystals of 3 and 4 suitable for X-ray diffraction experiments were generated by layering CH3CN solutions with diethyl ether. As shown in Figure 2, the X-ray structure of 3 contains a six-coordinate [FeII(LA)(CH3CN)2]2+ cation (the two triflate counteranions are non-coordinating). The Fe–N bond distances fall between 1.93 and 2.01 Å, typical of low-spin Fe(II) complexes with related ligand sets.67 In contrast, the [FeII(LB)(CH3CN)(OTf)]+ cation of 4 features a coordinated triflate ligand trans to one of the imidazole donors (Figure 2). The increase in average Fe–N distance to 2.17 Å in 4 is indicative of a high-spin Fe(II) center. A notable feature of this structure is the unusually long bond distance of 2.314 Å between Fe1 and the central amino donor (N1). For comparison, Fe-Namine bond distances in high-spin Fe(II) complexes supported by substituted tris(2-pyridylmethyl)amine (TPA) ligands generally fall between 2.15 and 2.22 Å.67–69,70
Figure 2.

Thermal ellipsoid plots (50% probability level) derived from X-ray crystal structures of 3 (left) and 4 (right). Hydrogen atoms and non-coordinating counteranions have been omitted for clarity. Selected interatomic distances (Å) for 3: Fe–N1 = 2.010(3), Fe–N2 = 1.948(3), Fe–N3 = 1.958(4), Fe–N5 = 1.960(4), Fe–N6 = 1.930(3), Fe–N7 = 1.953(3). Selected interatomic distances (Å) for 4: Fe–N1 = 2.314(2), Fe–N2 = 2.167(2), Fe–N4 = 2.116(2), Fe–N6 = 2.124(2), Fe–N7 = 2.117(2), Fe–O1 = 2.197(2).
Reaction of 3 with 2,4,6-trimethylthiophenol in the presence of base in THF yielded the desired iron(II)-thiolate complex [FeII(LA)(S-Mes)]OTf (1-OTf). Counteranion metathesis with NaBPh4 in MeOH provided [FeII(LA)(S-Mes)]BPh4 (1) as a yellow precipitate. Similarly, treatment of 4 with sodium cyclohexanethiolate (NaSCy) in MeOH, followed by addition of NaBPh4, generated [FeII(LB)(S-Cy)]BPh4 (2) as a yellow powder. X-ray quality crystals of 1-OTf and 2 were obtained via methods described in the Experimental Section, but attempts to grow suitable crystals of 1 were not successful.
The X-ray structures of 1-OTf and 2 are shown in Figure 3 and key metric parameters are summarized in Table 1. Both complexes display distorted trigonal-bipyramidal geometries (τ-values71 near 1.0) in which the thiolate (S1) and amine (N1) donors occupy the axial positions, as evident by the S1-Fe-N1 angles near 180°. The pyridyl and imidazole donors are arranged in the equatorial plane with N–Fe–N angles ranging from 108 to 122°. The Fe–S bond distances of 2.36 and 2.30 Å for 1-OTf and 2, respectively, are typical of high-spin iron(II)-thiolate complexes,36–41 and the Fe–S1–C1 bond angles are sharply bent for both complexes (103° for 1-OTf, 112° for 2). Comparison of 2 and 4 reveals that coordination of the cyclohexanethiolate ligand further elongates the Fe–N1 bond by 0.05 Å, and the structure of 1-OTf also features a lengthy Fe–N1 bond distance of 2.312 Å. In both cases, the S1-Fe-Nppyr/imid angles lie closer to 109.5° than 90° (Table 1). Thus, based on the single-crystal X-ray data, the geometries of 1-OTf and 2 are best described as intermediate between five-coordinate (trigonal bipyramidal) and four-coordinate (tetrahedral).
Figure 3.

Thermal ellipsoid plots (50% probability level) derived from X-ray crystal structures of 1-OTf (left) and 2 (right). Hydrogen atoms and non-coordinating counteranions have been omitted for clarity.
Table 1.
Selected Bond Distances (Å) and Angles (deg) for 1-OTf, 2, and Substrate-Bound EgtB as Determined by X-ray Crystallography a
| 1-OTf | 2 | EgtB b | |||
|---|---|---|---|---|---|
| Fe–S1 | 2.3616(7) | Fe–S1 | 2.3048(7) | Fe–N (His51) | 2.13 / 2.12 |
| Fe–N1 (amino) | 2.312(2) | Fe–N1 (amino) | 2.389(2) | Fe–N (His134) | 2.06 / 2.14 |
| Fe–N2 (pyr) | 2.133(2) | Fe–N2 (pyr) | 2.134(2) | Fe–N (His138) | 2.11 / 2.11 |
| Fe–N3 (pyr) | 2.150(2) | Fe–N4 (imid) | 2.101(2) | Fe–N (TMH) | 2.10 / 2.12 |
| Fe–N5 (imid) | 2.098(2) | Fe–N6 (imid) | 2.094(2) | Fe–O (H2O) | 2.09 / 2.12 |
| Fe–O (H2O) | 2.21 / 2.19 | ||||
| N1–Fe–S1 | 177.33(6) | N1–Fe–S1 | 177.39(5) | ||
| N2–Fe–S1 | 102.88(6) | N2–Fe–S1 | 105.08(6) | ||
| N3–Fe–S1 | 103.51(6) | N4–Fe–S1 | 108.46(5) | Mn–N (His51) | 2.31 / 2.15 |
| N5–Fe–S1 | 107.21(7) | N6–Fe–S1 | 105.51(6) | Mn–N (His134) | 2.12 / 2.13 |
| N1–Fe–N2 | 75.83(8) | N1–Fe–N2 | 72.58(8) | Mn–N (His138) | 2.25 / 2.10 |
| N1–Fe–N3 | 75.24(8) | N1–Fe–N4 | 73.97(7) | Mn–S (γGC) | 2.54 / 2.58 |
| N1–Fe–N5 | 75.45(8) | N1–Fe–N6 | 74.32(7) | Mn–N (DMH) | 2.25 / 2.21 |
| N2–Fe–N3 | 117.40(8) | N2–Fe–N4 | 122.40(8) | Mn–O (H2O) | 2.39 / 2.30 |
| N2–Fe–N5 | 108.10(8) | N2–Fe–N6 | 106.14(8) | ||
| N3–Fe–N5 | 116.26(8) | N4–Fe–N6 | 108.09(7) | ||
| τ-value c | 1.00 | τ-value c | 0.92 |
The enzymatic results were obtained from reference 27.
Bond distances are provided both active sites in the EgtB structures. The set of Fe–N/O bond distances were measured for the ternary complex consisting of EgtB, Fe(II), and TMH (PDB: 4X8E). The Mn–N/O/S bond distances are derived from the structure of the quaternary complex containing EgtB, Mn(II), N,N-dimethyl histidine (DMH), and γGC (PDB: 4X8D).
See reference 71 for a definition of the τ-value.
The metal-ligand bond distances of substrate-bound EgtB are also provided in Table 1 for the sake of comparison. These values are derived from two X-ray structures reported by Seebeck and coworkers.27 The first structure is a ternary complex consisting of EgtB, Fe(II), and TMH (PDB: 4X8E), while the second is an inactive quaternary complex containing EgtB, Mn(II), N,N-dimethyl histidine (DMH) and γGC (PDB: 4X8D). The divalent metal ions in the EgtB active site are coordinatively saturated due to the binding of one or two H2O molecules, which resembles the binding of CH3CN and OTf moieties to the Fe(II) centers of 3 and 4. The Fe/Mn–N bond distances involving the 3His triad and TMH/DMH substrates range between 2.1 and 2.3 Å, similar to the Fe–N distances observed in X-ray structures of our high-spin Fe(II) complexes (1-OTf, 2, and 4). In contrast, the Mn–SγGC bond distance of ~2.55 Å in the quaternary complex is much longer than the Fe–S distances of ~2.3 Å in the synthetic models, although the uncertainty in the former value is sizable due to the inherently lower resolution (1.98 Å) of the enzymatic data. Regardless, from the EgtB structure, it is clear that the γGC substrate participates in numerous noncovalent interactions with second-sphere residues that may contribute to elongation of the metal-thiolate bond. An important parameter with respect to C-S bond formation is the distance between the thiolate S-atom and C2 of the His-derived substrate, which measures 3.8 Å in the Mn(II)-EgtB structure. The corresponding value is only slightly longer (4.02 Å) in the X-ray structure of 1-OTf, suggesting that this complex has the proper geometry for SO synthase reactivity.
B. Spectroscopic Features of Complexes 1-4.
1H NMR spectra of 1–4 display an abundance of paramagnetically-shifted peaks between −20 and 130 ppm (Figures S1–S4). The effective magnetic moments measured using the Evans method lie between 4.8 and 5.0 μB in CD2Cl2, typical of high-spin Fe(II) complexes (S = 2). Complexes 1–4 remain paramagnetic in CD3CN with effective magnetic moments ranging between 3.9 μB (for 3) and 4.7 μB (for 1), indicating that the Fe(II) centers are largely high-spin even in coordinating solvents. Thus, the low-spin geometry of 3 observed by XRD is likely due to crystal packing effects. 19F NMR spectra of 1-OTf, 3, and 4 in CD3CN feature a peak close to −78 ppm, typical of “free” (uncoordinated) triflate anions. The broadness of the triflate peak (relative to a PhCF3 standard) can be used to assess the degree of counteranion binding to the Fe(II) center.72 As summarized in Table S2, the triflate peak of complex 3 exhibits a full width at half maximum (fwhm) of 100 Hz at room temperature, which is much broader than the peaks of 1-OTf and 4 (fwhm ~ 20 Hz). For reference, the PhCF3 standard and [NBu4]OTf both exhibit fwhm values of ~5 Hz under identical conditions. Collectively, these results suggest that a rapid equilibrium between bound and unbound triflate exists for 3 in solution, whereas the triflate counteranions of 1-OTf and 4 are “free” to a much greater extent.
The spin states and coordination geometries of 1–4 were further examined using Mössbauer (MB) spectroscopy. The MB spectrum of complex 3 in a powder suspension (Figure 4, top) consists of three overlapping quadrupole doublets that arise from distinct iron species. The relative contribution of each sub-species was determined by spectral analysis and least-square fitting, and the results are summarized in Table 2. Approximately 75% of the sample is attributed to two species with similar isomer shifts (δ) of 1.18 and 1.12 mm/s – values that are characteristic of high-spin, six-coordinate Fe(II) centers with N/O donors.73 These two species are distinguished by their different quadrupole splittings (ΔEQ). A third component (20% of the mixture, blue line in Figure 4) displays smaller δ- and ΔEQ-values of 0.47 and 0.35 mm/s, respectively, that are typical of low-spin, six-coordinate Fe(II) centers.73 This minor species likely corresponds to the [Fe(LA)(MeCN)2]2+ complex observed by X-ray crystallography (vide supra). The three species observed for 3 are attributed to different combinations of MeCN and OTf ligands in the coordination sphere (i.e., 2 MeCN, MeCN/OTf, and 2 OTf). By comparison, the powder MB spectrum of 4 is less complex: nearly 90% of the signal arises from a six-coordinate, high-spin species with an isomer shift of 1.12 mm/s, consistent with the crystallographic structure.
Figure 4.

MB spectra of complexes 3 and 4 measured at 7.0 K and 70 mT. The samples were prepared by suspension of powders in degassed mineral oil. The hatch marks are the experimental data, and the colored lines are spectral fits generated with the parameters in Table 2. For clarity, in spectrum A an unknown species with δ = 0.75 and ΔEQ =1.0 mm/s accounting for 5% absorption was subtracted from the raw data.
Table 2.
Experimental and DFT-Computed Mossbauer Parameters for Complexes 1–4.
| Experimental MB parameters a | DFT-Computed MB parameters | |||||||
|---|---|---|---|---|---|---|---|---|
| Complex, state | δ(mm/s) | ΔEQ(mm/s) | FWHM (mm/s) | Model | C.N., spinb | δ(mm/s) | ΔEQ(mm/s) | |
| 1, solid | Sp1 (73%) | 0.94(3) | 3.52(3) | 0.29 | 1 (XRD) | 5, S = 2 | 0.88 | 2.97 |
| Sp2 (17%) | 0.45(3) | 0.27(3) | 0.33 | [1(MeCN)]+ | 6, S = 2 | 1.08 | 3.00 | |
| 1, solution | Sp1 (90%) | 0.93(3) | 3.64(3) | 0.31 | ||||
| 2, solid | Sp1 (96%) | 0.90(3) | 3.12(3) | 0.31 | 2 (XRD) | 5, S = 2 | 0.85 | 2.65 |
| 2, solution | Sp1 (65%) | 0.89(3) | 2.83(3) | 0.38 | [2(MeCN)]+ | 6, S = 2 | 1.07 | 2.78 |
| Sp2 (19%) | 1.00(3) | 3.70(3) | 0.40 | |||||
| 3, solid | Sp1 (55%) | 1.18(3) | 2.40(3) | 0.35 | 3 (XRD) | 6, S = 0 | 0.43 | 0.37 |
| Sp2 (20%) | 1.12(3) | 3.00(3) | 0.30 | |||||
| Sp3 (20%) | 0.47(3) | 0.35(3) | 0.40 | |||||
| 4, solid | Sp1 (92%) | 1.12(5) | 2.48(5) | 0.30 | 4 (XRD) | 6, S = 2 | 1.11 | 2.82 |
The relative contribution of each sub-species (Sp) was determined by least-square fitting of the experimental data. Contributions from very minor species (< 15%) are not included in the table; hence, the percentages do not add up to 100%. See the Supporting Information for further details.
C.N. = coordination number
MB samples of 1 and 2 were prepared as both powder suspensions and concentrated solutions in butyronitrile, and the resulting spectra are shown in Figure 5. The MB features of 1 are nearly identical in the solid state and solution; both spectra consist of a dominant quadrupole doublet with δ- and ΔEQ-values near 0.94 and 3.6 mm/s, respectively (Table 2). In the case of 2, the parameters of the solid-state sample (δ = 0.90 and ΔEQ = 3.1 mm/s) are very similar to those of the major species in the solution sample. The latter also contains a minor species (20% of the mixture) with a larger isomer shift of 1.00 mm/s. Previous studies have demonstrated that δ-values around 0.9 mm/s are typical for five-coordinate, high-spin Fe(II) complexes, including those with thiolate ligands.41 Thus, the powder MB data collected for 1 and 2 are fully consistent with the crystallographic structures. In addition, the lack of significant changes in MB parameters upon solvation in butyronitrile indicates that the structures remain largely five-coordinate even in coordinating solvents. However, the larger isomer shift measured for the minor component of 2 suggests that a small fraction of this complex may bind butyronitrile in solution to give a six-coordinate species.
Figure 5.

MB spectra of complexes 1 and 2 measured at 7.0 K and 70-mT. The samples consisted of either powders in degassed mineral oil (A and C) or concentrated butyronitrile solutions (B and D). The hatch marks are the experimental data, and the red lines are spectral fits generated with the parameters in Table 2. Contributions from minor impurities have been removed for the sake of clarity (see Supporting Information for additional details).
The iron(II)-thiolate complexes 1 and 2 are light yellow in solution due to a series of intense absorption features in the near-UV region (λ < 500 nm). These bands are distinct from those observed in spectra of the precursor complexes. As shown in Figure 6, the absorption spectrum of 1 in CH2Cl2 exhibits two peaks at λmax = 356 and 402 nm (ε ~ 1350 M−1cm−1). The spectral features of 2 consist of an intense peak at λmax = 328 nm (ε = 2530 M−1cm−1) and two shoulders at 369 and 425 nm. These absorption bands in the near-UV region are assigned as S→Fe(II) charge transfer (CT) transitions based on literature precedents41, 74 and the computational results presented in the next section. Both complexes also display a weak band near 1000 nm (ε = 30-50 M−1cm−1) that is attributed to an Fe(II) d-d transition. Spectra of 1 and 2 measured in CH3CN exhibit a nearly identical set of S→Fe(II) CT features (Figure S5), although the peaks are blue-shifted by approximately 500 cm−1 on average. The lack of major differences between spectra collected in CH2Cl2 and CH3CN is further evidence of that these complexes possess five-coordinate geometries in both solvents.
Figure 6.

UV-vis absorption spectra of 1 and 2 in CH2Cl2 at room temperature.
C. Computational Studies of Complexes 1–4.
The geometric and electronic structures of complexes 1-4 were examined by DFT calculations that employed the B3LYP hybrid functional. Calculations of the precursor complexes (3 and 4) utilized the crystallographic coordinates without further optimization. Two sets of computational models were generated for the iron(II)-thiolate complexes: i) unoptimized, five-coordinate structures derived from XRD studies of 1 and 2, and ii) geometry-optimized, six-coordinate structures with bound CH3CN to account for inner-sphere solvation (i.e., [1(CH3CN)]+ and [2(CH3CN)]+). Both high-spin and low-spin models of [1(CH3CN)]+ and [2(CH3CN)]+ were generated. The acetonitrile ligand is presumed to adopt a position cis to the thiolate and trans to an imidazole donor. Comparison of the DFT and XRD structures suggests that solvent binding causes a modest elongation of the Fe–S/N bonds by an average 0.07 Å (1) and 0.11 Å (2) for the high-spin models (Table S3).
Mössbauer parameters were calculated for each model and the results are summarized in Table 2. These calculations employed the B3LYP functional and the calibration parameters recently reported by Goldberg and coworkers for nonheme iron-thiolate complexes.41 The five-coordinate models of 1 and 2 yield MB parameters that agree nicely with both the solid- and solution-state experimental data, whereas the computed δ-values of ~1.08 mm/s for the high-spin, six-coordinate models are too high. Thus, the DFT results provide further corroboration that 1 and 2 exist primarily as five-coordinate species in MeCN and butyronitrile solutions. Interestingly, the MB parameters computed for [2(CH3CN)]+ (δ = 1.07 mm/s; ΔEQ = 2.78 mm/s) are similar to those observed for the minor component of the solution-state spectrum of 2, which further supports the hypothesis that this feature arises from a six-coordinate species.
For the precursor complexes, the δ- and ΔEQ-values computed for the low-spin (S = 0) model of 3 closely match those exhibited by the minor component in the experimental spectrum (Figure 4 and Table 2), confirming that this doublet arises from a low-spin species. The isomer shift of 1.11 mm/s calculated for the six-coordinate model of 4is in excellent agreement with the experimental value of 1.12 mm/s. Based on these results, we can confidently assign the major components in the experimental spectrum of 3 to high-spin, six-coordinate species with structures similar to 4.
DFT calculations also provided insights into the electronic structures of 1 and 2, particularly Fe/S bonding interactions. Figure 7 presents energy level diagrams derived from DFT calculations of the five-coordinate XRD structures, highlighting the Fe(II)- and thiolate-based molecular orbitals (MOs) most relevant to the spectroscopic features of 1 and 2. For both complexes, the highest-occupied MO (HOMO) in the spin-down (β) manifold is an Fe(3d)-based orbital that bisects the S–Fe–Nimid angle. The four remaining spin-down Fe(3d)-based MOs are unoccupied due to the high-spin nature of these Fe(II) complexes. The two highest-energy thiolate-based MOs ligands possess largely S(3p) character and are distinguished by their orientation either perpendicular (Sπ) or parallel (Sσ) to the Fe–S bond. The Sσ-based MO of complex 1 exhibits substantial delocalization over the mesityl ring, typical of aryl thiolates. The average percentage of Fe character in the S(3p)-based MOs of 1 and 2 (22% and 11%, respectively) suggests that the Fe–S bond of the former complex is more covalent. This difference in Fe/S covalency is attributed to the smaller energy gap between the S(3p) and Fe(3d) MOs in 1 compared to 2, which also accounts for the relative energies of S→Fe(II) CT bands in the experimental UV-vis spectra (vide supra).
Figure 7.

Energy-level diagrams and isosurface plots of spin-down (β) molecular orbitals derived from spin-unrestricted DFT calculations (B3LYP; def-TZVP) of complexes 1 (left) and 2 (right).
As shown in Figure 8, absorption spectra of 1 and 2 generated by time-dependent DFT (TD-DFT) calculations are in excellent agreement with the experimental spectra. The TD-DFT results confirm that the dominant features in the near-UV region arise from S→Fe(II) CT transitions. In the case of 1, the electron density difference map of the lowest-energy CT band (labeled a in Figure 8) indicates that this transition has Sσ→Fe(3d) character, while the more intense transition at higher energy (b) has Sπ→Fe(3d) character. These two excitations correspond to the experimental peaks at 402 and 356 nm. The computed spectrum of 2 features two strong Sπ→Fe(3d) CT transitions (a and b) that match the shoulders at 369 and 425 nm in the experimental spectrum. Many of the computed transitions at shorter wavelengths (like c at 312 nm) possess both Sσ→Fe(3d) and Fe(3d)→pyr(π*) CT character, which accounts for the sizable intensity of absorption features near 300 nm.
Figure 8.
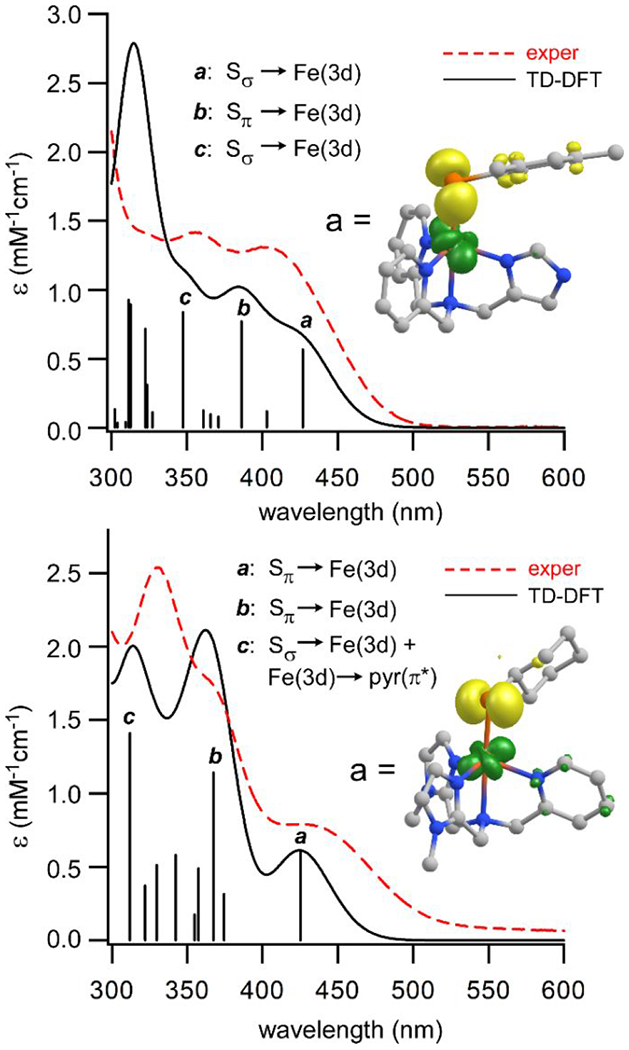
TD-DFT computed absorption spectra (solid black lines) of complexes 1 (top) and 2 (bottom) compared to experimental spectra (dashed red lines) measured in CH2Cl2 at room temperature. The black sticks indicate the energies and intensities of computed transitions; intense S→Fe(II) CT transitions are marked with letters (a, b, and c). The insets display electron density difference maps of the lowest-energy S→Fe(II) CT transition for each complex. The yellow and green areas represent the loss and gain, respectively, of electron density during the excitation.
D. Reactivity of 1 and 2 with Dioxygen and Nitric Oxide.
Exposure of 1 and 2 to O2 at room temperature in MeCN causes a color change from yellow to dark brown. Absorption spectra of the O2 reaction revealed that the S→Fe(II) CT transitions of 1 and 2 are replaced by broad and ill-defined bands that tail into the visible region (Figure S6), suggesting loss of the iron-thiolate bonds. In the case of 2, a purple chromophore with a band at λmax = 520 nm is observed upon initial exposure to O2, but this species decays rapidly (t1/2 = 47 s) to give a shapeless spectrum. No intermediates are observed in the reaction of 1 with O2. Analysis of the oxygenated solutions with GC-MS (after work-up) revealed that the thiolate ligands of 1 and 2 are primarily converted into the corresponding disulfides, MesS–SMes and CyS–SCy, respectively. Formation of these disulfide products was further confirmed by 1H NMR analysis of the O2-treated samples (see Figures S7 and S8). Disulfides are commonly-observed products of O2 reactions involving iron-thiolate complexes, as demonstrated in previous studies of CDO models.41, 75–76 Dimesityldisulfide was the only observed product derived from the aryl thiolate ligand in the reaction of 1 with O2. In the case of 2, a small amount of the thiosulfonate ester, CyS-S(O)2Cy, was also detected by GC-MS and 1H NMR (Figure S8).77 The thiosulfonate product could arise from either dioxygenation of CyS–SCy or reaction of a sulfinic acid intermediate (CySO2H; not observed) with cyclohexylthiol(ate). There is precedent for both reaction pathways in the literature.78–80 Sulfinic acid products were not observed in the reaction mixtures of either complex.
We surmised that the paucity of S-oxygenation products in the reaction of 1 and 2 with O2 might be due to steric hindrance that prevents O2 from binding directly to the Fe(II) center. Such a possibility is suggested by the spectroscopic studies presented above, which found that MeCN and butyronitrile molecules are incapable of coordinating to 1 and 2 in solution. To probe this hypothesis further, we examined the reaction of 1 and 2 with nitric oxide (NO) – an analog of O2 that has been employed in numerous studies of biological and synthetic nonheme iron sites. The reaction of complexes 1 and 2 with NO at low temperature (−70 °C) in CH2Cl2 generates new chromophores (labeled 1-NO and 2-NO) with the UV-visible absorption features shown in Figure 9. The spectrum of NO-treated 2 exhibits a band at 430 nm and less intense features at 550 and 630 nm; a similar set of absorption bands is observed for NO-treated 1. The same species are generated upon exposure to NO at room temperature, but the absorption bands are less intense and decay over time. The features of 1-NO and 2-NO are characteristic of six-coordinate {FeNO}7 species (Enemark-Feltham notation81) with a high-spin (S = 3/2) ground state.36, 82–85 Consistent with this conclusion, analysis of NO-treated samples with X-band EPR spectroscopy revealed axial S = 3/2 signals (g ~ 4.0 and 2.0) typical of {FeNO}7 species (Figure S9).86
Figure 9.
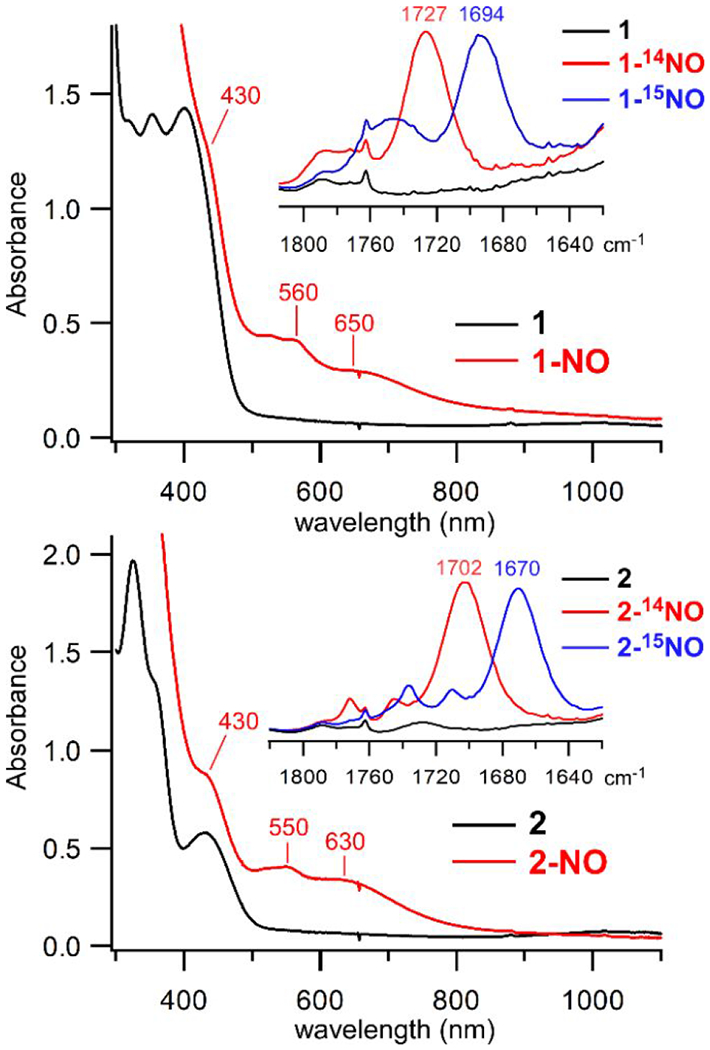
UV-vis absorption spectra of the reaction of complexes 1 (top) and 2 (bottom) with NO gas at −70 °C in CH2Cl2 ([1] = 0.95 mM; [2] = 0.98 mM). The wavelengths of prominent bands in the spectra of 1-NO and 2-NO (red lines) are indicated. Insets: IR spectra measured after treatment of 1 or 2 with 14NO (red lines) or 15NO (blue lines) at room temperature in CH2Cl2. IR spectra of 1 and 2 in CH2Cl2 (black lines) are shown for comparison.
The formation of Fe/NO adducts was further confirmed by IR spectroscopy. The IR spectrum of 1-NO exhibits an intense feature at 1727 cm−1 that is not present in the precursor spectrum (Figure 9, inset). This peak downshifts by 33 cm−1 when 15NO gas is employed, indicating that it arises from the N-O stretching mode, ν(NO). Similarly, the IR spectrum of 2-NO displays a ν(NO)-based peak at 1702 cm−1 (14N/15N isotope shift of 32 cm−1). The difference in ν(NO) frequencies indicates that the aliphatic S-Cy ligand of 2-NO is more electron-donating than the aryl S-Mes ligand of 1-NO.87 The ν(NO) frequencies of 1-NO and 2-NO are comparable to those previously reported for similar thiolate-ligated nonheme {FeNO}7 species.88–90 Based on the linear correlation presented by Chavez et al.91 the NO stretching frequencies of 1-NO and 2-NO are indicative of bent nitrosyl ligands with Fe–N–O bond angles around 150°. Computational models of 1-NO and 2-NO generated via DFT geometry optimizations feature Fe–N–O angles of 161° and 154°, respectively, further supporting the correlation between ν(NO) frequency and Fe–N–O angle.
Interestingly, the decay of the 1702 cm−1 peak of 2-NO at room temperature in accompanied by an increase in the intensity of two isotopically-active features at 1772 and 1745 cm−1 (Figure S10). These two peaks, which exhibit 14N/15N isotope shifts of 35 cm−1, likely correspond to the ν(NO) modes of a dinitrosyl iron complex (DNIC).92 Indeed, we occasionally observed the S = 1/2 signal of {Fe(NO)2}9 species in EPR spectra of 1-NO and 2-NO samples. DNICs are common decay products of thiolate-ligated iron-nitrosyl species because disulfide formation provides the necessary reducing equivalents for the 2{FeNO}7→{FeNO2}9 reaction.36, 93 Thus, our results indicate that diatomic molecules like NO (and, by extension, O2) are capable of binding to the Fe(II) centers of 1 and 2, but the resulting adducts are unstable at elevated temperatures.
Conclusions.
In this manuscript, we have reported the syntheses, X-ray structural characterization, spectroscopic features, and O2/NO reactivities of two nonheme iron–thiolate complexes that serve as structural mimics of SO synthases. These synthetic complexes emulate the substrate-bound active sites of EgtB and OvoA in three crucial respects: both 1 and 2 feature i) a high-spin, five-coordinate Fe(II) center, ii) a monodentate thiolate ligand cis to an imidazole moiety, and iii) three neutral N-donors in a facial arrangement similar to the enzymatic 3His triad. The desired coordination geometry was achieved by incorporating the imidazole donor(s) within the tetradentate LA and LB scaffolds, followed by formation of Fe(II) precursors (3 and 4) that readily bind a single thiolate ligand. UV-vis absorption, 1H NMR, and Mössbauer spectroscopic studies revealed the 1 and 2 retain their five-coordinate geometries in CH2Cl2 and nitrile solutions. The nature of the iron-thiolate bond was probed with computational methods, which accurately reproduced the experimental spectroscopic features. Both complexes react with NO to generate six-coordinate {FeNO}7 species, as confirmed by EPR and IR spectroscopies. The structures of these Fe/NO adducts resemble those proposed for iron-superoxo intermediates in the catalytic cycles of EgtB and OvoA.15, 32–35
Even though 1 and 2 are faithful structural models of the SO synthase active sites, the major thiolate-derived product upon reaction with O2 at room temperature is the corresponding disulfide. Neither sulfinic acids nor products arising from S-C bond formation were observed, indicating that 1 and 2 do not replicate the reactivity of either thiol dioxygenases or SO synthases. It is likely that second-sphere residues in the active-site pockets of EgtB and OvoA steer the iron-bound substrates towards thiohistidine products and prevent the kind of deleterious side-reactions observed for our solvent-exposed mimics. Regardless, this first generation of synthetic SO synthase models offers a valuable foundation for continuing biomimetic studies aimed at a more complete understanding of SO synthase catalysis. Future work in our laboratories will seek to promote enzyme-like O2 reactivity though rational modifications of ligand structure, coordination geometry, and/or reaction conditions. We will also probe the identity of intermediates, such as the transient purple species observed in the reaction of 2 with O2, which promises to shed light on the O2 activation mechanisms of nonheme iron enzymes with thiolate substrates.
Supplementary Material
Acknowledgements
The authors are grateful for financial support from the National Institutes of Health (GM126522 to A.T.F.). Improvements to the X-band EPR instrument at Marquette University were funded through a grant from the National Science Foundation (CHE-1532168). The Mössbauer experiments were supported by start-up funds from The College of Arts and Sciences (to C.V.P.) and the Undergraduate Research Opportunities Program (M.E.E.) at The University of St. Thomas. C.V.P thanks Dr. Michael Hendrich for the program Spin Count.
References
- 1.Stipanuk MH, Simmons CR, Karplus P. Andrew and Dominy JE Jr., Amino Acids, 2011, 41, 91–102. [DOI] [PMC free article] [PubMed] [Google Scholar]
- 2.Stipanuk MH, Annu. Rev. Nutr, 2004, 24, 539–577. [DOI] [PubMed] [Google Scholar]
- 3.Peck SC and van der Donk WA, J. Biol. Inorg. Chem, 2017, 22, 381–394. [DOI] [PMC free article] [PubMed] [Google Scholar]
- 4.Stipanuk MH, Londono M, Hirschberger LL, Hickey C, Thiel DJ and Wang L, Amino Acids, 2004, 26, 99–106. [DOI] [PubMed] [Google Scholar]
- 5.Chai SC, Jerkins AA, Banik JJ, Shalev I, Pinkham JL, Uden PC and Maroney MJ, J. Biol. Chem, 2005, 280, 9865–9869. [DOI] [PubMed] [Google Scholar]
- 6.Stipanuk MH, Ueki I, Dominy JE Jr., Simmons CR and Hirschberger LL, Amino Acids, 2009, 37, 55–63. [DOI] [PMC free article] [PubMed] [Google Scholar]
- 7.Dominy JE Jr., Simmons CR, Hirschberger LL, Hwang J, Coloso RM and Stipanuk MH, J. Biol. Chem, 2007, 282, 25189–25198. [DOI] [PubMed] [Google Scholar]
- 8.Masson N, Keeley TP, Giuntoli B, White MD, Puerta ML, Perata P, Hopkinson RJ, Flashman E, Licausi F and Ratcliffe PJ, Science, 2019, 365, 65–69. [DOI] [PMC free article] [PubMed] [Google Scholar]
- 9.Bruland N, Wuebbeler JH and Steinbuechel A, J. Biol. Chem, 2009, 284, 660–672. [DOI] [PubMed] [Google Scholar]
- 10.Pierce BS, Subedi BP, Sardar S and Crowell JK, Biochemistry, 2015, 54, 7477–7490. [DOI] [PMC free article] [PubMed] [Google Scholar]
- 11.Tchesnokov EP, Fellner M, Siakkou E, Kleffmann T, Martin LW, Aloi S, Lamont IL, Wilbanks SM and Jameson GNL, J. Biol. Chem, 2015, 290, 24424–24437. [DOI] [PMC free article] [PubMed] [Google Scholar]
- 12.Ishikawa Y, Israel SE and Melville DB, J. Biol. Chem, 1974, 249, 4420–4427. [PubMed] [Google Scholar]
- 13.Vogt RN, Spies HSC and Steenkamp DJ, Eur. J. Biochem, 2001, 268, 5229–5241. [DOI] [PubMed] [Google Scholar]
- 14.Naowarojna N, Cheng R, Chen L, Quill M, Xu M, Zhao C and Liu P, Biochemistry, 2018, 57, 3309–3325. [DOI] [PMC free article] [PubMed] [Google Scholar]
- 15.Stampfli AR, Blankenfeldt W and Seebeck FP, Curr. Opin. Struct. Biol, 2020, 65, 1–8. [DOI] [PubMed] [Google Scholar]
- 16.Seebeck FP, J. Am. Chem. Soc, 2010, 132, 6632–6633. [DOI] [PubMed] [Google Scholar]
- 17.Braunshausen A and Seebeck FP, J. Am. Chem. Soc, 2011, 133, 1757–1759. [DOI] [PubMed] [Google Scholar]
- 18.Mashabela GTM and Seebeck FP, Chem. Commun, 2013, 49, 7714–7716. [DOI] [PubMed] [Google Scholar]
- 19.Song H, Leninger M, Lee N and Liu P, Org. Lett, 2013, 15, 4854–4857. [DOI] [PMC free article] [PubMed] [Google Scholar]
- 20.Song H, Her AS, Raso F, Zhen Z, Huo Y and Liu P, Org. Lett, 2014, 16, 2122–2125. [DOI] [PMC free article] [PubMed] [Google Scholar]
- 21.Naowarojna N, Huang P, Cai Y, Song H, Wu L, Cheng R, Li Y, Wang S, Lyu H, Zhang L, Zhou J and Liu P, Org. Lett, 2018, 20, 5427–5430. [DOI] [PubMed] [Google Scholar]
- 22.Cheah IK and Halliwell B, Biochimica et Biophysica Acta, Molecular Basis of Disease, 2012, 1822, 784–793. [DOI] [PubMed] [Google Scholar]
- 23.Ariyanayagam MR and Fairlamb AH,Mol. Biochem. Parasitol, 2001, 115, 189–198. [DOI] [PubMed] [Google Scholar]
- 24.Jacob C, Nat. Prod. Rep, 2006, 23, 851–863. [DOI] [PubMed] [Google Scholar]
- 25.Castellano I and Seebeck FP, Nat. Prod. Rep, 2018, 35, 1241–1250. [DOI] [PubMed] [Google Scholar]
- 26.McCoy JG, Bailey LJ, Bitto E, Bingman CA, Aceti DJ, Fox BG and Phillips GN Jr., Proc. Natl. Acad. Sci. U.S.A, 2006, 103, 3084–3089. [DOI] [PMC free article] [PubMed] [Google Scholar]
- 27.Goncharenko KV, Vit A, Blankenfeldt W and Seebeck FP, Angew. Chem. Int. Ed, 2015, 54, 2821–2824. [DOI] [PubMed] [Google Scholar]
- 28.Naowarojna N, Irani S, Hu W, Cheng R, Zhang L, Li X, Chen J, Zhang YJ and Liu P, ACS Catal., 2019, 9, 6955–6961. [DOI] [PMC free article] [PubMed] [Google Scholar]
- 29.de Visser SP and Straganz GD, J. Phys. Chem. A, 2009, 113, 1835–1846. [DOI] [PubMed] [Google Scholar]
- 30.Goncharenko KV and Seebeck FP, Chem. Commun, 2016, 52, 1945–1948. [DOI] [PubMed] [Google Scholar]
- 31.Chen L, Naowarojna N, Song H, Wang S, Wang J, Deng Z, Zhao C and Liu P, J. Am. Chem. Soc, 2018, 140, 4604–4612. [DOI] [PMC free article] [PubMed] [Google Scholar]
- 32.Stampfli AR, Goncharenko KV, Meury M, Dubey BN, Schirmer T and Seebeck FP, J. Am. Chem. Soc, 2019, 141, 5275–5285. [DOI] [PubMed] [Google Scholar]
- 33.Faponle AS, Seebeck FP and de Visser SP, J. Am. Chem. Soc, 2017, 139, 9259–9270. [DOI] [PubMed] [Google Scholar]
- 34.Wei W-J, Siegbahn PEM and Liao R-Z, Inorg. Chem, 2017, 56, 3589–3599. [DOI] [PubMed] [Google Scholar]
- 35.Tian G, Su H and Liu Y, ACS Catal., 2018, 8, 5875–5889. [Google Scholar]
- 36.Fischer AA, Stracey N, Lindeman SV, Brunold TC and Fiedler AT, Inorg. Chem, 2016, 55, 11839–11853. [DOI] [PMC free article] [PubMed] [Google Scholar]
- 37.McQuilken AC and Goldberg DP, Dalton Trans., 2012, 41, 10883–10899. [DOI] [PMC free article] [PubMed] [Google Scholar]
- 38.Sallmann M, Siewert I, Fohlmeister L, Limberg C and Knispel C, Angew. Chem. Int. Ed, 2012, 51, 2234–2237. [DOI] [PubMed] [Google Scholar]
- 39.Mueller L, Hoof S, Keck M, Herwig C and Limberg C, Chem. - Eur. J, 2020, 26, 11851–11861. [DOI] [PMC free article] [PubMed] [Google Scholar]
- 40.Blakely MN, Dedushko MA, Poon PCY, Villar-Acevedo G and Kovacs JA, J. Am. Chem. Soc, 2019, 141, 1867–1870. [DOI] [PMC free article] [PubMed] [Google Scholar]
- 41.Gordon JB, McGale JP, Prendergast JR, Shirani-Sarmazeh Z, Siegler MA, Jameson GNL and Goldberg DP, J. Am. Chem. Soc, 2018, 140, 14807–14822. [DOI] [PMC free article] [PubMed] [Google Scholar]
- 42.Kumar D, Sastry GN, Goldberg DP and de Visser SP, J. Phys. Chem. A, 2012, 116, 582–591. [DOI] [PMC free article] [PubMed] [Google Scholar]
- 43.Anandababu K, Ramasubramanian R, Wadepohl H, Comba P, Johnee Britto N, Jaccob M and Mayilmurugan R, Chem. - Eur. J, 2019, 25, 9540–9547. [DOI] [PubMed] [Google Scholar]
- 44.de Visser SP, Quesne MG, Martin B, Comba P and Ryde U, Chem. Commun, 2014, 50, 262–282. [DOI] [PubMed] [Google Scholar]
- 45.Lee Y, Park G-Y, Lucas HR, Vajda PL, Kamaraj K, Vance MA, Milligan AE, Woertink JS, Siegler MA, Narducci Sarjeant AA, Zakharov LN, Rheingold AL, Solomon EI and Karlin KD, Inorg. Chem, 2009, 48, 11297–11309. [DOI] [PMC free article] [PubMed] [Google Scholar]
- 46.Chaignon J, Stiriba S-E, Lloret F, Yuste C, Pilet G, Bonneviot L, Albela B and Castro I, Dalton Trans., 2014, 43, 9704–9713. [DOI] [PubMed] [Google Scholar]
- 47.Sheldrick GM, Acta Crystallogr. Sect. A, 2008, 64, 112–122. [DOI] [PubMed] [Google Scholar]
- 48.Sheldrick GM, SHELXL-97, Program for crystal structure refinement, University of Göttingen, Göttingen, Germany, 1997. [Google Scholar]
- 49.Dolomanov OV, Bourhis LJ, Gildea RJ, Howard JAK and Puschmann H, J. Appl. Crystallogr, 2009, 42, 339–341. [DOI] [PMC free article] [PubMed] [Google Scholar]
- 50.Smith AT, Majtan T, Freeman KM, Su Y, Kraus JP and Burstyn JN, Inorg. Chem, 2011, 50, 4417–4427. [DOI] [PMC free article] [PubMed] [Google Scholar]
- 51.Neese F. ORCA - An Ab Initio, DFT and Semiempirical Electronic Structure Package, version 4.0, Max Planck Institute for Chemical Energy Conversion, Muelheim (Germany), 2017.
- 52.Neese F, Wiley Interdisciplinary Reviews: Computational Molecular Science, 2012, 2, 73–78. [DOI] [PMC free article] [PubMed] [Google Scholar]
- 53.Becke AD, J. Chem. Phys, 1993, 98, 5648–5652. [Google Scholar]
- 54.Lee CT, Yang WT and Parr RG, Physical Review B, 1988, 37, 785–789. [DOI] [PubMed] [Google Scholar]
- 55.Weigend F and Ahlrichs R, Phys. Chem. Chem. Phys, 2005, 7, 3297–3305. [DOI] [PubMed] [Google Scholar]
- 56.Neese F, Wennmohs F, Hansen A and Becker U, Chem. Phys, 2009, 356, 98–109. [Google Scholar]
- 57.Weigend F, Phys. Chem. Chem. Phys, 2006, 8, 1057–1065. [DOI] [PubMed] [Google Scholar]
- 58.Weigend F, J. Comput. Chem, 2008, 29, 167–175. [DOI] [PubMed] [Google Scholar]
- 59.Barone V and Cossi M, J. Phys. Chem. A, 1998, 102, 1995–2001. [Google Scholar]
- 60.Yanai T, Tew DP and Handy NC, Chem. Phys. Lett, 2004, 393, 51–57. [Google Scholar]
- 61.Blaesi EJ, Fox BG and Brunold TC, Biochemistry, 2015, 54, 2874–2884. [DOI] [PMC free article] [PubMed] [Google Scholar]
- 62.Hirata S and Head-Gordon M, Chem. Phys. Lett, 1999, 314, 291–299. [Google Scholar]
- 63.Hirata S and Head-Gordon M, Chem. Phys. Lett, 1999, 302, 375–382. [Google Scholar]
- 64.Romelt M, Ye SF and Neese F, Inorg. Chem, 2009, 48, 784–785. [DOI] [PubMed] [Google Scholar]
- 65.The “core properties” basis set is derived from the TurboMole DZ basis set developed by Ahlrichs and coworkers.
- 66.Bowers EV, Murphy GS, Till SN, VandenBussche CJ, Yaroschak MM, Pike RD, Butcher RJ and Bebout DC, Dalton Trans., 2014, 43, 16475–16485. [DOI] [PubMed] [Google Scholar]
- 67.Chen K and Que L Jr., J. Am. Chem. Soc, 2001, 123, 6327–6337. [DOI] [PubMed] [Google Scholar]
- 68.Lange SJ, Miyake H and Que L Jr., J. Am. Chem. Soc, 1999, 121, 6330–6331. [Google Scholar]
- 69.Zang Y, Kim J, Dong Y, Wilkinson EC, Appelman EH and Que L Jr., J. Am. Chem. Soc, 1997, 119, 4197–4205. [Google Scholar]
- 70.Based on an analysis of structures in the Cambridge Crystallographic Data Centre.
- 71.Addison AW, Rao TN, Reedijk J, Vanrijn J and Verschoor GC, J. Chem. Soc., Dalton Trans, 1984, 1349–1356. [Google Scholar]
- 72.Biswas AN, Puri M, Meier KK, Oloo WN, Rohde GT, Bominaar EL, Munck E and Que L, J. Am. Chem. Soc, 2015, 137, 2428–2431. [DOI] [PubMed] [Google Scholar]
- 73.Munck E, in Physical Methods in Bioinorganic Chemistry: Spectroscopy and Magnetism, ed. Que L, University Science Books, Sausalito, CA, 2000, pp. 287–319. [Google Scholar]
- 74.Fiedler AT, Halfen HL, Halfen JA and Brunold TC, J. Am. Chem. Soc, 2005, 127, 1675–1689. [DOI] [PubMed] [Google Scholar]
- 75.Badiei YM, Siegler MA and Goldberg DP, J. Am. Chem. Soc, 2011, 133, 1274–1277. [DOI] [PMC free article] [PubMed] [Google Scholar]
- 76.Fischer AA, Lindeman SV and Fiedler AT, Chem. Commun, 2018, 54, 11344–11347. [DOI] [PMC free article] [PubMed] [Google Scholar]
- 77.Luu TXT, Nguyen T-TT, Le TN, Spanget-Larsen J and Duus F, J. Sulfur Chem, 2015, 36, 340–350. [Google Scholar]
- 78.Keshari T, Kapoorr R and Yadav LDS, Synlett, 2016, 27, 1878–1882. [Google Scholar]
- 79.Natarajan P, Tetrahedron Lett, 2015, 56, 4131–4134. [Google Scholar]
- 80.Reddy RJ, Kumar JJ and Kumari AH, Eur. J. Org. Chem, 2019, 2019, 3771–3775. [Google Scholar]
- 81.Enemark JH and Feltham RD, Coord. Chem. Rev, 1974, 13, 339–406. [Google Scholar]
- 82.Chiou YM and Que L, Inorg. Chem, 1995, 34, 3270–3278. [Google Scholar]
- 83.Jackson TA, Yikilmaz E, Miller AF and Brunold TC, J. Am. Chem. Soc, 2003, 125, 8348–8363. [DOI] [PubMed] [Google Scholar]
- 84.Park H, Bittner MM, Baus JS, Lindeman SV and Fiedler AT, Inorg. Chem, 2012, 51, 10279–10289. [DOI] [PMC free article] [PubMed] [Google Scholar]
- 85.Wasinger EC, Davis MI, Pau MYM, Orville AM, Zaleski JM, Hedman B, Lipscomb JD, Hodgson KO and Solomon EI, Inorg. Chem, 2003, 42, 365–376. [DOI] [PubMed] [Google Scholar]
- 86.Berto TC, Speelman AL, Zheng S and Lehnert N, Coord. Chem. Rev, 2013, 257, 244–259. [Google Scholar]
- 87.Berto TC, Hoffman MB, Murata Y, Landenberger KB, Alp EE, Zhao JY and Lehnert N, J. Am. Chem. Soc, 2011, 133, 16714–16717. [DOI] [PubMed] [Google Scholar]
- 88.Villar-Acevedo G, Nam E, Fitch S, Benedict J, Freudenthal J, Kaminsky W and Kovacs JA, J. Am. Chem. Soc, 2011, 133, 1419–1427. [DOI] [PMC free article] [PubMed] [Google Scholar]
- 89.McQuilken AC, Matsumura H, Durr M, Confer AM, Sheckelton JP, Siegler MA, McQueen TM, Ivanovic-Burmazovic I, Moenne-Loccoz P and Goldberg DP, J. Am. Chem. Soc, 2016, 138, 3107–3117. [DOI] [PMC free article] [PubMed] [Google Scholar]
- 90.Clay MD, Cosper CA, Jenney FE Jr., Adams MWW and Johnson MK, Proc. Natl. Acad. Sci. U. S. A, 2003, 100, 3796–3801. [DOI] [PMC free article] [PubMed] [Google Scholar]
- 91.Li J, Banerjee A, Pawlak PL, Brennessel WW and Chavez FA, Inorg. Chem, 2014, 53, 5414–5416. [DOI] [PubMed] [Google Scholar]
- 92.Lewandowska H, Kalinowska M, Brzoska K, Wojciuk K, Wojciuk G and Kruszewski M, Dalton Trans., 2011, 40, 8273–8289. [DOI] [PubMed] [Google Scholar]
- 93.Tsai M-L, Tsou C-C and Liaw W-F, Acc. Chem. Res, 2015, 48, 1184–1193. [DOI] [PubMed] [Google Scholar]
Associated Data
This section collects any data citations, data availability statements, or supplementary materials included in this article.