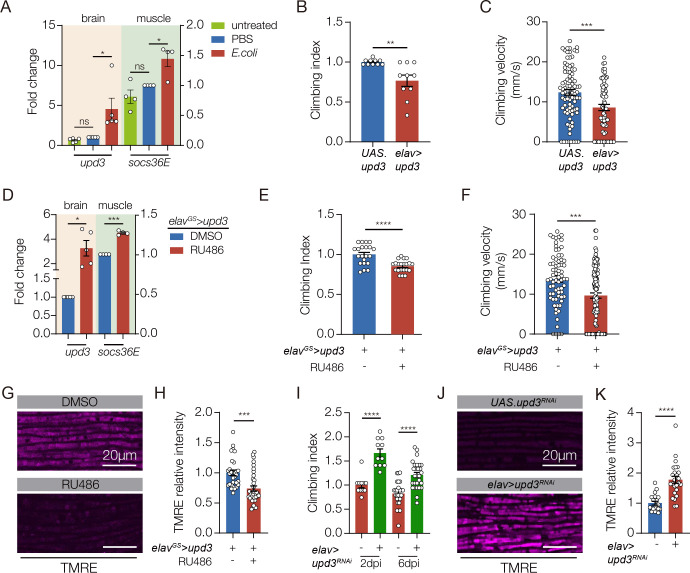
Figure 2. Neuroinflammation activates a Upd3 brain-muscle signaling axis.
A. qRT-PCR. Untreated and sterile-injected control flies expressed less upd3 in the brain and less socs36e in indirect flight muscles than E. coli injected flies at 7 days post injection (dpi). B. Climbing index. elav>upd3 flies showed reduced climbing capacity compared to controls (UAS.upd3). C. Climbing velocity. elav>upd3 flies climbed slower than controls. D-G. elavGS.Gal4 was activated in adult flies with RU486 to induce upd3 expression in the CNS. D. qRT-PCR. elavGS>upd3 flies treated with RU486 showed more upd3 in the brain and more socs36e in indirect flight muscles than flies treated with DMSO. E. Climbing index. elavGS>upd3 flies treated with RU486 showed reduced climbing capacity compared to DMSO treated controls. F. Climbing velocity. elavGS>upd3 flies treated with RU486 climbed slower than controls. G. Confocal micrographs of indirect flight muscles stained with TMRE (violet) to assess mitochondrial membrane potential. Muscles from elavGS>upd3 flies treated with RU486 showed less TMRE staining than DMSO treated controls. H Quantification of the TMRE signal shown in G. I. Climbing index. upd3RNAi was used to knock down Upd3 expression in the CNS of E. coli infected flies. Infected flies with reduced Upd3 expression (elav>upd3 RNAi) showed improved climbing capacity compared to controls at 2- and 6- dpi. J. Confocal micrographs of indirect flight muscles stained with TMRE (violet). Infected flies with reduced Upd3 expression (elav>upd3 RNAi) showed improved mitochondrial membrane potential compared to controls at 6dpi. K. Quantification of the TMRE signal shown in J. Significance was determined by one-way ANOVA (A), two-sided unpaired student’s t-test (B-H), and two-way ANOVA (I). For qRT-PCR, data points represent biological replicates, with n≥5 flies per cohort. See Fig. 1 legend for Climbing Index and TMRE data points. Error bars represent SEM. (*) p< 0.05, (**) p< 0.01, (***) p< 0.001, (****) p < 0.0001, (ns) non-significant.

