

SUMMARY
Determining genes that orchestrate cell differentiation in development and disease remains a fundamental goal of cell biology. This study establishes a genome-wide metric based on the gene-repressive trimethylation of histone H3 at lysine 27 (H3K27me3) across hundreds of diverse cell types to identify genetic regulators of cell differentiation. We introduce a computational method, TRIAGE, which uses discordance between gene-repressive tendency and expression to identify genetic drivers of cell identity. We apply TRIAGE to millions of genome-wide single-cell transcriptomes, diverse omics platforms, and eukaryotic cells and tissue types. Using a wide range of data, we validate the performance of TRIAGE in identifying cell-type-specific regulatory factors across diverse species including human, mouse, boar, bird, fish, and tunicate. Using CRISPR gene editing, we use TRIAGE to experimentally validate RNF220 as a regulator of Ciona cardiopharyngeal development and SIX3 as required for differentiation of endoderm in human pluripotent stem cells. A record of this paper’s transparent peer review process is included in the Supplemental Information.
In Brief
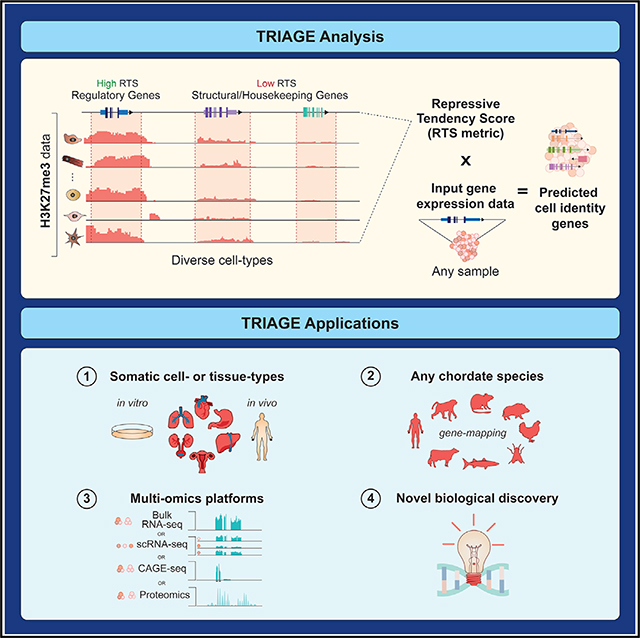
Perturbing genes controlling cell decisions have major implications in development or disease. However, identifying key regulatory genes from the thousands expressed in a cell is challenging. TRIAGE is a computational method that distills patterns of epigenetic repression across diverse cell types to infer regulatory genes using input gene expression data from any cell type. Demonstrating its utility, we combine single-cell RNA-seq and TRIAGE to identify and experimentally confirm novel regulators of heart development in evolutionarily distant species.
Graphical Abstract
INTRODUCTION
Cellular identity is controlled by an interplay of regulatory molecules that cause changes in gene expression across the genome (Morris and Daley, 2013). Histone modifications (HMs) activate or repress genes to guide cellular decisions during differentiation and homeostasis via mechanisms that are partially conserved across species (Boyer et al., 2006; Margueron and Reinberg, 2011; Nakamura et al., 2014; Alexanian et al., 2017). HMs have been found to be structurally and functionally linked to cell-type-specific genome architecture and gene regulation (Rehimi et al., 2016; Cahan et al., 2014). Trimethylation of histone H3 at lysine 27 (H3K27me3) is a chromatin mark deposited by the polycomb repressive complex-2 (PRC2) to suppress the expression of genes (Margueron and Reinberg, 2011). The interplay of epigenomic control of gene expression by H3K27me3 and other activating histone marks, such as H3K4me3, guide cell lineage decisions to derive specific functional cell types (Van Handel et al., 2012). Computational methods using genome-wide measures of chromatin state and gene expression could therefore enable efficient prediction of genes controlling cellular decisions (Benayoun et al., 2014; Rehimi et al., 2016; Whyte et al., 2013). These strategies have played critical roles in the advancement of cell biology fields to inform the genetic basis of cell reprogramming and differentiation (Takahashi and Yamanaka, 2006).
Here, we demonstrate that a computational method formulated using the repressive tendency via H3K27me3 strongly predicts genes that control cell differentiation decisions. The method draws on the principle that cell differentiation decisions are mediated in large part by selective epigenetic repression of regulatory genes (Stergachis et al., 2013). Genes that are repressed in many cell types are likely to play a key regulatory role in the rare cell types in which the gene is expressed. When measured across diverse cell types, the selective absence of broad H3K27me3 domains can therefore be used to predict cell-type-specific genetic regulators. We show that the method can analyze millions of heterogeneous cell transcriptomes simultaneously to infer cell-type-specific regulatory genes from diverse animal species. The approach we take departs from, and complements, analyses that require two or more relevant cellular conditions to be assayed. Instead, we draw on the cellular diversity represented in existing consortia of epigenetic data as a background to evaluate genome-wide features of genetic regulation sourced from individual cell types. Analytical tools like these that evaluate patterns of genome regulation in the context of cellular diversity will enhance our capacity to understand the mechanistic basis of cellular heterogeneity in development, homeostasis, and disease conditions.
RESULTS
Cell-Type-Specific Regulatory Genes Have Broad H3K27me3 Domains in Diverse Cell Types
We set out to test the hypothesis that analyzing the genomes of diverse cell and tissue types could be used to determine variation in epigenetic control of genes underpinning cell differentiation. We used NIH Epigenome Roadmap data (Roadmap Epigenomics Consortium et al., 2015), which contains ChIP-seq analysis of H3K4me3, H3K36me3, H3K27me3, H3K4me1, H3K27ac, and H3K9me3 from 111 tissue or cell types (Table S1). To associate HMs with genes, we linked the single broadest HM domain based on overlap with a RefSeq gene-body plus 2.5 kb upstream of its transcriptional start site (Figure S1A). For each HM, we found that genes associated with the broadest domain were remarkably consistent between cell types (Figure S1B); however, broad domains of different HMs marked distinct sets of genes (Figure S1C).
Next, we assessed the breadth of histone domains in each of the 111 samples as they correlate with genes that control cell-type-specific functions. To establish a positive gene set for cell-type-specific regulatory genes, we populated a list of 634 variably expressed transcription factors (VETFs) having a coefficient of variation greater than 1 across 46 NIH Epigenome Roadmap RNA-seq datasets (Pérez-Lluch et al., 2015) (Table S2). We used Shannon entropy to quantify cell type specificity (Schug et al., 2005) and demonstrate that VETFs are significantly more cell-type-specific, compared to non-VETFs (p = 4.31e–230, one-tailed Wilcoxon rank-sum test), or protein-coding genes (p = 1.55–108), and their expression is more negatively correlated to the H3K27me3 breadth (Figures S1D and S1E). We showed that VETFs are highly consistent with a set of 713 tissue-specific TFs that were independently identified from 233 tissue groups (p < 2.2e–16, hypergeometric test) (D’Alessio et al., 2015). Taken together, VETFs provide a positive gene set where their enrichment is a performance metric for identifying cell-type-specific regulatory genes.
To calculate the enrichment of cell-type-specific regulatory genes as they relate to HM domains, all HM domains assigned to genes were ranked by breadth and analyzed using Fisher’s exact test to assess enrichment of VETFs. These data showed that broad H3K27me3 domains are strongly enriched for VETFs (Figures 1A and S1F), consistent with a correlation between repression of VETFs and breadth of H3K27me3 domains (Figure S1E). Furthermore, unsupervised analysis of genes marked by the broadest H3K27me3 domains showed that they are uniquely enriched in morphogenic and developmental regulators (Figure 1B). These regulatory genes have broad H3K27me3 repression in many cell types to preclude them from being mis-expressed and therefore providing an epigenetic mechanism controlling their expression. Taken together, this demonstrates that H3K27me3 broad domains as measured across diverse cell and tissue types provide a strategy to enrich for cell-type-specific regulatory genes.
Figure 1. Tissue- and Cell-Type-Regulatory Genes Are Associated with Broad H3K27me3.

(A) Variably expressed transcription factors (VETFs) are strongly associated with broad H3K27me3 domains. Genes (n = 26,833) are associated with a single, broadest, proximal histone modification (HM) domain and ranked by the breadth of the associated HM domain across 111 NIH Roadmap Epigenomics Project tissue or cell types. Genes are grouped into percentile bins. Mean enrichment of VETFs with the 95% confidence interval is shown (y axis). p = 6.66e-16 at top 5% broadest H3K27me3 domains, by one-tailed Fisher’s exact test.
(B) GO biological process enrichment of the top 200 genes most frequently associated with the top 5% of the broadest HM domains across 111 cell types (one-tailed Fisher’s exact test). H3K27me3 broad domains are enriched for cell regulatory genes.
(C) Gene expression level (left) and the H3K27me3 domain breadth (right) for selected cardiac-specific regulatory genes and structural genes across 18 roadmap tissue samples; heart (E095, E104, E105), brain (E070, E071, E082), epithelial (E057, E058, E059), blood (E037, E038, E047), ES cell (E003, E016, E024), and ES-derived (E004, E005, E006). Gene expression distinguishes cardiac-specific genes, whereas the selective absence of H3K27me3 broad domains distinguishes cardiac-specific regulatory genes from structural genes.
(D) HM depositions in a cardiac regulatory gene NKX2–5 and structural gene MYH7 (−2.5kb upstream of the TSS to +25kb downstream). Data are ranked based on the size of the histone domain with 111 epigenome roadmap cell types stacked vertically. Consistent deposition of broad H3K27me3 domains across diverse cell types distinguishes cell-type-specific regulatory genes from structural genes.
To illustrate the distinctive enrichment of H3K27me3 in regulatory genes as opposed to structural or housekeeping genes, we extracted expression and chromatin data from cardiomyocytes (Figures 1C and 1D). The transcript abundance of cardiac regulatory TFs (i.e., GATA4, GATA6, NKX2–5, TBX5, and TBX20) and structural sarcomere genes (i.e., MYH6, MYH7, MYL2, MYL3, and TNNI3) are all elevated in cardiac cells compared to other cell types but cannot be distinguished as regulatory or structural genes except by differential expression (Figure 1C). In contrast, in all cell types except the heart, H3K27me3 domains broader than 30 kb consistently identify cardiac regulatory genes from structural genes (Figure 1C). No other HM analyzed demarcates cell-type-specific regulatory genes from structural genes in this manner (Figures 1D and S1G). This establishes the rationale that genes having cell-type-specific regulatory functions can be identified based on the frequency of H3K27me3 across the locus in heterogeneous cell types.
The Repressive Tendency of a Gene Defines a Genome-Wide Metric Predictive of Cell-Type-Specific Regulatory Genes
We established a simple, quantitative logic that leverages the significance of broad H3K27me3 domains for distinguishing regulatory genes: broad H3K27me3 domains occur predominantly over critical cell-type-specific regulatory genes; depositing this mark sets the default gene activity to “off” such that the cell-type-specific expression requires selective removal of H3K27me3 (Boyer et al., 2006; Lee et al., 2006). Conversely, genes with housekeeping or non-regulatory roles rarely host broad H3K27me3 domains.
To implement this concept, we calculated for each gene in the genome across 111 NIH epigenome cell and tissue types (1) the total lengths (breadths) of H3K27me3 domains in base pairs and multiplied this by (2) the proportion of cell types in which the gene’s H3K27me3 breadth is within the top 5% of broad domains (Figure 2A); this is justified on the basis of the ~4–8% thresholds that show similar, high level of recovery of regulatory factors (Figures 1A and S2A). This analysis assigns a single value to every gene, which we call its “repressive tendency score (RTS)” that defines its association with broad H3K27me3 domains (Table S3). Using the NIH Epigenome Roadmap data, the RTS was calculated for 99.3% (or 26,833 genes) of all RefSeq genes. To demonstrate that this formulation is agnostic to the composition of cell types, we note that for all genes the RTS is within one standard deviation of the mean of bootstrapping empirical distribution derived from 10,000 re-samplings of cell types. We note that the 111 cell types provide a sufficient sample size to calculate a stable RTS, independent of the peak calling method to define H3K27me3 domains (Figures S2B and S2C), with over 85% of assigned H3K27me3 domains overlapping only a single protein-coding gene (Figure S2D). Using a subsampling approach, we show that the RTS can be calculated from approximately as few as 60 randomly selected but distinct cell and tissue types (Figures S2F and S2G). The gene-centric measure is an aggregate of broad H3K27me3 domains around each gene across diverse cell types. Making use of the recently released EpiMap data comprising 18 genome-wide features from 834 cell and tissue types (Adsera et al., 2019), we show that RTSs are highly consistent regardless of whether the input samples are comprised of cell lines, embryonic or adult samples, or healthy and diseased cell types (Figure S2H).
Figure 2. Genes Governing Development Are Frequently Associated with Broad H3K27me3 Domains.

(A) Schematic diagram showing steps for using 111 NIH Roadmap Epigenomics samples to calculate the RTS for protein coding genes.
(B) (Top) distribution of the RTS. Red dashed line is the inflection point on the interpolated curve (RTS = 0.03) above which genes exhibit increased RTS (n = 1,359). (Bottom) GO biological process enrichment in genes ranked by the RTS (one-tailed Fisher’s exact test; Table S4 for the full list).
(C) High RTS-ranked genes are associated with cell/tissue specificity. Each rank bin includes 100 genes and used to calculate the proportion of cell types where a given gene is expressed (RPKM > 1). The average proportion is calculated for each rank bin with the 95% confidence interval shown.
(D) High RTS genes tend to be lowly expressed. Each rank bin includes 100 genes and the average expression value for each bin is shown with the 95% confidence interval.
(E) VETFs are significantly associated with a high RTS (for example, p < 2.2e–16 at the first rank position (top 1%), one-tailed Fisher’s exact test). Each rank bin includes 1% of all RefSeq genes with RTS (n = 26,833). Red dashed line shows the uniform distribution (proportion = 0.01).
(F) High RTS genes are enriched in regulators of development and disease processes across all organ systems (Table S4 for the full list). Each rank bin includes 1% of all RefSeq genes (n = 26,833). Asterisks indicate significant enrichment of a given GO term within the top 10% genes (Benjamini-Hochberg FDR < 0.05, one-tailed Fisher’s exact test).
Using values above the inflection point (RTS > 0.03) of the interpolated RTS curve, we identified a priority set of 1,359 genes (Figure 2B). These genes show significant enrichment for cell-type-specific, lowly expressed regulators of cellular diversification including organ development, pattern specification, and multicellular organismal processes (Figures 2B–2D). Among the 1,359 priority genes, we identified enrichment of VETFs (odds ratio = 13.85, p = 3.2e–151, one-tailed Fisher’s exact test) (Figure 2E), homeobox proteins (Zhong and Holland, 2011) (odds ratio = 37.42, p = 7.98e–135), and KEGG signaling genes (Kanehisa and Goto, 2000) (odds ratio = 2.66, p = 1.73e–13). The priority set also comprises non-coding RNAs including known regulators of development such as FENDRR and HOTAIR (Grote and Herrmann, 2013; Rinn et al., 2007). Furthermore, genes with high RTS values are enriched in regulators of biological processes including gastrulation and organ morphogenesis and comprise members of major signaling pathways and genetic determinants of diverse pathologies, including cardiovascular disease, diabetes, neurological disorders, and cancer (Figure 2F; Table S4). In addition, we evaluated the biological significance of perturbing genes with a high or low RTS by analyzing an independent data resource containing 714 transgenes (including 481 TFs) conditionally overexpressed in hESCs subsequently analyzed by RNA-seq or microarray (Figure S3A) (Nakatake et al., 2020). Overexpression of high RTS genes resulted in a significantly higher number of differentially expressed genes, showing greater perturbation of the transcriptome, compared to low RTS genes (p ≤ 0.0001, two-tailed) (Figures S3B and S3C). Ranking genes based on RTSs is a simple strategy to enrich for genetic factors controlling cell-type-specific differentiation and function.
Applying the RTS to Orthologous Gene Expression Data Infers Regulatory Genes of That Cell
The transcriptome of a cell is composed of diverse cell-type-specific structural, housekeeping, and regulatory genes. The expression of regulatory genes, such as transcription factors (TFs), is difficult to detect, and changes are harder to quantify owing to their typical low abundance relative to structural and housekeeping genes. To enable genes to be ranked based on their regulatory potential, we sought to calculate an adjusted abundance measure for a gene that accounts for that gene’s expression level observed in a foreground population of cells or a single cell and its tendency of being epigenetically repressed across a background of cell types. For any gene (i), the product between its expression value (Yi) and its RTS (RTSi) gives rise to its discordance score (DSi); this defines a method we call TRIAGE (transcriptional regulatory inference analysis of gene expression):
The discordance score (DS) represents a gene’s tendency to be epigenetically repressed and the observed transcriptional abundance of that gene in orthologous-input gene expression data. TRIAGE does not require an index cell type reference; instead, it uses the repressive tendency collected from a diverse spectrum of cell and tissue types to linearly amplify or attenuate the measure of gene abundance from any orthologous input sample (Figures 3A, S2E, S3D, and S3E).
Figure 3. TRIAGE: An Unsupervised Strategy to Infer Cell-Type-Specific Regulatory Factors from Gene Expression Input Alone.

(A) Schematic illustrating TRIAGE analysis of gene expression input data to generate a DS for the prioritization of genes based on regulatory potential from orthologous gene expression datasets.
(B) Regulatory genes with broad H3K27me3 domains (in base pairs) as exemplified by selected tissue type-specific regulatory, structural, and housekeeping genes.
(C) TRIAGE prioritizes tissue type-specific regulatory genes and reduces the relative abundance of housekeeping and structural genes. Average expression values (Exp.) from selected GTEx tissue samples transformed by TRIAGE (Dis.).
(D) Across 46 roadmap Epigenomics samples, TRIAGE significantly enriches for VETFs (p < 2.2e–16, one-tailed Fisher’s exact test) but reduces the proportion of housekeeping genes (p < 2.2e–16, one-tailed Wilcoxon rank-sum test) at the top 1% RTS rank position. Average values from roadmap cell types are shown, with the 95% confidence interval scale bar.
(E) TRIAGE enriches for regulators of heart development (GO:0007507) among genes ranked by the TRIAGE DS (red) compared to original expression (cyan) in cardiac RNA-seq samples from diverse animal species (one-tailed Fisher’s exact test).
(F) TRIAGE enriches for tissue-specific developmental GO terms among top 100 genes ranked by the DS (red) compared to original expression (cyan) across diverse animal species (one-tailed Fisher’s exact test). Hyphen (−) indicates no dataset available.
As expected, analysis of cell-specific genes across 111 NIH Epigenome Roadmap samples shows that H3K27me3 broad domains reproducibly mark regulatory genes as opposed to structural or housekeeping genes (Figure 3B). Using RNA-seq data transformed with RTSs, we showed that TRIAGE efficiently reduces the relative abundance of structural and housekeeping genes while enriching for regulatory genes in a cell-type-specific manner (Figures 3C and S3F). TRIAGE transformation of 46 roadmap RNA-seq samples resulted in enrichment of tissue or cell-type-specific TFs among the top 1% in every cell type, while it reduced the relative abundance of housekeeping genes (Figure 3D). Analysis of the Pearson correlation distances between Roadmap tissue types (Scornavacca et al., 2011) showed that TRIAGE increases the similarity between samples from the same tissue by ~29% when compared to distances calculated using absolute expression levels (Figure S3G).
RTSs Identify Cell-Identity Genes from Diverse Tissues and Species
Genetic mechanisms that control cell decisions are highly evolutionarily conserved. Using inter-species gene mapping, we tested whether TRIAGE could identify regulatory drivers of heart development across diverse chordate species including mammals (i.e., Homo sapiens, Mus musculus, and Sus scrofa), bird (Gallus gallus), fish (Danio rerio), and invertebrate tunicate (Ciona robusta) (Figure 3E). In contrast to the expression alone, TRIAGE accurately recovered cardiac regulatory genes across all species. More broadly, we used TRIAGE to enrich for relevant tissue morphogenesis biological processes from diverse cell types and species including arthropods (Figure 3F). Although TRIAGE is currently devised using human epigenetic data, these data show that TRIAGE can be used to identify regulatory genes from cell types that are conserved across the animal kingdom.
RTS Analyses Infer Regulatory Control Points of Disease
Cell differentiation decisions in development are commonly re-activated in disease contexts to drive cell differentiation decisions in response to cell stress (Rajabi et al., 2007). Indeed, analysis of high-RTS genes shows enrichment in disease-related KEGG pathways and ClinVar disease terms, including both congenital and acquired disorders (Figure S4A). Next, we used TRIAGE to analyze two disease datasets: single-cell RNA-seq data of melanoma (Tirosh et al., 2016); and RNA-seq data of hearts, where pre-established heart failure (transverse aortic constriction, TAC) was treated with JQ1, a small molecule BET inhibitor known to prevent pathological cardiac remodeling (Anand et al., 2013; Duan et al., 2017). We show that among the top ranked genes, TRIAGE, using independently derived positive gene sets, consistently prioritizes genes with known involvement in skin development and melanoma pathogenesis (Tirosh et al., 2016; Verfaillie et al., 2015) (Figures S4B and S4C), as well as enrichment of stress-associated gene ontology (GO) pathways (Figures S4D and S4E). TRIAGE-based ranked genes highlighted the potent anti-fibrotic effect of JQ1 without the use of canonical differential expression analysis (Figure S4E). While disease responses are complex and involve de novo chromatin changes not represented in the reference healthy cell and tissue types collated in the Epigenome Roadmap, these data demonstrate that TRIAGE can provide a strategy to study mechanistic processes in disease.
TRIAGE Provides a Unique Vantage Point into Genomic Data
We compared the data analysis pipelines of TRIAGE with various benchmark genomic analysis methods that also rely on reference to epigenetic information including functional heterogeneity (FH) analysis (Rehimi et al., 2016), H3K4me3 broad domains (Benayoun et al., 2014), and super-enhancers (Hnisz et al., 2013; Lovén et al., 2013; Whyte et al., 2013) (Figure 4A). TRIAGE is unique among these analytical approaches in that it requires only gene expression data without the need for epigenetic sequencing input. Notably, comparison of the overlap of genes prioritized by these approaches across different tissue types reveals largely non-overlapping gene sets (Figure 4B; Table S5). For example, among genes identified within each method, TRIAGE distinctively detects the largest number of cardiac TFs, many known to be central regulators of cardiac morphogenesis including IRX4, GATA5, TBX5, MSX1, and EOMES (Figure 4B) (Waardenberg et al., 2014; Takeuchi and Bruneau, 2009; Russ et al., 2000). Consistent with this, TRIAGE performs well when compared with these methods in terms of sensitivity and precision in identifying cell-type-specific regulatory genes (Figures 4C, 4D, and S5A–S5D; Tables S6, S7, and S8). These data demonstrate that TRIAGE captures gene sets distinct from other epigenetic analysis strategies and therefore provides an effective and complementary approach for evaluating genomic data in coordination with routine analysis pipelines.
Figure 4. TRIAGE Identifies Unique Genomic Regulatory Features that Complement Those of Other Methods.

(A) Schematic diagrams of computational approaches to infer cell identity genes using epigenomic and/or transcriptomic data with TRIAGE, FH Score, H3K4me3, or super-enhancers.
(B) Venn diagrams demonstrate that different epigenetic prediction methods capture distinct gene sets across multiple tissues.
(C) Receiver operating characteristic (ROC) plots indicate that TRIAGE consistently recovers tissue-specific regulatory genes. Area-under-curve (AUC) values are shown at the bottom right corner of the plot.
(D) TRIAGE improves on super-enhancers prioritizing genes for developmental and morphogenesis processess across diverse cell and tissue types.
RTSs Reveal the Mechanistic Basis of Cell Heterogeneity at Single-Cell Resolution
Recent developments in barcoding and multiplexing have enabled scalable analysis of thousands to millions of cells (Cao et al., 2019). Obtaining mechanistic information from diverse cell subtypes by using single-cell analytics remains a challenge. TRIAGE does not require epigenetic data for a cell of interest, making it applicable to any bulk or single-cell transcriptomic data input.
We analyzed 43,168 cells captured across a 30-day time course of in vitro cardiac-directed differentiation of human pluripotent stem cells (hPSCs) (Friedman et al., 2018). Analysis of day-30 cardiomyocytes using standard expression data shows that high-abundance genes are dominated by housekeeping and sarcomere genes, whereas TRIAGE efficiently identified cardiomyocyte regulatory genes including NKX2–5, HAND1, GATA4, and IRX4 (Figures 5A and 5B). Notably, TRIAGE retained highly expressed cell-type-specific structural genes providing an integrated readout of genes involved in cell regulation and function (Figure 5C). We used TRIAGE to simultaneously convert single-cell expression data comprising ten different cell subpopulations spanning gastrulation stage, progenitor, and definitive cell types (Figure 5D). In contrast to the expression data, which significantly enriches for structural and housekeeping genes, TRIAGE consistently identifies gene sets associated with developmental regulation of diverse and biologically distinct subpopulation through differentiation (Figures 5E, S6A, and S6B). We show that differential expression analysis results in outcomes that depend heavily on the comparison cell type, whereas TRIAGE identifies population-specific regulatory genes without external reference comparisons (Figure 5F). Finally, we show that TRIAGE predictions are not explained merely by prioritizing expressed TFs (Figures S5E and S5F; Table S9), indicating the capability of TRIAGE to filter out housekeeping TFs that do not govern cell-type-specific functions.
Figure 5. TRIAGE Enables Analyses of Large Single-Cell and Multi-omics Datasets.

(A) RNA-seq analysis of cardiomyocytes based on RNA expression (left) and gene DSs after TRIAGE analysis (right) where genes are ordered by their expression. TRIAGE reveals known cardiac regulators that are lowly ranked based on original input gene expression.
(B) Top 10 genes ranked based on their RNA expression (left) and TRIAGE (right) analyses of hiPSC derived cardiomyocytes (Friedman et al., 2018).
(C) Distribution of selected groups of genes, including housekeeping, heart signaling (genes with the heart development term GO:0007507 and at least one KEGG signaling pathway term), sarcomere (genes with the sarcomere term GO:0030017), and heart TFs (TFs with the heart development term GO:0007507) when ranked by their RNA expression value (left) and gene discordance score after TRIAGE analysis (right). Each rank bin includes 1% of all expressed genes in the dataset. Enrichment of a given group is calculated for each rank bin relative to all genes (one-tailed Fisher’s exact test).
(D) Analyses of single-cell RNA-seq over a time course of cardiac differentiation from pluripotency by clustering of cells from RNA expression (left) and TRIAGE (right).
(E) During in vitro mesendoderm differentiation (y axis) RNA expression enriches for structural and housekeeping genes, and TRIAGE enriches for GO’s biological process terms related to cell-type-specific regulatory developmental processes (one-tailed Fisher’s exact test).
(F) TRIAGE (red) enriches for developmental terms among top ranked genes compared to expression (blue) or differential gene expression (green or purple).
(G) TRIAGE enriches for VETFs across diverse scRNA-seq sequencing platforms (i.e., Smart-seq2 or Droplet 10X chromium) and scales to analyze millions of cells in the mouse organogenesis cell atlas (MOCA). Genes are sorted by either RNA expression or TRIAGE and then grouped into a percentile bin. Enrichment of VETFs for each sample is summarized by the most significant p value (y axis) at the corresponding rank bin position (x axis).
(H) TRIAGE accurately clusters scRNA-seq data compared to original RNA expression data evaluated using ground truth analysis captured using Mixology datasets (Tian et al., 2019).
(I) TRIAGE used for analysis of diverse data types and separation of VETFs where gene expression is quantified, including CAGE-seq, proteomics, and H3K36me3 tag density.
TRIAGE Is Applicable to Diverse Omics Data Types and is Scalable to Large Single-Cell Datasets
We tested the utility of TRIAGE using different genomic and proteomic data types. Using the Tabula Muris data of nearly 100,000 cells from 20 different mouse tissues at single-cell resolution (Tabula Muris Consortium et al., 2018), TRIAGE consistently enriches for cell-type-specific regulatory genes compared to original expression with no difference between Droplet 10X chromium and Smart-seq2 datasets (Figure 5G; Table S10). Analysis of the mouse organogenesis cell atlas (MOCA; Cao et al., 2019) data demonstrates that TRIAGE prioritizes cell-type-specific regulatory genes in a scalable manner across more than 1.3 million mouse single-cell transcriptomes (p < 2.2e–16, one-tailed Wilcoxon rank-sum test for both median significance and rank; Figure 5G). Finally, to assess the performance of TRIAGE we evaluated the accuracy of single-cell clustering based on ground truth (Tian et al., 2019) using three independent algorithms (i.e., CORE, sc3, and Seurat). We show that there is no difference in accurately assigning cells to the reference (ARI > 0.98) using original expression or TRIAGE transformed expression (Figure 5H).
We hypothesized that TRIAGE could be used to study any genome-wide quantitative measurement of gene expression. We applied TRIAGE to 17,382 GTEx (v8) samples covering diverse cell and tissue types (GTEx Consortium, 2013). Compared to the original expression values, TRIAGE prioritizes genes with tissue specific developmental functions (Figures S7A and S7B; Table S11). This finding was consistently observed across diverse omics data types that measure gene abundance. For example, TRIAGE outperforms original abundance metrics when measuring chromatin methylation for H3K36me3, a surrogate of RNA polymerase II activity deposited across gene bodies (Barski et al., 2007) collected from the 111 Roadmap samples (Table S12; Figure 5I). We used data from FANTOM5 (FANTOM Consortium and the RIKEN PMI and CLST (DGT) et al., 2014; D’Alessio et al., 2015) to analyze cap analysis of gene expression (CAGE), a measure of genome-wide 5′ transcription activity. These data show that TRIAGE enriches for tissue-specific TFs (Figures 5I and S8A–S8C; Table S13) as well as tissue-specific GO biological process terms compared to CAGE input data (Table S14). Finally, analysis of a draft map of the human proteome shows that TRIAGE enriches for regulatory drivers of 30 different tissue types from high resolution Fourier transform mass spectrometry data (Kim et al., 2014; Table S15). These findings illustrate that TRIAGE predicts regulatory drivers of cells using diverse genome-wide multi-omic endpoints.
TRIAGE for Novel Gene Discovery
We set out to demonstrate TRIAGE as an engine for gene discovery. We used a multi-step strategy involving analysis of TRIAGE-derived discordance scores, RTSs, and prior literature to identify candidate genes governing cell differentiation (Figure S9A). We focused on TFs and signaling molecules that are known to act as upstream regulators of broad gene networks that guide cell differentiation decisions. Using data from single-cell analysis of cardiac differentiation (Friedman et al., 2018), we analyzed day-2 subpopulations and identified diverse, known regulatory genes governing mesendoderm cell differentiation (Figure 6A). Among the TRIAGE-identified genes was SIX3, a member of the sine oculis homeobox TF family (RTS = 0.54; Figures 6C S9A, and S9B). Though the role of SIX3 in neuroectoderm specification has been studied extensively, little is known about its role in other germ layer derivatives (Lagutin et al., 2003; Carl et al., 2002; Steinmetz et al., 2010). Analysis of SIX3 in hPSC in vitro cardiac differentiation shows robust expression in day-2 mesendoderm cell populations (Figures 6A, S9C, and S9D). We analyzed the spatiotemporal transcriptional data from germ layer cells of mouse embryos (Peng et al., 2016, 2019), spanning pre-gastrula stages (E5.5) to late-gastrulation (E7.5; Figure S9E). Spatiotemporal expression of SIX3 is observed in the epiblast and neuroectoderm (Carl et al., 2002; Lagutin et al., 2003; Steinmetz et al., 2010) as well as early endoderm lineages (Figures 6B and S9F). We also identified SIX3 as a gene that is detected in a study of 434 individuals with brain development abnormalities (holoprosencephaly), with 8% of individuals found to have congenital heart disease. A patient with deletion of SIX3 was diagnosed with dextrocardia (Tekendo-Ngongang et al., 2020), a condition where the heart develops properly except that its position is reversed in the body, further suggesting a potential direct or indirect role for SIX3 in governing critical mesendoderm cell differentiation decisions.
Figure 6. TRIAGE as an Engine for Gene Discovery.

(A) The top 10 genes ranked by RNA expression (left) and TRIAGE (right) from day-2 in vitro hPSC-derived mesendoderm, highlighting SIX3 as a candidate gene identified by TRIAGE. t-SNE plot shows the percentage of cells expressing SIX3 and the gene expression level of SIX3 in different single-cell derived subpopulations. To the best of our knowledge, Ggnes labeled as “novel” have not been implicated in this process.
(B) Corn plots showing the spatial domain of SIX3 expression in the germ layers of E5.5–E7.5 mouse embryos. Positions of the cell populations (“kernels” in the 2D plot of RNA-seq data) in the embryo: the proximal-distal location in descending numerical order (1 = most distal site) and in the transverse plane of the germ layers: endoderm, anterior half (EA), and posterior half (EP); mesoderm, anterior half (MA), and posterior half (MP); epiblast/ectoderm, anterior (A), posterior (P) containing the primitive streak, right (R)- anterior (R1) and posterior (R2), left (L) – anterior (L1) and posterior (L2).
(C) Breadths of H3K27me3 domains (in base pairs) associated with the SIX3 gene across 111 epigenome roadmap samples.
(D) Schematic overview of SIX3 gene targeting by CRISPRi for conditional knock down (KD) showing the position of gRNAs blocking CAGE-defined TSS of SIX3.
(E) qPCR analysis of SIX3 transcript abundance in control (con) versus SIX3 CRISPRi KD iPSCs (DOX) (n=14; 6 biological replicates each with 2–3 technical replicates).
(F) Schematic of hiPSC-directed in vitro cardiac differentiation protocol.
(G) Day-2 FACS analysis of endoderm markers EPCAM/CXCR4 between control and dox-treated conditions in SIX3 CRISPRi KD iPSCs and WTC GCaMP CRISPRi iPSCs are shown (n= 12–16; 4–5 biological replicates each with 3 technical replicates). SIX3 CRISPRi KD iPSCs show significant (p < 0.001) reduction in EPCAM+/CXCR4+ cells compared to dox-treated control iPSCs (WTC GCaMP CRISPRi).
(H) qPCR analysis showing significant decreases in endoderm and mesendoderm markers and increases in mesoderm markers, respectively, in SIX3 CRISPRi KD iPSCs compared to control (n= 6–14; 3–6 biological replicates each with 2–3 technical replicates).
(I) Analysis of cardiomyocytes by FACs for α-actinin at day 15 of in vitro differentiation. Changes in α-actinin+ cells between control and dox-treated conditions in SIX3 CRISPRi KD iPSCs and WTC GCaMP CRISPRi iPSCs are shown (n= 6; 3 biological replicates each with 2 technical replicates). SIX3 CRISPRi KD iPSCs show no change in α-actinin+ cells compared to dox-treated control iPSCs (WTC GCaMP CRISPRi).
To test this hypothesis, we established CRISPRi loss-of-function hPSCs in which SIX3 transcription is blocked at its CAGE-defined transcription start site (TSS) in a dox-dependent manner (Figures 6D and 6E). Cells were differentiated and analyzed at day 2 (Figure 6F). We found that the SIX3 loss of function depleted endoderm and pan-mesendoderm genes (n = 6–14) with FACS data indicating specific depletion of CXCR4+/EPCAM+ endoderm cells (n = 12–16; Figures 6G, 6H, S9G, and S10). In contrast, genes marking various mesodermal lineages (pan-mesoderm, paraxial mesoderm, and lateral mesoderm) were either not affected or upregulated upon the loss of SIX3 (Figure 6H). Consistent with this, FACS analysis of alpha-actinin+ cardiomyocytes on day 15 of differentiation showed no difference between SIX3-knockdown cells compared to dox-treated controls (n = 6) (Figures 6I and S9H). Taken together, this finding provides the first evidence linking SIX3 to mesendoderm cell differentiation and groups this gene into mechanisms of cardiac malformation that are consistent with genetic defects in endoderm that are known to cause heart patterning defects (Viotti et al., 2012).
Finally, we used TRIAGE to identify previously unknown developmental regulators in a distant chordate species, Ciona robusta. Single-cell RNA-seq data comprising cell subpopulations captured across a time course of cardiac development were analyzed with TRIAGE using a customized gene mapping tool to link human genes to Ciona genes (Figures 7A and 7B) (Wang et al., 2019). The top ranked genes based on TRIAGE were analyzed (Figure 7B and S9A). RNF220 (RTS = 0.30; Figure 7C), an E3 ubiquitin ligase governing Wnt signaling pathway activity through β-catenin degradation (Ma et al., 2014), was identified as a regulatory gene not previously implicated in cardiopharyngeal development. Utilizing CRISPR control versus RNF220-knockout, we demonstrate that Mesp lineage progenitors of control animals form the expected ring of pharyngeal muscle progenitors around the atrial siphon placode, whereas RNF220-knockout embryos showed morphogenetic defects (n = 100) (Figures 7D–E). Collectively, these data illustrate that TRIAGE identifies functional regulatory determinants; we demonstrate how TRIAGE can support discovery of previously unknown biology and mechanisms of development.
Figure 7. TRIAGE Identifies Regulators of Heart Development in the Tunicate Ciona.

(A) Schematic overview of cardiac development in Ciona from 4 to 72 h post-fertilization (hpf) at 18°C. Adapted from (Anderson and Christiaen, 2016). TVC, trunk ventral cells; STVC, second TVC; FHP, first heart precursor; SHP, second heart precursor; ASMF, atrial siphon muscle founder cells; Iasmp, inner atrial siphon muscle precursor; oASMP, outer atrial siphon muscle precursor.
(B) Top 10 genes ranked by expression value (left) or TRIAGE (right) from populations found during Ciona heart development in vivo, highlighting RNF220 as a candidate gene. To the best of our knowledge, genes labeled as “novel” have not been implicated in this process.
(C) Breadths of H3K27me3 domains (in base pairs) associated with the RNF220 gene across the 111 NIH Epigenomes datasets.
(D and E) Mosaic plots (D) and images (E) showing ASM precursor phenotypes at 26 hpf labeled with Mesp > H2B:GFP and Mesp > mCherry in control knockout and RNF220-knockout animals (n = 100). p value represents the chi-sq test between two experimental conditions. Images in (E) derived from Ciona robusta cardiopharyngeal mesoderm.
DISCUSSION
TRIAGE builds on the prevailing view that the epigenome guides cell regulatory processes. The selective absence of broad H3K27me3 domains at promoters was first established from diverse cell types and epigenetic information hosted by NIH Roadmap Epigenomics (Roadmap Epigenomics Consortium et al., 2015) and represented by a simple gene-specific RTS. The RTS demarcates 5% of Refseq genes that are consistently regulated by broad H3K27me3 domains across major human cell lineages; we show this priority set is highly enriched in genes that govern cell differentiation and lineage diversification.
Second, TRIAGE exploits the discordance between any gene’s expression and its RTS to predict cell-specific genes regulating cell identity with sensitivity and precision. We demonstrate a capacity of TRIAGE to prioritize genes involved in cell differentiation decisions in development and disease contexts. These inferences establish a genetic basis for gaining mechanistic insights into cell decisions, including the discovery of previously unknown genetic regulators as demonstrated by gene loss-of-function studies.
The scalability and versatility of TRIAGE is exemplified in its implementation across diverse data types including single-cell RNA-seq, ATAC-seq, CAGE-seq, proteomics, ChIP-seq, or any genomic analysis method linked to protein coding genes. We provide evidence for TRIAGE as a tool for studying the genetic basis of cell differentiation choices in cell types from every organ system in the body and across species. TRIAGE provides a unique vantage point for studying genomic data that is complementary to many routine analysis approaches such as differential expression. While we demonstrate its use for studying developmental and cell differentiation decisions, additional studies are warranted for evaluating the role of TRIAGE in analysis of adult tissues and disease responses.
The evolutionary conservation of epigenetic regulation suggests that the repressive tendency can be applied across eukaryotic cell types where gene expression is governed by the polycomb group complex-2. PRC2 and its regulation of histone methylation are known to govern genes in protists, animals, plants, as well as fungi (Margueron and Reinberg, 2011). Indeed, zebrafish (Wu et al., 2011) and medaka (Nakamura et al., 2014) genes with broad H3K27me3 deposition at promoter sites encode master developmental regulators overlapping with those found in our study. This illustrates the conservation of PRC2-mediated H3K27me3 regulation and repression of genomic loci across species and its role in controlling cell identity (Boyer et al., 2006; Fujikura et al., 2002).
In contrast to previous strategies (Cahan et al., 2014; Rackham et al., 2016), TRIAGE does not require comparison against external reference information akin to differential gene expression analysis. It detects known regulatory genes that are distinct from genes identified using other approaches such as FH Score (Rehimi et al., 2016), H3K4me3 broad domains (Benayoun et al., 2014), or super-enhancers (Creyghton et al., 2010; Jiang et al., 2019; Whyte et al., 2013; Hnisz et al., 2013). TRIAGE provides a seamless interface with a range of input data types measuring gene outputs of a cell with application by genetic orthologs for the study of any cell type across the animal kingdom.
Among the limitations of TRIAGE, we used RTSs mapped specifically to protein coding genes. This limits TRIAGE inference predictions to the 2% of the genome encoding proteins and precludes analysis of intergenic domains that also encode regulatory information (Andersson et al., 2014). Second, we note limitations on cross-species applications based on gene mapping tools and the profound differences in composition of cellular diversity that distinguish animal phyla. Despite this limitation, we demonstrate cross-species predictions and functional evidence of gene discovery in distantly related chordates using RTSs for human. Third, TRIAGE uses a single number assigned to each protein coding gene to prioritize genes from cell-type-specific data and therefore is not designed to evaluate changes between samples as would occur with fold-changes measured by differential expression. Finally, while the biological diversity represented in the 111 NIH Roadmap Epigenomics is limited, we illustrate by performing analyses on epigenomic data from >830 cell types in EpiMap that TRIAGE is robust with regard to the sample input. We anticipate that the generation of new reference epigenome databases (Adsera et al., 2019) covering a broader range of cell and tissue types will refine and expand the use of RTSs revealing stress-sensitive loci and novel disease drivers.
This study establishes a unique strategy for the study of the transcriptional control mechanisms governing cell diversification, without demanding the provision of multiple datasets. With expanded analysis of epigenomic information of diverse cell and tissue types across eukaryotic species, the analysis can be implemented to study mechanisms underlying the genetic basis of complex cell traits as well as gaining insights into evolutionary biology and genetic adaption across eukaryotic genomes governed by PRC2.
STAR★METHODS
RESOURCE AVAILABILITY
Lead Contact
Further information and requests for resources and reagents should be directed to and will be fulfilled by the Lead Contact, Nathan J. Palpant (n.palpant@uq.edu.au).
Materials Availability
This study did not generate new materials.
Data and Code Availability:
Source data statement: This paper analyzes existing, publicly available data. These datasets’ accession numbers are provided in the manuscript text and Table S1.
Code statement: We provide the TRIAGE source code written in Python and R (https://github.com/woojunshim/TRIAGE). Users can also run the TRIAGE analysis using a web accessible interface (http://bioinf.scmb.uq.edu.au/adhoc/).
Scripts statement: The scripts used to generate the figures reported in this paper are available at https://github.com/woojunshim/TRIAGE.
Any additional information required to reproduce this work is available from the Lead Contact.
METHOD DETAILS
Data Sets
We compared associations of 6 different histone modifications (H3K4me1, H3K4me3, H3K9me3, H3K27me3, H3K27ac and H3K36me3) with genes using consolidated broad peak representations from the NIH Roadmap database (Roadmap Epigenomics Consortium et al., 2015). We extracted a curated set of 1,605 human TFs from Animal TFDB and DBD (Wilson et al., 2008; Zhang et al., 2015). We identified 3,804 housekeeping genes from the published literature (Eisenberg and Levanon, 2013). The repressive tendency score of genes were estimated based on biological diversity represented in the 111 NIH Road-map human tissue and cell types.
We utilized publicly available expression datasets to test performance of TRIAGE. We applied TRIAGE to 17,382 transcriptome samples from GTEx (v8) (GTEx Consortium, 2013), Roadmap and 329 selected FANTOM CAGE-seq developmental samples (Table S1) (FANTOM Consortium and the RIKEN PMI and CLST (DGT) et al., 2014). We demonstrated multi-omics applicability of TRIAGE with single-cell transcriptomes (Cao et al., 2019; Friedman et al., 2018; Tabula Muris Consortium et al., 2018), human proteome (Kim et al., 2014) and Roadmap H3K36me3 ChIP-seq data.
We evaluated TRIAGE in prioritizing cell identity genes against approaches based on H3K4me3 peak breadth (Benayoun et al., 2014), functional heterogeneity (FH) score (Rehimi et al., 2016), super-enhancers (SEs) (Hnisz et al., 2013; Jiang et al., 2019; Whyte et al., 2013) and differentially expressed (DE) gene analysis. To this end, we selected 5 distinct tissue-groups as the reference point; (i) Brain, (ii) Lung, (iii) Pancreas, (iv) Skeletal muscle and (v) Heart. We calculated metrics using transcriptomic abundance and ChIP-seq data from the Roadmap data; Brain germinal matrix (E070) for the brain, Lung (E096) for the lung, Pancreas (E098) for the pancreas, Psoas muscle (E100) for the skeletal muscle and a published data set for cardiac progenitor cells for the heart (GSE97080) (Palpant et al., 2017b). We collated nearest active genes associated with SEs in corresponding tissue-groups (See Performance analysis of TRIAGE against existing methods) (Jiang et al., 2019). We also used GTEx expression profiles of samples that belong to these 5 tissue-groups; 417 samples from the left ventricle (Heart), 195 samples from the cortex (Brain), 268 samples from the pancreas (Pancreas), 607 samples from the lung (Lung) and 718 samples from the skeletal muscle (Skeletal muscle). We averaged gene expression values of samples for each tissue-group.
To identify a gene set regulating the cell fate, we used gene ontology (GO) annotation data (Ashburner et al., 2000). We identified TFs with a tissue-specific GO biological process (BP) term as the positive gene set with a defined regulatory role. For instance, we used ‘heart development’ term (GO:0007507) to select a set of TFs specific for heart development. Similarly, ‘brain development’ (GO:0007420), ‘lung development’ (GO:0030324), ‘pancreas development’ (GO:0031016) and ‘muscle structure development’ (GO:0061061) GO terms were used to collect regulatory gene sets for brain, lung, pancreas and skeletal muscle samples, respectively. Finally, we extracted expressed genes (i.e. RPKM>1) in a given input sample as an active set of positive genes.
Identifying Genes as a Proxy for Cell Type-Specific Regulatory Genes
Along with TFs with a tissue-type-specific GO BP term, we identified a gene set that universally represents cell type-specific regulatory genes. We identified 634 TFs whose expression values shows substantial variation (i.e. coefficient of variation>1) across the 46 Roadmap cell types and labelled them as variably expressed TFs (VETFs) (Table S2). This classification is based on previous observations that expression of developmentally regulated genes is highly variable both temporally and spatially (Pérez-Lluch et al., 2015). Collectively, these 634 VETFs encompass regulatory genes for a broad range of cell and tissue types. We used a subset of these TFs that were expressed (RPKM>1 or equivalent) in a given input sample as the positive gene set.
To ensure that our analysis is not confined to the narrow definition of cell type-specific regulatory genes above, we collated curated sets of tissue type-specific TFs (D’Alessio et al., 2015). This study ranked human TFs for their tissue specificity across 233 tissue groups based on the expressional specificity. We took top the 20 TFs for each tissue group by their specificity score, yielding a total of 713 tissue-specific TFs. 428 of 634 our VETFs were indeed identified as members of these TFs, demonstrating agreement with the VETFs (p<2.2e-16, hypergeometric test). We used these tissue-specific TF sets as a complementary source of the positive gene set to assess performance of TRIAGE with the CAGE expression data.
Quantifying Cell Type Specificity of VETFs
We use Shannon entropy to quantify the specificity of expression for VETFs, as observed across 46 Road-map cell types (Schug et al., 2005). The relative expression is calculated as
where wi,j is the expression value of gene i in cell type j, from 46 Roadmap cell types (m=46) and its cell type specificity is
The cell type specificity ranges between 0 (when the gene is uniquely expressed in a single cell type) and log 2 m (when the gene is expressed uniformly across all cell types). VETFs had significantly lower entropies (mean=3.64), compared to non-VETFs (mean=5.25, p=4.31e-230, Wilcoxon rank-sum test, one-tailed) and all protein-coding genes (mean=4.48, p=1.55e-108), indicating their expressional specificity.
Association of Genes with a Histone Modification (HM) Domain
To assign peaks (referred to as domains hereafter due to the focus on broad peaks) to genes, we used following steps.
Defining the proximal region of the gene. We defined a proximal region for each gene. The proximal region for a gene is the RefSeq gene body plus a region extended by 2.5kb from the TSS in the upstream direction.
Provisional assignment of domains to genes. For each gene, we first identified HM domains with their center position overlapping the proximal region. These domains were provisionally assigned to the corresponding gene. Domains that were broad, with their center position outside of the proximal region were still included if the domain overlapped with any proximal regions of genes, in which case, the domain was provisionally assigned to all overlapping genes. Suppose that gene i in cell type j have a set of provisionally assigned domains, Di,j = {d1, d2, …, dl, …} where dl is the breadth (in base-pairs) of the l-th domain provisionally assigned to the gene.
Final assignment of domains to genes. If multiple domains were assigned to a gene I in cell type j, it is represented by the breadth of the broadest domain
This yields a single gene assigned with a single domain in a given cell type. We used BEDTOOLS intersect program to assign HM domains to RefSeq genes (Quinlan and Hall, 2010). We removed any intergenic domains that did not overlap any proximal regions of genes to reduce potential bias from including intergenic regulatory elements (Rada-Iglesias et al., 2011). We use a term assigned to indicate that the HM domain has been linked to the gene.
Our approach to annotate genes with breadth of the broadest H3K27me3 domain did not result in loss of relevant functional information. To illustrate this point, we calculated correlation between expression level of a gene and (i) the breadth of the broadest H3K27me3 domain or (ii) the sum of breadths of all H3K27me3 domains assigned to the gene. When we performed this analysis across all the cell types in Roadmap, we found no significant difference in the correlation between these two approaches, with the mean Spearman’s rho of −0.364 and −0.337 respectively. Furthermore, the majority of domains finally assigned to protein-coding genes (i.e. approximately 85% of 1,537,514 assigned H3K27me3 domains across the 111 cell types) overlapped a single gene (Figure S2D). Approximately 66.9% of all H3K27me3 domains assigned to genes were identified in the RefSeq gene region while remaining 22.6% and 10.5% were in the promoter (+2.5kb from the TSS) and intergenic regions respectively, indicating that the majority (89.5%) of the assigned H3K27me3 domains were proximal to the gene.
For cell type j, we have a set of HM domain breadth values for n genes. Subsequently, we normalized breadth values to yield the breadth score (h) for all genes across the cell types, where and sj are the sample mean and the standard deviation of HM domain breadths in cell type j.
Genomic Locations of H3K27me3 Domain
We investigated genomic locations of assigned 1,537,514 H3K27me3 domains used for the RTS calculation. First, we identified a center position of each domain and used BEDTOOLS intersect program to identify if they overlap with (i) known RefSeq genes or (ii) promoters (defined as +2.5kb from the RefSeq TSS). If the domain does not overlap any of these, we labelled the domain as (iii) intergenic.
Defining the Broad H3K27me3 Domain
We defined broad domains as the top 5% broadest domains, assigned to any gene. This threshold was based on efficacy of the threshold to recover genes with known regulatory and signaling functions. First, we observed that VETFs were strongly associated with broad H3K27me3 domains across the Roadmap cell types. When genes were ranked by the breadth of their finally assigned H3K27me3 domain, VETFs were most significantly (p=6.66e-16, Fisher’s exact test, one-tailed) enriched in the top 5% across all cell types (Figure 1A). To decide on this threshold, we assessed sensitivity of different thresholds (or rank position) to recover the VETFs and 641 KEGG signaling genes. We calculated a detection ratio (i.e. number of domains assigned to any positive gene divided by the total number of domains drawn at a given threshold) and a recovery percent (i.e. number of positive genes identified by collecting domains from all 111 Roadmap cell types at a given threshold, divided by the total number of positive genes). As each gene is assigned with a single domain in a given cell type, the detection ratio ranges from 0 (i.e. no single domain is associated with the positive gene) to 1 (i.e. all domains are associated with the positive gene). Similarly, the recovery percentage represents a cumulative proportion of positive genes captured at a threshold. We sought a threshold that maximized the detection ratio while recovering a majority of positive genes. Our analysis showed that a threshold at the 95th percentile (or top 5% broadest) met such conditions for both gene sets; only minor variations were observed at nearby rank positions (Figure S2A). For instance, approximately 81% of VETFs are identified at the 95th percentile (or rank position 5) where more than 15% of domains are assigned to VETFs. A variable (Xi,j) represents a binary outcome of whether a gene i is assigned with a H3K27me3 domain that is in the top 5% broadest in a cell type j.
Association of Genes with Broad HM Domains
To understand association of broad HM domains with genes, we ranked genes by breadth of the assigned domain and grouped them into bins of 100 genes across the cell types. Jaccard similarity index was calculated at each rank bin between all pairs of cell types. To identify genes that are frequently associated with assigned broad HM domains across the Road-map cell types, we counted the number of cell types where a given gene was assigned with the broad HM. We ranked genes by the count and identified the top 200 genes for each HM type.
Estimating H3K27me3 Repressive Tendency of the Gene
We hypothesized that the regulatory importance of a gene in any cell type can be determined from evidence of (i) expression level of that gene in the same cell type, and (ii) breadth of H3K27me3 domains collected from a diverse range of cell types. To test this, we proposed a method that first quantifies the association of a gene with the H3K27me3 domain. For each gene, the method considers (i) a sum of H3K27me3 breadth scores for the gene calculated from m cell types (e.g. 111 Roadmap cell types) and (ii) the number of cell types where the gene is associated with a broad H3K27me3 domain. For gene i, sum of the breadth scores (vi) is defined as follows.
The sum of breadth scores was then re-scaled into a range from 0 to 1 as follows, where vmax and vmin are maximum and minimum sums of the breadth scores from all genes respectively.
The association score of gene i with the H3K27me3 domain (ai) was then calculated as the product of the scaled sum of breadth scores and a proportion of cell types where the gene was associated with the broad H3K27me3 domain. To include genes without any broad H3K27me3 domains in any cell types, we added a pseudo-count of 1.
Finally, we re-scaled the association score into a range of 0 (min) and 1 (max) to obtain the repressive tendency score (RTS) for the gene. For gene i, RTS is defined as follows, where amax and amin are maximum and minimum association scores for all genes, respectively.
Consistency of the RTS Values between Different Data Sources
To understand how the biological composition of samples affects calculation of the RTS, we utilised EpiMap (Adsera et al., 2019). We downloaded H3K27me3 data for all 834 EpiMap samples in the BigWig format. These were converted to bedgraph format using UCSC bigWigToBedgraph program, obtained from http://hgdownload.soe.ucsc.edu/admin/exe/. To identify H3K27me3-enriched regions, we used MACS2 peak calling program, with -bdgbroadcall option to capture broad deposition of H3K27me3 (Zhang et al., 2008). We identified H3K27me3-enriched regions across all 834 EpiMap samples.
We calculated RTS values using (i) all 834 EpiMap samples, (ii) 332 embryonic samples (i.e. ‘embryonic’ in life stage based on the EpiMap metadata annotation), (iii) 389 adult samples (i.e. ‘adult’ in life stage), (iv) 122 cancer samples (i.e. ‘cancer’ in group), or (v) 216 cell line samples (i.e. ‘cell line’ in type).
Performance Analysis of TRIAGE against Existing Methods
We extensively analyzed performance of TRIAGE against existing computational methods using various metrics. These include metrics based on (i) breadth of H3K4me3 peaks proximal to the gene (Benayoun et al., 2014), (ii) breadth of H3K27me3 peaks at the gene locus multiplied by the corresponding expression level in a spatially heterogenous cell population (Rehimi et al., 2016) and (iii) super-enhancer (SE) (Whyte et al., 2013; Jiang et al., 2019; Hnisz et al., 2013) as well as common practices of differentially expressed gene (DEG) analysis. Furthermore, we tested TRIAGE with publicly available datasets including GTEx transcriptomes (v8) (GTEx Consortium, 2013), FANTOM5 CAGE-seq data (FANTOM Consortium and the RIKEN PMI and CLST (DGT) et al., 2014) as well as single-cell transcriptomes (Friedman et al., 2018; Tabula Muris Consortium et al., 2018), human proteomes (Kim et al., 2014) and Roadmap H3K36me3 ChIP-seq data sets (Roadmap Epigenomics Consortium et al., 2015) encompassing diverse cell and tissue groups to compare the performance of TRIAGE against the gene expression readouts (See Benchmarking TRIAGE in multi-omics platforms). The following analyses were performed to performance test TRIAGE against previous epigenetic prediction analysis strategies:
H3K4me3 Breadth
To compare performance of TRIAGE against the H3K4me3 breadth-based metric (Benayoun et al., 2014), we used the 5 distinct tissue groups (See Datasets). H3K4me3 peaks were assigned to nearest RefSeq genes using an in-house Python script. Peaks located further than 2.5kb from any RefSeq TSSs were excluded. For genes with multiple assigned peaks, the broadest H3K4me3 peak was used to annotate the gene. Subsequently, genes were ranked by the breadth of the H3K4me3 peak.
Functional Heterogeneity (FH) Score
To test performance of TRIAGE on predicting developmental regulators against FH score (Rehimi et al., 2016), we used chicken embryo dataset for enriched H3K27me3 domains identified in Rehimi’s study and the gene expression data (GSE89606) (Rehimi et al., 2016). These datasets satisfy the assumption of spatially heterogenous gene expression to calculate the FH score. We also downloaded genome annotation file (GFF3 format) for galGal4 chicken genome assembly (https://asia.ensembl.org/info/data/ftp/index.html) to quantify breadth of H3K27me3 peaks at the gene using BEDTOOLS intersect program (Quinlan and Hall, 2010). Furthermore, while the assumption of spatially heterogeneous gene expression is not strictly met, we also included FH score to evaluate its performance and applicability on the selected 5 distinct tissue groups (See Datasets).
Genes were ranked at both developmental time-points (HH14 and HH19) based on 3 metrics; (i) normalized gene expression value (TPM), (ii) FH score from Rehimi’s study, and (iii) DS from TRIAGE. A total of 13,214 genes with an expression value (TPM>0) were included. We analyzed enrichment of 19 related GO BP terms used in Rehimi’s study using Fisher’s exact test (one-tailed) (Figure S5B).
Super-Enhancer (SE) Based Approach
We downloaded lists of SEs for 5 selected tissue-types from a published SE database SEdb (http://www.licpathway.net/sedb/index.php) (Jiang et al., 2019); (i) Heart left ventricle, (ii) Lung_30y, (iii) Pancreas, (iv) Psoas muscle_30y, and (v) Brain astrocyte which were linked to Roadmap epigenomes E095 (Left ventricle), E096 (Lung), E098 (Pancreas), E100 (Psoas muscle) and ENCODE astrocyte (Brain) respectively. The algorithm to define SEs, ROSE (Rank-Order of Super-Enhancers) gives a binary outcome (i.e. SE or not) for each enhancer element (Whyte et al., 2013). As such, we extracted all nearest active genes of SEs and compared their functional enrichment against the same number of highly ranked genes by TRIAGE (Left ventricle (n=557), Lung (n=955), Pancreas (n=382), Psoas muscle (n=409) and Brain (n=689)) using Fisher’s exact test (one-tailed).
Differentially Expressed Gene (DEG) Analysis
To test performance of TRIAGE against DEG analysis, we used published single-cell transcriptomes for in vitro cardiac-directed differentiation (Friedman et al., 2018) as well as selected bulk RNA-seq data for 3 distinct tissue groups (i.e. Blood, Brain and Heart) from the Roadmap project (Roadmap Epigenomics Consortium et al., 2015).
We obtained cardiac single-cell transcriptomes for differentiation days 2 and 30 from the ArrayExpress database (E-MTAB-6268). The data were processed and cells were clustered as previously described (Friedman et al., 2018). For the Road-map data, we extracted RNA-seq data for 3 representative samples for each tissue group (Blood; E037, E038, E047, Brain; E070, E071, E082 and Heart; E095, E104, E105). We calculated mean expression values of genes within each group or cell cluster. Genes were ranked by the fold change (FC) of the expression value between different groups or clusters using R library DESeq2 (Love et al., 2014). We also tested performance of TRIAGE with the input gene set restricted to only TFs. To this end, we first excluded all non-TF genes from the input data. While DEG analysis often focuses on differentially expressed TFs as a candidate regulatory gene set, TRIAGE offers an unsupervised approach to prioritize cell type-specific regulatory genes, without requiring any prior knowledge on the gene set.
To demonstrate ability of TRIAGE as a complementary method to DE analysis to identify causal factors of cell identity, we compared rank analysis of genes using 108 FANTOM5 CAGE-seq expression samples (as read counts) from 12 cell (or tissue) types (Table S1). We used a TSS with the highest read count as an expression value for the gene. We performed the DE analysis for all possible pairs of these 12 cell types using DESeq2 R package (Love et al., 2014). Briefly, for each cell type, we identified top 100 significantly highly expressed genes by comparing to each of all other cell types (i.e. 12 * 11 = 132 pair-wise comparisons).
We first extracted genes that were significantly highly expressed (Benjamini-Hochberg FDR < 1e-06) in a given cell type compared to the other, then ranked those genes by the fold change. We used top 20 tissue specific TFs as the positive gene set for each cell (or tissue) type. We counted positive hits for each comparison and calculated the enrichment using hypergeometric test. For the comparison, we ran TRIAGE independently for the same set of the 12 cell types. Top 100 genes were identified by the discordance score and overlaps with the positive gene set were computed.
Positive gene sets used for the performance analy,sis against DE
| FANTOM5 CAGE-seq cell (or tissue) type | Tissue group for the positive gene set as defined previously (D’Alessio et al., 2015) |
| Adipocytes | White adipocyte 21 d differentiated from MSC |
| Astrocytes | Astrocyte |
| Heart | Heart |
| Hepatocytes | Hepatocyte |
| Keratinocytes | Skin epithelial cell keratinocyte |
| Kidney | Kidney |
| Melanocytes | Melanocyte |
| Monocytes | Monocyte |
| Neutrophils | Neutrophil |
| Skeletal muscle cells | Skeletal muscle |
| Urothelial cells | Urothelial cells |
| Thalamus | Thalamus |
H3K27me3 Gain/Loss Function
We tested how TRIAGE performs against a simple gain/loss H3K27me3 function using a published dataset for induced in vitro differentiation of human cardiovascular cells between two different time-points; before differentiation (day0) and definitive cardiovascular cell stage (day14) (Paige et al., 2012). To this end, we first obtained AffyExon microarray expression (GSE19090) and H3K27me3 ChIP-seq (GSE35583) data. We averaged probeset values to obtain the gene expression value and merged H3K27me3 peaks from replicates. To quantify H3K27me3 depositions, we mapped peaks to regions spanning from 2.5kb upstream of RefSeq TSSs to the entire gene body, which is represented by the number of overlapped base-pairs. We normalized depositions by the size of the region to get a value ranging between 0 (complete absence of H3K27me3) and 1 (completely covered by H3K27me3). Finally, change in the H3K27me3 deposition between the two time-points was calculated for all genes (i.e.ΔH3K27me3 = H3K27me3day14 − H3K27me3day0). We ranked genes by loss of the H3K27me3 signal, DS and the expression values at day14.
Statistical Properties of the Discordance Score
We defined a statistical test to gauge if a DS assigned to a gene is higher than expected. The expected DS of a gene is based on two components: the expected RTS given the observed level of expression, and the expected level of expression given the observed RTS of the gene. The test first estimates p-values for the two test statistics, which are then combined by Fisher’s method to yield a single p-value based on the chi-squared distribution. In practical terms, an empirical null distribution is generated from repeated, random permutation of each test statistic of n comparable genes. Comparable genes are defined as those with the closest value to the gene of interest, in terms of the parameter that is not the test statistic (i.e. expression level or RTS). The p-value is then the probability that the rank of the gene of interest improves as a result of the random permutation.
Functional Enrichment Analysis
To compare efficacy of TRIAGE against other existing methods in prioritizing genes functionally important to a given tissue or cell state, we used a simple systematic approach to analyze enrichment of a selected GO term. For annotation purposes, we ranked only protein-coding genes. Ranked genes by a given metric (e.g. DS, gene expression value etc.) were first binned into a percentile bin (i.e. each bin includes 1% of the total gene populations in a given dataset). At each rank bin, we quantified enrichment of a selected GO biological process (BP) term using Fisher’s exact test (one-tailed). Essentially, we tested how significantly the GO term was enriched among genes above a rank bin x (i.e. above top x% of the gene population) compared to the rest using a sliding window. The resultant significance ( − log10p) was plotted against the rank bin, allowing visualization of how the enrichment changes as more lowly ranked genes were included in the analysis. To identify significantly (FDR<0.05) enriched GO BP terms among top ranked genes, we used a R package topGO (Alexa, 2019).
Consistency of the RTS between Different Peak Callers
To assess how the RTS changes with different peak calling methods, we independently calculated the RTS using peaks identified by 3 different peak callers, namely MACS2, SPP and Homer (Kharchenko et al., 2008; Heinz et al., 2010; Feng et al., 2012). Briefly, we first downloaded mapped ChIP-seq reads in tagAlign format for the 111 Road-map cell types. Peaks were identified by comparing H3K27me3 tag signals with the input for each peak caller across the cell types. For MACS2 peak caller, ‘callpeak’ program was used with ‘broad’ and ‘broad-cutoff’ of 0.1 options to capture broad deposition of H3K27me3 (Feng et al., 2012). For SPP peak caller, ‘get.-broad.enrichment.clusters’ function (available under ‘spp’ R library) with window.sizes=1000 and z.thr=3 was used as recommended for capturing broad HMs (Kharchenko et al., 2008). For Homer peak caller, ‘findPeaks’ program was used with ‘-style histone’. This parameter ensures the peak caller to initially find peaks of size 500 bp and subsequently stitch into regions of 1000bp; a suitable approach to identify broad regions of histone modifications (Kharchenko et al., 2008). From outputs of each peak caller, we calculated RTS values as described above. Subsequently, DSs were computed for 3 distinct Roadmap tissue groups; Left ventricle (E095), Germinal matrix (E070) and T helper naïve cells (E038), using these 3 different versions of the RTS. TFs with a selected GO term (Heart development GO:0007507, Brain development GO:0007420 and T cell differentiation GO:0030217 respectively) were used as the positive gene set for the enrichment analysis.
Accuracy of Estimated RTSs
We estimated the RTS from the 111 NIH Roadmap tissue or cell types. To address potential sampling bias, we performed a bootstrapping analysis by randomly re-sampling cell types 10,000 times. For each re-sampling, we calculated the RTS for each gene. We collected the empirical bootstrap distribution of RTSs for each gene. RTSs of all 26,833 genes were estimated within 1 standard deviation of their respective mean, supporting consistency of the estimated RTS.
Saturation of H3K27me3 Signals
To understand whether the 111 cell types in Roadmap provide sufficient data to estimate stable RTSs, we developed an iterative process to quantify stability of the RTS with a differing number of cell type samples. Suppose we have n number of genes each of which has a RTS calculated based on H3K27me3 data observed in k number of cell types. We defined saturation state as a state where any change in the RTS for a given gene as a result of an addition of l number of cell types is within an arbitrarily defined range.
If the signal is in the saturation state, adding l number of different cell types would not result in a noticeable change to the resultant RTS. To help quantification of the RTS change, we define a term stably ranked gene. Suppose gene i has an estimated RTS derived from k number of cell types and is ranked at a certain position (ui,k). We say the gene is stably ranked if a resultant RTS re-calculated with an addition of l number of cell types put the gene at a rank position (ui,k + l) that is within a certain range of rank positions (θ) from the previous rank position (ui,k). In other words, gene i is stably ranked if the resultant RTS change is not large enough to shift its rank position more than θ. Formally, a set of stably ranked genes with an addition of l number of cell types to k number of cell types (Gk,l) is a subset of all genes (Gall) and can be written as the follow.
For instance, if gene A is ranked at q position by the RTS calculated using k number of cell types, the gene A is a stably ranked gene if the rank does not change more than θ positions (e.g. 1% of the total gene number) from q when an additional l number of cell types is included for the subsequent calculation.
We started with k=3 randomly selected cell types and iteratively calculated the proportion of stably ranked genes at an increment of l=3 randomly selected cell types without replacement until all 111 cell types were used. To address potential sampling bias, we repeated this process 1,000 times and obtained mean values and the 95% confidence interval of the estimation (Figures S2F and S2G). We used a range of different thresholds (i.e. 1%~5% of the total gene number) for the stably ranked gene (Figure S2G).
Correlation between the Expression and the H3K27me3 Domain Breadth
H3K27me3 represses transcription of the target gene but it is not known whether cell type-specific regulatory genes have a distinct functional relationship with this repressive HM. Based on strong association of cell type-specific TFs with broad H3K27me3 domains, we questioned whether the repressive effect of H3K27me3 was more prominent among the cell type-specific TFs. To this end, we first identified five classes of genes (i.e. (i) 634 VETFs to represent cell type-specific regulatory genes, (ii) 7,445 variably expressed non-TFs, (iii) 18,708 protein-coding genes, (iv) 793 non-VETFs and (v) 3,805 housekeeping genes). For each gene, we calculated a Pearsons’s correlation coefficient between the gene expression value and the breadth of the corresponding H3K27me3 domain across the 46 Road-map cell types.
Functional Relationship between the Repressive Tendency and Gene Transcription
To understand association of RTS with the transcriptional outcome, we first ranked genes in a descending order of the RTS. We only considered coding genes and assigned them into bins of 100 genes. For the gene expression level, an average expression value of the gene set at each rank bin was calculated across the 46 cell types (Figure 2D). For the expressional specificity, a proportion of cell types where a given gene was expressed (RPKM>1 or equivalent) out of the 46 cell types was calculated (Figure 2C). As there were 100 genes in each rank bin, we calculated the average proportion of the 100 genes in each bin.
Comparison of Clustering Accuracy
We compared clustering accuracy based on expression values and DSs using the scRNA-seq mixology benchmarking data set (Tian et al., 2019). The data set we used (sc_10x) was generated on the 10× platform and provided expression values as counts for each of three distinct, labeled, human lung adenocarcinoma cell lines. We assessed the clustering of this data across three methods: SC3 (1.10.0), CORE (ascend 0.9.6) and Seurat (2.3.0) (Butler et al., 2018; Kiselev et al., 2017; Senabouth et al., 2019). Each of the clustering methods were used as detailed by their authors in their documentation or tutorials, including any filtering and scaling steps. In the SC3 clustering, the k parameter (ks) was set to 3, and the remainder of the parameters across all three algorithms were chosen as specified in their documentation or left at default.
To quantify the performance of the clustering methods, we used the Adjusted Rand Index as calculated by the mclust package (5.4.2) (mclust::adjustedRandIndex) (Scrucca et al., 2016), comparing the cluster assignment in each clustering method to the three cell line labels from the mixology data set. The PCA plots were generated using the ascend package (ascend::plotPCA) (Senabouth et al., 2019)
Benchmarking TRIAGE in Multi-Omics Platforms
We hypothesized that TRIAGE would be applicable to any quantifiable genomic data that reasonably reflects the expression level of genes. To demonstrate applicability of TRIAGE to various multi-omics platforms, we used GTEx (v8) transcriptomes (GTEx Consortium, 2013), single-cell transcriptomes (Friedman et al., 2018; Tabula Muris Consortium et al., 2018; Cao et al., 2019), FANTOM5 cap analysis of gene expression (CAGE) peaks (FANTOM Consortium and the RIKEN PMI and CLST (DGT) et al., 2014), human proteomes (Kim et al., 2014) and Roadmap H3K36me3 ChIP-seq data (Roadmap Epigenomics Consortium et al., 2015). For each sample, we identified top 100 genes ranked by TRIAGE and significantly enriched GO BP terms (Benjamini-Hochberg FDR<1e-6, hypergeometric test). This was compared with the enrichment from top 100 most highly expressed genes. We extracted terms that were significantly enriched (Benjamini-Hochberg FDR<1e-6, hypergeometric test) specifically in less than a third of all comparing samples. In addition to the GO term, we provided summary plots for enrichment of the VETFs by including the lowest p-value when the significance was calculated across the percentile rank positions (Figures 5G and 5I).
The Tabula Muris mouse single-cell RNA-seq data encompass nearly 100,000 cells from 20 different tissue types (Tabula Muris Consortium et al., 2018). We averaged expression values of genes for each tissue type to calculate corresponding DSs. For the CAGE data set (FANTOM Consortium and the RIKEN PMI and CLST (DGT) et al., 2014), we used the normalized CAGE tag density for the expression value of the corresponding gene. The highest CAGE tag density assigned to the gene was used so that each gene was annotated with a value from a TSS with the highest value. We selected 329 FANTOM5 samples that covers 25 distinct cell types without a disease annotation (Table S1). For human proteomic data (Kim et al., 2014) covering 30 different tissue groups, we used the protein expression value to link to the corresponding gene for the quantification. For H3K36me3 data set, we collected mapped reads for H3K36me3 ChIP-seq for the 111 Road-map cell types. For each cell type, we quantified the read density for each gene by calculating the number of reads per base-pair mapped to the RefSeq gene body. We then used the tag density as a proxy for the transcriptional abundance of the gene to calculate the DS.
To provide further validation on our analysis, we used tissue specific TFs from 233 distinct tissue groups as another positive gene sets collected from an independent study (D’Alessio et al., 2015). We extracted top 20 most tissue specific TFs (by specificity score) across the tissue groups and analyzed their enrichment among the top 100 genes ranked by TRIAGE or the expression value.
Visualization of Multi-Omics Datasets
To visualize performance of TRIAGE on multiple samples on a single plot simultaneously, we summarized the performance for each sample by (i) the most significant p-value (y-axis, Fisher’s exact test for enrichment of VETFs, one-sided) and (ii) the corresponding rank position where (i) is observed (x-axis, as the percentile rank position with 1 the highest and 100 the lowest) (Figures 5G and 5I). Each sample was represented as a single data point on the plot.
Inter-Species Application of the TRIAGE
Given a high level of evolutionary conservation for the PRC2 (Margueron and Reinberg, 2011), we hypothesized that the RTS calculated from the human data could be effectively applied to equivalent genes of other species. To test this, we first downloaded a range of transcriptomic data sets from different species covering the 5 selected tissue-groups (Table S1). We then performed inter-species gene mapping using online Ensembl bioMart (http://asia.ensembl.org/biomart/martview/) by identifying human orthologues (Haider et al., 2009). Only genes mappable to human orthologues were included in the analysis.
Biological Effect of Perturbing TRIAGE Priority Genes in hESCs
To evaluate the biological significance of perturbing TRIAGE priority genes, we utilized public resource data (Nakatake et al., 2020) in which 714 doxycycline-inducible transgene (including 418 TFs) overexpression (OE) hESC lines were established and assessed for transcriptome changes via RNA-seq/microarray 48hrs after the presence or absence of dox (Figure S2H). A total of 510 transgene OE cell lines were sequenced, out of which we identified 145 TRIAGE priority genes and 363 non-priority genes, excluding DUX4 and LHFPL6 which did not have RTS scores E. Within these two groups, the number of differentially expressed genes after induction of a transgene (comparing control vs. +dox samples for each cell line) was determined using ExAtlas (>2-fold-change, Benjamini-Hochberg FDR<0.05) (Sharov et al., 2015). The total number of DEGs was compared between TRIAGE priority (n=145) and non-priority (n=363) groups using an unpaired t-test with Welch’s correction (p<0.0001, two-tailed).
Melanoma Gene Set Enrichment
We used published pre-processed single cell RNA-seq data from melanoma tumors (Tirosh et al., 2016).1,252 melanoma cells were isolated from the set of approximately 4,000 cells based on the authors annotations. Melanoma proliferative and invasive gene sets were obtained from the same source. Based on the ratio of the average gene expression of the proliferative to invasive genes; the top 50 most proliferative and the top 50 most invasive cells were identified. TRIAGE was applied to the melanoma gene expression profiles to produce DS profiles. Averages of both expression and the discordance profiles of the top 50 proliferative and invasive cells were taken. Genes were subsequently ranked by the expression and discordance values for these representative profiles. For the ranked genes, fishers exact test was iteratively performed from the top ranked genes down the list as described above; adding 1% of the genes at each iteration. Gene sets tested for enrichment were obtained from published melanoma data sets (Tirosh et al., 2016). False discovery rate was used to correct for multiple hypothesis testing.
Heart Failure Pathogenesis Dataset
To determine the utility of TRIAGE in identifying regulatory elements and processes of disease in heart failure pathogenesis we used published pre-processed bulk RNA-seq data from adult mouse ventricles (GSE58453 and GSE68509) (Duan et al., 2017). Briefly, heart failure was induced using transverse aortic constriction (TAC) and the small molecule pan-BET inhibitor JQ1 was used to treat the TAC condition. TRIAGE was applied to the gene set of each condition (SHAM, TAC, TAC+JQ1) to produce DS profiles. Genes were subsequently ranked by the expression and discordance values for these representative profiles. For the ranked genes, Fishers exact test was iteratively performed from the top ranked genes down the list for GO terms of interest.
Gene Ontology Visualization
Gene ontology analysis was performed using DAVID with significance threshold set at FDR<0.05. The p-values from gene ontology analysis were visualized with the radius of the circle proportional to the negative natural log of the input p-value.
iTranscriptome Data Analysis
E5.5, E6.0, E6.5, E7.0 and E7.5 embryos represent cryo-sectioned samples along the proximal-distal axis (see Figure S9E). Original gene expression data are provided in previous publications (Peng et al., 2016, 2019). The gene expression pattern (region and level of expression by transcript reads) of the gene of interest is mapped on corn plots, where each kernel represents the cell population sampled at a defined position in the tissue layers of the embryo, to generate a digital 2D rendition of the expression domain that emulated the display of the result of whole mount in situ hybridization.
Candidate genes for biological validation of TRIAGE predictions in in vitro hiPSC and in vivo Ciona model systems were selected using the following criteria. Genes were selected if (1) ranked in the top 10 TRIAGE-expression gene list (2) fall within the top 1359 TRIAGE priority genes (3) have no known role in the population of interest (4) transcription factor or signaling molecule, and (5) efficient CRISPRi knockdown in hPSCs or CRISPR knockout in Ciona (Figure S9A). Using this selection criteria the following genes were selected for genetic loss of function:
Selection of candidate genes for biological validation using TRIAGE
| Candidate Genes | RTS | Population of Interest | Dataset | Efficient CRISPR K/D or K/O |
|---|---|---|---|---|
| SIX3 | 0.539 | Definitive Endoderm/Mesendoderm | hiPSC cardiac differentiation, Day 2 | Yes |
| GAD1 | 0.176 | Endothelial Cells | hiPSC cardiac differentiation, Day 5 | Yes |
| CRLF1* | 0.079 | Mesendoderm | hiPSC cardiac differentiation, Day 5 | No |
| ZNF503* | 0.077 | Cardiac Progenitor Cells | hiPSC cardiac differentiation, Day 5 | No |
| RNF220 | 0.304 | First Heart Precursors | Ciona heart development | Yes |
| IRX4/6 | 0.318/0.179 | Atrial Siphon Muscle | Ciona heart development | Yes |
| TBX2/3 | 0.188/0.332 | Trunk Ventral Cells | Ciona heart development | No |
| IGF1/2 | 0.001/0.164 | First Heart Precursors | Ciona heart development | No |
| IGF2BP1/2/3* | 0.172 | First Heart Precursors | Ciona heart development | No |
Note: CRLF1, ZNF503 and IGF2BP1/2/3 were ranked within the top 25 TRIAGE-expression list, and were chosen based on high population specificity, whilst all other genes fell within the top 10. For these genes CRISPR K/D hPSC cell lines and CRISPR K/O Ciona embryos were generated testing 3 gRNAs per gene. Efficiency of genetic loss of function was then tested via qPCR in hPSCs and peakshift assay in Ciona. Of the genes which displayed efficient loss of function, SIX3 and RNF220 were chosen for further biological phenotype validation because they had higher RTSs and had no known roles in the relevant populations of interest.
Generation and Maintenance of Human ESC/iPSC Lines
All human pluripotent stem cell studies were carried out in accordance with consent from the University of Queensland’s Institutional Human Research Ethics approval (HREC#: 2015001434). WTC CRISPRi GCaMP hiPSCs (Karyotype: 46, XY; RRID CVCL_VM38) were generated using a previously described protocol(Mandegar et al., 2016) and were generously provided by M. Mandegar and B. Conklin (UCSF, Gladstone Institute). WTC CRISPRi SIX3-g2 hiPSCs were generated in this study (see below). All cells were maintained as previously described(Palpant et al., 2017a). Briefly, cells were maintained in mTeSR media with supplement (Stem Cell Technologies, Cat.#05850) at 37 °C with 5% CO2. WTC CRISPRi GCaMP and WTC CRISPRi SIX3-g2 hiPSC lines were maintained on Vitronectin XF (Stem Cell Technologies, Cat.#07180) coated plates.
WTC CRISPRi SIX3-g2 hiPSCs
3 separate guide RNAs (gRNA) targeting the CAGE-defined transcriptional start sites of the human SIX3 sequence were designed and cloned into the pQM-u6g-CNKB doxycycline-inducible construct and transfected into WTC CRISPRi GCaMP hiPSCs using the Neon transfection system (Invitrogen, Cat.#MPK1096). For electroporation, 0.5μg DNA and 1×10⁵ dissociated hiPSCs were mixed in 10μL resuspension buffer R (Invitrogen, Cat.#MPK1096). Electroporation parameters were as follows: pulse voltage, 1300V; pulse width, 30ms; and pulse number, 1. Cells were then plated in Vitronectin XF (Stem Cell Technologies, Cat.#07180) coated plates in mTeSR media (Stem Cell Technologies, Cat.#05850) supplemented with 10μM of Y-27632 (Stem Cell Technologies, Cat.#72308). Stable clones were selected using successive rounds of re-plating with blasticidine at 10μg/ml (Sigma, Cat.#15205). Populations were tested for knockdown efficiency by qPCR following doxycycline addition at 1 μg/ml (Sigma, Cat.#D9891) continuously from day 0 of cardiac-directed differentiation (n=12–16 technical replicates per condition from 4–5 experiments). WTC CRISPRi SIX3-g2 line displayed high knockdown efficiency and therefore was chosen.
Guide RNAs designed:
| gRNA Name | Oligo Sequences |
| 5’ – Forward Primer – 3’ | |
| 5’ – Reverse Primer – 3’ | |
| SIX3 gRNA1 | F 5’ TTGGGCTGAATCTTGACTCGGCGG 3’ |
| R 5’ AAACCCGCCGAGTCAAGATTCAGC 3’ | |
| SIX3 gRNA2 | F: 5’ TTGGTGTCATTAGGGCGATTGCGG 3’ |
| R: 5’ AAACCCGCAATCGCCCTAATGACA 3’ | |
| SIX3 gRNA3 | F 5’ TTGGCTCTATGTGGCTGGCGGGTG 3’ |
Cell Culture
All human pluripotent stem cell studies were carried out in accordance with consent from the University of Queensland’s Institutional Human Research Ethics approval (HREC#: 2015001434). hiPSCs were maintained in mTeSR media (Stem Cell Technologies, Cat.#05850). Unless otherwise specified, cardiomyocyte directed differentiation using a monolayer platform was performed with a modified protocol based on previous reports(Burridge et al., 2014). On day −1 of differentiation, hPSCs were dissociated using 0.5% EDTA, plated into vitronectin coated plates at a density of 1.8 × 10⁵ cells/cm2, and cultured overnight in mTeSR media. Differentiation was induced on day 0 by first washing with PBS, then changing the culture media to RPMI (ThermoFisher, Cat.#11875119) containing 3μM CHIR99021 (Stem Cell Technologies, Cat.#72054), 500μg/mL BSA (Sigma Aldrich, Cat.#A9418), and 213μg/mL ascorbic acid (Sigma Aldrich, Cat.#A8960). After 3 days of culture, the media was replaced with RPMI containing 500μg/mL BSA, 213μg/mL ascorbic acid, and 5μM Xav-939 (Stem Cell Technologies, Cat.#72674). On day 5, the media was exchanged for RPMI containing 500μg/mL BSA, and 213μg/mL ascorbic acid without supplemental cytokines. From day 7 onwards, the cultures were fed every 2 days with RPMI plus 1x B27 supplement plus insulin (Life Technologies Australia, Cat.#17504001).
Quantitative RT-PCR
For quantitative RT-PCR, total RNA was isolated using the RNeasy Mini kit (Qiagen, Cat.#74106). First-strand cDNA synthesis was generated using the Superscript III First Strand Synthesis System (ThermoFisher, Cat.#18080051). Quantitative RT-PCR was performed using SYBR Green PCR Master Mix (ThermoFisher, Cat.#4312704) on a ViiA 7 Real-Time PCR System (Applied Biosystems). The copy number for each transcript is expressed relative to that of housekeeping gene HPRT1. Samples were run in biological triplicate. FC was calculated on a gene by gene basis as gene expression divided by control gene expression. The following are qRT-PCR primers utilized in this study:
R 5’ AAACCACCCGCCAGCCACATAGAG 3’
| Gene Name | 5’-Forward Primer-3’ | 5’-Reverse Primer-3’ |
|---|---|---|
| HPRT | TGACACTGGCAAAACAATGCA | GGTCCTTTTCACCAGCAAGCT |
| SIX3 | GCAGAAGACGCATTGCTTCAA | CCCAGCAAGAAACGCGAAC |
| SOX2 | TGGACAGTTACGCGCACAT | CGAGTAGGACATGCTGTAGGT |
| HHEX | AATGCTGGATGATGACCACT | TAATTGAGCAGTGCACCAAA |
| GATA6 | TGCAATGCTTGTGGACTCTA | GTGGGGGAAGTATTTTTGCT |
| SOX17 | ACGCCGAGTTGAGCAAGA | TCTGCCTCCTCCACGAAG |
| FOXA2 | TGCACTCGGCTTCCAGTATG | CATGTTGCTCACGGAGGAGT |
| NODAL | TGGAGGTGGGATGAAGTCACCTAT | AACCCAGCCTGAGGCAATGAGATT |
| GSC | GAGGAGAAAGTGGAGGTCTGGTT | CTCTGATGAGGACCGCTTCTG |
| EOMES | CACATTGTAGTGGGCAGTGG | CGCCACCAAACTGAGATGAT |
| SOX7 | TGACAACTTGTTGCCAACTCCCTG | TTCAGCAGTGGAGGAAGAGCAGAA |
| GATA4 | GACCTGGGACTTGGAGGATA | ACAGGAGAGATGCAGTGTGC |
| MIXL | GGCGTCAGAGTGGGAAAT CC | GGCAGGCAGTTCACATCTACC |
| DKK1 | AACAGCTATCCAAATGCAG | TCACAGGGGAGTTCCATAAA |
| MEST | CTGTGGGTGTGGTTGGAAGT | TGTCACTGAAGCCAAAGCCT |
| T (Bry) | GTCAGAATAGGTTGGAGAATTG | CAAATCCTCATCCTCAGTTTG |
| MESP1 | TCGAAGTGGTTCCTTGGCAGAC | CCTCCTGCTTGCCTCAAAGTGTC |
| WNT8A | GCAGAGGCGGAACTGATCTT | CGACCCTCTGTGCCATAGATG |
| WNT3A | AACTACGTGGAGATCATGCCC | GACTCCCTGGTAGCTTTGTC |
| APLNR | CCGCAGACCCTTTCATCCTT | ACACCCCTCCATCCTCTCTC |
| DLL1 | TGGGGAGAAAGTGTGCAACC | TGCATTCCCCTGGTTTGTCA |
| CDX2 | CTCGGCAGCCAAGTGAAAAC | TGCGGTTCTGAAACCAGATTTT |
Flow Cytometry
On day 2 of cardiac differentiation cells were dissociated using 0.5% EDTA and put into blocking buffer of 50% fetal bovine serum (FBS) in Dulbecco’s Modified Eagle Medium (DMEM)/F12 (ThermoFisher, Cat.#11320033). Cells were then pelleted and resuspended in 10% FBS in DMEM media. Cells were labeled live for flow cytometry using CD184 (BD Biosciences, Cat.#555974), EpCAM (BD Biosciences, Cat.#347199) and corresponding isotype controls were used to gate the cells. On day 15 of cardiac differentiation cells were fixed with 4% paraformaldehyde (Sigma, Cat.#158127) and permeabilized in 0.75% saponin (Sigma, Cat.#S7900). On day 15 of cardiac differentiation fixed cells were labeled for flow cytometry using alpha-actinin (Miltenyi Biotec, Cat.#130106937) and corresponding isotype control. Cells were analyzed using a BD FACSCANTO II (BD Biosciences) with FACSDiva software (BD Biosciences). Data analysis was performed using FlowJo (Tree Star).
Ciona robusta CRISPR/Cas9 Gene Editing
For Rnf220 (KH2012:KH.C8.791) loss of function, 3 sgRNAs were designed to avoid genomic off-targets and tested as described (Stolfi et al., 2014). sgRNA expressing cassettes (U6 > sgRNA) were assembled by single step overlap PCR. Individual PCR products (~25 μg) were electroporated with EF1a > NLS::Cas9::NLS (20 μg), Myod905 > Venus (50 μg), driving ubiquitous expression of Cas9 and a widely expressed fluorescent reporter construct, respectively, as described (Christiaen et al., 2009). Efficient electroporation was confirmed by observation of fluorescence before genomic DNA extraction around 16 hpf (18°C) using QIAamp DNA Micro kit (Qiagen, German Town, MD). Mutagenesis efficacy of individual sgRNAs, as a linear function of Cas9-induced indel frequency, was estimated from electrophoregrams following Sanger sequencing of the targeted regions amplified from extracted genomic DNA by PCR. Results of the relative quantification of the indel frequency (‘corrected peakshift’ of 22% and 16%) for sgRNAs 2 and 3 was considered high enough for both sgRNAs targeting Rnf220, which were finally selected. The corresponding cassettes were cloned into plasmid for repeated electroporations to study the loss of function of Rnf220. In order to control the specificity of the CRISPR/Cas9 system, sgRNAs targeting Tyrosinase, a gene not expressed in the cardiopharyngeal lineage, was electroporated in parallel. For imaging experiments, sgRNAs (25 μg) were electroporated with Mesp > NLS::Cas9::NLS (20 μg), Mesp > H2B:GFP (50 μg) and Mesp > mCherry (50 μg). Sequences of the DNA targets and oligonucleotides used for the sgRNAs:
| sgRNA name | Universal sgRNA name | Protospacer + PAM Sequence | Doench 16’ score |
|---|---|---|---|
| RNF220_sg1 | RNF220_p.A | GCGATGAACGGATGCGCTGG CGG | 64 |
| RNF220_sg2 | RNF220.e1.A | GGGTCGGGTTGATTGCACTT GGG | 63 |
| RNF220_sg3 | RNF220.e1.B | CCCCCACCAGACTTCAGCAG CGG | 65 |
| TyrC | sgTYR_e5.B | TCGATACTACCTGCTTAAGT GGG | 54 |
| sgRNA name | OSO Primer Forward |
|---|---|
| RNF220_sg1 | gCGATGAACGGATGCGCTGG gtttaagagctatgctggaaacag |
| RNF220_sg2 | gGGTCGGGTTGATTGCACTT gtttaagagctatgctggaaacag |
| RNF220_sg3 | gCCCCACCAGACTTCAGCAG gtttaagagctatgctggaaacag |
| TyrC | gCGATACTACCTGCTTAAGT gtttaagagctatgctggaaacag |
| OSO Primer Reverse | |
| RNF220_sg1 | CCAGCGCATCCGTTCATCG catctataccatcggatgccttc |
| RNF220_sg2 | AAGTGCAATCAACCCGACC catctataccatcggatgccttc |
| RNF220_sg3 | CTGCTGAAGTCTGGTGGGG catctataccatcggatgccttc |
| TyrC | ACTTAAGCAGGTAGTATCG catctataccatcggatgccttc |
Embryos were fixed in 4% MEM-FA for 30 minutes, incubated with an NH4Cl solution, and imaged using Leica SP8 X Confocal microscope.
QUANTIFICATION AND STATISTICAL ANALYSIS
Unless otherwise noted, all data are represented as mean ± standard error of mean (SEM). Indicated sample sizes (n) represent biological replicates including independent cell culture replicates and individual tissue samples. No methods were used to determine whether data met assumptions of the statistical approach or not. Due to the nature of the experiments, randomization was not performed and the investigators were not blinded. Statistical significance was determined in GraphPad Prism 7 software by using student’s t test (unpaired, two-tailed) or ordinary one-way ANOVA unless otherwise noted. Results were considered to be significant at p < 0.01(*). Statistical parameters are reported in the respective figures and figure legends. All statistical data are represented as mean ± SEM.
Supplementary Material
KEY RESOURCES TABLE.
| REAGENT or RESOURCE | SOURCE | IDENTIFIER |
|---|---|---|
| Antibodies | ||
| Mouse monoclonal anti-CD184, PE conjugated (clone 12G5) | BD Biosciences | Cat# 555974; RRID:AB_396267 |
| Mouse monoclonal anti-EpCAM, PerCP-Cy5.5 conjugated (clone EBA-1) | BD Biosciences | Cat# 347199; RRID:AB_400263 |
| Human monoclonal anti-α-actinin (Sarcomeric), PE conjugated (clone REA402) | Miltenyi Biotec | Cat# 130-106-937; RRID:AB_2654307 |
| Mouse monoclonal IgG1 k, PerCP-Cy5.5 conjugated (clone MOPC-21) | BD Biosciences | Cat# 550795; RRID:AB_393885 |
| Mouse monoclonal IgG1 k, PE conjugated (clone MOPC-21) | BD Biosciences | Cat# 555749; RRID:AB_396091 |
| Bacterial and Virus Strains | ||
| pQM-u6g-CNKB doxycycline inducible construct | Gift from Dr. Bruce Conklin, UCSF, Gladstone Institute, US (Mandegar et al., 2016) | N/A |
| Chemicals, Peptides, and Recombinant Proteins | ||
| Vitronectin XF | STEMCELL Technologies | Cat.#07180 |
| MTeSR | STEMCELL Technologies | Cat.#05850 |
| RPMI | ThermoFisher | Cat.#11875119 |
| CHIR99021 (CHIR) | STEMCELL Technologies | Cat.#72054 |
| Bovine Serum Albumin, (BSA) | Sigma | Cat.#A9418 |
| L-Ascorbic acid 2-phosphate sesquimagnesium salt hydrate (ascorbic acid) | Sigma | Cat.#A8960 |
| XAV939 | STEMCELL Technologies | Cat.#72674 |
| B-27 Supplement (50X), serum free | ThermoFisher | Cat.#17504001 |
| Blasticidine S hydrochloride (blasticidine) | Sigma | Cat.#15205 |
| Doxycycline hyclate (dox) | Sigma | Cat.#D9891 |
| ROCK inhibitor Y-27632 (ROCKi) | STEMCELL Technologies | Cat.#72308 |
| SuperScript III First-Strand Synthesis System | ThermoFisher | Cat.#18080051 |
| SYBR Green PCR Master Mix | ThermoFisher | Cat.#4312704 |
| Saponin from quillaja bark | Sigma | Cat.#S7900 |
| Paraformaldehyde, (PFA) | Sigma | Cat.#158127 |
| Critical Commercial Assays | ||
| Neon Transfection System 10μL Kit | Invitrogen | Cat.#MPK1096 |
| Experimental Models: Cell Lines | ||
| Human iPSC: WTC CRISPRi GCaMP | Gift from Dr. Bruce Conklin, UCSF, Gladstone Institute, US (Mandegar et al., 2016) | CVCL_VM38 |
| Human iPSC: WTC CRISPRi SIX3-g2 hiPSCs | This paper | N/A |
| Experimental Models: Organisms/Strains | ||
| CIONA | ||
| Wild Ciona intestinalis (Pacific species, also designated Ciona robusta) | M-REP | N/A |
| Oligonucleotides | ||
| See “WTC CRISPRi SIX3-g2 hiPSCs”; “Ciona robusta CRISPR/Cas9 gene editing”; and “Quantitative RT-PCR” for CRISPR/CRISPRi gRNA oligos and qPCR primer sequences | This paper | N/A |
| Software and Algorithms | ||
| Bedtools | Quinlan and Hall, 2010 | http://quinlanlab.org/tutorials/bedtools/bedtools.html |
| Seurat | Butler et al., 2018 | https://satijalab.org/seurat/install.html |
| CORE | Senabouth et al., 2019 | https://github.com/powellgenomicslab/ascend |
| SC3 | Kiselev et al., 2017 | https://github.com/hemberg-lab/SC3 |
| FlowJo | Tree Star | https://www.flowjo.com |
| BD FACSDiva Software | BD Biosciences | https://www.bdbiosciences.com/en-us/instruments/research-instruments/research-software/flow-cytometry-acquisition/facsdiva-software |
| GraphPad Prism 6 | GraphPad Software | http://www.graphpad.com/scientificsoftware/prism/ |
| ggplot2 | Wickham H. | https://ggplot2.tidyverse.org |
| Other | ||
| RNeasy Mini Kit | QIAGEN | Cat.#74106 |
Highlights.
Repressive H3K27me3 marks inhibit expression of genes that control other cell types
An RTS was devised using H3K27me3 broad domains and measured for all genes
TRIAGE uses RTS values to infer regulatory genes using any genome-wide data from any cell type
TRIAGE is useful for biological discovery in application to any cell type or species
ACKNOWLEDGMENTS
E.S. acknowledges funding by the Children’s Hospital Foundation Queensland (award reference number: 50268). B.V. acknowledges funding by the American Heart Association grant #18PRE33990254. The Ciona work was supported by NIH/NHLBI award R01 HL108643 to L.C., M.A. was supported by the Swiss National Science Foundation (project P2LAP3_178056), and P.P.L.T. is supported by the National Health and Medical Research Council of Australia (grant 1110751). Q.N. is supported by an ARC DECRA (the ARC DECRA DE190100116). N.P. is supported by the National Health and Medical Research Council of Australia (grant 1143163) and the Australian Research Council (grant SR1101002).
Footnotes
DECLARATION OF INTERESTS
The authors declare no competing interests.
SUPPLEMENTAL INFORMATION
Supplemental Information can be found online at https://doi.org/10.1016/j.cels.2020.11.001.
REFERENCES
- Adsera CB, Park YP, Meuleman W, and Kellis M (2019). Integrative analysis of 10,000 epigenomic maps across 800 samples for regulatory genomics and disease dissection. bioRxiv https://www.biorxiv.org/content/10.1101/810291v2.
- Alexa A (2019). topGO: enrichment analysis for gene Ontology. R package version 2.38.1. [Google Scholar]
- Alexanian M, Maric D, Jenkinson SP, Mina M, Friedman CE, Ting CC, Micheletti R, Plaisance I, Nemir M, Maison D, et al. (2017). A transcribed enhancer dictates mesendoderm specification in pluripotency. Nat. Commun 8, 1806. [DOI] [PMC free article] [PubMed] [Google Scholar]
- Anand P, Brown JD, Lin CY, Qi J, Zhang R, Artero PC, Alaiti MA, Bullard J, Alazem K, Margulies KB, et al. (2013). BET bromodomains mediate transcriptional pause release in heart failure. Cell 154, 569–582. [DOI] [PMC free article] [PubMed] [Google Scholar]
- Anderson HE, and Christiaen L (2016). Ciona as a simple chordate model for heart development and regeneration. J. Cardiovasc. Dev. Dis 3, 25. [DOI] [PMC free article] [PubMed] [Google Scholar]
- Andersson R, Gebhard C, Miguel-Escalada I, Hoof I, Bornholdt J, Boyd M, Chen Y, Zhao X, Schmidl C, Suzuki T, et al. (2014). An atlas of active enhancers across human cell types and tissues. Nature 507, 455–461. [DOI] [PMC free article] [PubMed] [Google Scholar]
- Ashburner M, Ball CA, Blake JA, Botstein D, Butler H, Cherry JM, Davis AP, Dolinski K, Dwight SS, Eppig JT, et al. (2000). Gene ontology: tool for the unification of biology. The Gene Ontology Consortium. Nat. Genet 25, 25–29. [DOI] [PMC free article] [PubMed] [Google Scholar]
- Barski A, Cuddapah S, Cui K, Roh TY, Schones DE, Wang Z, Wei G, Chepelev I, and Zhao K (2007). High-resolution profiling of histone methylations in the human genome. Cell 129, 823–837. [DOI] [PubMed] [Google Scholar]
- Benayoun BA, Pollina EA, Ucar D, Mahmoudi S, Karra K, Wong ED, Devarajan K, Daugherty AC, Kundaje AB, Mancini E, et al. (2014). H3K4me3 breadth is linked to cell identity and transcriptional consistency. Cell 158, 673–688. [DOI] [PMC free article] [PubMed] [Google Scholar]
- Boyer LA, Plath K, Zeitlinger J, Brambrink T, Medeiros LA, Lee TI, Levine SS, Wernig M, Tajonar A, Ray MK, et al. (2006). Polycomb complexes repress developmental regulators in murine embryonic stem cells. Nature 441, 349–353. [DOI] [PubMed] [Google Scholar]
- Burridge PW, Matsa E, Shukla P, Lin ZC, Churko JM, Ebert AD, Lan F, Diecke S, Huber B, Mordwinkin NM, et al. (2014). Chemically defined generation of human cardiomyocytes. Nat. Methods 11, 855–860. [DOI] [PMC free article] [PubMed] [Google Scholar]
- Butler A, Hoffman P, Smibert P, Papalexi E, and Satija R (2018). Integrating single-cell transcriptomic data across different conditions, technologies, and species. Nat. Biotechnol 36, 411–420. [DOI] [PMC free article] [PubMed] [Google Scholar]
- Cahan P, Li H, Morris SA, Lummertz da Rocha EL, Daley GQ, and Collins JJ (2014). CellNet: network biology applied to stem cell engineering. Cell 158, 903–915. [DOI] [PMC free article] [PubMed] [Google Scholar]
- Cao J, Spielmann M, Qiu X, Huang X, Ibrahim DM, Hill AJ, Zhang F, Mundlos S, Christiansen L, Steemers FJ, et al. (2019). The single-cell transcriptional landscape of mammalian organogenesis. Nature 566, 496–502. [DOI] [PMC free article] [PubMed] [Google Scholar]
- Carl M, Loosli F, and Wittbrodt J (2002). Six3 inactivation reveals its essential role for the formation and patterning of the vertebrate eye. Development 129, 4057–4063. [DOI] [PubMed] [Google Scholar]
- Christiaen L, Wagner E, Shi W, and Levine M (2009). Electroporation of transgenic DNAs in the sea squirt Ciona. Cold Spring Harb. Protoc. 2009, pdb.prot5345. [DOI] [PubMed] [Google Scholar]
- Creyghton MP, Cheng AW, Welstead GG, Kooistra T, Carey BW, Steine EJ, Hanna J, Lodato MA, Frampton GM, Sharp PA, et al. (2010). Histone H3K27ac separates active from poised enhancers and predicts developmental state. Proc. Natl. Acad. Sci. USA 107, 21931–21936. [DOI] [PMC free article] [PubMed] [Google Scholar]
- D’Alessio AC, Fan ZP, Wert KJ, Baranov P, Cohen MA, Saini JS, Cohick E, Charniga C, Dadon D, Hannett NM, et al. (2015). A systematic approach to identify candidate transcription factors that control cell identity. Stem Cell Rep. 5, 763–775. [DOI] [PMC free article] [PubMed] [Google Scholar]
- Duan Q, McMahon S, Anand P, Shah H, Thomas S, Salunga HT, Huang Y, Zhang R, Sahadevan A, Lemieux ME, et al. (2017). BET bromodomain inhibition suppresses innate inflammatory and profibrotic transcriptional networks in heart failure. Sci. Transl. Med 9. [DOI] [PMC free article] [PubMed] [Google Scholar]
- Eisenberg E, and Levanon EY (2013). Human housekeeping genes, revisited. Trends Genet. 29, 569–574. [DOI] [PubMed] [Google Scholar]
- FANTOM Consortium; the RIKEN PMI and CLST (DGT), Forrest AR, Kawaji H, Rehli M, Baillie JK, de Hoon MJ, Haberle V, Lassmann T, Kulakovskiy IV, Lizio M, et al. (2014). A promoter-level mammalian expression atlas. Nature 507, 462–470. [DOI] [PMC free article] [PubMed] [Google Scholar]
- Feng J, Liu T, Qin B, Zhang Y, and Liu XS (2012). Identifying ChIP-seq enrichment using MACS. Nat. Protoc 7, 1728–1740. [DOI] [PMC free article] [PubMed] [Google Scholar]
- Friedman CE, Nguyen Q, Lukowski SW, Helfer A, Chiu HS, Miklas J, Levy S, Suo S, Han J-DJ, Osteil P, et al. (2018). Single-cell transcriptomic analysis of cardiac differentiation from human PSCs reveals HOPX-dependent cardiomyocyte maturation. Cell Stem Cell 23, 586–598.e8. [DOI] [PMC free article] [PubMed] [Google Scholar]
- Fujikura J, Yamato E, Yonemura S, Hosoda K, Masui S, Nakao K, Miyazaki Ji J, and Niwa H (2002). Differentiation of embryonic stem cells is induced by GATA factors. Genes Dev. 16, 784–789. [DOI] [PMC free article] [PubMed] [Google Scholar]
- Grote P, and Herrmann BG (2013). The long non-coding RNA Fendrr links epigenetic control mechanisms to gene regulatory networks in mammalian embryogenesis. RNA Biol. 10, 1579–1585. [DOI] [PMC free article] [PubMed] [Google Scholar]
- Consortium GTEx (2013). The Genotype-Tissue Expression (GTEx) project. Nat. Genet. 45, 580–585. [DOI] [PMC free article] [PubMed] [Google Scholar]
- Haider S, Ballester B, Smedley D, Zhang J, Rice P, and Kasprzyk A (2009). BioMart central portal–unified access to biological data. Nucleic Acids Res. 37, W23–W27. [DOI] [PMC free article] [PubMed] [Google Scholar]
- Heinz S, Benner C, Spann N, Bertolino E, Lin YC, Laslo P, Cheng JX, Murre C, Singh H, and Glass CK (2010). Simple combinations of lineage-determining transcription factors prime cis-regulatory elements required for macrophage and B cell identities. Mol. Cell 38, 576–589. [DOI] [PMC free article] [PubMed] [Google Scholar]
- Hnisz D, Abraham BJ, Lee TI, Lau A, Saint-André V, Sigova AA, Hoke HA, and Young RA (2013). Super-enhancers in the control of cell identity and disease. Cell 155, 934–947. [DOI] [PMC free article] [PubMed] [Google Scholar]
- Jiang Y, Qian F, Bai X, Liu Y, Wang Q, Ai B, Han X, Shi S, Zhang J, Li X, et al. (2019). SEdb: a comprehensive human super-enhancer database. Nucleic Acids Res. 47, D235–D243. [DOI] [PMC free article] [PubMed] [Google Scholar]
- Kanehisa M, and Goto S (2000). KEGG: Kyoto encyclopedia of genes and genomes. Nucleic Acids Res. 28, 27–30. [DOI] [PMC free article] [PubMed] [Google Scholar]
- Kharchenko PV, Tolstorukov MY, and Park PJ (2008). Design and analysis of ChIP-seq experiments for DNA-binding proteins. Nat. Biotechnol 26, 1351–1359. [DOI] [PMC free article] [PubMed] [Google Scholar]
- Kim MS, Pinto SM, Getnet D, Nirujogi RS, Manda SS, Chaerkady R, Madugundu AK, Kelkar DS, Isserlin R, Jain S, et al. (2014). A draft map of the human proteome. Nature 509, 575–581. [DOI] [PMC free article] [PubMed] [Google Scholar]
- Kiselev VY, Kirschner K, Schaub MT, Andrews T, Yiu A, Chandra T, Natarajan KN, Reik W, Barahona M, Green AR, and Hemberg M (2017). SC3: consensus clustering of single-cell RNA-seq data. Nat. Methods 14, 483–486. [DOI] [PMC free article] [PubMed] [Google Scholar]
- Lagutin OV, Zhu CC, Kobayashi D, Topczewski J, Shimamura K, Puelles L, Russell HR, Mckinnon PJ, Solnica-Krezel L, and Oliver G (2003). Six3 repression of Wnt signaling in the anterior neuroectoderm is essential for vertebrate forebrain development. Genes Dev. 17, 368–379. [DOI] [PMC free article] [PubMed] [Google Scholar]
- Lee TI, Jenner RG, Boyer LA, Guenther MG, Levine SS, Kumar RM, Chevalier B, Johnstone SE, Cole MF, Isono K, et al. (2006). Control of developmental regulators by Polycomb in human embryonic stem cells. Cell 125, 301–313. [DOI] [PMC free article] [PubMed] [Google Scholar]
- Love MI, Huber W, and Anders S (2014). Moderated estimation of fold change and dispersion for RNA-seq data with DESeq2. Genome Biol. 15, 550. [DOI] [PMC free article] [PubMed] [Google Scholar]
- Lovén J, Hoke HA, Lin CY, Lau A, Orlando DA, Vakoc CR, Bradner JE, Lee TI, and Young RA (2013). Selective inhibition of tumor oncogenes by disruption of super-enhancers. Cell 153, 320–334. [DOI] [PMC free article] [PubMed] [Google Scholar]
- Ma P, Yang X, Kong Q, Li C, Yang S, Li Y, and Mao B (2014). The ubiquitin ligase RNF220 enhances canonical Wnt signaling through USP7-mediated deubiquitination of beta-catenin. Mol. Cell. Biol 34, 4355–4366. [DOI] [PMC free article] [PubMed] [Google Scholar]
- Mandegar MA, Huebsch N, Frolov EB, Shin E, Truong A, Olvera MP, Chan AH, Miyaoka Y, Holmes K, Spencer CI, et al. (2016). CRISPR interference efficiently induces specific and reversible gene silencing in human iPSCs. Cell Stem Cell 18, 541–553. [DOI] [PMC free article] [PubMed] [Google Scholar]
- Margueron R, and Reinberg D (2011). The Polycomb complex PRC2 and its mark in life. Nature 469, 343–349. [DOI] [PMC free article] [PubMed] [Google Scholar]
- Morris SA, and Daley GQ (2013). A blueprint for engineering cell fate: current technologies to reprogram cell identity. Cell Res. 23, 33–48. [DOI] [PMC free article] [PubMed] [Google Scholar]
- Nakamura R, Tsukahara T, Qu W, Ichikawa K, Otsuka T, Ogoshi K, Saito TL, Matsushima K, Sugano S, Hashimoto S, et al. (2014). Large hypomethylated domains serve as strong repressive machinery for key developmental genes in vertebrates. Development 141, 2568–2580. [DOI] [PubMed] [Google Scholar]
- Nakatake Y, Ko SBH, Sharov AA, Wakabayashi S, Murakami M, Sakota M, Chikazawa N, Ookura C, Sato S, Ito N, et al. (2020). Generation and profiling of 2,135 human ESC lines for the systematic analyses of cell states perturbed by inducing single transcription factors. Cell Rep. 31, 107655. [DOI] [PubMed] [Google Scholar]
- Paige SL, Thomas S, Stoick-Cooper CL, Wang H, Maves L, Sandstrom R, Pabon L, Reinecke H, Pratt G, Keller G, et al. (2012). A temporal chromatin signature in human embryonic stem cells identifies regulators of cardiac development. Cell 151, 221–232. [DOI] [PMC free article] [PubMed] [Google Scholar]
- Palpant NJ, Pabon L, Friedman CE, Roberts M, Hadland B, Zaunbrecher RJ, Bernstein I, Zheng Y, and Murry CE (2017a). Generating high-purity cardiac and endothelial derivatives from patterned mesoderm using human pluripotent stem cells. Nat. Protoc 12, 15–31. [DOI] [PMC free article] [PubMed] [Google Scholar]
- Palpant NJ, Wang Y, Hadland B, Zaunbrecher RJ, Redd M, Jones D, Pabon L, Jain R, Epstein J, Ruzzo WL, et al. (2017b). Chromatin and transcriptional analysis of mesoderm progenitor cells identifies HOPX as a regulator of primitive hematopoiesis. Cell Rep. 20, 1597–1608. [DOI] [PMC free article] [PubMed] [Google Scholar]
- Peng G, Suo S, Chen J, Chen W, Liu C, Yu F, Wang R, Chen S, Sun N, Cui G, et al. (2016). Spatial transcriptome for the molecular annotation of lineage fates and cell identity in mid-gastrula mouse embryo. Dev. Cell 36, 681–697. [DOI] [PubMed] [Google Scholar]
- Peng G, Suo S, Cui G, Yu F, Wang R, Chen J, Chen S, Liu Z, Chen G, Qian Y, et al. (2019). Molecular architecture of lineage allocation and tissue organization in early mouse embryo. Nature 572, 528–532. [DOI] [PubMed] [Google Scholar]
- Pérez-Lluch S, Blanco E, Tilgner H, Curado J, Ruiz-Romero M, Corominas M, and Guigó R (2015). Absence of canonical marks of active chromatin in developmentally regulated genes. Nat. Genet. 47, 1158–1167. [DOI] [PMC free article] [PubMed] [Google Scholar]
- Quinlan AR, and Hall IM (2010). BEDTools: a flexible suite of utilities for comparing genomic features. Bioinformatics 26, 841–842. [DOI] [PMC free article] [PubMed] [Google Scholar]
- Rackham OJ, Firas J, Fang H, Oates ME, Holmes ML, Knaupp AS, FANTOM Consortium, Suzuki H, Nefzger CM, Daub CO, et al. (2016). A predictive computational framework for direct reprogramming between human cell types. Nat. Genet 48, 331–335. [DOI] [PubMed] [Google Scholar]
- Rada-Iglesias A, Bajpai R, Swigut T, Brugmann SA, Flynn RA, and Wysocka J (2011). A unique chromatin signature uncovers early developmental enhancers in humans. Nature 470, 279–283. [DOI] [PMC free article] [PubMed] [Google Scholar]
- Rajabi M, Kassiotis C, Razeghi P, and Taegtmeyer H (2007). Return to the fetal gene program protects the stressed heart: a strong hypothesis. Heart Fail. Rev 12, 331–343. [DOI] [PubMed] [Google Scholar]
- Rehimi R, Nikolic M, Cruz-Molina S, Tebartz C, Frommolt P, Mahabir E, Clément-Ziza M, and Rada-Iglesias A (2016). Epigenomics-based identification of major cell identity regulators within heterogeneous cell populations. Cell Rep. 17, 3062–3076. [DOI] [PubMed] [Google Scholar]
- Rinn JL, Kertesz M, Wang JK, Squazzo SL, Xu X, Brugmann SA, Goodnough LH, Helms JA, Farnham PJ, Segal E, and Chang HY (2007). Functional demarcation of active and silent chromatin domains in human HOX loci by noncoding RNAs. Cell 129, 1311–1323. [DOI] [PMC free article] [PubMed] [Google Scholar]
- Roadmap Epigenomics Consortium, Kundaje A, Meuleman W, Ernst J, Bilenky M, Yen A, Heravi-Moussavi A, Kheradpour P, Zhang Z, Wang J, et al. (2015). Integrative analysis of 111 reference human epigenomes. Nature 518, 317–330. [DOI] [PMC free article] [PubMed] [Google Scholar]
- Russ AP, Wattler S, Colledge WH, Aparicio SA, Carlton MB, Pearce JJ, Barton SC, Surani MA, Ryan K, Nehls MC, et al. (2000). Eomesodermin is required for mouse trophoblast development and mesoderm formation. Nature 404, 95–99. [DOI] [PubMed] [Google Scholar]
- Schug J, Schuller WP, Kappen C, Salbaum JM, Bucan M, and Stoeckert CJ jr. (2005). Promoter features related to tissue specificity as measured by Shannon entropy. Genome Biol. 6, R33. [DOI] [PMC free article] [PubMed] [Google Scholar]
- Scornavacca C, Zickmann F, and Huson DH (2011). Tanglegrams for rooted phylogenetic trees and networks. Bioinformatics 27, i248–i256. [DOI] [PMC free article] [PubMed] [Google Scholar]
- Scrucca L, Fop M, Murphy TB, and Raftery AE (2016). mclust 5: clustering, classification and density estimation using Gaussian finite mixture models. The R Journal 8, 289–317. [PMC free article] [PubMed] [Google Scholar]
- Senabouth A, Lukowski SW, Hernandez JA, Andersen SB, Mei X, Nguyen QH, and Powell JE (2019). ascend: R package for analysis of single-cell RNA-seq data. GigaScience 8. [DOI] [PMC free article] [PubMed] [Google Scholar]
- Sharov AA, Schlessinger D, and Ko MS (2015). ExAtlas: an interactive online tool for meta-analysis of gene expression data. J. Bioinform. Comput. Biol 13, 1550019. [DOI] [PMC free article] [PubMed] [Google Scholar]
- Steinmetz PR, Urbach R, Posnien N, Eriksson J, Kostyuchenko RP, Brena C, Guy K, Akam M, Bucher G, and Arendt D (2010). Six3 demarcates the anterior-most developing brain region in bilaterian animals. EvoDevo 1, 14. [DOI] [PMC free article] [PubMed] [Google Scholar]
- Stergachis AB, Neph S, Reynolds A, Humbert R, Miller B, Paige SL, Vernot B, Cheng JB, Thurman RE, Sandstrom R, et al. (2013). Developmental fate and cellular maturity encoded in human regulatory DNA landscapes. Cell 154, 888–903. [DOI] [PMC free article] [PubMed] [Google Scholar]
- Stolfi A, Gandhi S, Salek F, and Christiaen L (2014). Tissue-specific genome editing in Ciona embryos by CRISPR/Cas9. Development 141, 4115–4120. [DOI] [PMC free article] [PubMed] [Google Scholar]
- Tabula Muris Consortium; Overall coordination, Logistical coordination, Organ collection and processing, Library preparation and sequencing, Computational data analysis, Cell type annotation, Writing group, Supplemental text writing group, and Principal investigators (2018). Single-cell transcriptomics of 20 mouse organs creates a Tabula Muris. Nature 562, 367–372. [DOI] [PMC free article] [PubMed] [Google Scholar]
- Takahashi K, and Yamanaka S (2006). Induction of pluripotent stem cells from mouse embryonic and adult fibroblast cultures by defined factors. Cell 126, 663–676. [DOI] [PubMed] [Google Scholar]
- Takeuchi JK, and Bruneau BG (2009). Directed transdifferentiation of mouse mesoderm to heart tissue by defined factors. Nature 459, 708–711. [DOI] [PMC free article] [PubMed] [Google Scholar]
- Tekendo-Ngongang C, Owosela B, Muenke M, and Kruszka P (2020). Comorbidity of congenital heart defects and holoprosencephaly is likely genetically driven and gene-specific. Am. J. Med. Genet C 184, 154–158. [DOI] [PubMed] [Google Scholar]
- Tian L, Dong X, Freytag S, Leˆ Cao KA, Su S, Jalalabadi A, Amann-Zalcenstein D, Weber TS, Seidi A, Jabbari JS, et al. (2019). Benchmarking single cell RNA-sequencing analysis pipelines using mixture control experiments. Nat. Methods 16, 479–487. [DOI] [PubMed] [Google Scholar]
- Tirosh I, Izar B, Prakadan SM, Wadsworth MH, Treacy D, Trombetta JJ, Rotem A, Rodman C, Lian C, Murphy G, et al. (2016). Dissecting the multicellular ecosystem of metastatic melanoma by single-cell RNA-seq. Science 352, 189–196. [DOI] [PMC free article] [PubMed] [Google Scholar]
- Van Handel B, Montel-Hagen A, Sasidharan R, Nakano H, Ferrari R, Boogerd CJ, Schredelseker J, Wang Y, Hunter S, Org T, et al. (2012). Scl represses cardiomyogenesis in prospective hemogenic endothelium and endocardium. Cell 150, 590–605. [DOI] [PMC free article] [PubMed] [Google Scholar]
- Verfaillie A, Imrichova H, Atak ZK, Dewaele M, Rambow F, Hulselmans G, Christiaens V, Svetlichnyy D, Luciani F, Van Den Mooter L, et al. (2015). Decoding the regulatory landscape of melanoma reveals TEADS as regulators of the invasive cell state. Nat. Commun 6, 6683. [DOI] [PMC free article] [PubMed] [Google Scholar]
- Viotti M, Niu L, Shi SH, and Hadjantonakis AK (2012). Role of the gut endoderm in relaying left-right patterning in mice. PLoS Biol. 10, e1001276. [DOI] [PMC free article] [PubMed] [Google Scholar]
- Waardenberg AJ, Ramialison M, Bouveret R, and Harvey RP (2014). Genetic networks governing heart development. Cold Spring Harb. Perspect. Med 4, a013839. [DOI] [PMC free article] [PubMed] [Google Scholar]
- Wang W, Niu X, Stuart T, Jullian E, Mauck WM 3rd, Kelly RG, Satija R, and Christiaen L (2019). A single-cell transcriptional roadmap for cardiopharyngeal fate diversification. Nat. Cell Biol 21, 674–686. [DOI] [PMC free article] [PubMed] [Google Scholar]
- Whyte WA, Orlando DA, Hnisz D, Abraham BJ, Lin CY, Kagey MH, Rahl PB, Lee TI, and Young RA (2013). Master transcription factors and mediator establish super-enhancers at key cell identity genes. Cell 153, 307–319. [DOI] [PMC free article] [PubMed] [Google Scholar]
- Wilson D, Charoensawan V, Kummerfeld SK, and Teichmann SA (2008). DBD–taxonomically broad transcription factor predictions: new content and functionality. Nucleic Acids Res. 36, D88–D92. [DOI] [PMC free article] [PubMed] [Google Scholar]
- Wu SF, Zhang H, and Cairns BR (2011). Genes for embryo development are packaged in blocks of multivalent chromatin in zebrafish sperm. Genome Res. 21, 578–589. [DOI] [PMC free article] [PubMed] [Google Scholar]
- Zhang HM, Liu T, Liu CJ, Song S, Zhang X, Liu W, Jia H, Xue Y, and Guo AY (2015). AnimalTFDB 2.0: a resource for expression, prediction and functional study of animal transcription factors. Nucleic Acids Res. 43, D76–D81. [DOI] [PMC free article] [PubMed] [Google Scholar]
- Zhang Y, Liu T, Meyer CA, Eeckhoute J, Johnson DS, Bernstein BE, Nusbaum C, Myers RM, Brown M, Li W, and Liu XS (2008). Model-based analysis of ChIP-seq (MACS). Genome Biol. 9, R137. [DOI] [PMC free article] [PubMed] [Google Scholar]
- Zhong YF, and Holland PW (2011). HomeoDB2: functional expansion of a comparative homeobox gene database for evolutionary developmental biology. Evol. Dev 13, 567–568. [DOI] [PMC free article] [PubMed] [Google Scholar]
Associated Data
This section collects any data citations, data availability statements, or supplementary materials included in this article.
Supplementary Materials
Data Availability Statement
Source data statement: This paper analyzes existing, publicly available data. These datasets’ accession numbers are provided in the manuscript text and Table S1.
Code statement: We provide the TRIAGE source code written in Python and R (https://github.com/woojunshim/TRIAGE). Users can also run the TRIAGE analysis using a web accessible interface (http://bioinf.scmb.uq.edu.au/adhoc/).
Scripts statement: The scripts used to generate the figures reported in this paper are available at https://github.com/woojunshim/TRIAGE.
Any additional information required to reproduce this work is available from the Lead Contact.