Figure 1.

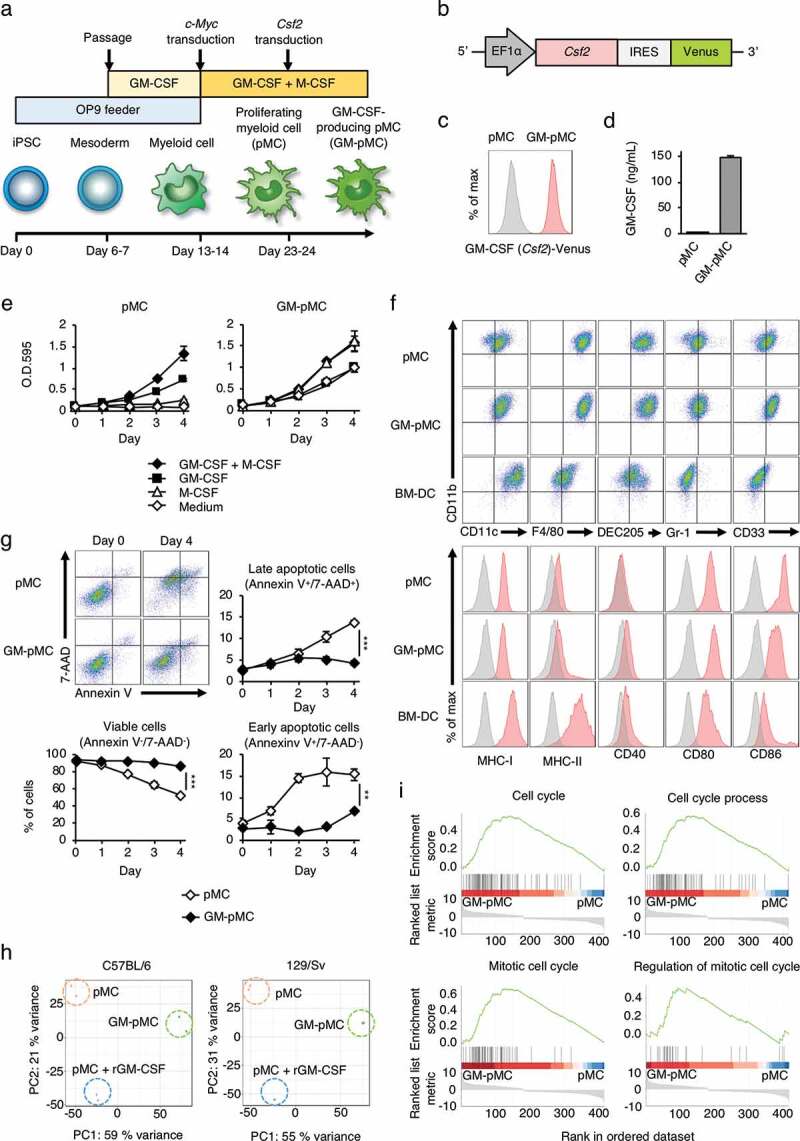
iPSC-derived proliferating myeloid cells were genetically engineered to express GM-CSF.
(a) Protocol for the generation of GM-pMCs. pMCs were established from iPSCs as described.15 After the proliferation of pMCs was stable, the Csf2 gene was introduced using a lentiviral vector. Cells were cultured in α-MEM supplemented with 20% FBS. Other supplements in the medium, and the feeder cells are indicated. (b) Schematic illustration of the lentiviral vector expressing Csf2. (c) The expression of the Csf2 gene was confirmed by flow cytometry using the expression of the Venus gene as an indicator. pMCs; gray, GM-pMCs; red. Additionally, see Figure S1a. (d) GM-CSF production. Cells (5.0 × 10⁵ cells/mL) were cultured for 24 h in 6-well culture plates. GM-CSF levels in the culture supernatants were evaluated using ELISA. Additionally, see Figure S1b. (e) Cell proliferation. Cells (2.0 × 10³ cells/well) were seeded in 96-well culture plates in the presence of the indicated cytokines. Proliferation was determined at each time point using the MTT assay. Medium served as a control. Additionally, see Figure S1c. (f) Characterization using flow cytometry. Upper panels, representative flow cytometry profiles of the indicated surface molecules. Lower panels, an expression of surface molecules associated with a T cell stimulation. BM-DC data served as a control. Additionally, see Figure S1e. (g) In vitro viability. Cells (2.0 × 10⁵ cells/well) were cultured in the absence of any cytokine. Cell viability was evaluated by flow cytometry at the indicated time points. Upper left panels, representative flow cytometry profiles. Annexin V−/7-AAD−, Annexin V+/7-AAD−, and Annexin V+/7-AAD+ cells were defined as viable cells, early apoptotic cells, and late apoptotic cells, respectively. Graph data represents the frequency of each cell. (h) Principal component analysis (PCA) of pMCs, pMCs cultured with recombinant GM-CSF, and GM-pMCs. Additionally, see Figure S1f and Tables S1-3. (i) Gene set enrichment analysis (GSEA) of the up-regulated genes in GM-pMCs (overlapping genes between the C57BL/6- and 129/Sv-derived groups). Additionally, see Figure S1g and Table S4. (c–g) Representative data from two independent experiments are presented. (d, e, g) Means ± SD (n = 3) are shown. *p < .05, **p < .01, ***p < .001.
