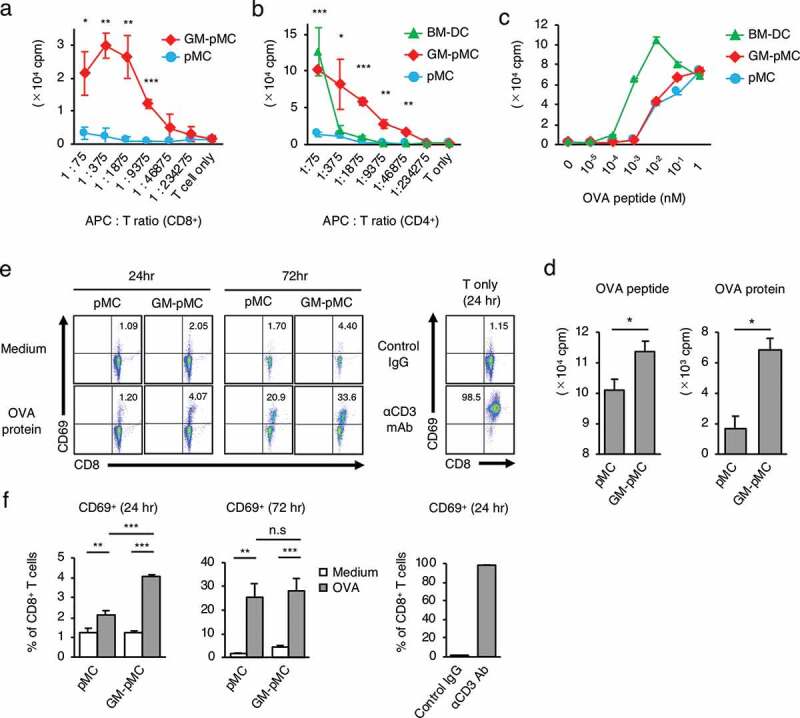
Figure 2.

GM-pMCs efficiently stimulate antigen-specific CD8+ T cells.
(a, b) T cell stimulation capacity. MHC-mismatched CD8+ (A) or CD4+ (b) T cells (1.5 × 10⁵ cells/well) from unprimed BALB/c mice were cultured with the graded doses of 85 Gy-irradiated pMCs, GM-pMCs, or BM-DCs (C57BL/6 strain) for six days. (c, d) T cell priming capacity in vitro. (c) Cells (2.5 × 10⁴ cells/well) were irradiated with 85 Gy and co-cultured with the naïve OT-1 CD8+ T cells (5.0 × 10⁴ cells/well) in the presence of OVA257-264 peptide at indicated concentration for four days. (d) Cells (1.0 × 10⁶ cells/mL) were pre-pulsed with 10 μM OVA257-264 peptide or 100 μg/mL OVA protein for 16 h. The cells were then washed twice to remove soluble antigens, seeded in 96-well culture plates (5.0 × 10⁴ cells/well), irradiated with 85 Gy, and co-cultured with the naïve OT-1 CD8+ T cells (1.0 × 10⁴ cells/well) for four days. Also see Figures S2c, d. (e, f) Cells (1.0 × 10⁶ cells/mL) were cultured in the presence or absence of 100 μg/mL OVA protein for 16 h. Then cells were washed twice to remove soluble antigens, seeded in 96-well culture plates (5.0 × 10⁴ cells/well), irradiated with 85 Gy, and co-cultured with naïve OT-1 CD8+ T cells (1.0 × 10⁵ cells/well). The frequency of activated (CD69+) cells in CD8+ T cells was evaluated using flow cytometry at the indicated time points. OT-1 CD8+ T cells stimulated with anti-CD3 mAb or control IgG served as references. (e) Representative flow cytometry profiles. (f) Summary of CD69+ cell frequency. (a–d) Cell proliferation was determined using 3H-thymidine uptake (16 h). (a–d, f) Means ± SD (n = 3) are shown. Representative data from two independent experiments are presented. *p < .05, **p < .01, ***p < .001.
