Figure 6.

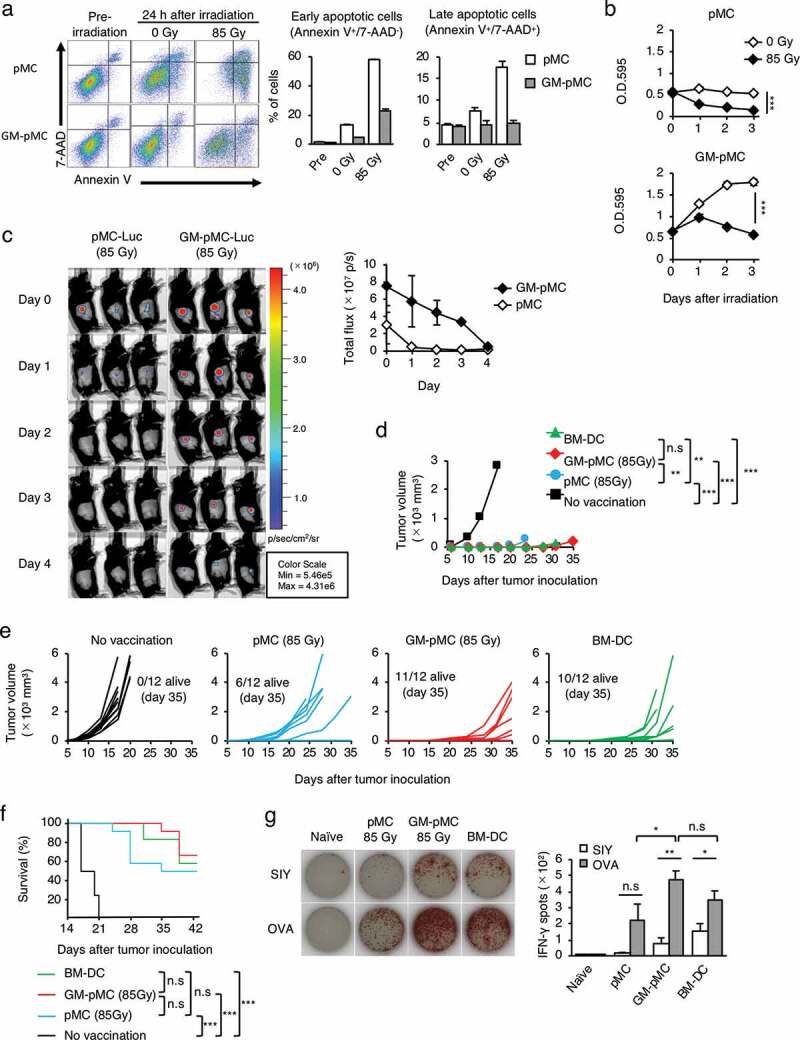
Irradiation controls in vivo GM-pMC survival while retaining antitumor efficacy.
(a) In vitro viability of irradiated pMCs and GM-pMCs. Cells (1.0 × 10⁵ cells/well) were seeded in 96-well culture plates and were 85 Gy-irradiated. The viability of cells (24 h) was evaluated using flow cytometry. Left panels, representative flow cytometry profiles. Bar graph (right panels) represents the frequency of early apoptotic and late apoptotic cells. Additionally, see Figure S6a. (b) Cell proliferation. Cells (2.0 × 10⁴ cells/well) were seeded in 96-well culture plates and left untreated or irradiated with 85 Gy. Proliferation was determined at each time point using the MTT assay. Additionally, see Figures S6a, b. (c) C57BL/6 mice were s.c. inoculated with luciferase-transduced pMCs or GM-pMCs (1.0 × 10⁶ cells) that were irradiated with 85 Gy prior to administration. In vivo cell survival was monitored at the indicated time points using bioluminescence imaging. Left panels, bioluminescence images. Graph (right panel), total flux (photon(s)) at the indicated time points. (a–c) Representative data from two independent experiments are presented. Means ± SD (n = 3) are shown. (d–g) C57BL/6 mice were i.p. vaccinated twice with the OVA257-264 peptide-loaded, the 85 Gy-irradiated pMCs or the GM-pMCs, or non-irradiated BM-DCs, and s.c. inoculated with MO4 tumor cells and monitored as in Figure 4a. Additionally, see Figures S6c-f. (d) Median tumor volume. (e) Tumor growth of individual mice. (f) Kaplan-Meier survival curves. (d–f) Data from two independent experiments are shown. (n = 12 mice). (g) IFN-γ ELOSPOT assay ex vivo on day 56 after inoculation, as in Figure 4e. Shown are the mean ± SEM of two independent experiments (n = 6–8). *p < .05, **p < .01, ***p < .001.
