

High‐throughput DNA analyses in cancers allow the detection of molecular abnormalities that can guide patients' treatment. The collection of a tumour DNA is mainly performed on a biopsy, an invasive procedure for the patients. Another less invasive method consists in using a fine needle. We showed that fine‐needle biopsies are as suitable as a classical biopsy for DNA analysis.
Keywords: core biopsy, fine‐needle aspiration, next‐generation sequencing, precision medicine, SHIVA02 trial, tumour molecular profiling
Abstract
High‐throughput molecular profiling of solid tumours using core needle biopsies (CNB) allows the identification of actionable molecular alterations, with around 70% success rate. Although several studies have demonstrated the utility of small biopsy specimens for molecular testing, there remains debate as to the sensitivity of the less invasive fine‐needle aspiration (FNA) compared to CNB to detect molecular alterations. We aimed to prospectively evaluate the potential of FNA to detect such alterations in various tumour types as compared to CNB in cancer patients included in the SHIVA02 trial. An in‐house amplicon‐based targeted sequencing panel (Illumina TSCA 99.3 kb panel covering 87 genes) was used to identify pathogenic variants and gene copy number variations (CNV) in concomitant CNB and FNA samples obtained from 61 patients enrolled in the SHIVA02 trial (NCT03084757). The main tumour types analysed were breast (38%), colon (15%), pancreas (11%), followed by cervix and stomach (7% each). We report 123 molecular alterations (85 variants, 23 amplifications and 15 homozygous deletions) among which 98 (80%) were concordant between CNB and FNA. The remaining discordances were mainly related to deletions status, yet undetected alterations were not exclusively specific to FNA. Comparative analysis of molecular alterations in CNB and FNA showed high concordance in terms of variants as well as CNVs identified. We conclude FNA could therefore be used in routine diagnostics workflow and clinical trials for tumour molecular profiling with the advantages of being minimally invasive and preserve tissue material needed for diagnostic, prognostic or theranostic purposes.
Abbreviations
- CNB
core needle biopsy
- CNV
copy number variation
- CT
computerized tomography
- EDTA
ethylenediaminetetraacetic acid
- FDR
false detection rate
- FNA
fine‐needle aspiration
- G
Gauge
- NGS
next‐generation sequencing
- QC
quality control
- RPMI
Roswell Park Memorial Institute
- SNV
single nucleotide variation
- TSCA
Truseq Custom Amplicon
1. Introduction
With the large deployment of next‐generation sequencing (NGS) and the increasing knowledge on cancer genomics goes an accelerated demand for molecular analyses.
Precision medicine clinical trials in oncology, based on molecular analyses to prevent, diagnose and treat patients, use image‐guided biopsies as the gold standard starting material to perform these analyses [1, 2, 3]. However, tumour inaccessibility and noncontributive samples limit the number of patients screened in these trials, which can already be selective regarding inclusion (e.g., previous treatments, tumour type, age). An analysis showed that among four clinical trials conducted at the National Cancer Institute's (NCI), 26% of samples collected did not meet the quality control (QC) criteria required in the trials (i.e., insufficient material, low tumour cellularity, poor DNA quality and/or quantity). For trials requiring sequential biopsies (i.e., paired predose and postdose), this rate increases up to 50% [4]. This number is in correlation with failure rates observed in other precision medicine clinical trials, such as the SHIVA01 trial (27% failure rate), MOSCATO (21%), and WINTHER (38%) [1, 2, 3]. In addition, the invasive character of the procedure for the patients highlights the necessity to provide other alternative sample types to perform molecular profiling.
Most of the samplings are ultrasound (US) or computed tomography (CT)‐guided and performed by interventional radiologists, but there are no conventional guidelines regarding the procedure. Core needle biopsy (CNB) represents the gold standard for tumour samplings and is performed using semi‐automatic or automatic cutting needles of 18 or 16 Gauge (G) calibres to obtain tumour fragment. When the lesion is inaccessible to biopsy, a fine‐needle aspiration (FNA) may be feasible percutaneously or endoscopically [5, 6]. FNA is a minimally invasive sampling technique that can be performed on an outpatient basis and generally requires needles of 25–20 Gauge. Most cytological preparations are frozen which provides better quality results for molecular analysis [7, 8]. FNA is the reference sampling technique for some cancers (e.g., thyroid nodule, uveal melanoma) [9, 10]. Similarly, in paediatric tumours where tumours can be difficult to access, FNA is more and more used as it allows a quick, minimally invasive and accurate diagnosis [11]. In a large series of 774 patients, FNA guided by endo‐bronchial echo‐endoscopy allowed to determine the non‐small‐cell histological subtype of lung cancer in 77% of cases and to carry out a screening of EGFR mutations in 90% of the cases [12].
Despite its advantages, FNA remains underused in most radiological teams for molecular screening, based on the common principle that a larger size of sample is correlated to a better molecular analysis [13], and due to the lack of common validated preparation protocol [14, 15]. Of note, CNB remains the gold standard for diagnosis since the morphology of the tumour is essential to establish the histological diagnosis. Hence, it is necessary to determine the reliability of tumoral genomic analyses on FNA to screen prognostic and predictive biomarkers.
Several studies have begun to address this question in specific tumour types. Gleeson et al. [16] successfully detected characteristic pathogenic variants and prognosis biomarkers by NGS on 102 FNA samples from rectal cancer. In papillary thyroid carcinoma, Yu et al. [17] even demonstrated a higher sensitivity of NGS analysis in FNA compared to conventional methods for mutation detection. Finally, in lung cancer, several studies also confirm the feasibility of variants detection from FNA samples [18, 19, 20, 21]. Yet, molecular analyses obtained from FNA in tumours of various histology are rare and only few studies assessed the comparison with concomitant CNB samples [14, 22, 23, 24]. All studies suggest FNA is a valuable source of material for molecular testing, and Roy‐Chowdhuri et al. [14] showed that FNA presented advantages regarding cellularity, tumour fraction and a higher coverage as compared to CNB.
To our knowledge, comparison of genomic analyses, comprising both mutations and copy number alterations, between concomitant CNB and FNA on various tumour types has not been studied so far. The aim of this study was to assess if FNA samples could be a reliable material for genomic analyses, in order to investigate prognostic/theranostic biomarkers in real time, in different solid tumour types. For this, we performed concomitant CNB and FNA in patients enrolled in the SHIVA02 trial followed by targeted NGS on tumour DNA.
2. Materials and methods
2.1. Patient enrolment
SHIVA02 (Evaluation of the Efficacy of Targeted Therapy Based on Tumour Molecular Profiling in Patients With Advanced Cancer Using Each Patient as Its Own Control; ClinicalTrials.gov identifier: NCT03084757) is a multicentric open‐label nonrandomized controlled phase II trial sponsored by the Curie Institute. All patients were included after written informed consent. Patients older than 18 years with any type of recurrent and/or metastatic cancer who failed standard therapy were eligible for the study provided their disease was measurable and accessible for a biopsy or resection of a metastatic site.
The study methodologies conformed to the standards set by the Declaration of Helsinki. The trial was approved by the ethics committee and the French ‘Agence Nationale de Sécurité du Médicament et des produits de santé’.
Funding sources played no role in study design, collection, analysis and interpretation of data; in the writing of the report; and in the decision to submit the article for publication.
2.2. Tumour sample collection and processing
This research was conducted within the frame of the SHIVA02 protocol, as an ancillary study in order to answer to secondary objectives aiming to assess the reliability of FNA for molecular analyses. All other decisions (diagnosis, results of molecular analyses and Molecular Biology Board decisions) were based on CNB analyses only.
Sampling was performed by interventional radiologist using ultrasound or computed tomography guidance with a coaxial technique. The guide needle (19 or 17 G) was placed in the periphery of the target lesion. FNA sampling with a 22 G needle (2 punctures) was performed at first. The aspiration product was collected in a vial containing RPMI‐EDTA medium. CNB samples (4 samples) were secondly obtained with a semi‐automatic cutting needle (18 or 16 G) (Fig. S1). Both CNB and FNA samples were taken from the same area, in the centre or the tumour. Biopsy specimens were placed in a vial containing RPMI medium. All specimens were transferred to the pathology department within 1 h.
Samples from CNB were frozen in liquid nitrogen, and quality QC (tissue quality and tumour cellularity) was determined from cryosections after H&S staining. For FNA, samples were split into two parts, one being used for QC and the other for DNA extraction. For QC, 100–300 µL (depending on the viscosity of the liquid) from the suspension were centrifugated 5 min at 700 r.p.m. onto slides using CytoSpin™ (Thermo Scientific, Waltham, MA, USA). Then, Diff Quick™ (Microptic, Barcelona, Spain) staining was used for immediate assessment of cellularity by a pathologist. The remaining FNA sample was centrifugated 10 min at 1500 g, and the pellet was collected for DNA extraction.
For CNB, the estimation of the neoplastic cell percentage was evaluated through eye‐balling of the slides, as the percentage of neoplastic cells versus all cells in the stroma, and was made as accurately as possible in decile. For FNA, the number of neoplastic cells was estimated over the surface of the cytospot obtained after CytoSpin™ centrifugation. The cell fraction was evaluated by a cytopathologist of the department, randomly chosen, to evaluate either CNB or FNA, in the frame of the clinical routine diagnosis. The global workflow of samples is presented in Fig. 1.
Fig. 1.
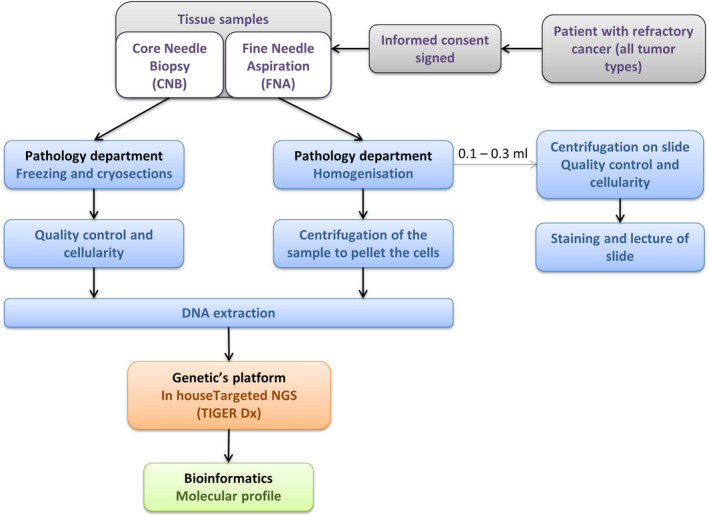
Sample analysis workflow.
2.3. DNA extraction and library preparation
DNA was extracted from concomitant CNB and FNA pair samples with a tumour cell fraction ≥ 10%.
DNA from CNB samples and FNA samples pellets were extracted by the Biological Resource Center of Institut Curie, using Phenol : Chloroform:Isoamyl Alcohol (Invitrogen, Carlsbad, CA, USA) under manufacturer's instructions.
DNA samples were quantified by spectrophotometer (NanoDrop™ ND‐2000; Thermo Scientific) and Qubit™ (Life Technologies, Carlsbad, CA, USA), and integrity was assessed by migration on agarose gel, before storage at −20 °C. Then, 100 ng of DNA was used to prepare the library of an in‐house NGS‐based gene panel (99.3 kb, 1504 amplicons) covering 87 genes using the TruSeq Custom Amplicon Low Input library prep kit (Illumina, San Diego, CA, USA) under manufacturer's recommendations.
2.4. NGS‐based gene panel sequencing and analysis pipeline
Libraries were sequenced on the NextSeq500 (Illumina). This resulted in the production of two barcodes of 75 bp paired‐end reads per sample, called respectively panels ‘A’ and ‘B’ to target both DNA strands at all loci. In this study, alterations found by both panels were considered, but only the values obtained with panel ‘A’ were reported regarding allele frequency and copy number.
For variant calling, copy number alteration detection and quality control, reads were mapped using bowtie2 (v2.2.5) [25] on the human reference genome (hg19 assembly) using the following parameters: 1 mismatch allowed in the 22 bp‐seed, 1 alignment reported per read. Alignment files were then intersected on the targeted regions using bedtools (v2.21.0) [26], and resulting singleton alignments were discarded using samtools (v0.1.19) [27].
Aligned pairs were finally assigned to a specific amplicon, and sequenced primers were trimmed using a homemade python (v2.7.9; Python Software Foundation, Wilmington, DE, USA) script and the pysam module (v0.9.1.4). Amplicon assignment was performed when both first read (5′) and second read (3′) matched the amplicon start and end, given a tolerance of ±3 bp on each extremity. At this step, reads resulting from the fusion of several adjacent amplicons were excluded and raw counts per amplicon (number of assigned pairs) were computed for the copy number alteration strategy.
2.5. Copy number alterations
Copy number alterations were called using the combination of homemade r (v3.2.0) scripts and ioncopy amplicon call CRAN package [28]. Raw counts were first normalized by the median over all the amplicons per barcode and then by the median over all barcodes per amplicon. Amplicons showing inconsistency during pilot study were discarded from further analysis.
In parallel, segmentation of the log2 ratio per coordinated‐ordered amplicons was performed using CRAN cghseg package [29]. CNV statuses were defined depending on the log2 median normalized value of the segment which corresponds to < −1 and > 2 for homozygous deletions and amplifications, respectively.
2.6. Variant calling
Variant calling of both single nucleotide variations (SNVs) and small insertion/deletions (indels) was performed on the processed alignment files using a combination of the mpileup module of samtools (taking into account anomalous read pairs without base quality recalibration, considering a minimum mapping quality of 0 and base quality of 17, and a maximum read depth of 1 M) and varscan2 (v2.4.1) [30]. Variants were reported if the number of reads supporting the alternative allele was superior or equal to 1, at a locus covered by at least 30 reads, and if the allelic ratio of this variant was superior or equal to 1%.
A dedicated strategy using Amplicon Indel Hunter (v1.1.0) [31], with default parameters, was applied to call intermediate‐size indels (> 10 bp).
Several files were computed per barcode in order to assess the run overall quality.
Sequencing and target enrichment quality were controlled using several metrics and affiliated warnings: (a) number of sequenced reads (warning if below 1 M), (b) percentage of aligned reads, and (c) percentage of aligned and processed reads (after the amplicon assignment). Moreover, each barcode was annotated with the percentage of the coding regions of the target covered by at least 100X, 300X and 1000X depth.
All data obtained after bioinformatics analyses will be referred to as ‘Total data’ in the following sections.
2.7. Validation of detected alterations
Total data were then validated using the algorithm described under this section, to identify pathogenic alterations.
Variants were classified into five classes: Pathogenic (known hotspot variants); Likely pathogenic (based on in silico analysis); Uncertain significance; Likely benign (probably not pathogenic based on in silico analysis); and Benign (other variants certainly not pathogenic).
For SNV, missense and in‐frame insertion/deletions hotspot variations were taken into consideration. Missense hotspot mutations were selected based on the literature, the prediction databases PolyPhen‐2 and SIFT, COSMIC public tumour database, cBioPortal, local variant database and based on the localization of the variation within the gene (i.e., variant in a functional domain). In‐frame insertion/deletions were kept if described in public tumour database (COSMIC, Tumor portal, cBioPortal and Cancer Hotspot) or in the literature. The allelic frequency considered for variant was ≥ 5%. Variants not considered as activating in oncogenes were polymorphisms with a frequency > 0.1% in 1000 genome (08/2015 version) and/or ESV (ESP6500), synonymous, nonsense mutations and frameshift insertion/deletions.
For tumour suppressor genes, bi‐allelic alterations were considered as inactivating and comprised homozygous inactivating alterations; composite heterozygous inactivating alterations; and inactivating mutations combined with loss of heterozygosity.
Mutations considered as inactivating were nonsense mutations, frameshift insertion/deletion, splicing mutations, intragenic large deletions or duplications, and missense mutations already described in the literature as inactivating.
Variants not considered as inactivating were polymorphisms with a frequency > 0.1% in 1000 genome and/or ESV; silents without of the first/last 2 bp of the exons (since they can alter the splicing); and unknown inactivating missense mutations.
Data obtained after validation and selection of relevant molecular alterations according to the criteria described above will be referred to as ‘Validated data’ in the following sections.
2.8. Statistics
Correlation between frequencies of pathogenic variants of FNA and CNB was computed by taking the transformed value asin(√(frequency)) and using the Pearson's correlation coefficient. For CNV alterations, the correlation between pairs of samples was assessed by taking the log ratios of overlapping segments and computing Pearson's correlation coefficient with associated P‐value. Multiple testing was controlled with the Benjamini–Hochberg procedure.
By using graphpad prism (GraphPad Software, San Diego, CA, USA) 4 software, Mann–Whitney test was used to compare the group of CNB samples versus FNA samples regarding: tumour cell content, DNA concentrations, DNA ratios (both 260/280 and 260/230), reads number, the percentage of mapped reads, the percentage of mapped reads on target, and the percentage of depth ≥ 100.
Kruskal–Wallis test followed by Dunn's test was used to compare CNB and FNA samples' DNA concentrations within the three groups of concentration ranges.
P < 0.05 was considered as statistically significant. *P < 0.05; **P < 0.01; ***P < 0.001.
3. Results
3.1. Patients' description
CNB and FNA samples from 61 patients enrolled in the SHIVA02 trial were analysed corresponding to 16 different tumour types (Fig. 2 and Table S1). Main tumour types were breast (38%, n = 23), colon (15%, n = 9) and pancreas (11%, n = 7), followed by cervix and stomach (7% each, n = 4).
Fig. 2.
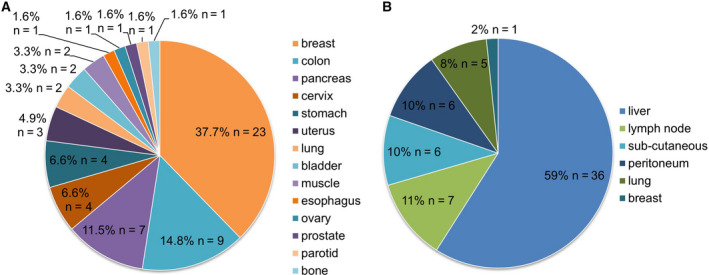
Distribution of cancer types (A) and biopsy sites (B) of the 61 patients screened.
Concomitant CNB and FNA were performed mainly on metastases, in n = 61 patients from six different localizations (i.e., liver, lymph node, subcutaneous, peritoneum, lung and breast). The large majority of cases were obtained in liver (57%, n = 36), followed by lymph nodes (12%, n = 7) and subcutaneous locations (12%, n = 6).
3.2. Both CNB and FNA samples showed no difference in DNA and NGS qualities
Regarding cellularity, the average tumour cell content was statistically lower in FNA compared to CNB (31% in FNA versus 52% in CNB), Table S1 and Fig. S2). The average concentration of DNA was similar between CNB [122.1 ng·µL−1 (0–361 ng·µL−1)] and FNA [147.8 ng·µL−1 (2.9–414 ng·µL−1)]. The large majority of CNB and FNA samples had a DNA concentration > 100 ng·µL−1 (n = 36 CNB and n = 37 FNA; Table S1 and Fig. S3), and all samples had the minimum quantity of DNA needed for NGS analysis (i.e., 100 ng). DNA quality also showed no statistical difference between the two specimens with the same average 260/280 and 260/230 ratios (1.9 and 2 respectively, Table S1).The large majority of samples also showed no degradation after migration on agarose gel (Table S1), independently if it came from CNB or FNA.
Regarding NGS analysis, the average read number was 11 426 798 [range (648 474–22 164 826)] in CNB samples versus 11 240 452 [range (1 227 758–21 584 380)] in FNA samples. The mean percentage of mapped reads was equal to 81.78% (1.46–98.63) for CNB and 83.52% for FNA (12.60–98.37). Finally, when considering a depth ≥ 100X , the coverage was of 93.11% (3.88–98.29) for CNB and 95.43% (76.53–98.22) for FNA (Table S1).
No statistical difference was found between CNB and FNA samples regarding DNA concentrations, DNA ratios (both 260/280 and 260/230), reads number, percentage of mapped reads, percentage of mapped reads on target, and percentage of depth ≥ 100X. The percentage of mapped reads and the depth of coverage were both significantly correlated and similar between CNB and FNA samples (r = 0.831 and r = 0.815 respectively).
3.3. Relevant validated molecular alterations are detected in both CNB and FNA from the same pair at high rates
Total data from NGS analysis revealed 191 variants and 260 copy number variations (CNV). Among the CNV, 17% (n = 43) were amplifications and 83% (n = 217) were deletions (Fig. 3A).
Fig. 3.
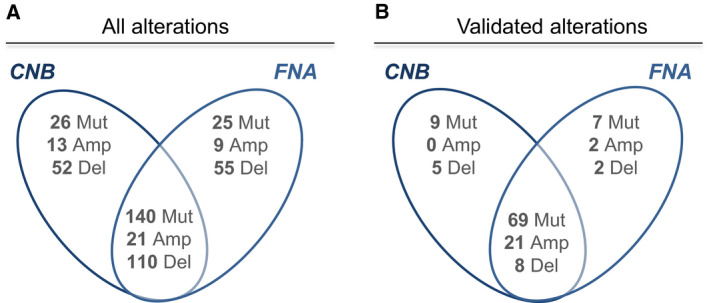
Alterations common and specific to CNB and FNA, before and after validation by the biologists. For mutations within tumour suppressor genes, only homozygous mutations are considered, except in cases where no mutation is detected in a sample from a pair, and an heterozygous mutation is detected in the other sample from the same pair. Mut, pathogenic SNV or Indel; Amp, amplification; Del, homozygous deletion.
Seventy‐three per cent of pathogenic variants (140/191), 49% (21/43) of amplifications and 51% (110/217) of deletions were detected in both CNB and FNA (Fig. 3A). Remarkably, the number of variants detected per patient was similar in both the corresponding CNB and FNA samples (Fig. S4).
A high correlation between CNB and FNA regarding pathogenic variants and CNV alterations was observed. For pathogenic variants, the correlation of allelic frequencies was 0.743; for CNV alterations, 90% of pairs of FNA and CNB showed a significant correlation of copy number profiles at false detection rate (FDR) 5% (Fig. 4A,B).
Fig. 4.
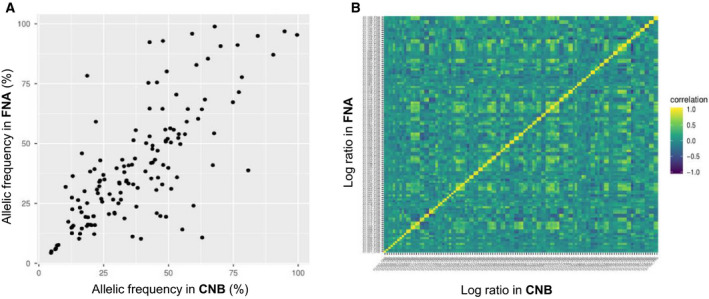
Correlations of variant frequency (A) and CNV log ratio (B) between CNB and FNA samples.
After validation to identify pathogenic variants from the total data (‘validated data’), 85 pathogenic variants and 38 CNV alterations (n = 23 amplifications and n = 15 homozygous deletions) were subsequently retained as clinically relevant (Fig. 3B and Table S2). Among them, the rate of alterations detected in both CNB and FNA from the same pair increases compared to total data: 81% (69/85) pathogenic variants were commonly detected in pairs, 91% (21/23) of amplifications and 53% (8/15) of homozygous deletions (‘concordant’ alterations, Fig. 3B). In total, 98 (80%) validated pathogenic alterations were concordant between CNB and FNA. TP53 was the most frequently altered gene (32 alterations), followed by PIK3CA (11 alterations), KRAS, and ESR1 (11 alterations each) and CDKN2A/CDKN2B (8 alterations) (Table S2). Interestingly, 71% of patients (43/61) showed no discordant molecular result between CNB and FNA samples after NGS analysis (Table S2).
3.4. Analysis of both CNB and FNA samples successfully identified actionable targets
Actionable molecular alterations represented 57% (70/123) of all validated alterations. Among them, 76% (53/70) were concordant between CNB and FNA versus 13% (16/123) of discordant actionable molecular targets (Table 1 and Table S1). Discordances concerned 14 patients and were mainly related to CNV, particularly to heterozygous and homozygous deletions. Of note, the underevaluation of the alterations was not exclusively specific to FNA (7 alterations in FNA versus 9 for CNB, Table 1).
Table 1.
Detailed description of validated and actionable alterations discordant between CNB or FNA.
| Gene | CNB result | FNA result | Patient ID | Tumour location | Biopsy site |
|---|---|---|---|---|---|
| CDKN2A | Homozygous deletion | Homozygous deletion | 19 | Anal canal | Liver |
| CDKN2A/B | Homozygous deletion | Normal | 10 | Stomach | Liver |
| CDKN2A/B | Homozygous deletion | Homozygous deletion | 16 | Breast | Lung |
| EGFR | NA | Amplification | 43 | Cervix | Peritoneum |
| FGFR1 | Gain | Amplification | 3 | Breast | Lymph node |
| KRAS | Heterozygous mutation | WT | 9 | Pancreas | Liver |
| MAP2K4 | Homozygous deletion | Heterozygous deletion | 49 | Breast | Liver |
| MAP2K4 | Homozygous mutation | Heterozygous mutation | 55 | Breast | Liver |
| NF1 | Heterozygous mutation | Homozygous mutation | 19 | Anal canal | Liver |
| PIK3CA | Absent | Heterozygous mutation | 5 | Pancreas | Liver |
| PIK3CA | Heterozygous mutation | Absent | 50 | Colon | Liver |
| PIK3R1 | Homozygous deletion | Heterozygous deletion | 2 | Ovary | Liver |
| PIK3R1 | Homozygous mutation | Heterozygous mutation | 46 | Breast | Liver |
| PTEN | Heterozygous mutation | Homozygous mutation | 6 | Breast | Subcutaneous |
| PTEN | Normal | Homozygous deletion | 27 | Muscle | Peritoneum |
| PTEN | Homozygous deletion | Normal | 46 | Breast | Liver |
4. Discussion
Biopsies are the gold standard material to establish a diagnosis and to perform molecular profiling in precision oncology [1, 2, 3, 32, 33]. Yet it is estimated that around 30% of advanced cancer patients remain unbiopsiable or samples fail to pass quality controls (i.e., insufficient material, low tumour cellularity, poor DNA quality and/or quantity) [1, 2, 34, 35, 36]. This restricts the access to precision medicine trials, highlighting the need to optimize other sample types for molecular profiling. Among the other sample types, liquid biopsies or cytology samples such a FNA are being more and more used in the clinical practice. However, although the least invasive procedure, liquid biopsies still have limits to their use in clinics as compared to FNA, as the circulating tumour DNA (ctDNA) extracted is polluted with constitutional DNA, tumour content cannot be estimated, histology stainings cannot be performed, and tumour heterogeneity cannot be studied.
In the current study, we prospectively analysed the relevant molecular alterations detected in concomitant CNB and FNA sample pairs obtained from a series of patients enrolled in the SHIVA02 trial, using an in‐house NGS‐based gene panel.
First, by comparing QCs related to CNB and FNA sample types, we observed that both DNA (concentration, ratios, quality) and NGS QCs (read number, mapped reads and depth of coverage) showed no difference between CNB and FNA, underlying their equivalent suitability for molecular assays. We noticed a difference regarding tumour cell content between CNB and FNA samples, which could be explained by the difference in references used for the evaluation of tumour cell percentage (i.e., over total cells including stroma for CNB versus cytospot surface for FNA). However, it is important to note that for our molecular analysis, cellularity did not affect the quality and quantity of DNA needed, or the quality of targeted NGS required in our study.
Molecular alterations were successfully detected by targeted NGS followed by data analysis, in both CNB and FNA sample types among patients. The data analysis consisted in a first step of bioinformatics analysis (so‐called ‘Total data’) and in a second step of validation of the Total data according to an algorithm (so‐called ‘Validated data’).
The bioinformatics analysis (Total data) showed a significant correlation between CNB and FNA regarding both the detection of pathogenic variants and CNV alterations. Seventy‐three per cent of pathogenic variants, 49% of amplifications and 51% of deletions were commonly detected in corresponding CNB and FNA pairs. Remarkably, after validation and selection of driver molecular alterations (validated data), the rate of common alterations detected between CNB and FNA from the same pair considerably increased up to 81% of pathogenic variants, 91% of amplifications and 53% of deletions. For pathogenic variants, this rate is in accordance with previous studies [14, 19, 24]. To our knowledge, no previous data exist on CNV. Our results highlight the leading role of a NGS data validation step, in order to take into account driver molecular alterations, and discard noise and irrelevant alterations (i.e., variants of uncertain significance). It is important to note that the remaining discordances between CNB and FNA did not depend on sample type (CNB or FNA) and mainly concerned deletions usually conditioned by tumour cellularity. We also showed that the discordances and success of molecular profiling did not depend on tumour type or biopsy localization.
Altogether, these observations underlie the equal reliability of both sample types for the identification of clinically relevant molecular alterations in tumour cells.
In this study, only metastasis samples were analysed. In fact, for theranostic purposes and in order to include patients with metastatic tumours in early trials to give matched targeted therapy, molecular analyses on metastasis seem more relevant. However, it could be interesting to perform the same study on primary tumours as they might have a higher variability of clones than in the metastasis, the latest originating from one major clone under treatment selection. Indeed, two samples (CNB and FNA) taken from the primitive tumour could harbour a higher heterogeneity and show more molecular discordances compared to the metastasis [37, 38].
Four patients out of 61 did not harbour any relevant validated molecular alteration (patients 1, 23, 41 and 45). For these cases, sampling procedures were successful, except for patient 45 for which the biopsied lesion appeared to be a nontumoral lymph node rather than a metastasis (which was lately confirmed by PET scan). Histologies were validated by the pathologists, and no anomaly was reported during NGS process. The absence of validated molecular alterations in these samples could therefore either be explained by the absence of alterations at the DNA level in these tumours, or by a lack of coverage of the altered genes in the targeted panel used.
Two patients had targetable alterations detected only in FNA: patient 19 and patient 27. Patient 19 had a homozygous deletion of CDKN2A only detected in the FNA, while a heterozygous deletion of CDKN2A was found in the CNB. This result still led to orientation to a treatment by CDK4‐6 inhibitor (Palbociclib) in the frame of SHIVA‐02, but unfortunately, the patient died one month later. Patient 27 harboured an homozygous deletion of PTEN in FNA sample only but not in the CNB. This result did not affect the decision taken within the SHIVA02 molecular board (which is only based on alterations found in CNB), as PTEN inactivation is not part of the treatment algorithm. Yet, this new result led to a discussion in the local Molecular Tumour Board (MTB) for eventual treatment by mTOR inhibitor [39].
These discordances between molecular results from CNB and FNA could be explained by intratumoral heterogeneity [37, 38, 40], as CNB and FNA were taken from spatially separated points within the tumour (see Tumour sample collection and processing).
Among validated alterations across all the samples, TP53, PIK3CA, KRAS, ESR1 and CDKN2A/B were the most frequently altered genes, which is in accordance with the tumour types screened, as the majority were metastatic breast, colon and pancreas cancers [41, 42]. Regarding targetable alterations found among validated data, the same repartition of alterations across the different cellular pathways was observed between CNB and FNA samples. The most affected signalling pathways were the MAPK and the PTEN/PI3K/AKT/mTOR pathways, which are related to the most frequently altered genes found among the samples, and are in accordance with the genomic characteristics of the tumour types analysed (i.e., mainly breast, pancreas and colon cancers) [43, 44]. These observations reflect once again the relevance of the data validation step and confirm the reliability of FNA samples for detection of relevant and actionable molecular alterations in patients suffering from advanced cancer.
5. Conclusions
Our results show that: (a) both CNB and FNA samples are suitable for molecular analysis, with the same DNA and NGS qualities; (b) relevant validated molecular alterations are equally detected in both CNB and FNA samples from the same patient, with a higher consistency after than before validation of data; and (c) actionable targets were identified in both CNB and FNA. We demonstrated the feasibility of real‐time molecular screening of biomarkers from FNA samples and incorporation into clinical workflows to orientate diagnosis or therapeutic decisions. Finally, our study also emphasizes the critical role of data analysis and validation of relevant molecular alterations in order to have reliable, comparable data between different sample types.
With the increasing need to identify tumour‐specific molecular alterations to improve diagnosis and treatment algorithms for personalized therapy, FNA samples can be of critical utility, especially for patients with nonbiopsiable lesions or advanced diseases where small specimen is the only material available, or, when performed in parallel to CNB, molecular profiling on FNA could allow to save tissue material for other purposes. This could open the doors of NGS analyses and new therapeutic options to more patients.
Author contributions
IB, VS, JM‐P, MK and CLT conceived and designed the study. JM‐P, EG, PG, VS and MK developed the methodology. JM‐P, MK, SA, CF, OM, EG, PG, PR, EB, DB, FR, SH, M‐PS, PT, AM, DL, MF, AV‐S and CG involved in data acquisition. JM‐P, EG, PG and CD analysed and interpreted the data. CD, JM‐P, MK, CG, IB and CLT wrote, reviewed and revised the manuscript. IB, CLT, AV‐S, JM‐P, CD, MK, CG, EG, PG, CC, SA, CF, OM and CL gave administrative, technical or material support (i.e., reporting or organizing data, constructing databases). IB, VS, CLT and MK supervised the study.
Conflict of interest
CLT has participated in advisory boards from MSD, BMS, Merck Serono, GSK, Amgen, Novartis, Roche, Rakuten, Seattle Genetics, Nanobiotix and Astra Zeneca.
Supporting information
Fig. S1. Representation of sample acquisition in cancer patients. Concomitant FNA and CNB are performed during the same procedure. A 22 Gauge needle is inserted into the guide needle to perform the first sampling (1) which is the FNA. Then, an 18 or 16 Gauge cutting needle is inserted into the guide needle to perform the CNB. The second sampling corresponding to CNB is performed close from the first FNA sampling, either by going deeper into the tissue with the needle (2) or changing the needle's angle (2′).
Fig. S2. Percentages of tumour cells in CNB and FNA samples determined by pathologists. Data are presented as mean ± SEM. Mann–Whitney test was used to compare the group of CNB samples versus FNA samples.
Fig. S3. Repartition of DNA concentration ranges in CNB and FNA samples analysed. Data are presented as mean ± SD. Kruskal–Wallis test followed by Dunn's test was used to compare CNB and FNA samples DNA concentrations within the 3 groups (<50 ng/µl; 50‐100 ng/µl and >100 ng/µl) and no significance was found.
Fig. S4. Number of pathogenic variants detected in CNB and FNA per patient.
Table S1. Cancer type, tumour cell percentage, and DNA and NGS libraries quality control metrics of CNB and FNA samples.
Table S2. Description of validated molecular alterations in CNB and FNA samples of 61 patients from the SHIVA02 trial.
Acknowledgements
The SHIVA02 trial including ancillary studies is funded by the MSD Avenir Foundation. Funding sources played no role in study design, collection, analysis and interpretation of data; in the writing of the report; and in the decision to submit the article for publication.
Data accessibility
The data sets used and/or analysed during the current study are available from the corresponding author on reasonable request.
References
- 1. Le Tourneau C, Delord J‐P, Gonçalves A, Gavoille C, Dubot C, Isambert N, Campone M, Trédan O, Massiani M‐A, Mauborgne C et al (2015) Molecularly targeted therapy based on tumour molecular profiling versus conventional therapy for advanced cancer (SHIVA): a multicentre, open‐label, proof‐of‐concept, randomised, controlled phase 2 trial. Lancet Oncol 16, 1324–1334. [DOI] [PubMed] [Google Scholar]
- 2. Massard C, Michiels S, Ferté C, Le Deley M‐C, Lacroix L, Hollebecque A, Verlingue L, Ileana E, Rosellini S, Ammari S et al (2017) High‐throughput genomics and clinical outcome in hard‐to‐treat advanced cancers: results of the MOSCATO 01 trial. Cancer Discov 7, 586–595. [DOI] [PubMed] [Google Scholar]
- 3. Rodon J, Soria J‐C, Berger R, Miller WH, Rubin E, Kugel A, Tsimberidou A, Saintigny P, Ackerstein A, Braña I et al (2019) Genomic and transcriptomic profiling expands precision cancer medicine: the WINTHER trial. Nat Med 25, 751–758. [DOI] [PMC free article] [PubMed] [Google Scholar]
- 4. Ferry‐Galow KV & Chen AP (2019) The use of research biopsies in oncology trials: challenges and controversies. J Hosp Manag Health Policy 3, 7. [DOI] [PMC free article] [PubMed] [Google Scholar]
- 5. Cate F, Kapp ME, Arnold SA, Gellert LL, Hameed O, Clark PE, Wile G, Coogan A & Giannico GA (2017) Core needle biopsy and fine needle aspiration alone or in combination: diagnostic accuracy and impact on management of renal masses. J Urol 197, 1396–1402. [DOI] [PMC free article] [PubMed] [Google Scholar]
- 6. Syed A, Babich O, Rao B, Singh S, Carleton N, Gulati A, Kulkarni A, Garg M, Farah K, Kochhar G et al (2019) Endoscopic ultrasound guided fine‐needle aspiration vs core needle biopsy for solid pancreatic lesions: Comparison of diagnostic accuracy and procedural efficiency. Diagn Cytopathol 47, 1138–1144. [DOI] [PubMed] [Google Scholar]
- 7. Greytak SR, Engel KB, Bass BP & Moore HM (2015) Accuracy of molecular data generated with FFPE biospecimens: lessons from the literature. Cancer Res 75, 1541–1547. [DOI] [PMC free article] [PubMed] [Google Scholar]
- 8. Hedegaard J, Thorsen K, Lund MK, Hein A‐MK, Hamilton‐Dutoit SJ, Vang S, Nordentoft I, Birkenkamp‐Demtröder K, Kruhøffer M, Hager H et al (2014) Next‐generation sequencing of RNA and DNA isolated from paired fresh‐frozen and formalin‐fixed paraffin‐embedded samples of human cancer and normal tissue. PLoS One 9, e98187. [DOI] [PMC free article] [PubMed] [Google Scholar]
- 9. Sulejmanovic M, Cickusic AJ & Salkic S (2019) The value of fine‐needle aspiration biopsy (FNAB) in differential diagnosis of scintigraphic cold thyroid nodule. Acta Inform Med 27, 114–118. [DOI] [PMC free article] [PubMed] [Google Scholar]
- 10. Sellam A, Desjardins L, Barnhill R, Plancher C, Asselain B, Savignoni A, Pierron G & Cassoux N (2016) Fine needle aspiration biopsy in uveal melanoma: technique, complications, and outcomes. Am J Ophthalmol 162, 28–34.e1. [DOI] [PubMed] [Google Scholar]
- 11. Razack R, Michelow P, Leiman G, Harnekar A, Poole J, Wessels G, Hesseling P, Stefan C, Louw M, Schubert PT et al (2012) An interinstitutional review of the value of FNAB in pediatric oncology in resource‐limited countries. Diagn Cytopathol 40, 770–776. [DOI] [PubMed] [Google Scholar]
- 12. Navani N, Brown JM, Nankivell M, Woolhouse I, Harrison RN, Jeebun V, Munavvar M, Ng BJ, Rassl DM, Falzon M et al (2012) Suitability of endobronchial ultrasound‐guided transbronchial needle aspiration specimens for subtyping and genotyping of non‐small cell lung cancer: a multicenter study of 774 patients. Am J Respir Crit Care Med 185, 1316–1322. [DOI] [PMC free article] [PubMed] [Google Scholar]
- 13. Morris SM, Subramanian J, Gel ES, Runger G, Thompson E, Mallery D & Weiss G (2018) Performance of next‐generation sequencing on small tumor specimens and/or low tumor content samples using a commercially available platform. PLoS One 13, e0196556. [DOI] [PMC free article] [PubMed] [Google Scholar]
- 14. Roy‐Chowdhuri S, Chen H, Singh RR, Krishnamurthy S, Patel KP, Routbort MJ, Manekia J, Barkoh BA, Yao H, Sabir S et al (2017) Concurrent fine needle aspirations and core needle biopsies: a comparative study of substrates for next‐generation sequencing in solid organ malignancies. Mod Pathol 30, 499–508. [DOI] [PubMed] [Google Scholar]
- 15. Clark DP (2009) Seize the opportunity. Cancer Cytopathol 117, 289–297. [DOI] [PubMed] [Google Scholar]
- 16. Gleeson FC, Kipp BR, Voss JS, Campion MB, Minot DM, Tu ZJ, Klee EW, Sciallis AP, Graham RP, Lazaridis KN et al (2015) Endoscopic ultrasound fine‐needle aspiration cytology mutation profiling using targeted next‐generation sequencing: personalized care for rectal cancer. Am J Clin Pathol 143, 879–888. [DOI] [PubMed] [Google Scholar]
- 17. Yu F‐X, Hu M‐X, Zhao H‐X, Niu L‐J, Rong X‐Y, Li W‐H, Zhu Q, Ying J‐M & Lyu N (2019) Precise detection of gene mutations in fine‐needle aspiration specimens of the papillary thyroid microcarcinoma using next‐generation sequencing. Int J Endocrinol 2019, 4723958. [DOI] [PMC free article] [PubMed] [Google Scholar]
- 18. Karnes HE, Duncavage EJ & Bernadt CT (2014) Targeted next‐generation sequencing using fine‐needle aspirates from adenocarcinomas of the lung. Cancer Cytopathol 122, 104–113. [DOI] [PubMed] [Google Scholar]
- 19. Sun P‐L, Jin Y, Kim H, Lee C‐T, Jheon S & Chung J‐H (2013) High concordance of EGFR mutation status between histologic and corresponding cytologic specimens of lung adenocarcinomas. Cancer Cytopathol 121, 311–319. [DOI] [PubMed] [Google Scholar]
- 20. Khode R, Larsen DA, Culbreath BC, Parrish S, Walker KL, Sayage‐Rabie L, Beissner RS & Rao A (2013) Comparative study of epidermal growth factor receptor mutation analysis on cytology smears and surgical pathology specimens from primary and metastatic lung carcinomas. Cancer Cytopathol 121, 361–369. [DOI] [PubMed] [Google Scholar]
- 21. Rekhtman N, Brandt SM, Sigel CS, Friedlander MA, Riely GJ, Travis WD, Zakowski MF & Moreira AL (2011) Suitability of thoracic cytology for new therapeutic paradigms in non‐small cell lung carcinoma: high accuracy of tumor subtyping and feasibility of EGFR and KRAS molecular testing. J Thorac Oncol 6, 451–458. [DOI] [PubMed] [Google Scholar]
- 22. Centeno BA, Enkemann SA, Coppola D, Huntsman S, Bloom G & Yeatman TJ (2005) Classification of human tumors using gene expression profiles obtained after microarray analysis of fine‐needle aspiration biopsy samples. Cancer 105, 101–109. [DOI] [PubMed] [Google Scholar]
- 23. Hwang DH, Garcia EP, Ducar MD, Cibas ES & Sholl LM (2017) Next‐generation sequencing of cytologic preparations: an analysis of quality metrics. Cancer Cytopathol 125, 786–794. [DOI] [PubMed] [Google Scholar]
- 24. Leichsenring J, Volckmar A‐L, Kirchner M, Kazdal D, Kriegsmann M, Stögbauer F, Bockmayr T, Klauschen F, Herth FJF, Penzel R et al (2018) Targeted deep sequencing of effusion cytology samples is feasible, informs spatiotemporal tumor evolution, and has clinical and diagnostic utility. Genes Chromosomes Cancer 57, 70–79. [DOI] [PubMed] [Google Scholar]
- 25. Langmead B & Salzberg SL (2012) Fast gapped‐read alignment with Bowtie 2. Nat Methods 9, 357–359. [DOI] [PMC free article] [PubMed] [Google Scholar]
- 26. Quinlan AR and Hall IM (2010) BEDTools: a flexible suite of utilities for comparing genomic features. Bioinformatics 26, 841–842. 10.1093/bioinformatics/btq033 [DOI] [PMC free article] [PubMed] [Google Scholar]
- 27. Li H, Handsaker B, Wysoker A, Fennell T, Ruan J, Homer N, Marth G, Abecasis G & Durbin R (2009) The Sequence Alignment/Map format and SAMtools. Bioinformatics 25, 2078–2079. [DOI] [PMC free article] [PubMed] [Google Scholar]
- 28. Budczies J, Pfarr N, Stenzinger A, Treue D, Endris V, Ismaeel F, Bangemann N, Blohmer J‐U, Dietel M, Loibl S et al (2016) Ioncopy: a novel method for calling copy number alterations in amplicon sequencing data including significance assessment. Oncotarget 7, 13236–13247. [DOI] [PMC free article] [PubMed] [Google Scholar]
- 29. Picard F, Lebarbier E, Hoebeke M, Rigaill G, Thiam B & Robin S (2011) Joint segmentation, calling, and normalization of multiple CGH profiles. Biostatistics 12, 413–428. [DOI] [PubMed] [Google Scholar]
- 30. Koboldt DC, Chen K, Wylie T, Larson DE, McLellan MD, Mardis ER, Weinstock GM, Wilson RK & Ding L (2009) VarScan: variant detection in massively parallel sequencing of individual and pooled samples. Bioinformatics 25, 2283–2285. [DOI] [PMC free article] [PubMed] [Google Scholar]
- 31. Kadri S, Zhen CJ, Wurst MN, Long BC, Jiang Z‐F, Wang YL, Furtado LV & Segal JP (2015) Amplicon indel hunter is a novel bioinformatics tool to detect large somatic insertion/deletion mutations in amplicon‐based next‐generation sequencing data. J Mol Diagn 17, 635–643. [DOI] [PubMed] [Google Scholar]
- 32. Siu LL, Conley BA, Boerner S & LoRusso PM (2015) Next‐generation sequencing to guide clinical trials. Clin Cancer Res 21, 4536–4544. [DOI] [PMC free article] [PubMed] [Google Scholar]
- 33. Burris HA, Saltz LB & Yu PP (2018) Assessing the value of next‐generation sequencing tests in a dynamic environment. Am Soc Clin Oncol Educ Book 38, 139–146. [DOI] [PubMed] [Google Scholar]
- 34. Hagemann IS, Devarakonda S, Lockwood CM, Spencer DH, Guebert K, Bredemeyer AJ, Al‐Kateb H, Nguyen TDT, Duncavage EJ, Cottrell CE et al (2015) Clinical next‐generation sequencing in patients with non‐small cell lung cancer. Cancer 121, 631–639. [DOI] [PubMed] [Google Scholar]
- 35. Parsons HA, Beaver JA, Cimino‐Mathews A, Ali SM, Axilbund J, Chu D, Connolly RM, Cochran RL, Croessmann S, Clark TA et al (2017) Individualized molecular analyses guide efforts (IMAGE): a prospective study of molecular profiling of tissue and blood in metastatic triple‐negative breast cancer. Clin Cancer Res 23, 379–386. [DOI] [PMC free article] [PubMed] [Google Scholar]
- 36. Wyatt AW, Annala M, Aggarwal R, Beja K, Feng F, Youngren J, Foye A, Lloyd P, Nykter M, Beer TM et al (2017) Concordance of circulating tumor DNA and matched metastatic tissue biopsy in prostate cancer. J Natl Cancer Inst 109 10.1093/jnci/djx118. [DOI] [PMC free article] [PubMed] [Google Scholar]
- 37. Burrell RA, McGranahan N, Bartek J & Swanton C (2013) The causes and consequences of genetic heterogeneity in cancer evolution. Nature 501, 338–345. [DOI] [PubMed] [Google Scholar]
- 38. Sabaawy HE (2013) Genetic heterogeneity and clonal evolution of tumor cells and their impact on precision cancer medicine. J Leuk (Los Angel) 1, 1000124. [DOI] [PMC free article] [PubMed] [Google Scholar]
- 39. Basse C, Morel C, Alt M, Sablin MP, Franck C, Pierron G, Callens C, Melaabi S, Masliah‐Planchon J, Bataillon G et al (2018) Relevance of a molecular tumour board (MTB) for patients' enrolment in clinical trials: experience of the Institut Curie. ESMO Open 3, e000339. [DOI] [PMC free article] [PubMed] [Google Scholar]
- 40. Lawrence MS, Stojanov P, Polak P, Kryukov GV, Cibulskis K, Sivachenko A, Carter SL, Stewart C, Mermel CH, Roberts SA et al (2013) Mutational heterogeneity in cancer and the search for new cancer‐associated genes. Nature 499, 214–218. [DOI] [PMC free article] [PubMed] [Google Scholar]
- 41. Bertucci F, Ng CKY, Patsouris A, Droin N, Piscuoglio S, Carbuccia N, Soria JC, Dien AT, Adnani Y, Kamal M et al (2019) Genomic characterization of metastatic breast cancers. Nature 569, 560–564. [DOI] [PubMed] [Google Scholar]
- 42. Raphael BJ, Hruban RH, Aguirre AJ, Moffitt RA, Yeh JJ, Stewart C, Robertson AG, Cherniack AD, Gupta M, Getz G et al (2017) Integrated genomic characterization of pancreatic ductal adenocarcinoma. Cancer Cell 32, 185–203.e13. [DOI] [PMC free article] [PubMed] [Google Scholar]
- 43. Lefebvre C, Bachelot T, Filleron T, Pedrero M, Campone M, Soria J‐C, Massard C, Lévy C, Arnedos M, Lacroix‐Triki M et al (2016) Mutational profile of metastatic breast cancers: a retrospective analysis. PLoS Med 13, e1002201. [DOI] [PMC free article] [PubMed] [Google Scholar]
- 44. Singhi AD, George B, Greenbowe JR, Chung J, Suh J, Maitra A, Klempner SJ, Hendifar A, Milind JM, Golan T et al (2019) Real‐time targeted genome profile analysis of pancreatic ductal adenocarcinomas identifies genetic alterations that might be targeted with existing drugs or used as biomarkers. Gastroenterology 156, 2242–2253.e4. [DOI] [PubMed] [Google Scholar]
Associated Data
This section collects any data citations, data availability statements, or supplementary materials included in this article.
Supplementary Materials
Fig. S1. Representation of sample acquisition in cancer patients. Concomitant FNA and CNB are performed during the same procedure. A 22 Gauge needle is inserted into the guide needle to perform the first sampling (1) which is the FNA. Then, an 18 or 16 Gauge cutting needle is inserted into the guide needle to perform the CNB. The second sampling corresponding to CNB is performed close from the first FNA sampling, either by going deeper into the tissue with the needle (2) or changing the needle's angle (2′).
Fig. S2. Percentages of tumour cells in CNB and FNA samples determined by pathologists. Data are presented as mean ± SEM. Mann–Whitney test was used to compare the group of CNB samples versus FNA samples.
Fig. S3. Repartition of DNA concentration ranges in CNB and FNA samples analysed. Data are presented as mean ± SD. Kruskal–Wallis test followed by Dunn's test was used to compare CNB and FNA samples DNA concentrations within the 3 groups (<50 ng/µl; 50‐100 ng/µl and >100 ng/µl) and no significance was found.
Fig. S4. Number of pathogenic variants detected in CNB and FNA per patient.
Table S1. Cancer type, tumour cell percentage, and DNA and NGS libraries quality control metrics of CNB and FNA samples.
Table S2. Description of validated molecular alterations in CNB and FNA samples of 61 patients from the SHIVA02 trial.
Data Availability Statement
The data sets used and/or analysed during the current study are available from the corresponding author on reasonable request.