

Abstract
Pompe disease (PD) is an autosomal recessive lysosomal storage disorder due to deficient activity of the acid alpha glucosidase enzyme (GAA). As a consequence of the enzymatic defect, undigested glycogen accumulates within lysosomes. Most patients affected by the late-onset (LO) phenotype carry in at least one allele the c.-32-13T>G variant, which leads to exon 2 exclusion from the pre-mRNA. These patients display a variable and suboptimal response to enzyme replacement therapy. To identify novel therapeutic approaches, we developed a fluorescent GAA exon 2 splicing assay and screened a library of US Food and Drug Administration (FDA)-approved compounds. This led to the identification of several drugs able to restore normal splicing. Among these, we further validated the effects of the iron chelator deferoxamine (Defe) in c.-32-13T>G fibroblasts. Defe treatment resulted in a 2-fold increase of GAA exon 2 inclusion and a 40% increase in enzymatic activity. Preliminary results suggest that this effect is mediated by the regulation of iron availability, at least partially. RNA-seq experiments also showed that Defe might shift the balance of splicing factor levels toward a profile promoting GAA exon 2 inclusion. This work provides the basis for drug repurposing and development of new chemically modified molecules aimed at improving the clinical outcome in LO-PD patients.
Keywords: Pompe disease, glycogenosis type 2, GAA, pre-mRNA splicing reporter, deferoxamine
Graphical Abstract
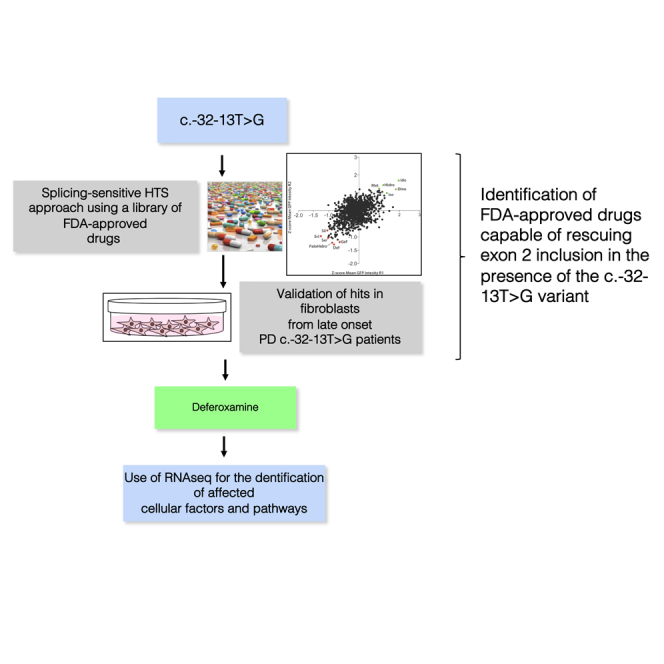
By high-throughput screening of FDA-approved compounds Buratti et al. identified deferoxamine (Defe) as able to restore normal splicing of pre-mRNA bearing the c.-32-13T>G variant in the GAA gene and enzymatic activity. Using RNA-seq, authors explored its mechanism of action, providing the basis for drug repurposing.
Introduction
Pompe disease (PD; MIM: 232300) is an autosomal recessive lysosomal storage disorder due to the deficient activity of the lysosomal acid alpha glucosidase enzyme (GAA), which results in impaired glycogen degradation and accumulation within the lysosomes.1
Clinically, PD encompasses a continuous spectrum of phenotypes, ranging from a rapidly progressive infantile form to a slowly progressive childhood/adult late-onset (LO) form. Classic infantile PD manifests soon after birth and is characterized by absent or nearly absent GAA activity, severe muscle weakness, cardiomegaly/cardiomyopathy, and respiratory insufficiency that typically lead to death within the first year of life in untreated children.2,3 LO-PD comprises all milder subtypes; the disease manifests later in childhood, adolescence, or adulthood. LO patients retain some residual GAA enzyme activity (from 1% to 25%), and display a less-severe and slow progressive disease, characterized by skeletal muscle weakness, without cardiac involvement. Respiratory muscle weakness, particularly of the diaphragm, is the leading cause of death in the LO cases.4,5
The only treatment currently approved for PD is enzyme replacement therapy (ERT) with recombinant human GAA (rhGAA). Although most of the studies on ERT support its efficacy in improving survival of PD patients, long-term follow-up studies have shown that ERT does not completely prevent disease progression.6,7 In fact, the experience of hundreds of PD patients treated with ERT has shown that not all patients respond equally well to therapy and that skeletal muscle (one of the major sites of disease and an important target of therapy) is more refractory to treatment than other tissues.8 These observations suggest that novel approaches are needed, in particular for patients with LO forms and prominent skeletal muscle disease.
The GAA gene (MIM: 606800) is localized to human chromosome 17q25.2-25.3 and, to date, 593 different pathogenic variants (MIM: 606800) have been identified (http://www.hgmd.cf.ac.uk), including all types of gene changes (missense, nonsense, deletions, insertions, and splice site variants). Although most pathogenic variants are present in a small number of families, there is one exception represented by the intronic variant c.-32-13T>G, which is present in different populations in 40%–70% of the alleles in patients affected with the LO-PD form.9, 10, 11, 12, 13, 14
In vitro studies using a minigene system and patients’ cells have shown that the c.-32-13T>G variant affects the GAA mRNA splicing process, leading to the partial or complete removal of exon 2 from the mature mRNA. However, this pathogenic variant does not completely prevent normal splicing since low levels of correctly spliced mRNA are also generated in its presence. This residual activity may explain the late onset of the disease in patients carrying this change.15,16
Recently, we provided in vitro evidence clearly showing that it is possible to increase expression of the normally spliced GAA transcript of c.-32-13T>G mutated alleles by targeting a specific silencer sequence identified within exon 2 with a combination of antisense morpholino oligonucleotides (AMOs). Most importantly, we showed that a 70% increase of residual GAA activity was enough to partially correct intracellular glycogen storage in muscle cells.17 These data suggest that a relatively small increase of GAA enzyme would be sufficient to exceed the threshold activity needed to prevent pathological glycogen accumulation and achieve a beneficial effect in clinical settings. Interestingly, these considerations can be applied also to other GAA exon 2 splicing variants.18 However, further studies would be needed to test the efficacy and the delivery of the AMOs to skeletal muscle in vivo. In addition, no animal models of PD carrying this particular variant are currently available, making pre-clinical studies extremely difficult.
The use of small molecules able to modify splicing patterns constitutes a promising alternative approach to restore normal splicing of mutated transcripts.19 This strategy permits screenings for small molecules already approved by the US Food and Drug Administration (FDA) or other regulatory agencies, which can be easily translated from the bench to the bedside.
In previous work, we already provided in vitro proof-of-principle evidence for the use of small molecules to partially rescue normal splicing of c.-32-13T>G alleles.20 Here, we set up a splicing reporter system suitable for the high-throughput screening (HTS) of molecules able to modify the splicing pattern of the c.-32-13T>G variant and screened a library of 1,280 FDA-approved drugs, identifying the iron chelator deferoxamine (Defe) as a positive regulator of exon 2 GAA inclusion. The results were validated in fibroblasts of patients carrying the c.-32-13T>G and c.-32-3C>A mutation. Finally, the possible molecular mechanism(s) of Defe action was explored by RNA sequencing experiments.
Results
Setup of a splicing reporter system for c.-32-13T>G screening
We set up a splicing reporter system suitable for HTS of molecules potentially able to rescue normal splicing of c.-32-13T>G mutant alleles. To achieve this, we cloned the entire GAA exon 2 together with its flanking 50-nucleotide intronic sequences in the commercial pEGFP-N1 reporter plasmid. This sequence, both in the wild-type (WT) and c.32-13T>G mutated version, was cloned in such a way that the EGFP cDNA is interrupted by the GAA exon 2 region (Figures 1A and S1 for an outline of the cloning strategy). As a consequence, if GAA exon 2 is included in the primary transcript, no EGFP expression is allowed following transfection. Conversely, if GAA exon 2 is skipped, then EGFP is expressed normally within the transfected cells. A schematic diagram of this reporter together with the outcome in cells stably transfected with the WT and mutated constructs is shown in Figure 1A.
Figure 1.

High-throughput screening of FDA-approved compounds
(A) Upper panel: schematic representation of the EGFP-based splicing reporter system. Lower panel: western blot and immunofluorescence analysis of the EGFP protein expressed in HeLa cells stably transfected with the WT fluo and MUT fluo constructs, respectively. (B) Scatterplot chart representing the Z score of the EGFP expression level of each screening replicate. Compounds either reducing total cell number or modulating basal RFP expression (Z score ≤ 1.96 and Z score ≥ 1.96; p ≤ 0.05) were excluded from further analysis. Dots highlighted in green represent the top 10 compounds increasing EGFP expression. Dots highlighted in red represent the top 10 compounds reducing EGFP expression by promoting exon skipping.
HTS
Using this splicing reporter, we screened a library of 1,280 FDA-approved compounds that contain clinically relevant pharmacophores. The screen was run in two independent biological replicates, and Z scores were calculated for both cell viability and EGFP mean cellular intensity. In parallel, the library was tested for the ability to regulate basal expression using cells stably transfected with a construct expressing red fluorescent protein (RFP). Compounds either reducing total cell number or modulating basal gene expression (measured by RFP fluorescence) (Z score ≤ 1.96 and Z score ≥ 1.96; p ≤ 0.05) were excluded from further analysis. Scatterplot of Z scores of the cellular GFP-mean fluorescence intensity are reported in Figure 1B. Seven screening replicates showed a significant correlation (Pearson correlation coefficient = 0.4926; p ≤ 0.0001).
The main focus of this screening was to find compounds able to reduce EGFP fluorescence by increasing efficiency of exon inclusion. Using these criteria, we selected for further validation the best three compounds that decreased EGFP fluorescence in the first round of screening (deferoxamine mesylate [Defe], palonosetron hydrochloride [PaloHCl], and gefitinib [Gef]) and the best three compounds in the second round (sertraline [Ser], erlotinib [Erl], and sildenafil [Sil]). In addition, we selected the best common hit from both rounds of screening combined, which was saquinavir mesylate (Saqui). For validation, we used a minigene reporter system in which the entire exon 2 and 50 nucleotides of the flanking intronic regions carrying the mutation were inserted in the Nde I site of the pTB plasmid. In cells transfected with this construct, exon 2 is completely or partially excluded (SV2 and SV3, respectively), and a low amount of normal spliced mRNA (N) is detected (Figure 2A), resembling the effect of the mutation in patients’ cells.20
Figure 2.

Validation of selected compounds on exon 2 inclusion using a minigene system and patient fibroblasts
(A) Schematic diagram of the MUT minigene used to validate the compounds with the possible splicing outcomes. The α-globin, fibronectin EDB, and human GAA exon 2 are shown as black, white, and pink boxes, respectively. The shaded pink box represents the segment of exon 2 that becomes included following the activation of the cryptic (c2) acceptor site. Cells transfected with the MUT minigene express transcripts in which exon 2 is complete or partially excluded (SV2 and SV3 variants), while the normal (N) variant is expressed in very low levels. (B) HeLa cells transfected with the MUT minigene were treated for 72 h with 10 μM of Defe, Erl, Gef, Palo, Saq, and Sil. The relative expression of the N isoform was analyzed by quantitative real-time PCR with minigene-specific primers (a2-3, Bra2). The results are expressed as fold of N isoform detected in untreated cells. Data represent the means ± SD of three independent experiments. (C) Enzymatic GAA activity assessed in c.-32-13T>G fibroblasts after 7 days of treatment with 10 μM Defe, Palo, and Saq. Results are expressed as fold of increase over fibroblasts treated with DMSO (vehicle) and represent the means ± SD of three independent experiments. (D) Real-time PCR analysis of the region encompassing exons 1–3 of GAA mRNA in fibroblasts from a patient carrying the c.-32-13T>G mutation after 3 days of treatment with Defe 10 μM together with the relative increase in exon inclusion, and (E) western blot showing the increase in 110 kDa and 95 kDa GAA protein isoforms following treatment with Defe (using DMSO as vehicle) and the quantification from three independent experiments. Data represent the means ± SD of three independent experiments. ∗p < 0.05; ∗∗p < 0.01; ∗∗∗p < 0.001.
As shown in Figure 2B, the positive effects on GAA exon 2 inclusion (expressed as the fold of increase of N isoform) was confirmed only for Defe, PaloHC, and Saqui. It is worth noting that it was not possible to test the effect of Ser, since this compound was toxic even when cells were treated with a lower concentration (1 uM).
Validation of HTS results in patients’ fibroblasts
The effect of these three validated compounds on exon 2 inclusion and GAA activity was then tested in immortalized fibroblasts derived from patients affected by LO-PD carrying the c.-32-13T>G variant treated for 3 to 7 days with the selected drugs. Among the tested compounds, only Defe treatment displayed a significant effect on patients’ cells (Figure 2C). Indeed, a 2-fold increase of exon 2 inclusion was obtained using different batches of Defe from different vendors, resulting in an almost 40% improvement of GAA activity (Figure 2D). Finally, this result was also confirmed at the protein level by looking at the eventual increase in the expression of the two GAA isoforms of 110 and 76 kDa following Defe treatment that were also approximately increased by 2-fold (Figure 2E).
Molecular mechanism of Defe action
As it is well known that Defe is a potent iron chelator, to further confirm our results and to obtain preliminary data on the possible mechanism(s) by which Defe promotes GAA exon 2 inclusion, we treated immortalized fibroblasts from patients affected by LO-PD carrying the c.-32-13T>G with hemin to cause cellular iron overload, both alone or in combination with Defe. As shown in Figure 3A, hemin treatment resulted in decreased levels of exon 2 inclusion and a completed reversion of the effect of Defe. Most importantly, these changes in exon inclusion induced by iron chelation and iron overload were associated with parallel changes in GAA enzymatic activity (Figure 3B).
Figure 3.

Effect of hemin on exon 2 inclusion and enzymatic activity
Fibroblasts of a patient carrying the c.-32-13T>G mutation were treated for 7 days with Defe 10 μM or hemin, both alone or in combination with Defe, to induce cellular iron overload. (A) Quantitative real-time PCR analysis of GAA exon 2 inclusion (N). (B) GAA enzymatic activity. Results are expressed as fold of increase over fibroblasts treated with DMSO (vehicle). (C) Quantitative real-time PCR analysis of GAA exon 2 inclusion (N) in fibroblasts of a patient carrying the c.-32-13T>G mutation treated for 7 days with Defe 10 μM or cobalt chloride (CoCl2) 250 μM to induce HIF-1alpha. (D) Western blot analysis of HIF-1alpha protein in c.-32-13T>G fibroblasts treated with Defe, hemin (alone or in combination with Defe), and CoCl2. (E) Quantitative real-time PCR analysis of HIF-1alpha target genes. In all cases, results are expressed as mean ± SD of at least three independent experiments. ∗p < 0.05; ∗∗p < 0.01; ∗∗∗p < 0.001.
Furthermore, it has been shown that changes in iron availability induced by Defe are associated with stabilization of hypoxia-inducible factor 1 (HIF-1alpha), a master transcriptional regulator involved in cellular response to hypoxia.21 Therefore, we then analyzed whether the effects of Defe on exon inclusion were mediated by HIF-1alpha induction. To this aim, we assessed exon 2 inclusion in c.-32-13T>G fibroblasts treated with cobalt chloride, an inducer of HIF-1alpha expression. However, CoCl2 treatment did not exert any effect on exon 2 inclusion (Figure 3C), despite its action on HIF-1alpha protein expression and HIF-1alpha mRNA targets (Figures 3D and 3E).
Finally, it was interesting to see whether the effects of Defe were specific for c.-32-13T>G but could also be valid to globally improve the GAA enzymatic activity in the presence of other mutated alleles. For this reason, we obtained fibroblasts from patients carrying various disease-associated variants in association with c.-32-13T>G and c.-32-3C>A (also localized in the 3′ss of exon 2) (Figure 4A). As shown in Figure 4B, the treatment with Defe was able to increase the GAA activity in fibroblasts from patients carrying c.-32-13T>G and c.-32-3C>A variants in compound heterozygosis with missense or frameshift variants. However, it was not effective on fibroblasts carrying disease-associated variants other than c.-32-13T>G and c.-32-3C>A. These results highlight the high specificity of Defe for rescuing exon 2 inclusion levels in the presence of mutated 3′ss sequences and the fact that this is not just limited to the c.-32-13T>G variant for which we performed the screening.
Figure 4.

Effect of Defe on different combinations of alleles in patient fibroblasts
(A) Schematic diagram (in scale) of the GAA gene showing the localization of the different variants present in the various exons in patient fibroblasts. (B) Effect of Defe treatment GAA enzymatic activity in fibroblasts that carry the following allele combinations: c.-32-13T>G; c.2481+102_2646+31del, c.-32-13T>G; c.2646_2646+1delTG, c.-32-3C>A; c.1655T>C, c.692+1G>C; c.1645G>C, and c.989G>A; c.1655T. As shown in this figure, only the fibroblasts that carried a copy of the two 3′ss variants c.-32-13T>G and c.-32-3C>A were able to boost GAA activity following Defe treatment.
Transcriptomic analysis of differentially expressed genes associated with Defe treatment
In order to gain insights into the transcriptional pathways and genes implicated in the effects of Defe treatment on GAA exon 2 splicing, we performed transcriptome sequencing (RNA-seq) of fibroblasts from a patient carrying the c.-32-13T>G mutation treated with 10 uM Defe or vehicle for 3 days (three independent treatments) and then searched for differentially expressed genes (DEGs) by comparing Defe-treated against control cells. To identify up- and downregulated genes, the cutoff values used were the fold change (FC) value (upregulation cutoff: >1.3; downregulation cut-off: <0.7-FC) and the adjusted p value (padj) < 0.05. Following Defe treatment, a total of 4,768 genes (out of the 48,154 analyzed genes) were differentially expressed. Among them, 1,433 (30%) were upregulated and 2,785 (58%) were downregulated (Figure 5A). In order to obtain a general overview, volcano plots were used to visualize DEGs of Defe against control-treated cells, based on the p value and FC variation (Figure 5B). The top 100 upregulated and downregulated genes are reported in Figure S2.
Figure 5.

Transcriptomic analysis for differentially expressed genes (DEGs) in c.-32-13T>G fibroblasts
Patient fibroblasts were exposed to 10 μM Defe and total RNA was extracted after 3 days to perform RNA-seq. (A) Total genes analyzed and number of DEGs upregulated (fold change ≥ 1.3) or downregulated (fold change ≤ 0.7) with p value < 0.05 or padj < 0.05. (B) Volcano plot of data obtained from the RNA-seq experiment showing, for each transcript, the magnitude of the fold change (Log[FC], x axis) versus its statistical significance (−Log[p value], y axis). (C) KEGG, Reactome, and PANTHER pathways of DEGs after Defe treatment. Top 11 KEGG (left panel), Reactome (middle panel), and PANTHER (right panel) pathways are shown. Over-represented pathways have been ranked on the basis of their statistical significance. (D) Venn diagram with the overlap between DEGs obtained in RNA-seq and hypoxia-related genes. Upper panel: Venn diagram. The list of hypoxia-related genes used for this comparison was obtained from the HypoxiaDB database (http://www.hypoxiadb.com).22 Lower panel: top 50 ranking signature hypoxia/Defe (among the 670 shared deregulated genes). (E) Schematic diagram of GAA exon 2 showing the splicing regulatory silencer regions and the proteins that were experimentally found to bind these sequences. Below, table reporting the fold change of hnRNPs previously described to be able to affect exon 2 inclusion: factors capable to downregulate exon inclusion are shown in red (hnRNP A1, H, R, and F are significantly downregulated), neutral factors are shown in black, and factors known to positively regulate the inclusion of exon 2 are shown in blue. The magnitude of fold change is shown.
Next, to understand what regulatory and biochemical pathways were affected by Defe, we performed gene category enrichment analysis initially over Kyoto Encyclopedia of Genes and Genomes (KEGG) and then in Reactome and PANTHER (Protein ANalysis THrough Evolutionary Relationships) pathways for genes affected by treatment (Figure 5C). Interestingly, glycolysis/gluconeogenesis was among the top enriched pathways after KEGG mapping of Defe treatment, while RNA transport and spliceosome pathways were among the top 50 pathways (Figures 5C and S3). In addition, we observed enrichments of pathways related to metabolism of amino acids (biosynthesis of amino acids, valine, leucine and isoleucine degradation, lysine degradation, arginine and proline metabolism) cell replication (cell cycle, p53 signaling, DNA replication, oocyte meiosis, base excision repair), and signaling (PI3K/Akt, cAMP, FOXO, MAPK) (Figure S3; KEGG pathways). Some of the enrichments were confirmed by Reactome and PANTHER mapping. In particular, pathways related to cell replication (Figure S3; Reactome) and glycolysis (Figure S3; PANTHER).
Considering that, as stated before, Defe is a hypoxia-mimetic agent able to stabilize HIF-1alpha, we are also interested in evaluating the overlap between DEGs identified in response to Defe treatment and the human hypoxia-regulated genes, with a goal of confirming that transcriptomic changes following Defe treatment fit into the established hypoxia gene signature.22 Figure 5D shows the Venn diagram with overlap between these two gene sets. Among the 670 overlapping genes, classical or known hypoxia-inducible genes (such as CA9, MT3, ANGPTL4, PFKFB4, PDK3, and BNIP3) were among the most highly induced genes (Figure 5D),23, 24, 25 along with a subset of previously investigated HIF-1alpha-regulated genes (i.e., PDK1 3.74x, VEGFA 3.78x, and P4HA1 2.51x against control). As can be expected, treatment with Defe was also able to alter the splicing profile of many genes. As shown in Figure S4, all the different types of alternative splicing events were affected, and the majority of events involved skipped exons, followed by all the other different types of events (alternatively spliced 5′ splice site [5′ss] and 3′ss, mutually exclusive exons, and retained introns). In particular, the transcriptomic analysis revealed that Defe causes significant regulation of 1,720 events of exon skipping, 109 events of alternative 3′ss selection, 127 events of alternative 5′ss selection, 280 events of mutually exclusive exon, and 169 events of intron retention. For each category of splicing events, the list of the 25 top upregulated and downregulated events is reported in Table S2.
Finally, we verified the changes in the expression levels of heterogeneous Ribonucleoproteins (hnRNPs) known to be involved in the regulation of GAA exon 2 inclusion that was derived from our two previous studies on the regulatory regions present in this specific exon (Figure 5E, upper diagram).17,20 As shown in Figure 5E, lower diagram, it was interesting to observe that Defe induced the downregulation of all inhibitor hnRNPs but not significant or minor changes of the exon-2 enhancer factors YB-1 and DAZAP1. Moreover, the downregulation of the inhibitory hnRNP Q, hnRNP R, and hnRNP H due to Defe treatment was confirmed at the protein level in patient fibroblasts (Figure S5).
Discussion
The possibility to restore/increase normal splicing of the GAA exon 2 of transcripts carrying the c.-32-13T>G mutation is particularly appealing considering that: (1) almost all LO-PD patients carry this mutation in at least one allele, and (2) some patients express up to 30% of normal GAA activity, and just a little increase in exon inclusion might be enough to achieve a beneficial effect in clinical settings.26,27 Indeed, in previous work we have shown that by targeting silencer sequences within exon 2 of GAA with AMOs it is possible to increase GAA activity by 70%, and this increase was enough to partially correct intracellular glycogen storage in muscle cells.17
However, the use of small molecules as therapeutic agents offers several advantages compared to other nucleic acid-based therapies, including lower manufacturing costs and oral deliverability. In addition, it is possible to screen for small molecules already approved by the FDA that can be easily translated from the bench to the bedside.
Therefore, in this study we report the development of a fluorescent-based splicing reporter system suitable for HTS experiments and the identification of Defe as able to increase GAA exon 2 inclusion and enzymatic activity. These effects are mediated by changes in iron availability, independently from HIF-1alpha induction. Furthermore, the transcriptomic analysis suggests that this effect might rely, at least in part, on a shifting in the balance of splicing factor levels toward a profile promoting GAA exon 2 inclusion.
Besides this effect at the transcriptional level, additional effects of Defe on the activity of proteins involved in the splicing process cannot be excluded. Indeed, a connection between iron homeostasis and splicing regulation has already been reported.28, 29, 30, 31, 32, 33
Although the exact mechanism involved in such a modulation has not been fully elucidated, it was demonstrated that increased levels of iron reduce activity of the zinc-finger-containing splicing regulator SRSF7 by inhibiting its binding to the mRNA.30 In addition, an effect of the iron-oxoglutarate- and oxygen-dependent dioxygenase Jumonji domain-containing protein 6 (Jmjd6), an enzyme that catalyzes the Lys-hydroxylation of U2AF65 splicing factor, on splicing regulation has also been well documented.33, 34, 35 It was hypothesized that this post-translational modification might change the binding capacity of the U2AF65 to the pre-mRNA, conditioning the splicing process.
Although the ability of Defe to promote exon 2 inclusion seems to be independent of HIF-1alpha induction, the transcriptomic changes induced by Defe fit, as expected, into the established hypoxia gene signature22 and involved metabolic and glycolysis/gluconeogenesis pathways that could be relevant for disease pathogenesis. These findings suggest that Defe might affect, in addition to exon 2 splicing, other pathways involved in the pathogenic cascade in PD that deserve further investigation.
In conclusion, our work provides the first reported RNA-based approach for PD drug repurposing. However, the possibility to use Defe in clinical settings might be taken with caution, since the effects of chronic exposure to an iron chelator of patients who do not present iron overload might not be advisable. Nevertheless, our work provides the basis for the development of more potent chemically modified molecules, which either alone or in combination with ERT could improve the clinical outcome in LO-PD patients carrying the c.-32-13T>G variant.
Materials and methods
Hybrid EGFP-GAA minigene construction
Hybrid EGFP-GAA minigenes (in WT and mutant [MUT] versions) were built by cloning entire GAA exon 2, 50 nucleotides of the flanking GAA introns, and additional intronic sequences of the pTB-GAA WT and pTB-GAA MUT minigenes20 into the EGFP-N1 commercial plasmid, as shown in Figure S1.
Cell culture and transfection
Human immortalized fibroblasts and HeLa cells were cultured as previously described,20 and transfections were performed using transient transfection reagent Effectene (QIAGEN) or Lipofectamine (Invitrogene), according to manufacturer’s instructions.
Stable cell line generation
For selection of EGFP-GAA minigenes expressing clones, 48 h after transfection HeLa cells were plated at a confluence <25%, and after 5 h the medium was supplemented with 500 ug/mL of G410 (Sigma-Aldrich). The obtained clones were then amplified and tested for the expression of EGFP by western blot and fluorescence microscopy. In parallel, cells stably expressing a construct expressing ds-Red (RFP) to be used for control of compounds that regulate basal transcription were also generated.
HTS
Stable clones of HeLa cells expressing either Mut-EGFP-GAA minigenes or ds-Red (RFP; control for basal transcription) were plated (1,000 cells/well) in 2 sets of 384 wells (PerkinElmer ViewPlate-384 Black, Optically Clear Bottom, Tissue Culture Treated) using a Multidrop Combi Reagent Dispenser (Thermo Fisher Scientific). 24 h later, an intermediate dilution (50 μM; 0.5% DMSO in DMEM) of the FDA-approved compound library (1,280 compounds, Prestwick Chemical) was prepared using the STARlet automated liquid handling station (Hamilton) and 10 μl of the dilution was spotted on top of the cells, thus reaching a final concentration of 10 μM with 0.1% DMSO. After an additional 48 h, the cells were fixed in 4% paraformaldehyde (PFA) for 10 min and nuclei stained for Hoechst 33342 (Thermo Fisher Scientific). Both sets of plates were imaged using the ImageXpress Micro high-content screening microscope (Molecular Devices) with a Nikon PlanFluor 10× (numerical aperture [NA] = 0.30) objective. A total of 9 fields per well were acquired and subsequently analyzed for green fluorescent protein (GFP) and red fluorescent protein (RFP) cellular mean fluorescence intensity using the MetaXpress software (Molecular Devices) running the multi-wavelength cell scoring application module. The nuclear region was defined by an algorithm that segments the Hoechst 33342 channel signal using a combination of signal/background intensity and morphological parameters. Two independent biological replicates were run, and Z score was calculated for both cell viability and GFP mean cellular intensity. Compounds either reducing total cell number or modulating basal RFP expression (Z score ≤ 1.96 and Z score ≥ 1.96; p ≤ 0.05) were excluded from further analysis. A complete list of screening result is reported in Table S1.
RNA extraction and mRNA analysis
Total RNA from HeLa transfected cells and human immortalized PD fibroblasts was extracted using RNeasy Mini Kit (QIAGEN) and retrotranscribed using SuperScript III First-Strand Synthesis Kit (Invitrogen). Amplification of exon 2 splice variants was performed as previously described.20 The relative abundance of the normally spliced variant of GAA mRNA, as well as the HIF-1alpha target gene mRNA, was determined by quantitative real-time PCR as previously described.17 The sequence of primers used for the analysis of HIF-1alpha target genes is reported in Table S3)
Enzymatic activity
GAA enzymatic activity in cultured fibroblasts was measured as previously reported.17
Western blot
20 μg of total protein extracts was resolved on 8% SDS-PAGE gels and transferred to nitrocellulose membranes (Schleicher and Schuell). After overnight blocking with 5% non-fat dry milk in PBS-Tween 0.1% (PBS-T), the membranes were probed with anti-HIF-1alpha (D1S7W) rabbit monoclonal antibody (Cell Signaling Technology), anti-hnRNP Q (HPA041275, Sigma-Aldrich), anti-hnRNP R (ab30930, Abcam), anti-hnRNP H (home-made), anti-TARDBP (10782-2-AP, Proteintech), anti-DAZAP1 (HPA004201, Sigma-Aldrich) overnight at 4°C. Anti-rabbit horseradish peroxidase (HPR)-conjugated antibody was used as a secondary antibody. Immunoreactive bands were detected by SuperSignal West Pico PLUS chemiluminescent substrate (Thermo Fisher Scientific). The signals were normalized to those obtained for beta actin using a polyclonal anti-actin antibody (A2066, Sigma-Aldrich).
Statistical analysis
Significant differences in the expression levels of normal spliced GAA mRNA, HIF-1alpha targeted genes, and GAA activity were analyzed by Student’s unpaired t test.
RNA sequencing (RNA-seq) and analysis of DEGs
After exposure of human PD fibroblasts to 10 μM Defe or 0.1% DMSO (control condition) for 3 days (the time point showing the maximum increase of exon 2 inclusion), cells were harvested and total RNA was isolated using the TRIzol reagent (Invitrogen) according to the manufacturer’s instructions. Samples passed through the following steps before library construction: (1) analysis with NanoDrop 1000 spectrophotometer (Thermo Fisher Scientific) to test RNA purity (OD260/OD280); (2) analysis with agarose gel electrophoresis to test RNA degradation and potential contamination, and (3) analysis with Agilent Bioanalyzer 2100 system (Agilent Technologies) to check RNA integrity. Library construction, transcriptome sequencing (on an Illumina platform, with production of 150 bp paired-end reads), sequence assembly, and data analysis were carried out by Novogene (Beijing, China). Mapping to reference genome was generated with STAR software v2.5. HTSeq v0.6.1 was used to count the reads mapped to each gene in samples, and fragments per kilobase of transcript sequence per million base pairs (FPKM) of each gene were then calculated to estimate the expression level of genes in each sample. The DESeq2 package was used to investigate the differential expression between the two (Defe-treated and control) groups. Genes with padj. false discovery rate (FDR) <0.05 and 0.7 ≥ FC ≥ 1.3 were defined as DEGs.
Analysis of Reactome36
Enrichment was performed by using the clusterProfiler v3.8.1. Gene Ontology (GO) enrichment analysis and the statistical enrichment of differential expression genes in the KEGG37 pathways were carried out by using GOSeq v1.34 and KOBAS (KEGG Orthology Based Annotation System) software, respectively. Analysis of molecular functions, biological processes, and pathways were also performed by using the PANTHER classification system.38
To identify and count reads corresponding to each of the 5 types of alternative splicing events (ASEs; SE: skipped exon; MXE: mutually exclusive exon; A5SS: alternative 5′ splice site; A3SS: alternative 3′ splice site; RI: retained intron), the characterization of ASEs was carried out by using rMATS.39 rMATS counts the number of reads with each of the two described alternative events. Identification of events was carried out by using GENCODE annotation for genes for GRCh37/hg19.
Accession numbers
The data discussed in this publication have been deposited in NCBI’s Gene Expression Omnibus and are accessible through GEO Series accession number GEO: GSE155637.
Acknowledgments
This work was supported by Telethon grant GGP14192, AFM-Telethon Project SPLICESCREENPD, Helen Walker Research Grant for Pompe Disease from the Acid Maltase Deficiency Association (AMDA), and the Associazione Italiana Glicogenosi (AIG). The funders had no role in study design, data collection and analysis, decision to publish, or preparation of the manuscript.
Author contributions
Conceptualization, E.B. and A.D.; Methodology, E.B., A.D., L.B., and M.G.; Formal analysis, L.B. and M.R.; Investigation, P.P., L.B., I.Z., C.S., and E.G.; Writing – Original Draft, E.B. and A.D.; Writing – Review & Editing, E.B., A.D., M.R., L.B., M.G., and P.P.; Funding Acquisition, E.B. and A.D.; Resources, P.P., L.B., I.Z., C.S., and E.G.; Supervision, E.B., A.D., and M.G.
Declaration of interests
The authors declare no competing interests.
Footnotes
Supplemental Information can be found online at https://doi.org/10.1016/j.omtm.2020.11.011.
Contributor Information
Emanuele Buratti, Email: buratti@icgeb.org.
Andrea Dardis, Email: andrea.dardis@asufc.sanita.fvg.it.
Supplemental information
References
- 1.Hirschhorn R., Reuser A.J.J. McGraw-Hill; 2001. Glycogen Storage Disease Type II: Acid Alphaglucosidase (Acid Maltase) Deficiency. [Google Scholar]
- 2.Kishnani P.S., Howell R.R. Pompe disease in infants and children. J. Pediatr. 2004;144(5, Suppl):S35–S43. doi: 10.1016/j.jpeds.2004.01.053. [DOI] [PubMed] [Google Scholar]
- 3.van den Hout H.M., Hop W., van Diggelen O.P., Smeitink J.A., Smit G.P., Poll-The B.T., Bakker H.D., Loonen M.C.B., de Klerk J.B.C., Reuser A.J., van der Ploeg A.T. The natural course of infantile Pompe’s disease: 20 original cases compared with 133 cases from the literature. Pediatrics. 2003;112:332–340. doi: 10.1542/peds.112.2.332. [DOI] [PubMed] [Google Scholar]
- 4.Hagemans M.L., Winkel L.P., Hop W.C., Reuser A.J., Van Doorn P.A., Van der Ploeg A.T. Disease severity in children and adults with Pompe disease related to age and disease duration. Neurology. 2005;64:2139–2141. doi: 10.1212/01.WNL.0000165979.46537.56. [DOI] [PubMed] [Google Scholar]
- 5.Winkel L.P., Hagemans M.L., van Doorn P.A., Loonen M.C., Hop W.J., Reuser A.J., van der Ploeg A.T. The natural course of non-classic Pompe’s disease; a review of 225 published cases. J. Neurol. 2005;252:875–884. doi: 10.1007/s00415-005-0922-9. [DOI] [PubMed] [Google Scholar]
- 6.Parini R., De Lorenzo P., Dardis A., Burlina A., Cassio A., Cavarzere P., Concolino D., Della Casa R., Deodato F., Donati M.A. Long term clinical history of an Italian cohort of infantile onset Pompe disease treated with enzyme replacement therapy. Orphanet J. Rare Dis. 2018;13:32. doi: 10.1186/s13023-018-0771-0. [DOI] [PMC free article] [PubMed] [Google Scholar]
- 7.van der Ploeg A.T. Where do we stand in enzyme replacement therapy in Pompe’s disease? Neuromuscul. Disord. 2010;20:773–774. doi: 10.1016/j.nmd.2010.09.011. [DOI] [PubMed] [Google Scholar]
- 8.Raben N., Danon M., Gilbert A.L., Dwivedi S., Collins B., Thurberg B.L., Mattaliano R.J., Nagaraju K., Plotz P.H. Enzyme replacement therapy in the mouse model of Pompe disease. Mol. Genet. Metab. 2003;80:159–169. doi: 10.1016/j.ymgme.2003.08.022. [DOI] [PubMed] [Google Scholar]
- 9.Gort L., Coll M.J., Chabás A. Glycogen storage disease type II in Spanish patients: high frequency of c.1076-1G>C mutation. Mol. Genet. Metab. 2007;92:183–187. doi: 10.1016/j.ymgme.2007.05.011. [DOI] [PubMed] [Google Scholar]
- 10.Herzog A., Hartung R., Reuser A.J., Hermanns P., Runz H., Karabul N., Gökce S., Pohlenz J., Kampmann C., Lampe C. A cross-sectional single-centre study on the spectrum of Pompe disease, German patients: molecular analysis of the GAA gene, manifestation and genotype-phenotype correlations. Orphanet J. Rare Dis. 2012;7:35. doi: 10.1186/1750-1172-7-35. [DOI] [PMC free article] [PubMed] [Google Scholar]
- 11.Joshi P.R., Gläser D., Schmidt S., Vorgerd M., Winterholler M., Eger K., Zierz S., Deschauer M. Molecular diagnosis of German patients with late-onset glycogen storage disease type II. J. Inherit. Metab. Dis. 2008;31(Suppl 2):S261–S265. doi: 10.1007/s10545-008-0820-2. [DOI] [PubMed] [Google Scholar]
- 12.Montalvo A.L., Bembi B., Donnarumma M., Filocamo M., Parenti G., Rossi M., Merlini L., Buratti E., De Filippi P., Dardis A. Mutation profile of the GAA gene in 40 Italian patients with late onset glycogen storage disease type II. Hum. Mutat. 2006;27:999–1006. doi: 10.1002/humu.20374. [DOI] [PubMed] [Google Scholar]
- 13.Nascimbeni A.C., Fanin M., Tasca E., Angelini C. Molecular pathology and enzyme processing in various phenotypes of acid maltase deficiency. Neurology. 2008;70:617–626. doi: 10.1212/01.wnl.0000299892.81127.8e. [DOI] [PubMed] [Google Scholar]
- 14.Wan L., Lee C.C., Hsu C.M., Hwu W.L., Yang C.C., Tsai C.H., Tsai F.J. Identification of eight novel mutations of the acid alpha-glucosidase gene causing the infantile or juvenile form of glycogen storage disease type II. J. Neurol. 2008;255:831–838. doi: 10.1007/s00415-008-0714-0. [DOI] [PubMed] [Google Scholar]
- 15.Boerkoel C.F., Exelbert R., Nicastri C., Nichols R.C., Miller F.W., Plotz P.H., Raben N. Leaky splicing mutation in the acid maltase gene is associated with delayed onset of glycogenosis type II. Am. J. Hum. Genet. 1995;56:887–897. [PMC free article] [PubMed] [Google Scholar]
- 16.Raben N., Nichols R.C., Martiniuk F., Plotz P.H. A model of mRNA splicing in adult lysosomal storage disease (glycogenosis type II) Hum. Mol. Genet. 1996;5:995–1000. doi: 10.1093/hmg/5.7.995. [DOI] [PubMed] [Google Scholar]
- 17.Goina E., Peruzzo P., Bembi B., Dardis A., Buratti E. Glycogen Reduction in Myotubes of Late-Onset Pompe Disease Patients Using Antisense Technology. Mol. Ther. 2017;25:2117–2128. doi: 10.1016/j.ymthe.2017.05.019. [DOI] [PMC free article] [PubMed] [Google Scholar]
- 18.Goina E., Musco L., Dardis A., Buratti E. Assessment of the functional impact on the pre-mRNA splicing process of 28 nucleotide variants associated with Pompe disease in GAA exon 2 and their recovery using antisense technology. Hum. Mutat. 2019;40:2121–2130. doi: 10.1002/humu.23867. [DOI] [PubMed] [Google Scholar]
- 19.Sumanasekera C., Watt D.S., Stamm S. Substances that can change alternative splice-site selection. Biochem. Soc. Trans. 2008;36:483–490. doi: 10.1042/BST0360483. [DOI] [PubMed] [Google Scholar]
- 20.Dardis A., Zanin I., Zampieri S., Stuani C., Pianta A., Romanello M., Baralle F.E., Bembi B., Buratti E. Functional characterization of the common c.-32-13T>G mutation of GAA gene: identification of potential therapeutic agents. Nucleic Acids Res. 2014;42:1291–1302. doi: 10.1093/nar/gkt987. [DOI] [PMC free article] [PubMed] [Google Scholar]
- 21.Semenza G.L. Hypoxia-inducible factors in physiology and medicine. Cell. 2012;148:399–408. doi: 10.1016/j.cell.2012.01.021. [DOI] [PMC free article] [PubMed] [Google Scholar]
- 22.Khurana P., Sugadev R., Jain J., Singh S.B. HypoxiaDB: a database of hypoxia-regulated proteins. Database (Oxford) 2013;2013:bat074. doi: 10.1093/database/bat074. [DOI] [PMC free article] [PubMed] [Google Scholar]
- 23.Zhang H., Lu C., Fang M., Yan W., Chen M., Ji Y., He S., Liu T., Chen T., Xiao J. HIF-1α activates hypoxia-induced PFKFB4 expression in human bladder cancer cells. Biochem. Biophys. Res. Commun. 2016;476:146–152. doi: 10.1016/j.bbrc.2016.05.026. [DOI] [PubMed] [Google Scholar]
- 24.Hata S., Nomura T., Iwasaki K., Sato R., Yamasaki M., Sato F., Mimata H. Hypoxia-induced angiopoietin-like protein 4 as a clinical biomarker and treatment target for human prostate cancer. Oncol. Rep. 2017;38:120–128. doi: 10.3892/or.2017.5669. [DOI] [PubMed] [Google Scholar]
- 25.Tsui K.H., Hou C.P., Chang K.S., Lin Y.H., Feng T.H., Chen C.C., Shin Y.S., Juang H.H. Metallothionein 3 Is a Hypoxia-Upregulated Oncogene Enhancing Cell Invasion and Tumorigenesis in Human Bladder Carcinoma Cells. Int. J. Mol. Sci. 2019;20:980. doi: 10.3390/ijms20040980. [DOI] [PMC free article] [PubMed] [Google Scholar]
- 26.Kroos M., Hoogeveen-Westerveld M., Michelakakis H., Pomponio R., Van der Ploeg A., Halley D., Reuser A., GAA Database Consortium Update of the pompe disease mutation database with 60 novel GAA sequence variants and additional studies on the functional effect of 34 previously reported variants. Hum. Mutat. 2012;33:1161–1165. doi: 10.1002/humu.22108. [DOI] [PubMed] [Google Scholar]
- 27.Kroos M.A., Pomponio R.J., Hagemans M.L., Keulemans J.L., Phipps M., DeRiso M., Palmer R.E., Ausems M.G., Van der Beek N.A., Van Diggelen O.P. Broad spectrum of Pompe disease in patients with the same c.-32-13T->G haplotype. Neurology. 2007;68:110–115. doi: 10.1212/01.wnl.0000252798.25690.76. [DOI] [PubMed] [Google Scholar]
- 28.Yun Z., Glazer P.M. Tumor suppressor p53 stole the AKT in hypoxia. J. Clin. Invest. 2015;125:2264–2266. doi: 10.1172/JCI82058. [DOI] [PMC free article] [PubMed] [Google Scholar]
- 29.Zou Y.F., Rong Y.M., Tan Y.X., Xiao J., Yu Z.L., Chen Y.F., Ke J., Li C.H., Chen X., Wu X.J. A signature of hypoxia-related factors reveals functional dysregulation and robustly predicts clinical outcomes in stage I/II colorectal cancer patients. Cancer Cell Int. 2019;19:243. doi: 10.1186/s12935-019-0964-1. [DOI] [PMC free article] [PubMed] [Google Scholar]
- 30.Lin W., Wu S., Chen X., Ye Y., Weng Y., Pan Y., Chen Z., Chen L., Qiu X., Qiu S. Characterization of Hypoxia Signature to Evaluate the Tumor Immune Microenvironment and Predict Prognosis in Glioma Groups. Front. Oncol. 2020;10:796. doi: 10.3389/fonc.2020.00796. [DOI] [PMC free article] [PubMed] [Google Scholar]
- 31.Chen J., Crutchley J., Zhang D., Owzar K., Kastan M.B. Identification of a DNA Damage-Induced Alternative Splicing Pathway That Regulates p53 and Cellular Senescence Markers. Cancer Discov. 2017;7:766–781. doi: 10.1158/2159-8290.CD-16-0908. [DOI] [PMC free article] [PubMed] [Google Scholar]
- 32.Tejedor J.R., Papasaikas P., Valcárcel J. Genome-wide identification of Fas/CD95 alternative splicing regulators reveals links with iron homeostasis. Mol. Cell. 2015;57:23–38. doi: 10.1016/j.molcel.2014.10.029. [DOI] [PubMed] [Google Scholar]
- 33.Barman-Aksözen J., Béguin C., Dogar A.M., Schneider-Yin X., Minder E.I. Iron availability modulates aberrant splicing of ferrochelatase through the iron- and 2-oxoglutarate dependent dioxygenase Jmjd6 and U2AF(65.) Blood Cells Mol. Dis. 2013;51:151–161. doi: 10.1016/j.bcmd.2013.05.008. [DOI] [PubMed] [Google Scholar]
- 34.Boeckel J.N., Guarani V., Koyanagi M., Roexe T., Lengeling A., Schermuly R.T., Gellert P., Braun T., Zeiher A., Dimmeler S. Jumonji domain-containing protein 6 (Jmjd6) is required for angiogenic sprouting and regulates splicing of VEGF-receptor 1. Proc. Natl. Acad. Sci. USA. 2011;108:3276–3281. doi: 10.1073/pnas.1008098108. [DOI] [PMC free article] [PubMed] [Google Scholar]
- 35.Webby C.J., Wolf A., Gromak N., Dreger M., Kramer H., Kessler B., Nielsen M.L., Schmitz C., Butler D.S., Yates J.R., 3rd Jmjd6 catalyses lysyl-hydroxylation of U2AF65, a protein associated with RNA splicing. Science. 2009;325:90–93. doi: 10.1126/science.1175865. [DOI] [PubMed] [Google Scholar]
- 36.Fabregat A., Jupe S., Matthews L., Sidiropoulos K., Gillespie M., Garapati P., Haw R., Jassal B., Korninger F., May B. The Reactome Pathway Knowledgebase. Nucleic Acids Res. 2018;46(D1):D649–D655. doi: 10.1093/nar/gkx1132. [DOI] [PMC free article] [PubMed] [Google Scholar]
- 37.Kanehisa M., Sato Y., Kawashima M., Furumichi M., Tanabe M. KEGG as a reference resource for gene and protein annotation. Nucleic Acids Res. 2016;44(D1):D457–D462. doi: 10.1093/nar/gkv1070. [DOI] [PMC free article] [PubMed] [Google Scholar]
- 38.Mi H., Poudel S., Muruganujan A., Casagrande J.T., Thomas P.D. PANTHER version 10: expanded protein families and functions, and analysis tools. Nucleic Acids Res. 2016;44(D1):D336–D342. doi: 10.1093/nar/gkv1194. [DOI] [PMC free article] [PubMed] [Google Scholar]
- 39.Shen S., Park J.W., Lu Z.X., Lin L., Henry M.D., Wu Y.N., Zhou Q., Xing Y. rMATS: robust and flexible detection of differential alternative splicing from replicate RNA-Seq data. Proc. Natl. Acad. Sci. USA. 2014;111:E5593–E5601. doi: 10.1073/pnas.1419161111. [DOI] [PMC free article] [PubMed] [Google Scholar]
Associated Data
This section collects any data citations, data availability statements, or supplementary materials included in this article.