

Abstract
Aβ deposits are a relatively late consequence of Aβ aggregation in Alzheimer’s disease (AD). It is not known when pathogenic Aβ seeds begin to form, propagate, and spread, nor are they biochemically defined. We tested various antibodies for their ability to neutralize Aβ seeds before β-amyloid deposition becomes detectable in Aβ-precursor protein-transgenic mice. We also characterized the different antibody recognition profiles using immunoprecipitation of size-fractionated, native, mouse and human brain-derived Aβ assemblies. At least one antibody, aducanumab, after acute administration at the pre-amyloid stage, led to a significant reduction of Aβ deposition and downstream pathologies 6 months later. This demonstrates therapeutically targetable pathogenic Aβ seeds already exist during the lag-phase of protein aggregation in brain. Thus, the preclinical phase of AD – currently defined as Aβ deposition without clinical symptoms – may be a relatively late manifestation of a much earlier pathogenic seed formation and propagation that currently escapes detection in vivo.
The misfolding and aggregation of the β-amyloid (Aβ) peptide is a hallmark of Alzheimer’s disease (AD) and is believed to be the initial trigger of AD pathogenesis1,2. The removal of aggregated Aβ from the brain has therefore been a major therapeutic strategy, most notably the antibody-mediated clearance of Aβ via passive immunization. However, several clinical trials of Aβ antibodies in patients with mild-to-moderate AD have been stopped due to lack of efficacy. Two possible explanations for the failure of these trials are that the treatment was initiated too late in the pathogenic process, i.e., when tauopathy, inflammation, neuron loss and other neurodegenerative sequelae have become pronounced, and/or that the Aβ antibodies did not optimally target the most pathogenic Aβ assemblies (e.g.,3).
Cerebral Aβ deposition can be detected by positron emission tomography (PET) with amyloid-selective ligands or by a decrease of Aβ in the cerebrospinal fluid (CSF). Both modalities indicate that Aβ deposition begins at least two decades before signs and symptoms appear4,5. Thus, the most effective therapeutic strategy is likely to be primary prevention, i.e., to impede the Aβ cascade before there is detectable Aβ deposition6. However, the timeframe of such early intervention is not yet clear, since both Aβ-PET and CSF Aβ readouts become positive only at a stage when Aβ deposition in brain is well underway7–10. Moreover, in mouse models and in AD, Aβ seeding activity is most potent in the earliest stages of pathogenesis and declines with advancing age and the progression of disease11,12.
We therefore set out to test the hypothesis that biologically active Aβ seeds are present in vivo before Aβ aggregation and deposition become detectable with current methods, and to determine whether such “pre-amyloid” seeds can be targeted therapeutically. Using murine or murinized versions of well-characterized human Aβ antibodies and a new technique to determine the Aβ-assembly recognition profile of the antibodies, we provide evidence for the presence of pathogenic Aβ seeds during the lag-phase of Aβ deposition, and that acutely targeting such seeds may be an effective paradigm for the prevention of AD.
RESULTS
Pre-amyloid Aβ seeds can be targeted by antibodies
To study early Aβ seed formation, we assessed Aβ levels in pre-depositing male APP23 transgenic mice using ultrasensitive immunoassays (Fig. 1a). All samples were formic acid-extracted under the assumption that Aβ seeds adopt a β-sheet-rich conformation even at pre-amyloid stages. Results revealed an initial increase in insoluble Aβ at 7–8 months of age, roughly 1–2 months before Aβ deposits become detectable by histology and 8–10 months before they are detectable by PET imaging in these animals (Fig. 1a).
Figure 1. Targeting Aβ seeds at the pre-amyloid stage.
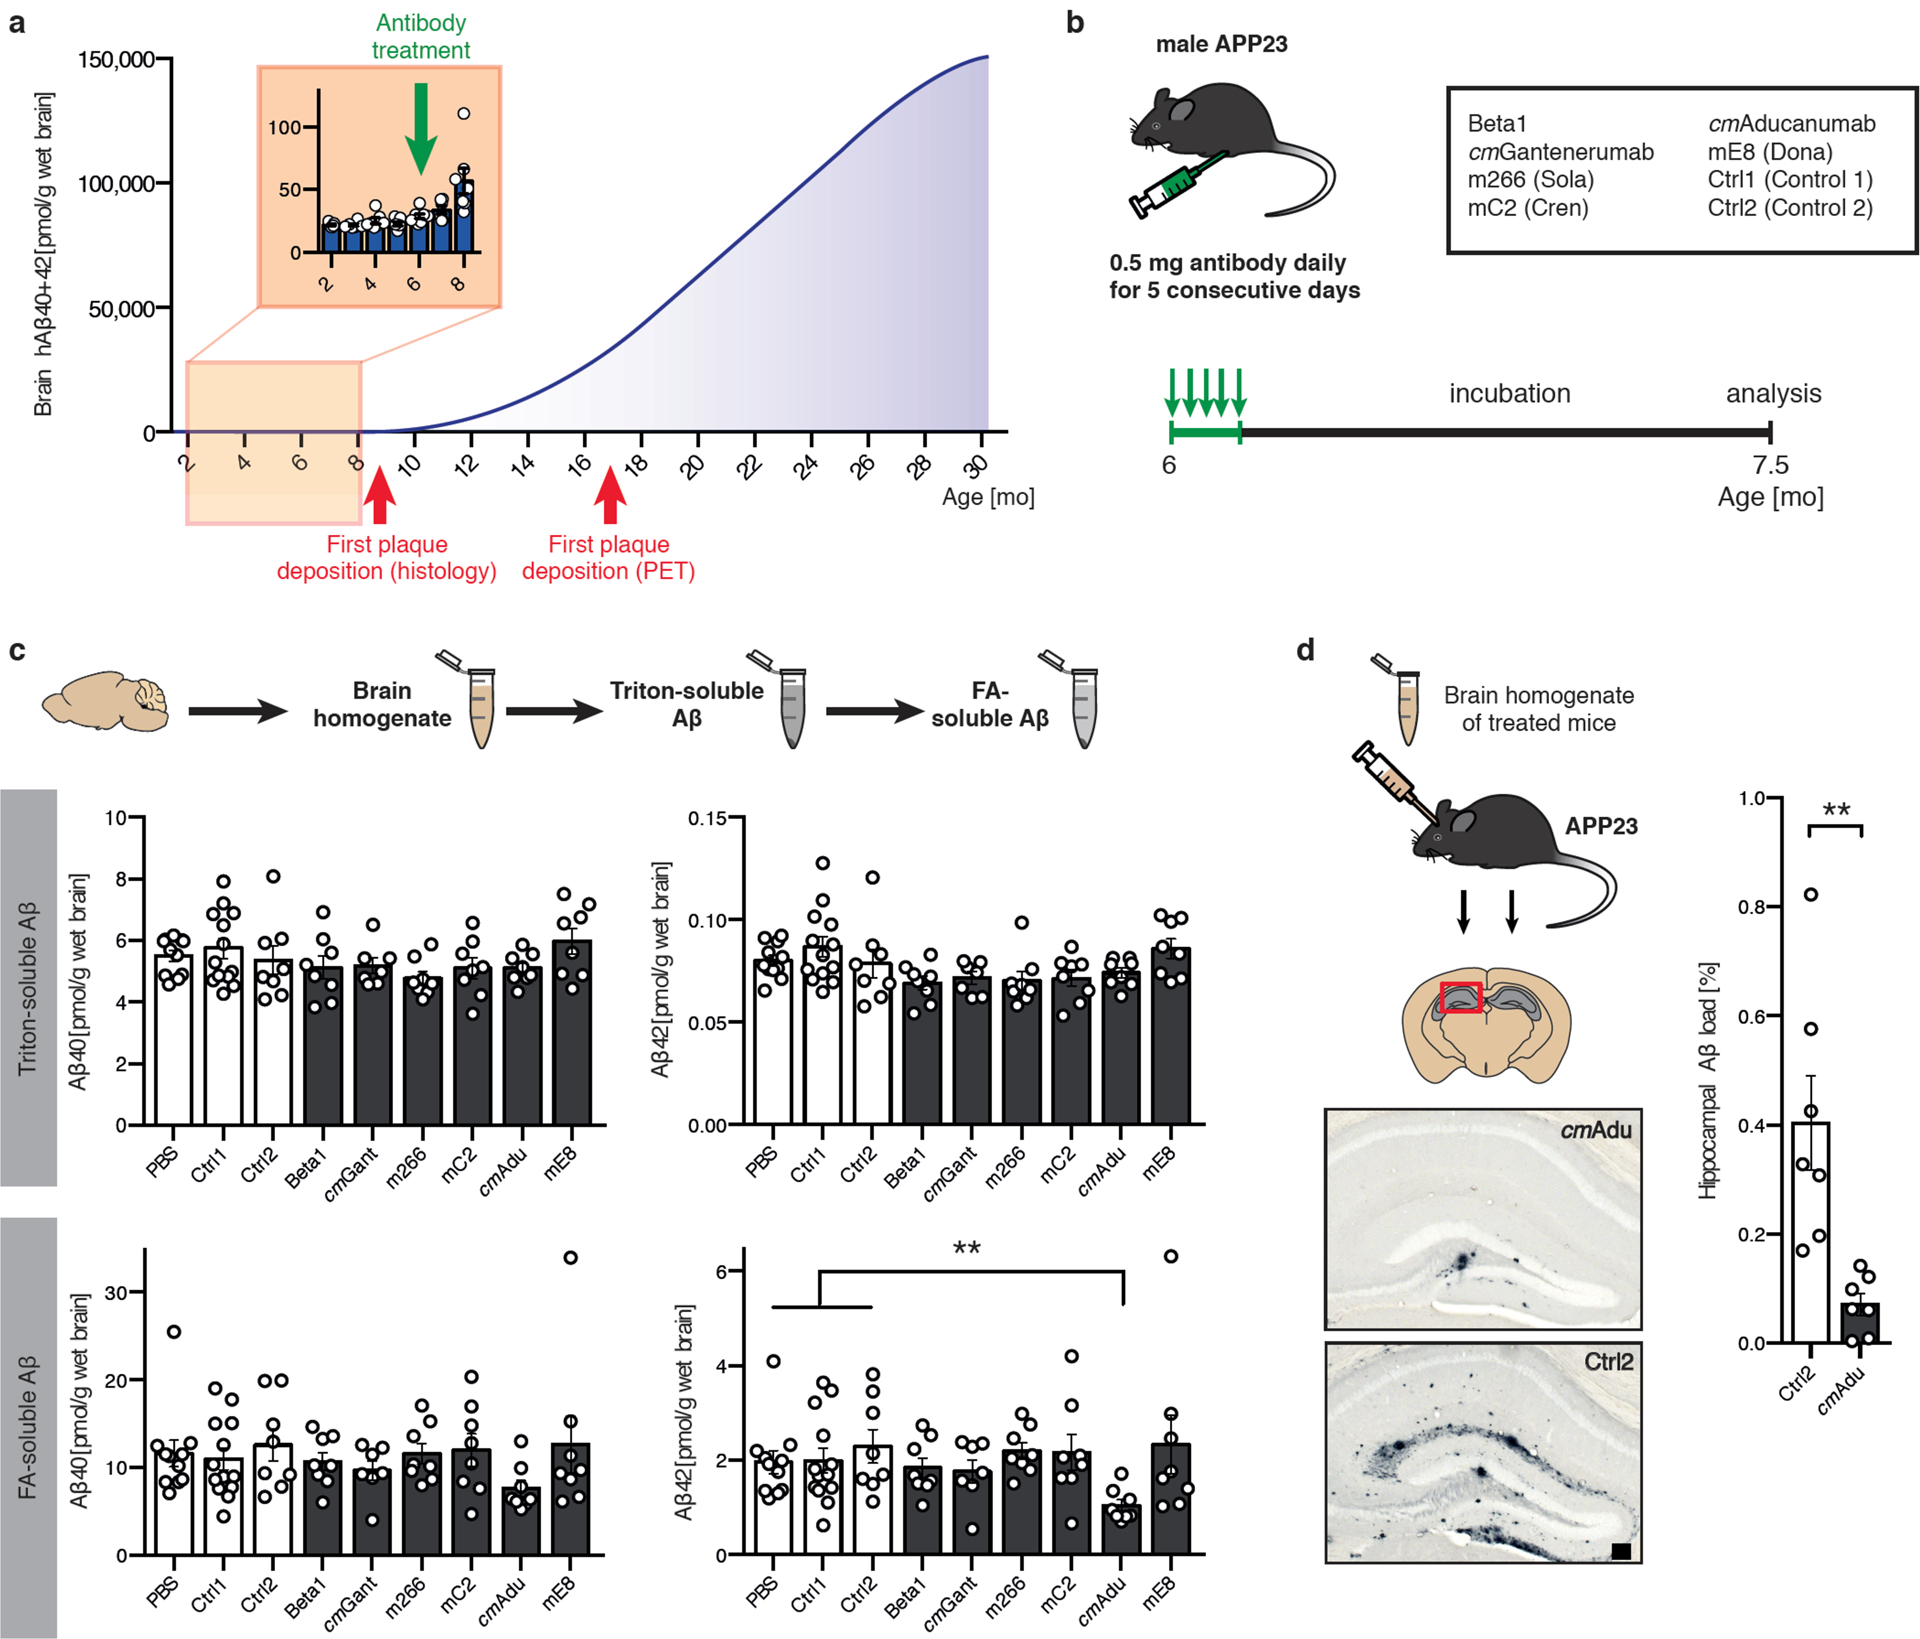
(a) Brain Aβ in male APP23 mice as a function of age. The polynomial (4th degree) curve for human (h) Aβ concentration (Aβx-40 and Aβx-42 combined) at 10–30 months of age was calculated based on previous publications11,44,45. In addition, hAβx-40 and Aβx-42 were measured in 2- to 8-month-old male APP23 mice, revealing a first notable increase at 7–8 months of age (n=7, 6, 7, 7, 7, 6, 7 for the 2, 3, 4, 5, 6, 7, 8 month-old mice, respectively). This is at least 1 month earlier than Aβ plaque deposition becomes apparent histologically in male APP23 mice11,25,46, and 9 months earlier than plaque deposition has been reported by PET imaging47. (b) Schematic overview of antibody screening (see also extended Data Table 1). Six-month-old male APP23 mice intraperitoneally received 0.5 mg of one of the six antibodies directed against Aβ, corresponding control (Ctrl) antibodies, or PBS on 5 consecutive days (n=11 [PBS], 13 [Ctrl1], 8 [Ctrl2], 8 [Beta1], 7 [cmGantanerumab {cmGant}], 8 [m266], 8 [mC2], 8 [cmAducanumab {cmAdu}], 8 [mE8]). All groups initially had n=8 mice. One [cmGant] animal died. mE8 immunization and additional controls were performed in a separate experiment, explaining the higher number of mice receiving control antibody. Mice were sacrificed and analyzed at 7.5 months of age. (c) Brain homogenates were extracted by Triton and subsequently with formic acid (FA). Number of mice/group see above. PBS, Ctrl1, and Ctrl2 were pooled for this analysis. Kruskal-Wallis-Test indicated no group differences for the Triton-extracted Aβ (Aβx-40, H(6)=8.865, P=0.1813; Aβx-42, H(6)=14.84, P=0.0215; no significant group differences between controls and any other group with post hoc Dunn’s multiple comparison). For FA-extracted Aβ, group differences were found for Aβx-42 (H(6)=14.73; P=0.0225, post hoc Dunn’s multiple comparison test between cmAdu-injected mice and controls, P=0.006). Note that Aβ was determined with MSD immunoassays while the measurements in panel (a) were done using Simoa assays and direct FA extraction, thus there are minor differences in absolute amounts (see Methods). (d) Brain homogenates from cmAdu- and Ctrl2-treated (7.5-month-old) mice were inoculated into the hippocampus of 3-month-old male APP23 hosts. After an 8-month incubation period, the brain homogenate of cmAdu-treated mice induced markedly less Aβ deposition (n=7 for both cmAdu and Ctrl2, two-tailed unpaired t-test; t(12)=3.726; P=0.003). All data are represented as group means ± SEMs; **P<0.01; Scale bar in d: 100μm.
To determine whether this increase in formic acid-soluble Aβ at 7–8 months of age indicates an even earlier presence of biologically active Aβ seeds, we probed the mice at 6 months of age with a variety of antibodies. Since no information was available about the nature or structure of putative pre-amyloid seeds, we selected antibodies against various Aβ species and assemblies, including murine and murinized versions of antibodies that have been used in clinical trials (Fig. 1b; extended Data Table 1). For comparative reasons, all antibodies (except one) were available on an IgG2a background to maintain their presumed effector function in mice13. To achieve high antibody levels in the brain, the antibodies were applied at 0.5 mg/mouse/day intraperitoneally (i.p.) for 5 consecutive days. The mice were analyzed 6 weeks later, at 7.5 months of age, a time when they show formic acid-extractable Aβ but still have no histologically detectable Aβ deposition in the brain (Fig. 1b).
None of the tested antibodies altered Aβ levels in the Triton-soluble fraction. However, in the mice that received the chimeric murinized (cm) version of Aducanumab (cmAducanumab), Aβ was markedly reduced in the formic-acid soluble fraction (Fig. 1c). For Aβ42 (the Aβ species ending with amino acid 42) the reduction reached 50%. To probe whether cmAducanumab indeed removed early Aβ seeds, a well-established in vivo seeding assay was performed11, i.e., minute amounts of brain homogenates from the cmAducanumab- and control antibody-treated mice were infused into young, 3-month-old APP23 mice (Fig. 1d). While brain extract from the control antibody-treated mice strongly seeded Aβ deposition in the host mice 8 months later, seeding activity was reduced by more than 80% in the brain extract from the cmAducanumab-treated mice (Fig. 1d).
Characterization of pre-amyloid Aβ seeds
The finding that only cmAducanumab removed Aβ seeds at pre-amyloid stages was surprising, especially in light of previous evidence that the Beta1 antibody recognizes and blocks Aβ seeds extracted from aged, amyloid-laden APP23 mouse brains14,15. The characterization of native Aβ assemblies (and putative seeds) recognized by antibodies is inherently difficult. Thus, we used agarose-gel electrophoresis to separate brain-derived Aβ assemblies under semi-native conditions based on size, followed by enzymatic digestion of the agarose to liberate the Aβ assemblies. We then used antibody-immunoprecipitation to establish an Aβ-assembly recognition profile for a given antibody, a technique that we termed Antibody Recognition Profiling of Aβ assemblies (ARPA) (Fig. 2a; extended Data Fig. 1).
Figure 2. Brain Aβ assemblies recognized by the various antibodies.
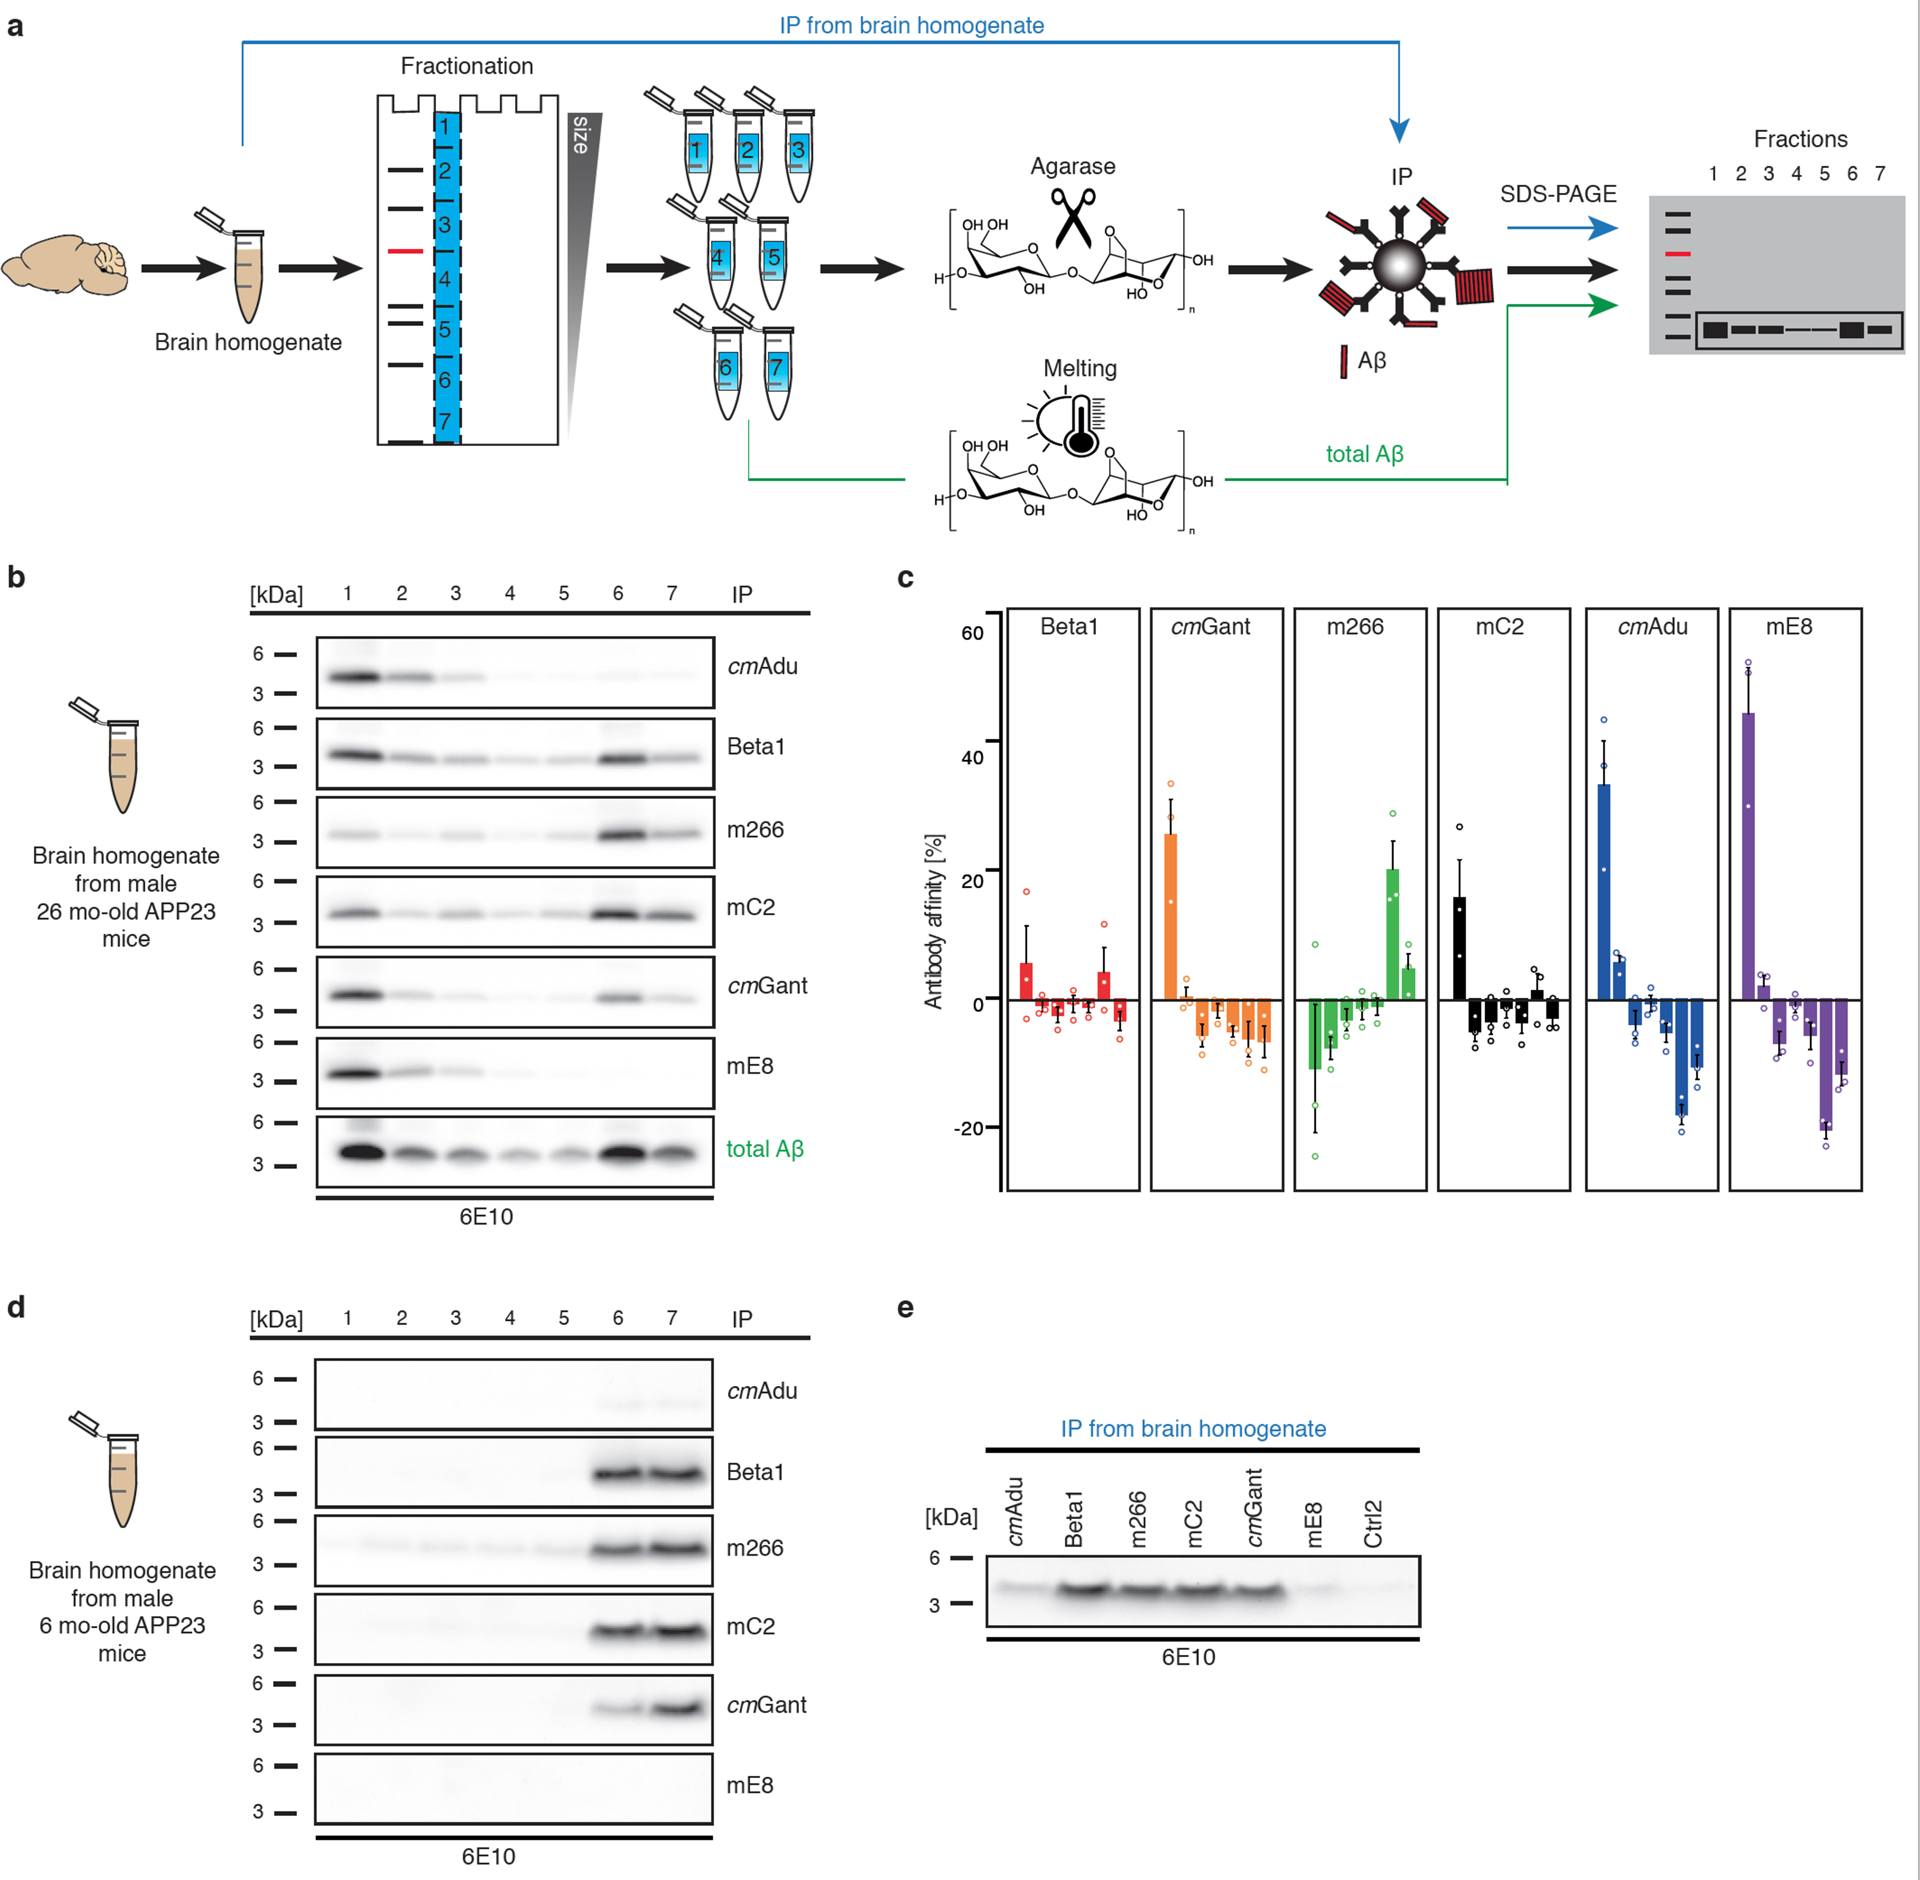
(a) Schematic overview of Antibody Recognition Profiling of Aβ assemblies (ARPA). In a first step, brain PBS-homogenates are immunoprecipitated with the various antibodies followed by denaturing immunoblotting using 6E10 antibody. In a second step, brain PBS-homogenates are subjected to semi-native agarose gel electrophoresis. Liquefied agarose fractions containing Aβ assemblies of various sizes are then achieved by cutting the agarose gels into pieces and treating the pieces with agarase. Within each individual fraction, Aβ is then immunoprecipitated with one of the various antibodies followed by denaturing immunoblotting. As a control for the total amount of Aβ in the individual fractions, agarose gel pieces are melted and subjected to denaturing immunoblotting. For a more detailed description of ARPA, see extended Data Fig. 1 and Methods. (b) In fresh-frozen, amyloid-laden tissue samples from aged, male 26-month-old APP23 mice (hemibrains from three mice were pooled to get a representative sample), ARPA revealed that cmAdu and mE8 recognized almost exclusively larger Aβ assemblies while Beta1 and mC2 (and to some degree also cmGant) recognized larger but also low molecular weight (presumably monomeric) Aβ (bands 6 and 7). Antibody m266 mainly recognized monomeric Aβ. (c) Bands were quantified and the difference in intensity compared to total Aβ in the melted fraction is shown (the experiment was repeated 3 times; means and SEMs are shown). Positive antibody affinity values indicate that the antibody recognizes Aβ species better than predicted from the total amount of Aβ, while a negative antibody affinity indicates that the antibody recognizes an Aβ species less than expected from the total amount of Aβ in this fraction. (d) In PBS homogenates from young, 6-month-old APP23 brains (hemibrains from at least three animals were pooled per experiment to get representative samples), ARPA revealed recognition of monomeric Aβ by Beta1, mC2, cmGant, and m266, but these antibodies failed to detect larger Aβ assemblies. No signal and a signal barely above background were obtained with mE8 and cmAdu, respectively (the experiment was performed three times, for quantification see extended Data Fig. 3). However, (e) using direct immunoprecipitation, cmAdu recognized Aβ species, while no similar signal was found for mE8. Note that in amyloid-laden mouse (panel b) and human brain (extended Data Fig. 2), monomeric Aβ largely runs in fraction 6 while in the young (pre-amyloid) brain it runs equally in 6 and 7.
ARPA of PBS homogenates from amyloid-laden APP23 mouse brains revealed robust differences among the antibodies (Fig. 2b). While cmAducanumab and mE8 recognized almost exclusively larger Aβ assemblies, Beta1 and mC2 (and to some degree also cmGantenerumab) recognized a variety of Aβ assemblies, including monomeric Aβ. In contrast, m266 mainly recognized monomeric Aβ. Similar results were found when AD brain samples were tested (extended Data Fig. 2a).
In 6-month-old APP23 mice, Beta1, mC2, cmGantenerumab, and m266 again recognized monomeric Aβ, but they failed to bind larger Aβ assemblies due to the low abundance of Aβ assemblies (presumably Aβ seeds) at this stage (Fig. 2c). Consistently, the signals for cmAducanumab and mE8 were barely above background in mice of this age (Fig. 2c; extended Data Fig. 3). However, when direct immunoprecipitation from bulk brain homogenate was used, cmAducanumab recognized an Aβ species even in the 6-month-old APP23 mouse brain, while no such signal was found for mE8 (Fig. 2c). The latter finding is consistent with pyroglutamated Aβ occurring at later stages of cerebral Aβ-amyloidosis16–18.
The inability of ARPA to reveal Aβ seeds at very early and pre-amyloid stages was not entirely unexpected given that pathogenic Aβ seeds can largely escape biochemical detection19. When brain homogenates from the antibody-treated 7.5-month-old mice (see Fig. 1) were examined with ARPA, faint bands of higher molecular Aβ species were found in the control-treated mice but not in the cmAducanumab-treated mice (Fig. 3). These higher molecular-weight Aβ species appear to be highly seeding-active (extended Data Fig. 2b–e), although it is also possible that these faint bands reflect early Aβ deposition in the control-treated mice, and thus do not necessarily represent the seeds.
Figure 3. Removal of higher molecular Aβ assemblies in cmAducanumab-treated mice.
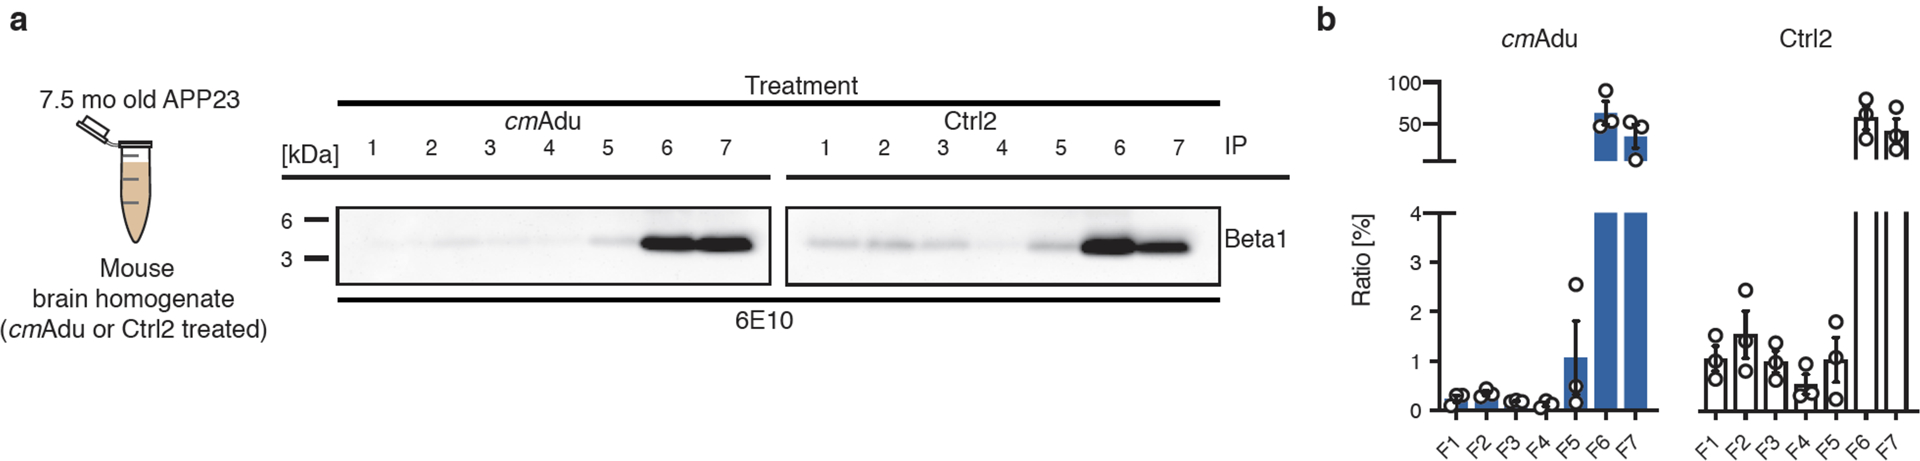
(a) Six month-old APP23 mice acutely treated with cmAducanumab (cmAdu) and Control antibody (Ctrl2) were examined at 7.5-months of age (see Fig. 1 for details). Brain PBS homogenates of all 8 cmAdu- and 8 Ctrl2-treated mice were pooled. Homogenates were examined with ARPA (see Fig. 2 for a description of the ARPA methodology) using Beta1 antibody as capture antibody to pull down Aβ. Beta1 was used since it recognizes all Aβ species fairly equally in this assay (see Fig. 2). Note the faint bands in the higher molecular fractions in the Ctrl2-treated mice that appear diminished in the cmAdu-treated mice. (b) For semi-quantitative analysis, densitometric values obtained from a chemiluminescence imager were normalized to the time of exposure. For each fraction, the signal per second was calculated for five exposure times before signal saturation and means were taken. For comparison, all signal-per-second values for a treatment group were set equal to 100% and the relative value for each fraction was plotted. The experiment was repeated 3 times and the means ± SEMs are shown. Similar results were obtained in an additional experiment with the antibody 4G8 (BioLegend, San Diego, CA) as capture antibody.
Pharmacokinetics of antibodies
It is conceivable that the successful targeting of pre-amyloid seeds in the brain by cmAducanumab was based on a unique pharmacokinetic profile of cmAducanumab rather than the recognition of seeding-active (pre-amyloid) Aβ species. To this end, we studied the pharmacokinetics of cmAducanumab in comparison to m266 and Beta1 because of their markedly different Aβ assembly recognition profiles and different seed-removal capabilities. Six-month-old male APP23 mice and corresponding wildtype control mice were injected i.p. with the respective antibodies at 0.5 mg/mouse/day for 5 consecutive days (Fig. 4), as in previous experiments. The concentrations of all three antibodies declined exponentially in the plasma within a similar range (Fig. 4). For m266 and Beta1, the decline was faster in APP23 mice compared to wildtype mice, consistent with the binding of m266 and Beta1 to monomeric Aβ in the blood. In contrast, cmAducanumabś plasma half-life was similar in wildtype and APP23 mice, suggesting that this antibody does not recognize a specific target in blood. This observation is consistent with cmAducanumab having a much higher affinity for Aβ assemblies than for monomeric forms of Aβ20.
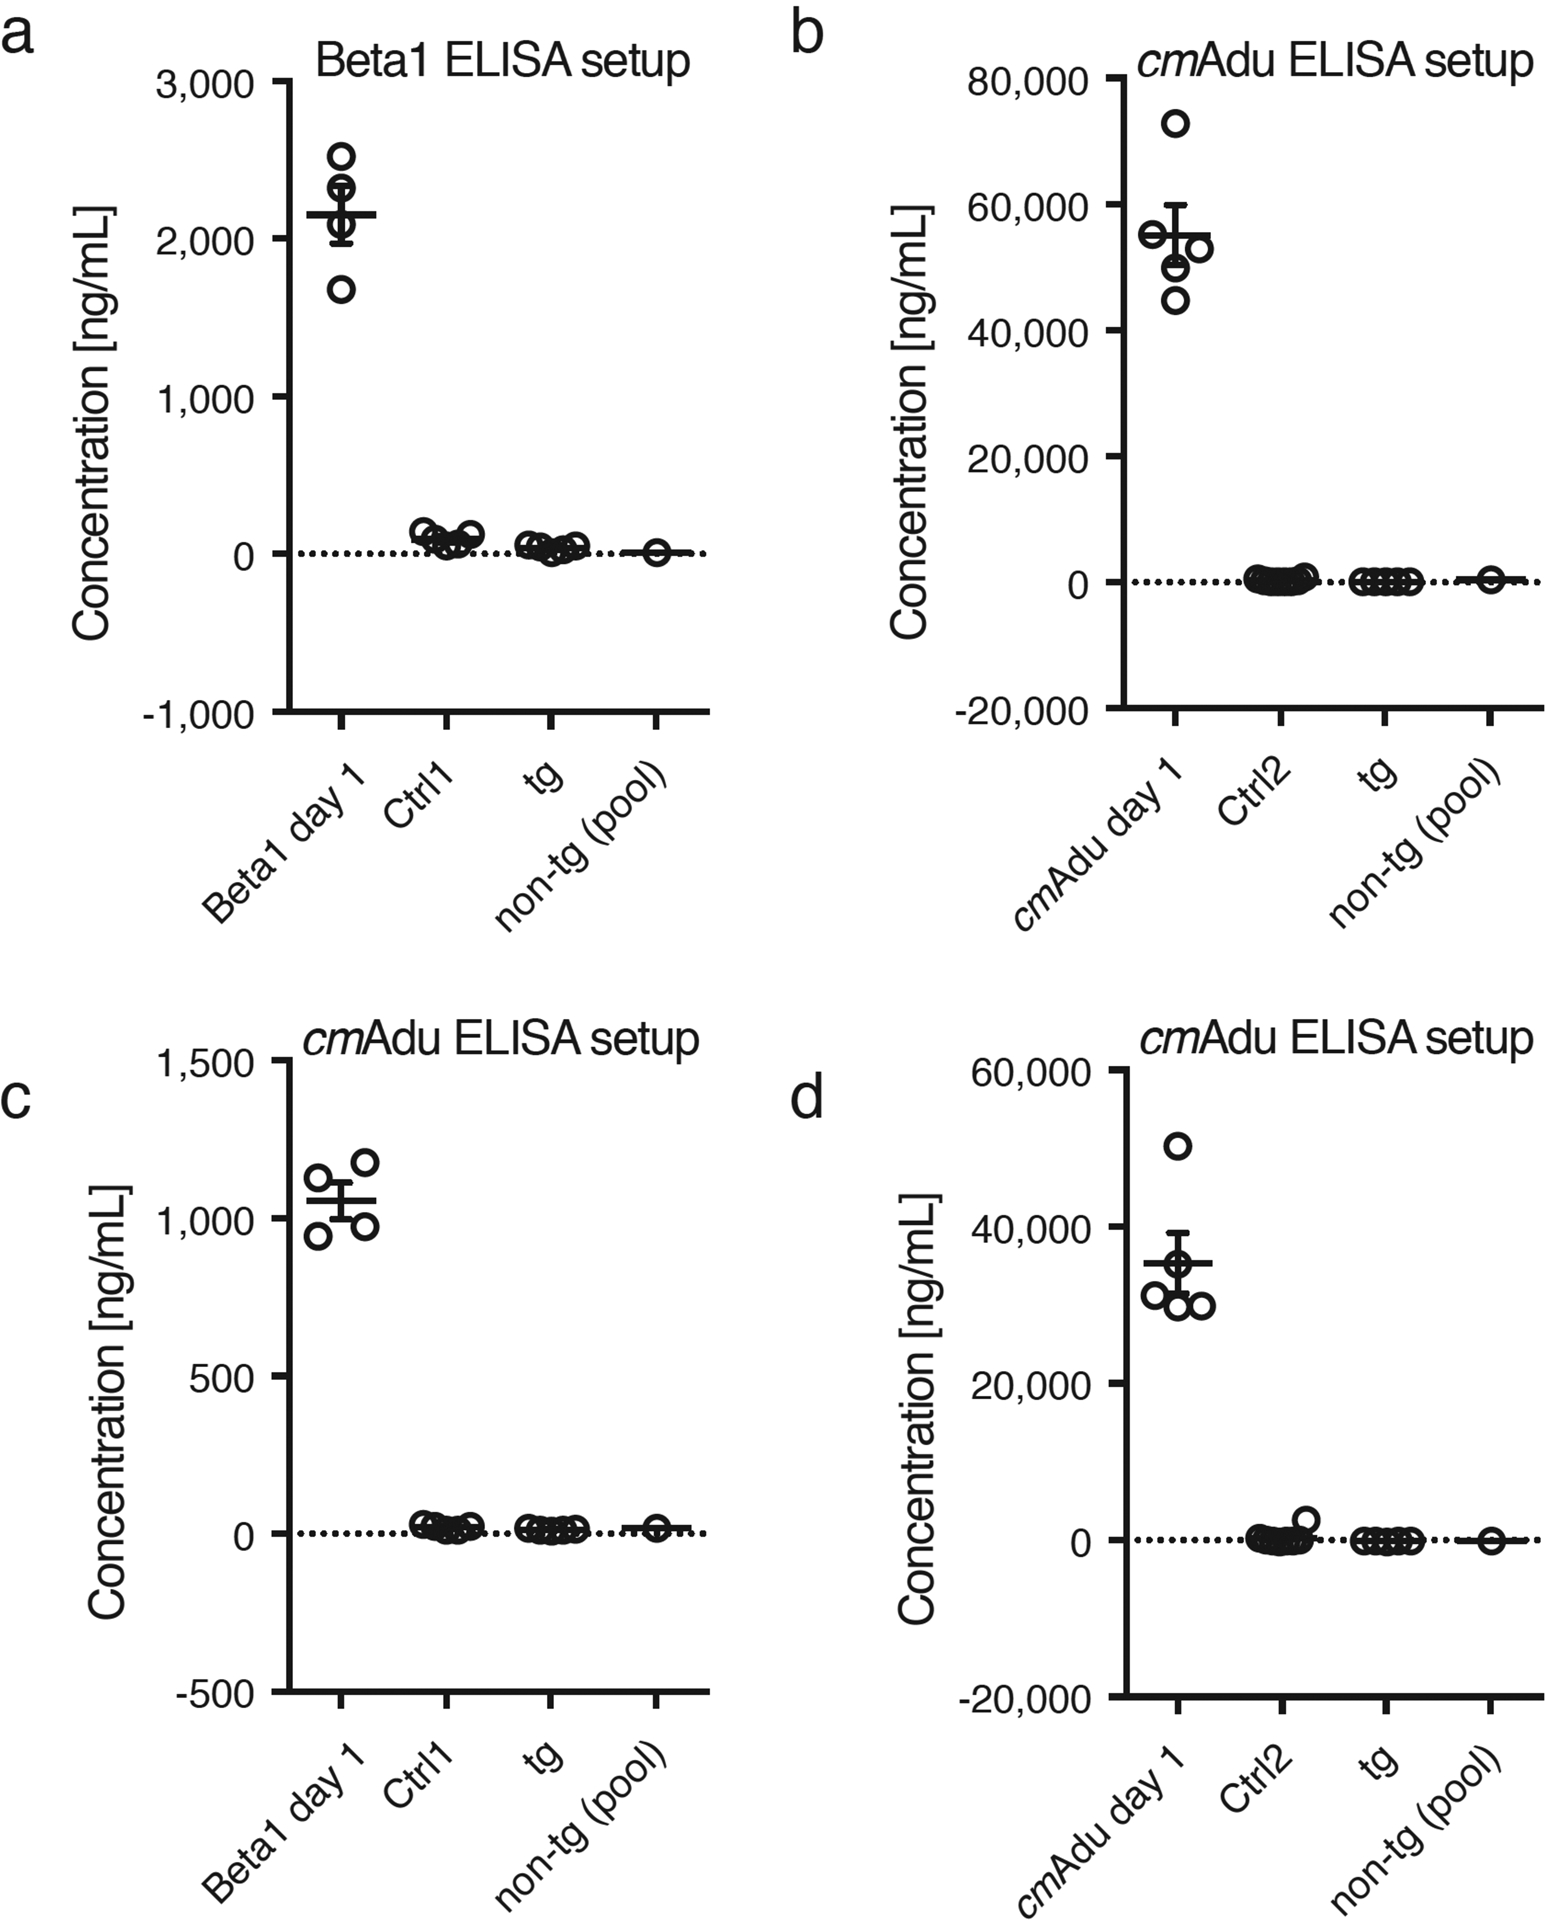
Figure 4. Pharmacokinetics and target engagement of antibodies at pre-amyloid stages.
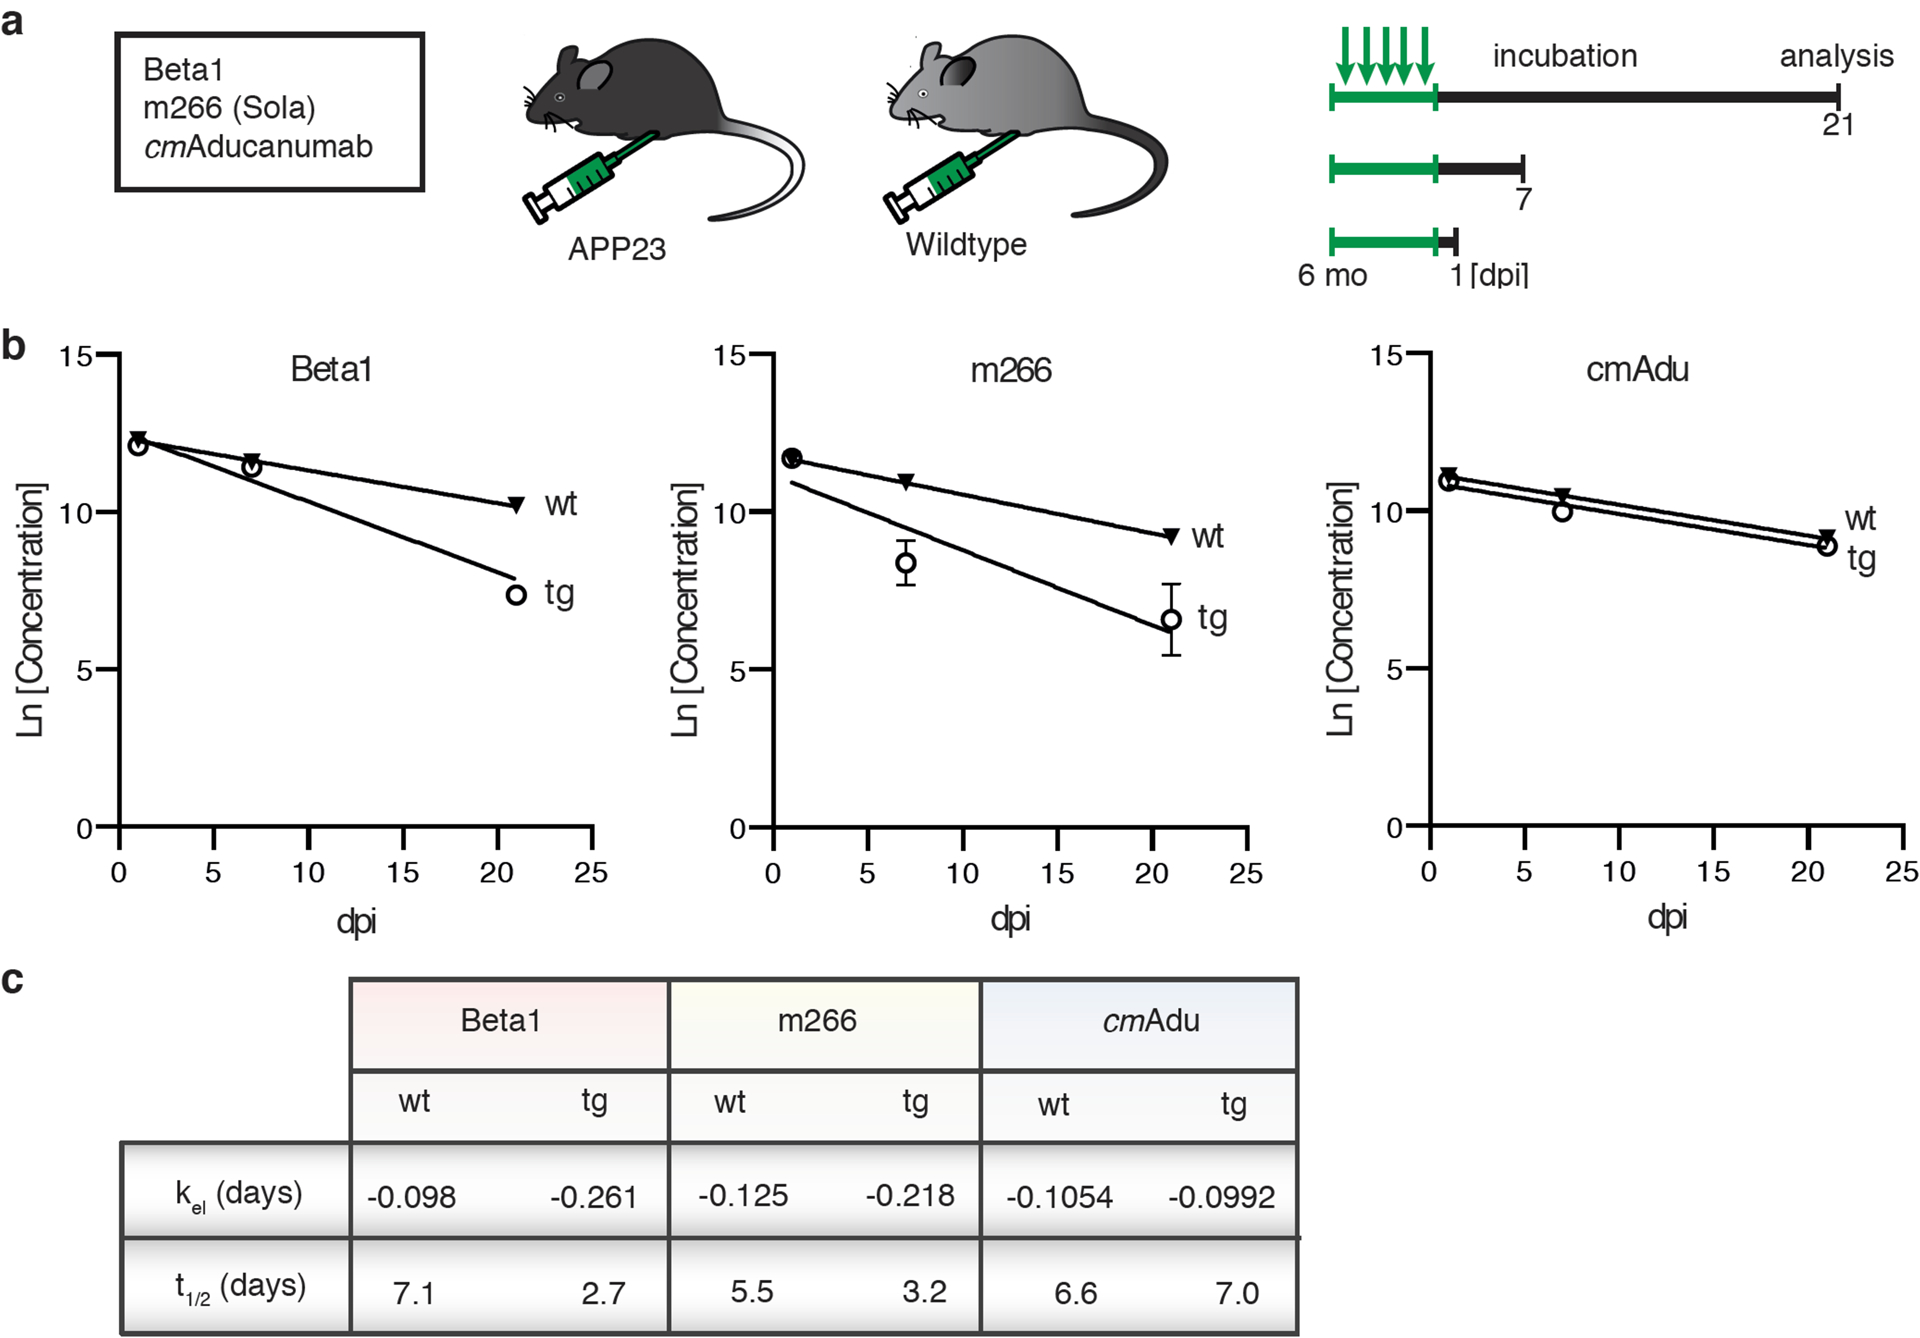
(a) Schematic overview of antibody titer measurements. Six-month-old male transgenic (tg) APP23 mice or 6-month-old male wildtype (wt) mice received intraperitoneally 0.5 mg of either Beta1, m266, or cmAducanumab (cmAdu) on 5 consecutive days (n=5/group/antibody). Mice were analyzed 1, 7, or 21 days post-immunization (dpi). (b) Plasma logarithmic changes (Ln) in antibody concentration over time (days) in APP23 and wild-type mice. For Beta1 in the tg group, there were 1 and 4 mice below detection at 7 and 21 dpi, respectively. (c) Calculated elimination rate (kel) and half-life (t1/2) of antibody elimination in plasma suggest binding of Beta1 and m266 to blood Aβ, thus accelerating removal from blood, whereas no such acceleration is seen for cmAdu. Antibody titer assays were optimized for best detection of different monoclonal antibodies (see Methods). To exclude the possibility that different assay conditions affected the results, Beta1 titers were also measured with the cmAdu setup; however, similar accelerated antibody elimination was observed in tg vs wt mice (Beta1: t1/2= 4.7 and 1.8, respectively). All data are represented as group means ± SEMs. No detectable titers of Aβ antibodies were found in untreated six-month-old or Ctrl-antibody-treated APP23 mice (see extended Data Fig. 4).
Acute inactivation of pre-amyloid Aβ seeds leads to long-lasting prevention of Aβ deposition and downstream pathogenic changes
We then tested the hypothesis that acute targeting of Aβ seeds at a pre-amyloid stage (i.e., during the lag phase of amyloid aggregation) is effective for prevention of cerebral β-amyloidosis and associated pathologic changes. We again treated 6-month-old male APP23 mice with cmAducanumab, m266 or Beta1 at 0.5 mg/mouse/day i.p. for 5 consecutive days. However, in this experiment, the animals were aged for another 6 months and analyzed at 12 months of age (Fig. 5a, b).
Figure 5. Targeting pre-amyloid Aβ seeds leads to long-lasting reduction of cerebral β-amyloidosis.
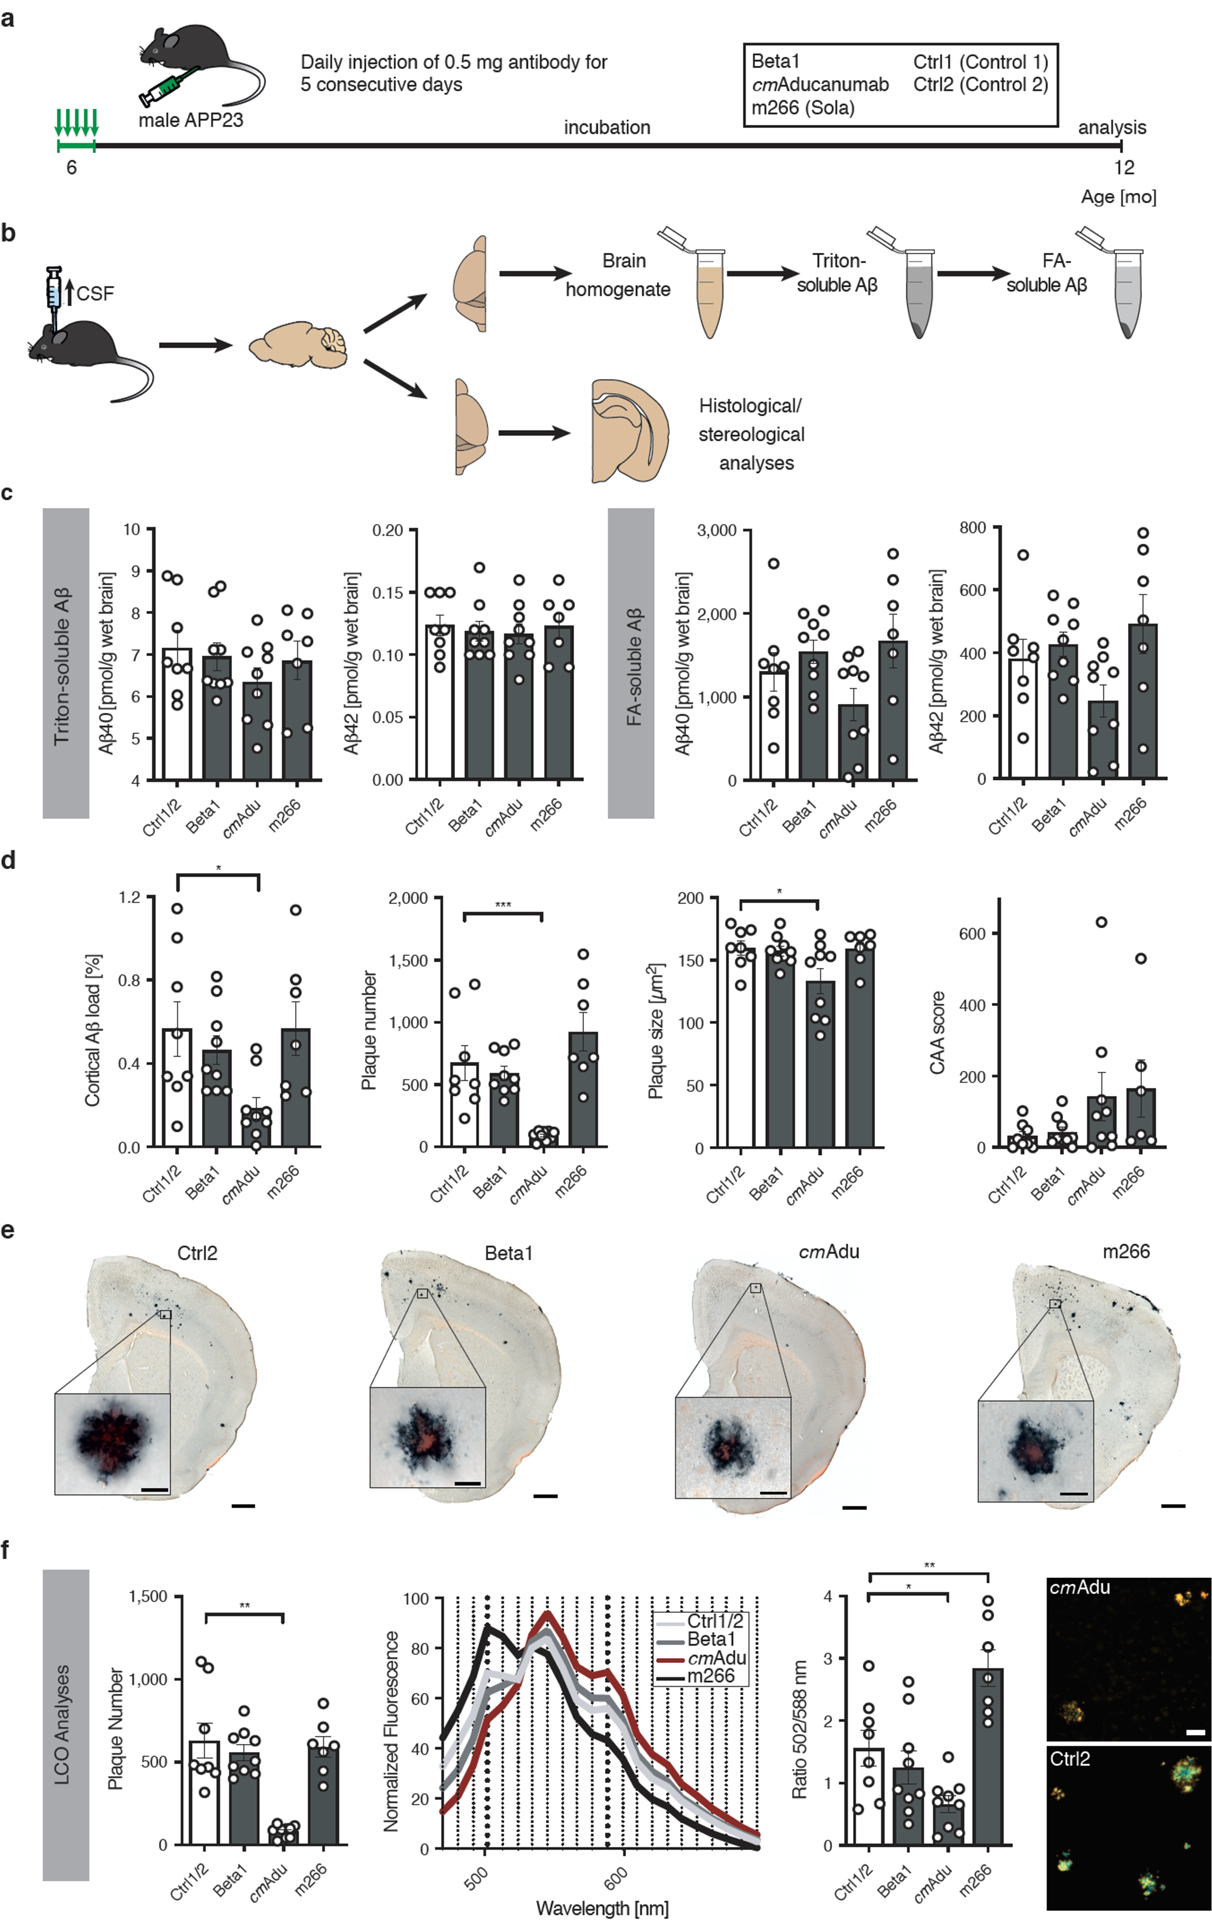
(a) Schematic overview of long-term incubation after acute early seed removal. Six-month-old male APP23 mice received i.p. injections of either 0.5 mg Beta1, cmAducanumab (cmAdu), m266, or Ctrl antibody on 5 consecutive days. Mice were sacrificed and analyzed at 12 months of age. (b) Schematic overview of tissue processing. CSF was taken prior to perfusion and collection of tissue. The fresh-frozen left hemisphere was homogenized for biochemical analyses. Brain homogenates were extracted by Triton and subsequently with formic acid (FA). The paraformaldehyde-fixed right hemisphere was used for immunohistochemical analyses. (c) Measurement of the Triton-soluble Aβx-40 and Aβx-42 did not indicate any differences among the groups (Kruskal-Wallis-Test; Aβx-40, H(3)=1.718; P=0.6329; Aβx-42, H(3)=0.4967; P=0.9196). In contrast, FA-soluble Aβx-40 and Aβx-42 appeared to be reduced in cmAdu-treated mice although the reduction did not reach statistical significance (one-way ANOVA: Aβx-40, F(3,29)=2.360, P=0.0920; Aβx-42, F(3,29)=3.0170, P=0.0459, subsequent post hoc Dunnettś multiple comparisons test did not indicate a difference between the combined Ctrl1/2 and any treatment group). All groups initially had n=10 mice (each of the two controls n=5). During the 6 month-incubation period, one animal in each group died while in the m266 group three animals died. The final numbers were n=4 [Ctrl1], 4 [Ctrl2], 9 [Beta1], 9 [cmAdu], 7 [m266]. (d) Stereological quantification of Aβ-immunostaining (CN6 antibody) in the cortex revealed that Aβ load was significantly lower in mice receiving early cmAdu treatment compared to controls (one-way ANOVA: F(3,29)=3.613; P=0.0248, post hoc Dunnettś multiple comparisons test: P=0.0223). An even larger reduction was found for plaque number (ANOVA: F(3,29)=12.35; P<0.0001; post hoc Dunnettś multiple comparisons test: P=0.0007). Plaque size was also reduced, but to a lesser extent (ANOVA: F(3,29)=3.6320; P=0.0247; post hoc Dunnettś multiple comparisons test: P=0.0268). The amount of CAA was not significantly different in antibody-treated mice, although two mice treated with cmAdu and three treated with m266 had relatively high CAA counts. (e) Immunostaining with the Aβ-specific CN6 antibody along with Congo Red. This staining was done for all the mice in panel c. Representative sections from a 12-month-old APP23 mouse are shown for each experimental group. Scale bars = 500 μm (inserts = 20μm). (f) Staining of amyloid with the combination of two (qFTAA and hFTAA) luminescent conjugated oligothiophenes (LCOs). The number of total LCO-positive cortical plaques was again lower in cmAdu-treated mice vs controls (Kruskal-Wallis-Test: H(3)=19,11; P=0.0003; Dunn’s multiple comparison P=0.0013). The mean fluorescence emission pattern of plaque cores is shown in the middle panel and the ratio at 502/588nm was quantified (right panel; ANOVA: F(3,29)=13.10; P<0.0001; post hoc Dunnettś multiple comparisons test Ctrl2 vs cmAdu: P=0.037; Ctrl vs m266: P=0.004). Note the red-shifted plaques for cmAdu vs. Ctrl2. While the spectral changes in the cmAdu-treated mice are consistent with less mature (i.e. younger) plaques21, the reason for the blue-shifted plaques after m266 treatment is not clear. Scale bar = 25 μm. All data are represented as group means ± SEMs; *P < 0.05; **P<0.01; ***P < 0.001.
Strikingly, while m266- and Beta1-treated animals did not differ in any measure relative to control antibody-treated mice, both FA-extracted Aβ and immunohistochemically-detected Aβ deposits were reduced (35% and 67%, respectively) in mice receiving a single, 5-day regimen of cmAducanumab 6 months earlier (Fig. 5c, d). Further quantitative histopathological analyses indicated that the treatment mainly reduced the number of Aβ plaques (86%), whereas the average size of plaques was only decreased by 17% (Fig. 5d, e). The deposition of Aβ in the vasculature (cerebral β-amyloid angiopathy, CAA) was not lowered by antibody treatment, and in some cmAducanumab- and m266-treated mice even appeared to have increased (Fig. 5d). However, no old or recent CAA-associated hemorrhages were detected in any of the groups using the Perls stain for iron or hematoxylin and eosin, respectively.
To study the molecular structure of the plaque amyloid, a combination of two amyloid-binding luminescent conjugated oligothiophenes (LCOs) was used (Fig. 5f). While a similar reduction of cortical plaque number was found with these amyloid dyes compared to immunohistochemical staining, amyloid in the cmAducanumab-treated mice had different fluorescence emission characteristics, suggestive of less mature plaques compared to those in the control-antibody treated mice (Fig. 5f)21. It is also possible that treatment with cmAducanumab removed only seeds with a certain conformation, leading to propagation of other species from a cloud of conformational variants.
Reduced cerebral β-amyloidosis 6 months after a single, 5-day treatment with cmAducanumab also was accompanied by marked reductions in amyloid-associated pTau-positive neuritic changes and microgliosis (Fig. 6). Measurement of neurofilament light chain in CSF, a biomarker of neurodegeneration in APP-transgenic mice22, revealed 603.7 ± 43.0 pg/ml for the cmAducanumab-treated mice compared to 741.4 ± 98.8 pg/ml for the control antibody-treated mice (means and SEMs; n=9 and 8, respectively), but this difference did not reach statistical significance.
Figure 6. Targeting pre-amyloid Aβ seeds reduces pTau-positive neuronal dystrophy and microglial activation.

The same animals as in Fig. 5 are presented, n=4 [Ctrl1], 4 [Ctrl2], 9 [Beta1], 9 [cmAdu], 7 [m266]. (a) All Congo red-positive plaques (red) were surrounded by pTau (AT8)-positive dystrophic neurites (punctate black staining). Shown is the cortex of a Ctrl2- and a cmAdu-treated mouse. Scale bar = 100 μm. (b) The area of the pTau-positive staining over the area of the plaque within 10μm (blue line), 20μm (red line), and 50μm (black line) from the outer edge of the congophilic plaque was quantified. No difference between the treatment groups was found, suggesting similar neurotoxicity of plaques among the treatment groups. (c) In contrast, a substantial reduction of the total cortical pTau-positive neuritic dystrophy was found in cmAdu- compared to Ctrl1/2-treated mice, consistent with the reduced plaque-load of the cmAdu-treated mice. Shown is the area of AT8-positive boutons per plaque area (here shown within the 10μm-wide space adjacent to the core) multiplied by the total number of cortical Congo red-positive plaques (Kruskal-Wallis-Test: H(3)=16.90, P=0.0007, post hoc Dunn’s multiple comparison test, P=0.0061). (d) Iba-1-immunostained microglia around congophilic plaques in the cortex of a Ctrl2- and cmAdu-treated mouse (left panels) and the categorized and colored microglia based on size (red: area <50μm2 [resting]; yellow: 50μm2 ≤ area < 80μm2 [resting-intermediate]; green: 80μm2 ≤ area < 120μm2 [activated]; blue: area ≥ 120μm2 [activated, plaque-associated]) (right panels). Blue microglia are hypertrophic and activated and largely intimately associated with the plaques, whereas green microglia mainly appeared in the more distant vicinity of plaques. Scale bar=100 μm. Schematic drawing of microglia was created with BioRender.com. (e) Quantification of the microglia categorized by size. A significant reduction of the activated, plaque-associated microglia (blue) in cmAdu- vs Ctrl1/2-treated mice was found (ANOVA: F(3,29)=5.982, P=0.0026, post hoc Dunnett’s multiple comparison test, P=0.0245), and a trend toward reduction was observed for the more peripheral activated microglia (green) P=0.0529). (f) Individual microglia around congophilic plaques were identified via Pu.1-nuclear staining. Scale bar=25 μm. The number of microglia per plaque area was not significantly changed (ANOVA: F(3,29)=1.524, P=0.2291), whereas (g) the total number of cortical plaque-associated (and thus activated) microglia after cmAdu-treatment was reduced. Shown is the microglial number per plaque area multiplied by the total number of cortical Congo red-positive plaques (ANOVA: F(3,29)=7.516; P=0.0007; post hoc Dunnettś multiple comparisons test: P=0.0049). All data are represented as group means ± SEMs; *P < 0.05; **P<0.01.
DISCUSSION
The present study in a mouse model of cerebral Aβ deposition demonstrates the presence of therapeutically targetable Aβ seeds before β-amyloid formation is detectable by current biochemical, histological, or imaging techniques. The finding that acutely targeting such early Aβ seeds for only 5 days leads to a significant reduction of Aβ deposition and associated pathologies 6 months later suggests that the formation of Aβ seeds at this time already strongly influences the extent of cerebral β-amyloidosis much later in life. It also suggests that the formation and/or amplification of such early, pre-amyloid seeds is a slow process, and that it takes considerable time to re-generate such seeds after removal, even in APP transgenic mice that overproduce Aβ.
We hypothesize that two aspects are important to explain our observations in this very early phase of amyloid formation. First, nucleation and thus formation of seeds is the major structural transition that Aβ undergoes at this pre-amyloid stage. Elongation, i.e., the assembly of monomeric Aβ onto existing seeds, does not yet contribute substantially to the overall pool of aberrant Aβ at this stage. Nucleation, however, is a very rare event, and only a minor fraction of monomeric Aβ undergoes this transition. The resulting Aβ seeds are stable aggregates, most likely of several monomers23,24.
Second, antibodies reaching the brain from the periphery are not in excess over the antigen. Antibodies recognizing all Aβ species primarily target the abundant monomeric Aβ, of which only a very small fraction would have formed a seed (because nucleation is a rare event). In contrast, antibodies that mainly recognize Aβ seeds will be less distracted by monomers, allowing them to more effectively neutralize stable nuclei. The formation of new seeds will then take some time, thereby delaying amyloid formation and its sequelae. This hypothesis is consistent with our finding that amyloid formation and associated pathologies are impeded in the cmAducanumab-treated mice.
The structure and biochemical nature of pathogenic pre-amyloid seeds remain largely unknown because of their low concentration and the inherent difficulty in isolating them in their native state. A variety of different seeding-active Aβ assemblies from brain have been characterized (e.g.25,26; extended Data Fig. 2), but all of these seeding-active Aβ assemblies have been isolated from end-stage AD or transgenic mouse brains. Whether Aβ seeds differ in the early and late stages of disease is uncertain, but our findings suggest that they might. For example, Beta1 has been shown to greatly inactivate Aβ seeds derived from end-stage APP23 mouse brains14, while the same antibody in the present study was ineffective at inactivating early-stage seeds.
Multiple lines of evidence indicate that the composition and conformation of Aβ differ between Aβ deposits in early vs late stages of AD18,21,27. Pyroglutamate-modified Aβ (AβN3pE), which is recognized by antibody mE8, forms highly active seeds28, but it occurs predominantly at later stages of cerebral β-amyloidosis16–18. This might explain why mE8 did not inhibit early seeds in the present study despite showing an ARPA profile almost identical to cmAducanumab in end-stage AD and transgenic mouse brains.
Differences in the concentration of pathogenic Aβ seeds compared to (monomeric) Aβ species that are relatively benign might also have important implications for the efficacy of antibodies in a brain environment with high concentrations of monomeric Aβ. ARPA and plasma pharmacokinetics revealed cmAducanumab to be highly selective for Aβ aggregates over Aβ monomers even at pre-amyloid stages. Using synthetic Aβ, aducanumab has been reported to have a >10,000-fold selectivity for Aβ aggregates over monomeric Aβ20,29. Whereas cmAducanumab and mE8 recognize almost exclusively larger Aβ assemblies, all other antibodies tested in the present study also recognize monomeric Aβ, which may explain why they failed to impede Aβ seeds in the present study (although we only tested the IgG1 version of cmGantenerumab, whose effector function is reduced in mice30,31). The reasons that Beta1 inactivates exogenously applied seeds efficiently (e.g.14), but was ineffective against endogenous seeds, could then also be explained by a much higher ratio of seeds to monomeric Aβ in the infusion paradigm. Another possibility is that the infused seeds end up in a brain compartment that is accessible to antibodies, whereas endogenous seeds may be intracellular, and therefore are relatively inaccessible32. For future screening and identification of therapeutic agents targeting pre-amyloid seeds, ARPA appears to be a suitable method, with cmAducanumab as the lead antibody identified thus far.
Of potential concern for the translation of the present results into clinical applications is the finding that cmAducanumab did not reduce CAA. The same was reported when amyloid-bearing APP-transgenic mice were passively immunized with cmAducanumab, i.e. a reduction of plaques but not CAA was found29. The failure to clear Aβ from the vasculature after immunization (or even the observation that immunization increases CAA) in amyloid-laden murine or human brains has been thought to be caused by a shift of antibody-bound Aβ from plaques in the parenchyma to the vessel wall33–35. The present results suggest that this translocation of Aβ might also remain active in mice acutely treated with antibodies at an early and pre-amyloid stage. It is also possible that the Aβ seeds that induce CAA are structurally different from parenchymal seeds36, and therefore are not recognized by cmAducanumab. The latter possibility will require a refinement of ARPA as a screening tool for reagents that inactivate early seeds.
While the efficacy of the early removal of Aβ seeds in humans has not been established, this study supports the concept that acute removal of seeds in the lag phase of cerebral β-amyloidogenesis delays the pathogenic cascade of amyloid formation and its toxic downstream effects37,38. More work on the in vivo dynamics and turnover of pre-amyloid seeds is necessary39, in particular in the human brain where the first amyloid deposits are reported to emerge as early as 30 to 50 years of age40,41. Thus, the preclinical phase of AD - defined as when Aβ deposition is present with no clinical symptoms42 - may in fact be a later manifestation of a much earlier pathogenic process of seed propagation that currently escapes detection in vivo. By reducing the concentration of highly bioactive Aβ seeds at critical early time points during this pre-amyloid phase, it might be possible to forestall the Aβ-cascade and the onset of AD indefinitely. Given growing evidence that seeding of specific proteins underlies several chronic neurodegenerative and systemic diseases32,43, it is likely that these disorders also can be delayed by the inactivation of proteopathic seeds in the lag-phase of protein deposition.
ONLINE METHODS
Experimental Animals
Heterozygous C57BL/6J-TgN(Thy1.2-hAPP751-KM670/671NL)23 (APP23) and C57BL/6 JNpa-Tg(Thy1App)23/1Sdz (APP23N) mice were bred at the Hertie Institute for Clinical Brain Research (Tübingen, Germany). APP23 mice were used for the short-term and long-term immunization studies. APP23N mice were used for titer experiments and as hosts for the in vivo seeding assay. No difference in phenotype of the two APP23 strains has been noted, and thus they are abbreviated in the text as APP23 mice. The mice overexpress the human APP transgene harboring the Swedish double mutation under the neuron-specific Thy1 promoter element48. APP23 mice develop Aβ deposition at 6–12 months of age depending on the brain region studied, and male mice exhibit deposition later than females11,46,48. Only male animals were used for antibody treatment to minimize variability and to expand the length of the pre-depositing phase during which nascent seeds could be analyzed. Mice were kept under specific pathogen-free conditions. No statistical methods were used to pre-determine sample sizes but our sample sizes are similar to those reported in previous publications (e.g.11,33). The experimental procedures were carried out in accordance with the veterinary office regulations of Baden-Württemberg (Germany) and approved by the local Animal Care and Use Committee.
Human brain tissue
Tissue samples were obtained from the mid-frontal gyrus of 6 clinically and pathologically diagnosed AD cases (54 to 81years of age; all Braak stage VI). The samples were obtained from the Emory University Goizueta Alzheimer’s Disease Research Center (ADRC). Human post mortem tissues were acquired under proper Institutional Review Board (IRB) protocols with consent from families.
Aβ antibodies
The following antibodies were recombinantly generated, all based on publicly available sequence information: Chimeric murinized (cm) version of the human antibody Gantenerumab (cmGantenerumab,49; chimeric murinized (cm) version of the human antibody Aducanumab (cmAducanumab,20,29; m266 which is the murine parent version of Solanezumab50; mC2 which is the murine parent version of Crenezumab51; and mE8, which is the murine parent version of Donanemab31, www.alzforum.org/therapeutics/donanemab). For all antibodies (except cmGantenerumab), the variable heavy-chain and light-chain domain were fused with the IgG2a constant heavy-chain and mouse kappa constant light-chain domains29,30. For cmGantenerumab, the IgG1 constant heavy-chain was used. In brief, synthetic genes for the variable light chain-murine kappa constant domain and variable heavy chain-mIgG constant domain were sub-cloned into expression vectors for mammalian cell expression. Transfected cells were cultured until the viability had dropped and culture media harvested by centrifugation and ultrafiltration. Antibodies were purified from clarified culture media either by protein-A or protein-G Sepharose affinity chromatography followed by buffer exchange into PBS (Invitrogen, Carlsbad, CA) using standard protocols for monoclonal antibody purification. Finally, antibodies were sterile-filtered using 0.2-μm filters and stored at −80°C. cmGantenerumab, m266, and mC2 were provided by Lundbeck (Copenhagen, Denmark), cmAducanumab was provided by Biogen (Cambridge, MA), and mE8 was provided by the Fraunhofer Institute for Cell Therapy (Dresden, Germany). Since these recombinant antibodies have been generated in different laboratories, minor differences in the expression cassettes cannot be excluded. Mouse monoclonal antibody Beta1 (IgG2a) has been described previously14,52. As control antibodies, monoclonal murine anti-wheat auxin IgG2a (Amsbio, Abingdon, UK) and murine IgG2a antibody P1.17 (unknown antigen29 as control 1 (Ctrl 1) and control 2 (Ctrl 2), respectively, were used.
Intraperitoneal application of antibodies
Aliquoted antibodies were thawed on ice and injected intraperitoneally (0.5 mg/mouse/day) for 5 consecutive days. Mice were sacrificed either 6 weeks (short term) or 6 months (long term) after the first injection. For the antibody titer experiments, mice were sacrificed 1, 7 or 21 days after the last injection. Mice were randomly assigned to the treatment groups for all experiments except the short-term experiment with mE8. mE8-treated mice and murine anti-wheat auxin IgG2a-treated mice were run in a separate batch.
Collection of brain and CSF
Mice were anesthetized with a mixture of 10% ketamine (115 mg/kg body weight) and 5% xylazine (10 mg/kg body weight) in NaCl. CSF was collected as previously described22,53. In brief, the cisterna magna was accessed by puncture of the dura mater with a syringe (30G, 0.3mm × 8mm needle size), and CSF was collected with a 20 μl GELoader tip (Eppendorf Vertrieb, Wesseling-Berzdorf, Germany). CSF was centrifuged at 2,000 × g for 10 minutes and frozen at −80°C. Following collection, the mouse was perfused transcardially with ice-cold PBS. The brain was removed and bisected by a mid-line sagittal cut, and the lower brainstem and cerebellum were removed by a cut through the rostral midbrain. The left forebrain was frozen on dry ice and stored at −80°C for later biochemical analyses. The right forebrain was fixed in 4% paraformaldehyde in PBS at 4°C for 48h, cryoprotected in 30% sucrose in PBS, and snap-frozen in 2-methyl-butane.
Biochemical analysis of Aβ
Brain tissue was homogenized at 10% (w/v) in sterile PBS with the Precellys®24 high-throughput tissue homogenizer (Bertin Technologies, Montigny-le-Bretonneux, France; 7 ml lysing tubes with 2.8 mm ceramic beads) at 5,500 rpm twice for 10 seconds with a 10 second break in between. Homogenates were aliquoted and stored at −80°C until biochemical analysis. Aβ was serially extracted. First, 130 μl of homogenate was thawed on ice and mixed with 130 μl 2% Triton X-100 in PBS. Samples were incubated on ice for 15 minutes and vortexed every 5 minutes, followed by ultracentrifugation at 100,000 × g at 4°C for 15 minutes. The supernatant was collected and aliquoted for later analysis (“Triton-soluble fraction”). The pellet was mixed with cold 70% (v/v) formic acid (FA; Sigma-Aldrich; minimum purity of 96% diluted in H2O; volume according to aspirated supernatant) and sonicated on ice for 35 seconds. Samples were centrifuged at 25,000 × g at 4°C for 1 hour and supernatants were neutralized (1:20) with neutralization buffer (1 M Tris base, 0.5 M Na2HPO4, 0.05% NaN3 (w/v)). This latter fraction was termed the “FA-soluble fraction”. Aβ was measured by an electrochemiluminescence (ECL)-linked immunoassay (Meso Scale Discovery, MSD, Gaithersburg, MD) as previously described11. First, FA-soluble brain extracts from the long-term study were diluted 1:10 in buffer (Diluent 35, Meso Scale Discovery) to enable Aβ measurement within the linear range of the assay. The commercially available V-PLEX Aβ Peptide Panel 1 (4G8) Kit was used according to the manufacturer’s instructions. In brief, pre-coated 96-well plates were blocked for 1 hour with buffer (Diluent 35, Meso Scale Discovery) and washed three times with 0.05% Tween-20 (Carl Roth, Karlsruhe, Germany) in PBS (v/v). Triton- and FA-soluble brain extracts were incubated with the SULFO-TAG™-labeled 4G8 detection antibody for 2 hours at room temperature. After washing, MSD Read Buffer T was added. The plate was immediately read on the Sector Imager 6000. Data analysis was performed using the MSD DISCOVERY WORKBENCH software 2.0. Internal reference samples were measured as controls on every plate.
Brain homogenates from the 2- to 8-month-old untreated APP23 mice (Fig. 1, panel a) were directly diluted 1:3.2 in FA (minimum 96% purity), sonicated and neutralized as described above, and then measured with the Simoa™ platform (Quanterix, Billerica, MA). To this end, the samples were diluted as follows: Aβ40: 1:16 and Aβ42: 1:4 in Simoa Aβ40 and Aβ42 sample diluent, respectively (Quanterix, Billerica, MA). Aβ was then measured using the Simoa Human Aβ40 1.0 and Simoa Human Aβ42 1.0 immunoassay kits (Quanterix, Billerica, MA) according to manufacturer’s instructions.
Intracerebral injections of brain extract
Bilateral stereotaxic injections of 2.5 μl brain homogenate (10% (w/v) in sterile PBS, see biochemical analysis above) from mice treated with Ctrl2- or cmAdu-antibody were performed. Homogenates from all Ctrl2 or cmAdu mice were pooled and mixed before injection, respectively. The mice were anaesthetized with a mixture of ketamine (110 mg/kg body weight) and xylazine (20 mg/kg body weight) in saline. Brain homogenates were injected into the hippocampus using a Hamilton syringe (anteroposterior,−2.5 mm; left/right,±2.0 mm; dorsoventral,−1.8 mm) at a rate of 1.25 μl/minute. The needle was held in the injection site for an additional two minutes before being slowly withdrawn. The surgical site was cleaned with sterile PBS, the incision was closed, and the mice were constantly monitored until recovery from anesthesia.
Histology and immunohistochemistry
Fixed hemibrains were sectioned coronally into 25-μm-thick slices using a freezing-sliding microtome (SM2000 R, Leica Biosystems, Wetzlar, Germany), and sections were collected in 12-well plates containing cryoprotectant solution (35% ethylene glycol and 25% glycerol in PBS). Tissue sections were stained free-floating with a polyclonal antibody directed against Aβ (CN6; a successor to antibody CN346). Microglial staining was undertaken either with a rabbit polyclonal anti-Pu.1 antibody (1:1,000, Cell Signaling, Danvers, MA) or a rabbit polyclonal anti-Iba1 antibody (1:500; Wako Chemicals, Neuss, Germany). Mouse monoclonal antibody AT8 (Thermo Fisher Scientific, Waltham, MA), recognizing tau phosphorylated at Ser-202 and Thr-205, was used to stain pTau-positive neuritic changes48. For all immunostainings, the Vectastain Elite ABC kit (Vector Laboratories, Burlingame, CA) was used as previously described46. Sections were then mounted on slides and co-stained with Congo Red according to standard protocols. To study bleedings, the Perls Prussian Blue method was used to visualize ferric iron in hemosiderin, and hematoxylin and eosin (H&E) was used as previously described54. For LCO staining, sections were first mounted on slides and double-stained with qFTAA and hFTAA (2.4 μM qFTAA and 0.77 μM hFTAA in PBS) for 30 min at room temperature in the dark55.
Quantitative and spectral amyloid and plaque analysis
Aβ load was quantified on every 12th and 36th serial, systematically sampled and CN6/Congo Red-stained coronal section through the hippocampus and neocortex, respectively. This typically resulted in 5–7 for the hippocampus and 4–5 sections for the neocortex. Stereological analysis was performed blinded using a microscope with a motorized x-y-z stage coupled to a video-microscopy system (Stereo Investigator; MBF Bioscience, Williston, VT) as previously described14. Aβ load was determined by calculation of area (%) covered by Aβ-positive staining in two-dimensional sectors at a single focal plane (20x/0.45 Zeiss Achroplan).
To quantify the number and size of individual Aβ plaques, CN6/Congo Red double-stained sections were scanned on a Zeiss AxioScan.Z1 slide scanner (10x/0.45 Plan-Apochromat, Carl Zeiss Microscopy GmbH, Goӧttingen, Germany) at a digital resolution of 0.442μm/pixel. Within each image field, z-stacks were acquired, flattened to a single plane using a wavelet-based extended depth-of-field algorithm. A custom-written plugin for Fiji (version 2.0.0-rc-69/1.52p) automatically scaled down images to a resolution of 1.326μm/pixel for Aβ plaque visualization and segmentation. The neocortex was manually outlined, and for this analysis, every 12th section throughout the neocortex was used. Images were transformed to grayscale using the luminance function of Fiji. Objects with an area of less than 50μm2 were excluded in order to avoid over-segmentation.
The number of Aβ plaques positive for qFTAA and/or hFTAA was quantified on a set of every 12th qFTAA/hFTAA double-stained coronal section. Analysis was performed on every third section of this set (thus actually on every 36th section) using a Zeiss AxioFluor microscope, and plaque number was assessed manually by blinded observers.
To analyze the structure of the deposited amyloid, the same set of every 12th qFTAA/hFTAA double-stained coronal section was used. Spectral analysis was performed on a Zeiss LSM 510 META confocal microscope using an argon 458-nm laser for excitation and a spectral detector (Carl Zeiss MicroImaging GmbH) acquiring continuous emission spectra from 470 to 695 nm. For identification of Aβ-amyloid cores, a 40x oil-immersion objective (1.3 N.A.; Zeiss) was used. qFTAA/hFTAA-positive plaques were randomly chosen, and within each plaque core three regions of interest were measured55. Cerebral amyloid angiopathy was excluded from the analysis. A total of 20 plaques were analyzed in each mouse. For data analysis, the emission spectra were normalized to their respective maxima. After calculation of the mean spectral signature for each plaque, the values for each individual mouse were averaged. The ratio of emission intensity at the qFTAA blue-shifted peak (502 nm) and hFTAA red-shifted peak (588 nm) was calculated55.
CAA frequency and severity were manually assessed in the neocortex by blinded observers using every 12th CN6/Congo Red-stained section. The CAA score was calculated by multiplying CAA frequency by CAA severity, as previously described54,56.
Quantitative analysis of microglia and neuronal dystrophy
Whole-slide images of tissue sections stained with AT8/Congo Red and Iba1/Congo Red, respectively, were acquired using a Zeiss AxioScan.Z1 slide scanner, and pre-processed using a custom-written Fiji plugin (version 2.0.0-rc-69/1.52p) as described above in the “Quantitative and spectral amyloid and plaque analysis” section.
To quantify pTau-positive (AT8-immunostained) neuronal dystrophy (punctate plaque-associated neuritic structures), the neocortex in every 12th AT8/Congo Red-stained section was manually outlined. The fully automated script written in Fiji required no user input. Initially, the RGB image was transformed to the CIELAB Color Space to detect the plaques. The resulting positive values of the CIELAB channel a* indicate the purity of the red color, and were used to detect the Congo Red-stained plaques using a fixed lower threshold of 5. Vascular amyloid, as well as impurities and occasional random-stained structures appearing bright orange-red, have additional color impurities that are detected as positive values in the CIELAB channel a*, but also as positive values in the CIELAB channel b*, whereas Congo Red-positive plaques lack positive values in the CIELAB channel b*. We therefore created a mask image of lower threshold 3 of channel b*, and have performed a Boolean operation “a* AND NOT b*” to detect structures that only have a pure a* channel component, resulting in a mask image of Congo Red-stained structures that solely included the plaques. The area around the detected plaques was expanded to quantify the pTau-positive signal at 10μm, 20μm and 50μm from the outer edge of the plaque core. The pTau-positive signal was also picked up using the red channel of the RGB color space, processed as described for the microglial quantification for simple thresholding.
To quantify microglial activation states, the neocortex in every 12th Iba1/Congo Red-stained section was again manually outlined. The images were further automatically processed using a script written in Fiji to identify the microglia in the selected cortex, using only the red channel of the RGB image, to exclude any Congo Red signal. The image histogram was normalized to the full grayscale range and the background was removed using a rolling ball background subtraction filter of 100px size. This method ensured an even contrast of the darkly stained microglia, which were then detected and measured using a simple fixed threshold. Objects smaller than 10μm2 were excluded from the analysis to avoid over-segmentation. Microglia were automatically categorized in four groups based on cell size: resting (colorized red; area <50μm2), resting-intermediate (colorized yellow; 50μm2 ≤ area < 80μm2), activated (colorized green; 80μm2 ≤ area < 120μm2) and activated, plaque-associated (colorized blue; area ≥ 120μm2). The category values were assigned empirically and used to visualize the overall microglial distribution in the cortex.
For the quantification of Aβ plaque-associated microglia, Pu.1-immunopositive cells around Congo Red-positive plaques were counted on every 12th section through the neocortex. On each section, ten plaques (if less than ten plaques were found, the maximal number present was taken) were randomly determined and the microglia (nuclei) in the immediate vicinity (i.e. two-times the plaque diameter) of each plaque were counted. The diameter and area of each Congo Red-positive plaque were determined with the Stereo Investigator software. Then the number of microglia per μm2 plaque was assessed. The number of total plaque-associated microglia was calculated as the average number of microglia associated with plaques multiplied by the total plaque number, as described above.
Antibody Recognition Profiling of Aβ assemblies (ARPA)
Aβ assemblies in 10% PBS brain homogenates were semi-natively separated by size using agarose electrophoresis57. To this end, 2% low-melting agarose (w/v) (Thermo Fisher Scientific) in semi-denaturing buffer (200 mM glycine and 25 mM Tris base) was heated until dissolved. Sodium dodecyl sulfate (SDS) was added (final concentration of 0.1% (v/v)). The liquid agarose was poured into a gel cassette (Thermo Fisher Scientific) and a 10-well comb was placed in the gel. The polymerized gel was placed in a Bolt Mini Gel Tank (Thermo Fisher Scientific) and the chamber was filled with semi-denaturing buffer containing 0.1% SDS (v/v). Total protein concentration was determined by a BCA assay (Thermo Fisher Scientific). 65 μg of brain homogenate was mixed with sample buffer (20 mM Tris-acetate (w/v), 0.5 mM EDTA (v/v), 2% SDS (v/v), 0.025% bromophenol blue (v/v), 5% glycerol (v/v)) and incubated for 7 minutes at room temperature. Sample and SeeBlue Plus2 pre-stained protein standard (Thermo Fisher Scientific) were loaded. Gel electrophoresis proceeded until the phosphorylase marker band migrated 4 cm within the gel.
After protein separation, the agarose protein lane was fractionated into pieces of 0.7 cm × 0.5 cm for the comb fraction (F1), and 0.7 cm × 1 cm for all other fractions (F2 to F7) as illustrated in Fig. 2 and extended Data Fig. 1. Each agarose piece was placed in a 1.5 ml tube (Protein LoBind, Eppendorf AG) and used either for enzymatic liquefaction or for melting. For enzymatic digestion, elution buffer (50 mM Bis-Tris, 1 mM EDTA, pH 6.8) was added to gel fragments to a final concentration of 0.5% agarose (w/v). Samples were heated to 65°C for 10 minutes while shaking at 1,200 rpm. Liquefied samples were cooled to 43°C for 15 minutes. 0.5 U Agarase from Pseudomonas atlantica (Sigma-Aldrich) per 100 μl sample was added and incubated at 43°C for one hour while shaking at 1,200 rpm. Samples were snap-frozen on dry ice and stored at −80°C until further use for immunoprecipitation (below). Agarose pieces for melting were mixed with sample buffer (62.5 mM Tris-HCl pH 6.8; 8.3% glycerol (v/v), 2% SDS (v/v), 100 mM dithiothreitol (DTT), 0.025% bromophenol blue (w/v)) and heated to 90°C for 10 minutes. Melted fractions were analysed by denaturing immunoblot analysis as described below.
Immunoprecipitation (IP) using Protein G Dynabeads™ (Thermo Fisher Scientific) was performed directly on PBS brain homogenates and on enzymatically digested agarose pieces (see above). Antibody bead conjugation was carried out according to the manufacturer’s protocol. Aβ fractions (F1 to F7) were subjected to anti-Aβ antibody-conjugated Protein G Dynabeads™ (Thermo Fisher Scientific) and incubated overnight at 4°C while mixing. As the input for IP, 75 times more fractionated brain homogenate was used for the young, predepositing brain homogenates compared to the β-amyloid-laden brain homogenates. Sample:bead ratios of 1:1 (amyloid-laden transgenic brain) to 5.25:1 (predepositing transgenic mice and AD brain tissue) were used. Beads were washed twice with PBS-T (0.05% Tween20 (v/v)) before elution with 1x NuPAGE LDS Sample Buffer (Thermo Fisher Scientific) containing 150 mM DTT at 70°C for 10 minutes. The supernatant was transferred to a new 1.5 ml tube (Protein LoBind, Eppendorf AG), snap-frozen on dry ice and stored at −80°C until denaturing immunoblot analysis on NuPAGE 4–12% Bis-Tris Protein Gels (Thermo Fisher Scientific) using 1x MES SDS Running Buffer (Thermo Fisher Scientific). Samples were blotted onto a nitrocellulose membrane (semi-dry; Bio-Rad Laboratories, Hercules, CA) that was equilibrated in glycine transfer buffer (192 mM glycine, 25 mM Tris base, 20% methanol (v/v)). The membrane was boiled in PBS for 5 minutes at 90°C and blocked in 5% milk in PBS-T (w/v) for one hour at room temperature. The membrane was probed with anti-Aβ 6E10 antibody (1:2500; BioLegend, San Diego, CA) overnight at 4°C. The secondary HRP-coupled goat anti-mouse antibody (1:30,000; Jackson ImmunoResearch, Cambridgeshire, UK) was subsequently applied for one hour at room temperature. Between the antibody incubation steps, the membrane was washed 5 times for 5 minutes with PBS-T. Densitometric values from the Western Blot were obtained from highly sensitive X-ray films (Amersham Hyperfilm ECL, GE Healthcare, Chicago, IL) or a chemiluminescence imager (XSTELLA1.00; Raytest Isotopenmessgeräte GmbH, Straubenhardt, Germany) using SuperSignal West Dura Extended Duration Substrate (Thermo Fisher Scientific). Images from XSTELLA were further processed with the AIDA image analyzer v.4.27 (Raytest Isotopenmessgeräte GmbH). The amount of Aβ from a fraction was normalized to the total amount of Aβ detected in the sample. The contrast of immunoblots was adjusted for illustration purposes only.
Pharmacokinetics of antibodies in blood
Plasma antibody concentration was determined by ELISA. Lyophilized synthetic Aβ1–40 and Aβ1–42 peptides in trifluoroacetate salt (Bachem, Bubendorf, Switzerland) were dissolved in dimethyl sulfoxide (DMSO) at a concentration of 4.33 and 4.51 μg/μL, respectively. Peptides were aliquoted, stored at −80°C and later diluted to the target concentration in coating buffer (50mM Sodium Carbonate; pH 9.6 with NaHCO3). Aβ1–40 was used for m266 while Aβ1–42 was used for Beta1. For cmAducanumab, Aβ1–42 was pre-aggregated before adding it to the coating buffer. For pre-aggregation, 100 μM Aβ1–42 was incubated with 10 mM HCl (Merck, Darmstadt, Germany) and 150 mM NaCl (VWR Chemicals, Radnor, PA) in a final volume of 100 μL at 37°C for 3 days, and subsequently stored at 4°C. 96-well plates (Thermo Fisher Scientific) were washed with PBS (Gibco, Thermo Fisher Scientific) and coated with 10 ng of synthetic Aβ species in coating buffer at 4°C on a shaker at 40 rpm overnight. After coating, plates were washed four times with 0.05% PBS-T (0.05% v/v Tween-20) and blocked with 1% BSA (Sigma-Aldrich) in PBS-T at room temperature on a shaker for two hours. Plates were washed with PBS-T and incubated with samples or standards diluted in PBS-T/0.1% BSA at 4°C on a shaker at 40 rpm overnight. Every plate contained triplicates of a standard curve and plasma samples (diluted 1:200 and 1:2000), along with pooled controls from untreated male wildtype and 6-month-old APP23 mice. The plates were washed with PBS-T and incubated with secondary antibody at room temperature on a shaker for two hours. For detection of m266 and Beta1, the alkaline phosphatase-conjugated AffiniPure rabbit anti-mouse IgG (H+L) antibody (1:5000; Jackson ImmunoResearch, Cambridgeshire, UK) was used. Afterwards, plates were washed with PBS-T. Plates were subsequently washed with detection buffer (10 mM DEA (Sigma-Aldrich), 0.5 mM MgCl2 (Merck, Darmstadt, Germany; pH 9.6) and incubated with color reaction solution (16.89 mM 4-nitrophenyl phosphate [pNPP] (Sigma-Aldrich) in detection buffer) in the dark at room temperature for 15 minutes. Absorption was measured at 405 nm in a Mithras LB940 system (Berthold Technologies, Bad Wildbad, Germany). For cmAducanumab, the peroxidase-conjugated AffiniPure goat anti-mouse IgG (H+L) antibody (1:2500; Jackson ImmunoResearch, Cambridgeshire, UK) was used for detection. Afterwards, plates were washed with PBS-T and incubated with TMB Substrate Solution (Thermo Fisher Scientific) for 2 minutes at room temperature followed by addition of stop solution (1M H2SO4; Merck). The absorbance was measured at 450 nm in a Mithras LB940 system. Absorbance values of standard curves were plotted versus the logarithmic concentration of the antibodies using the PRISM software (GraphPad; version 6). For Beta1, the curve was fitted to a 4PL symmetric model. For m266 and cmAducanumab, the curve was fitted to a 5PL asymmetric model. The standard curve was interpolated for the sample absorbance and the resulting concentrations were transformed back from the logarithmic concentration with a 10x function, to be subsequently corrected by dilution. The corrected concentrations were plotted versus time. The area under the curve was obtained through integration with the area under curve function at less than 10% distance from minimum and maximum y. The kel was obtained from the natural logarithm of concentration-versus-time graph through linear regression.
CSF NfL concentration
NfL concentrations in CSF were determined using the highly sensitive Simoa™ NF-Light Advantage assay Kit (Quanterix, Billerica, MA). Murine CSF samples were pre-diluted 1:100 in sample diluent and measured in duplicate on a Simoa HD-1 Analyzer (Quanterix, Billerica, MA) according to the manufacturer’s instructions, and as previously reported22,58.
Endpoint titration assay to estimate seeding dose (SD50)
Brain homogenates (10%) of three sporadic AD cases were pooled. Samples were centrifuged at 3000 × g for 5 min and supernatant was semi-natively separated by size as described for ARPA (note that 3000 × g centrifugation was performed because of subsequent in vivo inoculations). Liquified ARPA fractions were serially diluted up to 10−2 in sterile PBS. Each dilution (2.5μl) was bilaterally delivered to the hippocampus (AP −2.5mm, L +/− 2.0 mm, DV −1.8 mm) of 2- to 3-month-old male APP23 mice (n=3–7 per group)11. After 8 months of incubation, mice were sacrificed and brains serially cut into 25 μm-thick coronal sections. Sections were co-stained with anti-Aβ antibody CN6 and Congo Red (see histology and immunohistochemical above).
The seeding dose 50 (SD50) was assessed similar to our previously described protocol, albeit using longer incubation times11. In short, positive or negative induction of Aβ deposition was rated on the Aβ-immunostained sections throughout the hippocampus for each animal. Note that endogenous Aβ plaques in the hippocampus of male 10- to 11- month-old APP23 mice are rare, and they can be distinguished from induced Aβ deposition due to their typical induction pattern along the layers in the dentate gyrus (see extended Data Fig. 2). The number of animals that showed induced Aβ deposition at each dilution was determined by three independent and blinded raters, and their assessments were congruent. SD50 were calculated by counting positively seeded animals vs. total animals.
To use the fewest possible animals, the dilutions necessary to achieve a 0% attack rate were predicted a priori. Unfortunately, a 0% attack rate was not achieved in all fractions and a 0% attack rate was assumed for the next higher dilution, i.e. for F1 (10−3), F2 (10−3), F3 (10−2), F4 (10−2), and F7 (10−2)) (see extended Data Fig. 2c). Moreover, as the undiluted fractions F5 and F6 did not reach 50% attack rates, they were counted as seeding-negative and rated as 0 for SD50.
Calculation with logarithmic curve-fitting was then based on the numbers of positive vs total animals using Equation Log agonist vs. response with three parameters, as provided by GraphPad Prism™ version 5. The negative Log 10 dilution at which 50% of the animals showed plaques was then determined. Such a slope estimation bears some uncertainties and absolute numbers should be interpreted with caution.
To calculate the specific seeding activity per Aβ monomeric equivalent, SD50 was divided through the concentration of Aβ in each of the fractions11. Aβ concentration was measured with the Simoa platform (see biochemical analysis of Aβ above) and by densitometric values from Western Blot of melted ARPA fractions using the 6E10 antibody.
Statistical Analysis
All statistics were performed using the PRISM software (GraphPad; version 6; for the final sizing of the figures GraphPad version 8 was used) or Excel (Microsoft®; version 16). Data were tested for normality using the Shapiro Wilk Test. If the groups passed the normality test, one-way ANOVA was performed. If ANOVA revealed significant effects, post hoc Dunnett’s multiple comparison test was applied. If the groups did not pass the normality test, the non-parametric Kruskal-Wallis test was used for comparison. Further analyses were performed using the post hoc Dunn’s test. If only two groups were compared, the unpaired two-sided t-test was used to compare population means. The mean and standard error of the mean (SEM) are reported for each experimental group.
Data availability
The remaining data that support the findings of this study are available from the corresponding authors upon reasonable request.
Extended Data
Extended Data Figure 1. Semi-native agarose gel electrophoresis of synthetic Aβ.
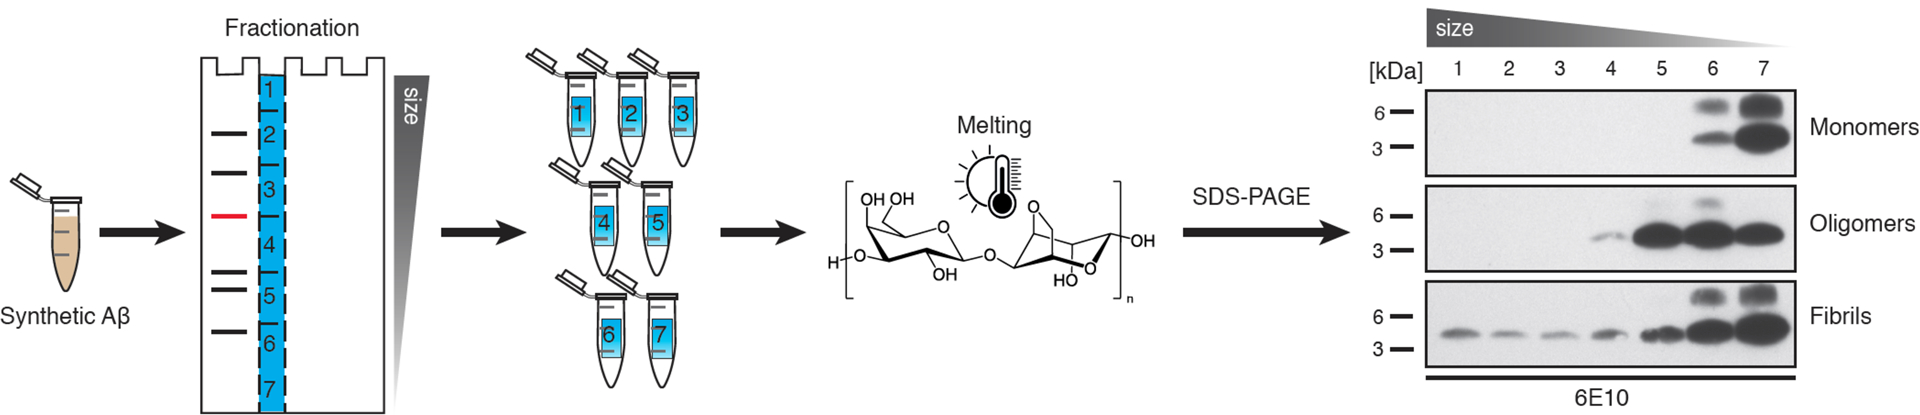
Semi-native agarose gel electrophoresis was performed using monomeric, oligomeric and fibrillar Aβ, in the same fashion as the first steps of the ARPA method, to determine Aβ distribution among fractions. Monomeric Aβ was prepared using Aβ1–40 (Bachem) in DMSO. The oligomeric preparation followed a protocol for Aβ-derived diffusible ligands59 using Aβ1–42, and fibrils were prepared by incubating 100μM Aβ1–42 at 37°C for 24 hours. Agarose lanes were cut as described in Fig. 2a and the Methods section; agarose gel pieces were melted followed by denaturing immunoblotting and then probed for Aβ with antibody 6E10. Chemiluminescent signal was captured with Amersham Hyperfilm ECL (in contrast to the chemiluminescent imager used for quantitative analysis in Fig. 2). See also Methods for details. Note that (presumed) monomeric Aβ runs in fractions 6 and 7, whereas oligomeric Aβ species are additionally seen in fractions 4 and 5, and Aβ fibrils are in fractions 1 to 3. This experiment was done independently twice with similar results.
Extended Data Figure 2. Aβ assemblies from AD brain, ARPA and seeding activity.
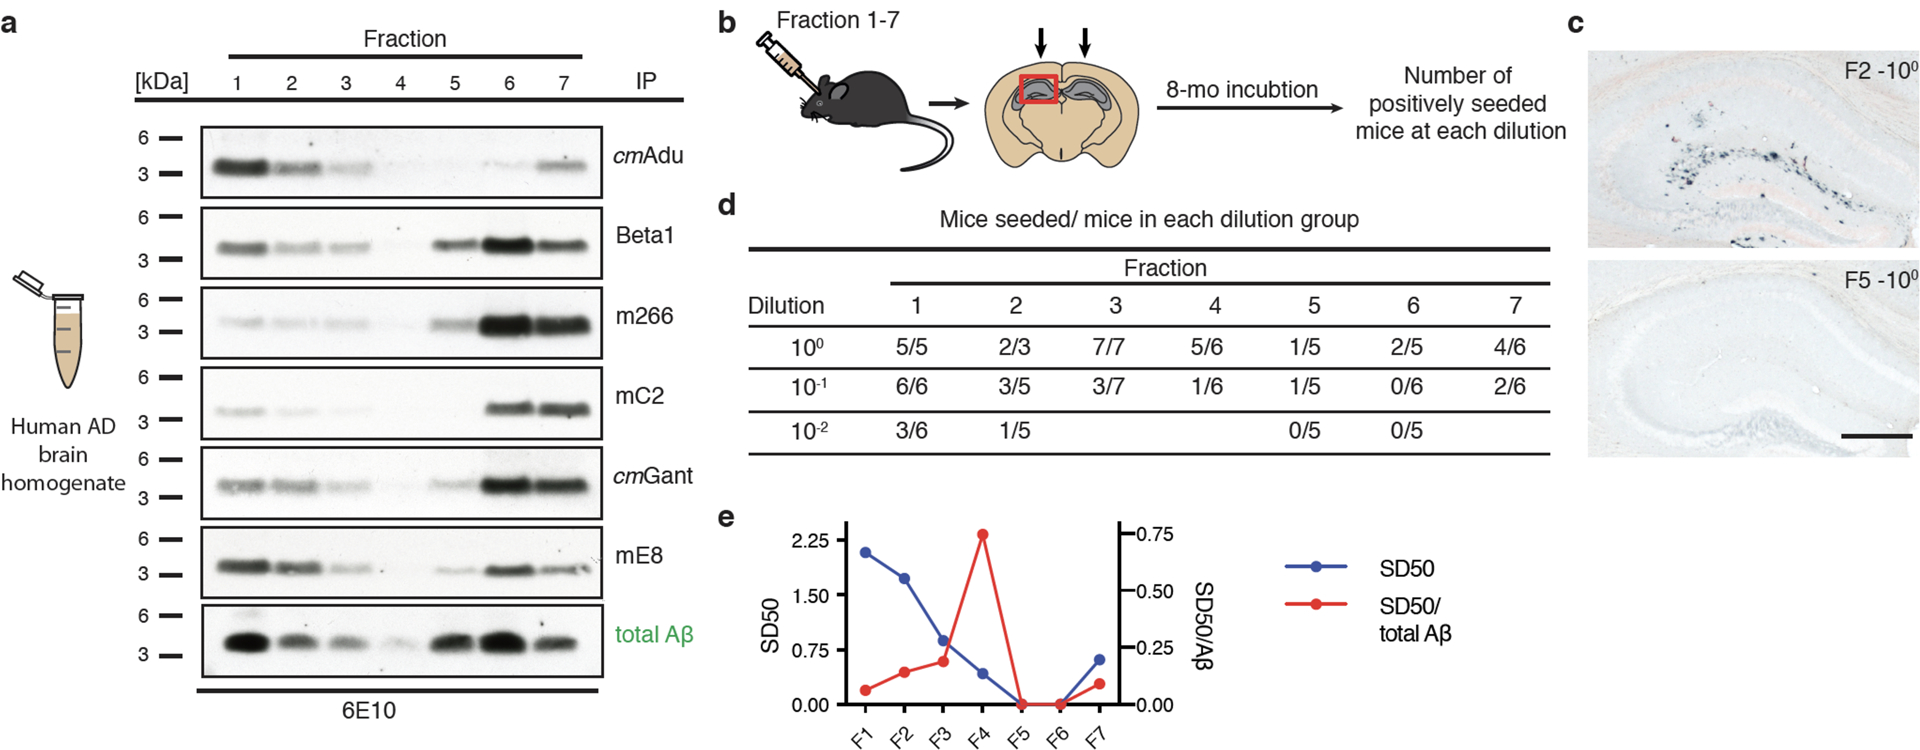
(a) PBS-homogenates from the frontal cortex of three AD subjects (Braak stage VI) were pooled to get a representative sample. ARPA (see Fig. 2 for a description) is shown for the various antibodies. Immunoblots were probed with Aβ-antibody 6E10. The experiment was repeated 3 times with similar results. (b) AD brain fractions (F)1–7 and their dilutions were injected into the hippocampus of young, pre-depositing 2- to 3-month-old male APP23 host mice. Brains were immunohistochemically analyzed for Aβ deposition 8 months later. (c) Results for F2 and F5 (both undiluted) is shown and reveal a high seeding activity for F2 and no seeding for F5. Scale bar: 500 μm. (d) Number of mice with induced Aβ deposition/total mice per group at each dilution from the various fractions (initially all groups had 6–7 mice, of which 4 treated with the undiluted F2 fraction died). (e) SD50 for the different fractions was defined as the negative log10 of the brain extract dilution at which 50% of the host mice showed induced Aβ deposition (see Methods). The specific seeding activity (SD50/total Aβ) for each fraction is shown and indicates a peak for F4.
Extended Data Figure 3. Semiquantitative comparison of signals obtained by ARPA in young, predepositing APP23 mice.
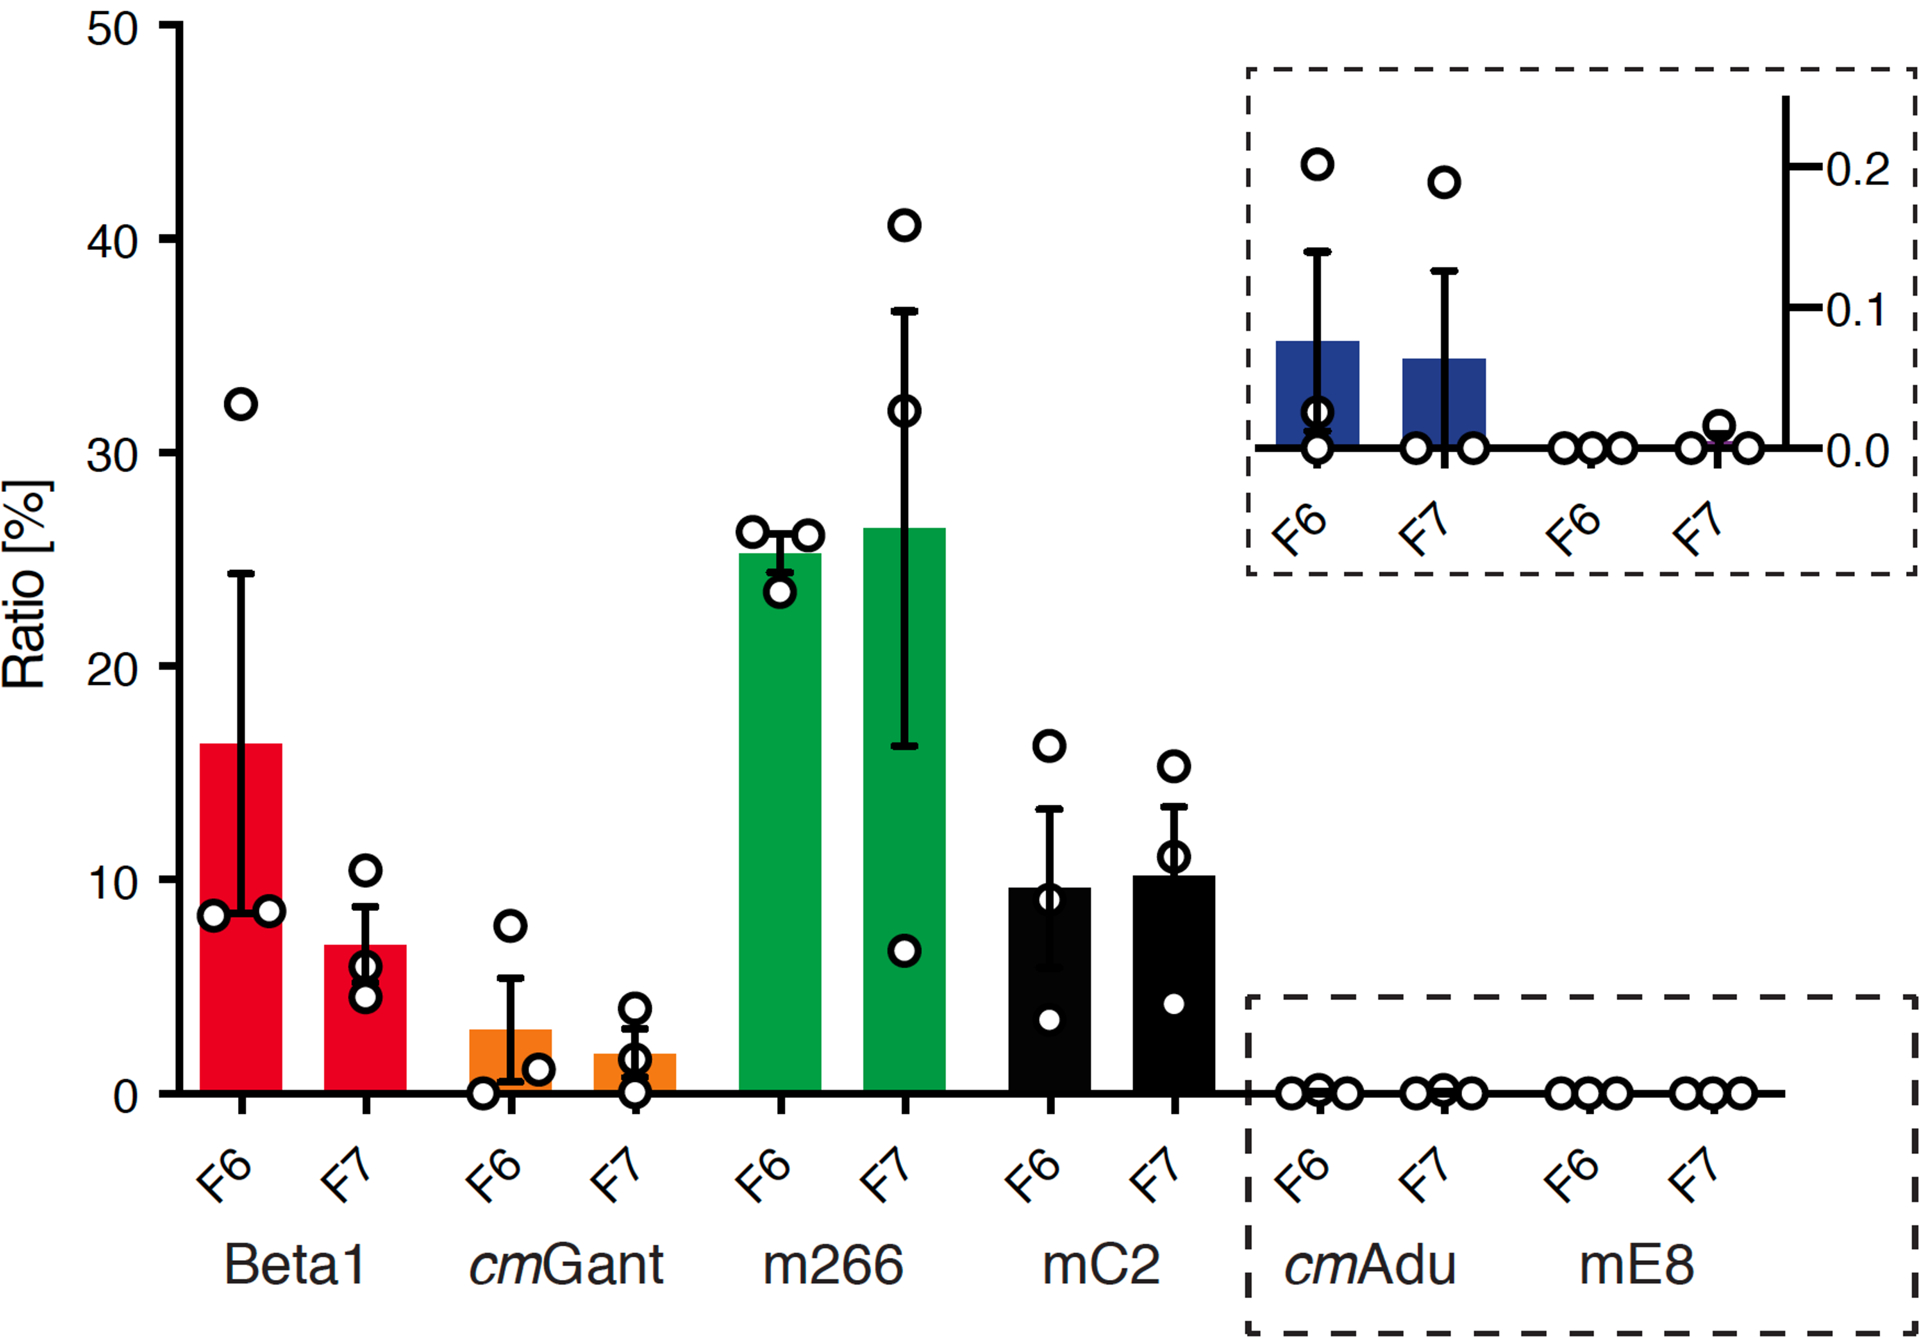
ARPA was performed in PBS homogenates from young, 6-month-old male APP23 brains as presented in Fig. 2d. For semiquantitative analysis, densitometric values of fractions (F) 6 and 7 obtained from the chemiluminescence imager were normalized to the time of exposure. The signal per second was calculated from the five longest exposure times or the five exposure times before signal saturation and the mean was taken. The obtained signal per second for Ctrl1/2 was considered as background, and therefore subtracted from the values calculated for all other antibodies, which were in total set equal to 100%. Relative values for each fraction were plotted. Beta1 and mC2 show similar signal-to-second values. The highest signal-per-second was obtained from m266, whereas the lowest signals were calculated for cmAdu and mE8 (see insert). All data are represented as means (n=3 experiments) ± SEMs. For details see Fig. 2d.
Extended Data Figure 4. Lack of detectable Aβ antibody titers in normal and Ctrl antibody-treated APP23 mice.
Plasma was taken for analysis from randomly selected 6-month-old male APP23 tg mice, either non-treated (tg, n=5) or treated for 5 consecutive days with Ctrl1 or Ctrl2 antibody and analyzed 6 weeks later (n=5/group; same mice as presented in Fig. 1). As a positive control, plasma from the Beta1- and cmAdu-injected mice one day after the injection were included (n=5 each) together with a pool of non-tg mice as a further negative control. Two different ELISA setups were used and performed on two consecutive days, one optimized to measure Beta1 titers (a) and another one optimized to measure cmAdu titers (b-d) (see Methods). Data are represented as group means ± SEMs. Results reveal that the injections of Ctrl antibodies into APP23 tg or non-tg mice did not induce Aβ antibody titers. Further, no detectable titers were found in untreated APP23 tg or non-tg mice.
Extended Data Table 1
| clinical antibody | murine antibody analog | IgG subclass | linear Aβ epitope | References |
|---|---|---|---|---|
| Aducanumab® | cmAducanumab | IgG2a | 3–7 | Sevigny et al., 2016, Arndt et al., 2018 |
| Solanezumab® | m266 | IgG2a | 16 – 26 | DeMattos et al., 2001 |
| Gantenerumab® | cmGantenerumab | IgG1 | 3–7; 18–27 | Bohrmann et al., 2012, |
| Crenezumab® | mC2 | IgG2a | 13–24 | Adolfsson et al., 2012 |
| Donanemab® | mE8 | IgG2a | pE3 | DeMattos et al., 2012 |
| Beta1 | IgG2a | 3–6 | Meyer-Luehmann et al., 2006 | |
| anti-wheat auxin; Control 1 | IgG2a | - | ||
| P1.17; unknown antigen; Control 2 | IgG2a | - | Sevigny et al., 2016, Arndt et al., 2018 |
ACKNOWLEDGMENTS
We would like to thank Giulia Salvadori, Marius Lambert, Lisa Häsler, Jörg Odenthal and all the other members of our departments for experimental help. This work was supported by the EC Joint Programme on Neurodegenerative Diseases under the Grants JPND-NewTargets and JPND-REfrAME (M.J.), from the EU/EFPIA/Innovative Medicines Initiative 2 Joint Undertaking (IMPRiND grant No 116060) (M.J.), the Alexander von Humboldt Foundation (L.C.W.) and National Institutes of Health grants P50 AG025688, ORIP/OD P51OD011132 (L.C.W.).
Footnotes
COMPETING FINANCIAL INTERESTS:
S.C., F.K., and J.B.S are current or former employees of Lundbeck; F.Q., P.H.W., and T.B. are current employees and/or shareholders of Biogen; J.-U.R and H.C. are former employees of Probiodrug AG; M.S. is a former employee of Novartis. The other authors have no competing interest.
REFERENCES
- 1.Jack CR et al. NIA-AA Research Framework: Toward a biological definition of Alzheimer’s disease. Alzheimer’s Dement. 14, 535–562 (2018). [DOI] [PMC free article] [PubMed] [Google Scholar]
- 2.Long JM & Holtzman DM Alzheimer Disease: An update on pathobiology and treatment strategies. Cell 179, 312–339 (2019). [DOI] [PMC free article] [PubMed] [Google Scholar]
- 3.Panza F, Lozupone M, Seripa D & Imbimbo BP Amyloid-β immunotherapy for Alzheimer disease: Is it now a long shot? Ann. Neurol 85, 303–315 (2019). [DOI] [PubMed] [Google Scholar]
- 4.McDade E et al. Longitudinal cognitive and biomarker changes in dominantly inherited Alzheimer disease. Neurology 91, 1295–1306 (2018). [DOI] [PMC free article] [PubMed] [Google Scholar]
- 5.Villemagne VL, Doré V, Burnham SC, Masters CL & Rowe CC Imaging tau and amyloid-β proteinopathies in Alzheimer disease and other conditions. Nat. Rev. Neurol 14, 225–236 (2018). [DOI] [PubMed] [Google Scholar]
- 6.McDade E & Bateman RJ Stop Alzheimer’s before it starts. Nature 547, 153–155 (2017). [DOI] [PubMed] [Google Scholar]
- 7.Palmqvist S, Mattsson N & Hansson O Cerebrospinal fluid analysis detects cerebral amyloid-β accumulation earlier than positron emission tomography. Brain 139, 1226–1236 (2016). [DOI] [PMC free article] [PubMed] [Google Scholar]
- 8.Thal DR et al. Estimation of amyloid distribution by [18F]flutemetamol PET predicts the neuropathological phase of amyloid β-protein deposition. Acta Neuropathol. 136, 557–567 (2018). [DOI] [PMC free article] [PubMed] [Google Scholar]
- 9.Landau SM, Horng A & Jagust WJ Memory decline accompanies subthreshold amyloid accumulation. Neurology 90, 1452–1460 (2018). [DOI] [PMC free article] [PubMed] [Google Scholar]
- 10.La Joie R et al. Multisite study of the relationships between antemortem [11C]PIB-PET centiloid values and postmortem measures of Alzheimer’s disease neuropathology. Alzheimer’s Dement. 15, 205–216 (2019). [DOI] [PMC free article] [PubMed] [Google Scholar]
- 11.Ye L et al. Aβ seeding potency peaks in the early stages of cerebral β‐amyloidosis. EMBO Rep. 18, 1536–1544 (2017). [DOI] [PMC free article] [PubMed] [Google Scholar]
- 12.Aoyagi A et al. Aβ and tau prion-like activities decline with longevity in the Alzheimer’s disease human brain. Sci. Transl. Med 11, 1–14 (2019). [DOI] [PMC free article] [PubMed] [Google Scholar]
- 13.Fuller JP, Stavenhagen JB & Teeling JL New roles for Fc receptors in neurodegeneration-The impact on immunotherapy for Alzheimer’s disease. Front. Neurosci 8, 1–10 (2014). [DOI] [PMC free article] [PubMed] [Google Scholar]
- 14.Meyer-Luehmann M et al. Exogenous induction of cerebral beta-amyloidogenesis is governed by agent and host. Science 313, 1781–1784 (2006). [DOI] [PubMed] [Google Scholar]
- 15.Eisele YS et al. Multiple factors contribute to the peripheral induction of cerebral-amyloidosis. J. Neurosci 34, 10264–10273 (2014). [DOI] [PMC free article] [PubMed] [Google Scholar]
- 16.Güntert A, Döbeli H & Bohrmann B High sensitivity analysis of amyloid-beta peptide composition in amyloid deposits from human and PS2APP mouse brain. Neuroscience 143, 461–475 (2006). [DOI] [PubMed] [Google Scholar]
- 17.Frost JL et al. Pyroglutamate-3 amyloid-β deposition in the brains of humans, non-human primates, canines, and Alzheimer disease-like transgenic mouse models. Am. J. Pathol 183, 369–381 (2013). [DOI] [PMC free article] [PubMed] [Google Scholar]
- 18.Rijal Upadhaya A et al. Biochemical stages of amyloid-β peptide aggregation and accumulation in the human brain and their association with symptomatic and pathologically preclinical Alzheimer’s disease. Brain 137, 887–903 (2014). [DOI] [PubMed] [Google Scholar]
- 19.Ye L et al. Persistence of Aβ seeds in APP null mouse brain. Nat. Neurosci 18, 1559–1561 (2015). [DOI] [PubMed] [Google Scholar]
- 20.Arndt JW et al. Structural and kinetic basis for the selectivity of aducanumab for aggregated forms of amyloid-β. Sci. Rep 8, 1–16 (2018). [DOI] [PMC free article] [PubMed] [Google Scholar]
- 21.Nyström S et al. Evidence for age-dependent in vivo conformational rearrangement within Aβ amyloid deposits. ACS Chem. Biol 8, 1128–1133 (2013). [DOI] [PubMed] [Google Scholar]
- 22.Bacioglu M et al. Neurofilament light chain in blood and CSF as marker of disease progression in mouse models and in neurodegenerative diseases. Neuron 91, 56–66 (2016). [DOI] [PubMed] [Google Scholar]
- 23.Jarrett JT & Lansbury PT Seeding ‘one-dimensional crystallization’ of amyloid: A pathogenic mechanism in Alzheimer’s disease and scrapie? Cell 73, 1055–1058 (1993). [DOI] [PubMed] [Google Scholar]
- 24.Eisenberg D & Jucker M The amyloid state of proteins in human diseases. Cell 148, 1188–203 (2012). [DOI] [PMC free article] [PubMed] [Google Scholar]
- 25.Langer F et al. Soluble Aβ seeds are potent inducers of cerebral β-amyloid deposition. J. Neurosci 31, 14488–14495 (2011). [DOI] [PMC free article] [PubMed] [Google Scholar]
- 26.Katzmarski N et al. Aβ oligomers trigger and accelerate Aβ seeding. Brain Pathol. 30, 36–45 (2019). [DOI] [PMC free article] [PubMed] [Google Scholar]
- 27.Michno W et al. Pyroglutamation of amyloid-βx-42 (Aβx-42) followed by Aβ1–40 deposition underlies plaque polymorphism in progressing Alzheimer’s disease pathology. J. Biol. Chem 294, 6719–6732 (2019). [DOI] [PMC free article] [PubMed] [Google Scholar]
- 28.Nussbaum JM et al. Prion-like behaviour and tau-dependent cytotoxicity of pyroglutamylated amyloid-β. Nature 485, 651–655 (2012). [DOI] [PMC free article] [PubMed] [Google Scholar]
- 29.Sevigny J et al. The antibody Aducanumab reduces Aβ plaques in Alzheimer’s disease. Nature 537, 50–56 (2016). [DOI] [PubMed] [Google Scholar]
- 30.Fuller JP et al. Comparing the efficacy and neuroinflammatory potential of three anti-Abeta antibodies. Acta Neuropathol. 130, 699–711 (2015). [DOI] [PMC free article] [PubMed] [Google Scholar]
- 31.DeMattos RB et al. A plaque-specific antibody clears existing β-amyloid plaques in Alzheimer’s disease mice. Neuron 76, 908–920 (2012). [DOI] [PubMed] [Google Scholar]
- 32.Jucker M & Walker LC Propagation and spread of pathogenic protein assemblies in neurodegenerative diseases. Nat. Neurosci 21, 1341–1349 (2018). [DOI] [PMC free article] [PubMed] [Google Scholar]
- 33.Pfeifer M et al. Cerebral hemorrhage after passive anti-Aβ immunotherapy. Science 298, 1379 (2002). [DOI] [PubMed] [Google Scholar]
- 34.Boche D et al. Consequence of Aβ immunization on the vasculature of human Alzheimer’s disease brain. Brain 131, 3299–3310 (2008). [DOI] [PubMed] [Google Scholar]
- 35.Sperling RA et al. Amyloid-related imaging abnormalities in amyloid-modifying therapeutic trials: recommendations from the Alzheimer’s Association Research Roundtable Workgroup. Alzheimer’s Dement. 7, 367–385 (2011). [DOI] [PMC free article] [PubMed] [Google Scholar]
- 36.Kollmer M et al. Cryo-EM structure and polymorphism of Aβ amyloid fibrils purified from Alzheimer’s brain tissue. Nat. Commun 10, 4760 (2019). [DOI] [PMC free article] [PubMed] [Google Scholar]
- 37.Karlnoski RA et al. Suppression of amyloid deposition leads to long-term reductions in Alzheimer’s pathologies in Tg2576 mice. J. Neurosci 29, 4964–4971 (2009). [DOI] [PMC free article] [PubMed] [Google Scholar]
- 38.Das P et al. Transient pharmacologic lowering of Aβ production prior to deposition results in sustained reduction of amyloid plaque pathology. Mol. Neurodegener 7, 39 (2012). [DOI] [PMC free article] [PubMed] [Google Scholar]
- 39.Arosio P, Knowles TPJ & Linse S On the lag phase in amyloid fibril formation. Phys. Chem. Chem. Phys 17, 7606–7618 (2015). [DOI] [PMC free article] [PubMed] [Google Scholar]
- 40.Braak H, Thal DR, Ghebremedhin E & Del Tredici K Stages of the pathologic process in Alzheimer disease: age categories from 1 to 100 years. J. Neuropathol. Exp. Neurol 70, 960–969 (2011). [DOI] [PubMed] [Google Scholar]
- 41.Pletnikova O et al. Alzheimer lesions in the autopsied brains of people 30 to 50 years of age. Cogn. Behav. Neurol 28, 144–152 (2015). [DOI] [PMC free article] [PubMed] [Google Scholar]
- 42.Sperling RA, Mormino E & Johnson K The evolution of preclinical Alzheimer’s disease: implications for prevention trials. Neuron 84, 608–622 (2014). [DOI] [PMC free article] [PubMed] [Google Scholar]
- 43.Westermark GT, Fändrich M, Lundmark K & Westermark P Noncerebral amyloidoses: aspects on seeding, cross-seeding, and transmission. Cold Spring Harb. Perspect. Med 8, a024323 (2018). [DOI] [PMC free article] [PubMed] [Google Scholar]
- 44.Maia LF et al. Changes in amyloid- and tau in the cerebrospinal fluid of transgenic mice overexpressing amyloid precursor protein. Sci. Transl. Med 5, 194re2 (2013). [DOI] [PubMed] [Google Scholar]
- 45.Maia LF et al. Increased CSF Aβ during the very early phase of cerebral Aβ deposition in mouse models. EMBO Mol. Med 7, 895–903 (2015). [DOI] [PMC free article] [PubMed] [Google Scholar]
- 46.Eisele YS et al. Peripherally applied Aβ-containing inoculates induce cerebral β-amyloidosis. Science 330, 980–982 (2010). [DOI] [PMC free article] [PubMed] [Google Scholar]
- 47.Maier FC et al. Longitudinal PET-MRI reveals β-amyloid deposition and rCBF dynamics and connects vascular amyloidosis to quantitative loss of perfusion. Nat. Med 20, 1485–1492 (2014). [DOI] [PubMed] [Google Scholar]
- 48.Stürchler-Pierrat C et al. Two amyloid precursor protein transgenic mouse models with Alzheimer disease-like pathology. Proc. Natl. Acad. Sci 94, 13287–13292 (1997). [DOI] [PMC free article] [PubMed] [Google Scholar]
- 49.Bohrmann B et al. Gantenerumab: A novel human anti-Aβ antibody demonstrates sustained cerebral amyloid-β binding and elicits cell-mediated removal of human amyloid-β. J. Alzheimer’s Dis 28, 49–69 (2012). [DOI] [PubMed] [Google Scholar]
- 50.DeMattos RB et al. Peripheral anti-Aβ antibody alters CNS and plasma Aβ clearance and decreases brain Aβ burden in a mouse model of Alzheimer’s disease. Proc. Natl. Acad. Sci. U. S. A 98, 8850–8855 (2001). [DOI] [PMC free article] [PubMed] [Google Scholar]
- 51.Adolfsson O et al. An effector-reduced anti-β-amyloid (Aβ) antibody with unique Aβ binding properties promotes neuroprotection and glial engulfment of Aβ. J. Neurosci 32, 9677–9689 (2012). [DOI] [PMC free article] [PubMed] [Google Scholar]
- 52.Paganetti PA, Lis M, Klafki H-W & Staufenbiel M Amyloid precursor protein truncated at any of the y-secretase sites is not cleaved to β-amyloid. J. Neurosci. Res 46, 283–293 (1996). [DOI] [PubMed] [Google Scholar]
- 53.DeMattos RB et al. Plaque-associated disruption of CSF and plasma amyloid-β (Aβ) equilibrium in a mouse model of Alzheimer’s disease. J. Neurochem 81, 229–236 (2002). [DOI] [PubMed] [Google Scholar]
- 54.Winkler DT et al. Spontaneous hemorrhagic stroke in a mouse model of cerebral amyloid angiopathy. J. Neurosci 21, 1619–1627 (2001). [DOI] [PMC free article] [PubMed] [Google Scholar]
- 55.Rasmussen J et al. Amyloid polymorphisms constitute distinct clouds of conformational variants in different etiological subtypes of Alzheimer’s disease. Proc. Natl. Acad. Sci. U. S. A 114, 13018–13023 (2017). [DOI] [PMC free article] [PubMed] [Google Scholar]
- 56.Schelle J et al. Early Aβ reduction prevents progression of cerebral amyloid angiopathy. Ann. Neurol 00, 1–11 (2019). [DOI] [PubMed] [Google Scholar]
- 57.Bagriantsev SN, Kushnirov VV & Liebman SW Analysis of amyloid aggregates using agarose gel electrophoresis. Methods Enzymol. 412, 33–48 (2006). [DOI] [PubMed] [Google Scholar]
- 58.Preische O et al. Serum neurofilament dynamics predicts neurodegeneration and clinical progression in presymptomatic Alzheimer’s disease. Nat. Med 25, 277–283 (2019). [DOI] [PMC free article] [PubMed] [Google Scholar]
- 59.Ryan DA, Narrow WC, Federoff HJ & Bowers WJ An improved method for generating consistent soluble amyloid-beta oligomer preparations for in vitro neurotoxicity studies. J. Neurosci. Methods 190, 171–179 (2010). [DOI] [PMC free article] [PubMed] [Google Scholar]
Associated Data
This section collects any data citations, data availability statements, or supplementary materials included in this article.
Data Availability Statement
The remaining data that support the findings of this study are available from the corresponding authors upon reasonable request.