

Abstract
The p140Cap adaptor protein, encoded by the SRCIN1 gene, negatively controls tumor progression, as demonstrated in the subgroup of HER2-amplified breast cancers and in neuroblastoma patients, where high p140Cap expression predicts a decreased probability of developing metastasis, with a significantly prolonged survival. In NeuT mice, a preclinical model or Her2-positive breast cancer, we previously reported that p140Cap counteracts Her2-dependent breast cancer progression, associating with the specific Rac1 Guanine Nucleotide Exchange Factor, Tiam1, and limiting the activation of both Tiam1 and Rac1. Here, we show that in TUBO breast cancer cells derived from the NeuT tumors, p140Cap expression causes Tiam1 redistribution along the apicobasal junctional axis. Furthermore, p140Cap and Tiam1 interact with E-cadherin, a member of the adherence junction, with a concomitant increase of E-cadherin at the cell membrane. We characterized biochemically the interaction between p140Cap and Tiam1, showing that the amino terminal region of p140Cap (1-287 amino acids) is sufficient to associate with full length Tiam1, and with the truncated catalytic domain of Tiam1, with a concomitant decrease of the Tiam1 activity. Moreover, in a large cohort of Her2 positive breast cancer, high levels of SRCIN1 expression positively correlates with increased survival in patients with high TIAM1 expression. Overall, our findings sustain a protective role of p140Cap in Her2 positive breast cancer, where p140Cap can associate with Tiam1 and negatively regulate the Tiam1/Rac1 axis.
Keywords: Breast cancer, Her2, p140Cap, Tiam1, Rac1, E-cadherin
Introduction
The p140Cap adaptor protein, also known as p130Cas-associated protein or SNIP (SNAP-25 interacting protein), encoded by the SRCIN1 gene, is highly expressed in brain, cerebellum and in some epithelial tissues [1,2], as well as in a subset of tumors [3-5]. p140Cap has been recently involved in counteracting tumor progression, impairing in vivo spontaneous metastasis formation in preclinical models of both breast and neuroblastoma tumors [4,5]. Moreover, p140Cap has been shown to be a target of several miRNAs in different cancers, including lung, pancreatic, gastric, ovarian and colorectal cancer as well as hepatocellular and cervical carcinoma. In these tumors, consistent with the data obtained in breast cancer and neuroblastoma, the miRNA-mediated down-regulation of p140Cap expression correlates with an increased tumor progression [6-17].
In human cohorts of breast cancer patients harboring the amplification of the HER2 oncogene, p140Cap expression correlates with an increased survival and a decreased disease recurrence [5]. Moreover, in neuroblastoma patients, SRCIN1 mRNA levels are an independent risk factor inversely correlated to disease aggressiveness, with SRCIN1 mRNA higher expression in less aggressive neuroblastoma stages, and in patients characterized by good prognosis [4]. p140Cap is composed by an N terminal tyrosine-rich region, an actin-binding domain, a proline-rich domain, a coil-coiled region, two domains rich in charged amino acids and a C terminal proline-rich domain. Previous studies reported several signaling molecules able to associate with p140Cap. In addition, our recent p140Cap interactome in Her2-positive (Her2+) breast cancer cells revealed 373 interacting proteins, including those with functions relevant to cell adhesion, protein homeostasis, regulation of cell cycle and apoptosis, which are frequently deregulated in cancer [18]. So far, most of these proteins have not yet been described as p140Cap interactors. However, we have recently identified the Rac1 Guanine nucleotide exchange factor T-cell lymphoma invasion and metastasis 1 (Tiam1) for its ability to associate with p140Cap specifically in Her2+ breast cancer cells [5].
Rac1 is a member of the Rho family GTPase which regulates a wide range of biological processes and it functions as a molecular switch cycling between an inactive GDP-bound and an active GTP-bound state. This process is tightly regulated by three types of proteins. Guanine nucleotide exchange factors (GEFs) catalyze the exchange of GDP for GTP, thereby activating the GTPase, whereas GTPase-activating proteins (GAPs) increase the intrinsic GTP hydrolysis rate of the GTPase, thereby inactivating it. Guanine nucleotide dissociation inhibitors (GDIs) sequester the GDP-bound form and maintain inactive GTPases in the cytoplasm [19]. The activation of Rho family GTPases is strictly dependent on their regulators leading to different downstream effects. Rac1 GTPase has been widely implicated in actin cytoskeleton reorganization, migration, mitogenesis, transformation, and metastasis [20,21]. In particular, Rac1 is an essential effector pathway for Her2-mediated breast cancer progression to metastasis [22,23]. Tiam1 is a large multidomain Dbl-family GEF protein that specifically activates Rac1. It belongs to the Dbl-family GEFs and contains either a catalytic Dbl-homology (DH) and a pleckstrin-homology (PH) domain. In addition to the catalytic domain, Tiam1 has an N-terminal PH domain (PHn), that mediates interaction with membranes enriched in phosphoinositides, a coiled-coil region with sequence (CC-ex), a Ras-binding domain (RBD) and, a PSD-95/DlgA/ZO-1 (PDZ) domain [24,25]. Tiam1 complex structure and function are tightly regulated through protein-protein interaction, post translational modification and auto-inhibition [24-26]. Tiam1 can either promote tumor progression or conversely can antagonize invasion in different cancer types [24,27,28]. Emerging evidence also supports a role for Rac1-GEFs in the development and progression of breast cancer, and a correlation between Tiam1 expression and high tumor grade has been established in human breast carcinomas [29]. Moreover, highly migratory and metastatic breast cancer cell lines such as the Triple negative MDA-MB-231 cells express high Tiam1 levels, and the opposite is true for less invasive models such as MCF-7 or SK-BR-3 cells [30]. In breast cancer preclinical models, Tiam1 deficiency reduces mammary tumor initiation and metastasis formation in NeuT transgenic mice [31]. Recently, in breast cancer patients, Tiam1 expression is strongly related to survival rates in early- and late-stage tumors, and survival rates are significantly higher in patients with low Tiam1 expression than those with high Tiam1 expression [32]. Consistent with the data from the preclinical NeuT model and the human cohorts, we have previously demonstrated both in primary cells derived from the NeuT mice, and in human HER2-amplified breast cancer cells that p140Cap expression causes a down-regulation of the activity of both Tiam1 and Rac1. As a consequence, p140Cap expressing cells display a reduced migratory capability, which, at least in part, is explained by the ability of p140Cap to associate in a molecular complex with Tiam1 [5].
In this study, we took advantage of the TUBO-NeuT cell line derived from a spontaneous breast tumor arisen in a female BALB/c-MMTV-NeuT mouse [33]. Since in these cells the p140Cap protein is not detectable, upon infection with empty or p140Cap retroviruses, we generated stable TUBO-NeuT cells, and TUBO-NeuT-p140 cell lines. We already showed that TUBO-NeuT-p140 breast cancer cells gave rise to smaller tumors, with a decreased ability of generating spontaneous metastasis, when injected in syngeneic Balb-c mice, compared to TUBO-NeuT cells [5]. Moreover, in TUBO-NeuT-p140 cells, we have also identified p140Cap as a partner of the Rac1 Guanine nucleotide exchange factor Tiam1 associated with a decrease of its activity [5]. Here we show that p140Cap affects the distribution of Tiam1 along the apicobasal junctional axis of the cells. We further characterized the interaction between p140Cap and Tiam1, demonstrating that the amino (N) terminal (1-287 aa) p140Cap region is sufficient both for the association with the catalytic domain of Tiam1 and for impairing Tiam1 activity. Moreover, in human Her2+ patients, high levels of SRCIN1 correlate with increased survival in TIAM1 high patients.
Material and methods
DNA constructs
For cloning, restriction enzymes from New England Biolab were used. For amplification, GoTaq DNA polymerase (#M7806) was from Promega. For expression in mammalian cells, full-length mouse p140Cap cDNA was cloned into the BamHI site of pcDNA3.1/Myc-Hys expression vector (Invitrogen) and sequenced [2]. Constructs expressing p140Cap domains were cloned as described: the full-length p140Cap cDNA was digested with XhoI. A DNA fragment of 2310 bp and a fragment of 1100 bp, corresponding to p140Cap aa 1-770 and aa 770-1140 respectively were obtained and cloned into the XhoI site of pcDNA3.1/Myc-Hys expression vector (Invitrogen). p140Cap aa 351-691 was obtained by PCR amplification from full-length mouse p140Cap. Forward primer was designed to incorporate a restriction site for NheI (1158 bp) (primer sequence: GCTGGCTAGCTGCAATGGACTCCCCGCCT), reverse primer was designed to incorporate a restriction site for HindIII (2175 bp) (primer sequence: GCAGAAGCTTGACAGCAGTGGGCTG). The amplified region was cloned into pcDNA3.1/Myc-Hys expression vector. p140Cap aa 667-866 was obtained from full-length mouse p140Cap, with the forward primer incorporating a restriction site for XbaI and Kozak sequence (2106 bp) (primer sequence: TCTAGAGACATGGCCTCGGCCAGCAGC), and reverse primer incorporating a restriction site for HindIII (2703 bp) (primer sequence: AAGCTTTACCCTCATCCACTTGCCTTCGGAT); the amplified DNA was cloned into pGEM-T Easy expression vector (Promega, #A1360) and then into the XbaI/HindIII sites of pcDNA3.1/Myc-Hys expression vector from the p-GEM vector. p140Cap aa 695-1217 was cut from full length cDNA with the Nhe enzyme and cloned into the same site of pcDNA3.1/Myc-Hys expression vector. p140Cap 1-287 RFP was obtained cutting with the EcoRV restriction enzyme and cloning site of pcDNA3.1/Myc-Hys expression vector and then cloned into SacII-BamHI site of pmRFP-N expression vector.
The p140Cap BirA: MCS-BirA(R118G)-HA and pcDNA3.1mycBioID-p140Cap, BirA: MCS-BirA (R118G)-HA, pcDNA3.1mycBioID plasmids were obtained from Professor Thilo Kähne (Otto-Von-Guericke, University of Magdeburg). pEGFP-N1 Tiam1 was a kind gift from Kozo Kaibuchi (Nagoya University, Japan), YF-Tiam1 (Delta-Tiam1) was a gift from Tobias Meyer (Addgene plasmid # 20154; http://n2t.net/addgene: 20154; RRID: Addgene_20154).
Antibodies and cell lines
For western blot analysis, the following antibodies were used: mouse monoclonal antibody (Mab) to p140Cap already characterized in [5] (1:1000, 0,5 microgram/ml), GFP polyclonal antibody, RFP polyclonal antibody and E-cadherin monoclonal antibody home made in our Dept Antibody facility [34], Myc monoclonal antibody 9E10 (American Type Culture Collection), anti Rac1 (1:2000, #05-389 clone 23A8, Millipore, Billerica, MA, USA) and anti GAPDH (1:8000, MAB374, Millipore, Billerica, MA, USA), anti Tiam1 (1:1000, C-16, Santa Cruz Biotechnologies, Palo Alto, CA, USA) and (1:1000, A300-099A, Bethyl Laboratories Montgomery, TX, USA), and anti Tubulin (1:8000, T5168, Sigma-Aldrich Co, Italy). Secondary antibodies conjugated with peroxidase were purchased from GE Healthcare. Alexa Fluor Dye secondary antibodies were obtained from Invitrogen (Carlsbad, CA, USA). For immunofluorescence, slides were stained with anti p140 (1:1000, see above), anti E-cadherin antibody (1:50, M3612, Dako, Carpinteria, CA, USA), GM130 (1:300, 6,10,823, BD Transduction Laboratories, Franklin Lakes, NY), followed by secondary antibody conjugated with Alexa Fluor 488 or 568 (1:200, Molecular Probes, Invitrogen, Life Technologies, Monza, Italy).
Culture media were from Invitrogen (Carlsbad, CA, USA). Fetal Calf serum (FCS) was from EuroClone (Pero, Milano, Italy). HEK293 cells and MDA.MB.231 cells were obtained from ATCC (LGC Standards S.r.l.-Italy Office, Italy) and cultured in DMEM 10% FCS. TUBO-NeuT cells were derived from a spontaneous breast tumor arisen in a female BALB/c-MMTV-NeuT mice [33] and cultured in DMEM 20% FCS. To over-express p140Cap into TUBO-NeuT and MDA-MB-231 cells, p140Cap cDNA was cloned into pBabe-puro as described in [5]. The retroviruses particles were produced by the calcium phosphate transfection of Platinum Retroviral Packaging Cell Lines (Cell BioLabs), in 10 cm dishes. Briefly, 48 h after transfection, supernatant was collected, filtered through a 45 μm syringe filter and added directly to sub-confluent cells. After 48 h, cells were washed and cultured with a selection medium containing puromycin (Sigma) at a final concentration of 1 μg ml-1. For TUBO-NeuT and MDA-MB-231 cells, individual clones were isolated 20 days after the start of the selection. Four individual positive clones were pooled together to rule out clonal artifacts.
HEK293 cell transfection
HEK293 cells were transfected with the “calcium phosphate” method [35]. Briefly, cell density was 50-80% confluent on the day of transfection. For transfection DNA was mixed with sterilized milliQ water and 50 µL of CaCl2 2M to a final volume of 500 µL. Twenty-four hours after transfection, the medium was gently aspirated and prewarmed fresh medium was added to the plates. The following day, the cells were harvested, and proteins were extracted.
BioID assay
HEK293 cells were cultured in DMEM high glucose (Thermofisher: 11965084) supplemented with HI-FBS and Pen-Strep 1%. Cells were transiently transfected by calcium phosphate precipitation, as described above. Culture medium was changed one day after transfection. Two days after transfection cells were treated for 3 hours with D-biotin 50 μM (Thermofisher: B20656) diluted in the culture medium. Cells were incubated twice with biotin-free medium for 1 hour, lysed with 500 μl Buffer2 (NaCl: 150 mM; TRIS-HCl PH 7,5: 20 mM; EDTA: 5 mM; Deoxycholate sodium: 12 mM; water), scraped and incubated for 15 minutes at 4°C. Lysed cells were collected, cropped with 26G injection needle, sonicated (4 hits for 15 seconds, 30% power) and centrifuged at 4°C (15000 g) for 15 minutes. Supernatants were collected and quantified. 500 μg of extracts were incubated overnight with 10 μg of streptavidin-conjugated resin (PierceTM Streptavidin Agarose: 20353). The day after resins were centrifuged at 4°C (2500 g) for two minutes and the supernatant was removed. Five washes of 1 ml were performed alternating resuspension and centrifugation: one wash in Buffer1 (SDS 2% in deionized water); two washes in Buffer2 (previously described); one wash in Buffer3 (NaCl: 150 mM; TRIS-HCl pH 7,5: 20 mM); EDTA: 5 mM; Deoxycholate sodium: 12 mM; NP40 1%; SDS 0,01%; Triton X-100 1%; deionized water); one wash in Buffer4 (NaCl: 150 mM; TRIS-HCl pH 7,5: 20 mM; EDTA: 5 mM; Deoxycholate sodium: 12 mM; NP40 1%; SDS 0,01%; deionized water). After last washing supernatant was removed with a Hamilton needle. Biotinylated proteins were detached from the resin adding a volume of reduced Sample Buffer (8% SDS) with an excess of D-biotin (1 mM) and heating them at 95°C for 15 minutes. Eluted proteins were finally collected with a Hamilton needle.
Immunoprecipitation and immunoblotting
HEK293 cells were transfected with the corresponding DNA constructs with “calcium phosphate” method. Forty-eight hours post-transfection cells were extracted in lysis buffer (150 mM NaCl, 50 mM Tris pH 7.4, 1% NP-40, 1 mM MgCl2, 5% glycerol supplemented with 1 mM PMSF, 10 mM NaF, 2 mM NaVO3) containing the Protease Inhibitor cocktail (cat.no. 04-693-1160-001, Roche, USA). Moreover, TUBO-NeuT and MDA-MB-231 cells described above, were processed in the same way for immunoprecipitation and immunoblotting. Cell lysates were centrifuged at 13,000 g for 10 minutes and the supernatants were collected and assayed for protein concentration using the Bio-Rad protein assay method (Biorad, Hercules, CA, USA). Thirty micrograms of proteins were run on SDS-PAGE under reducing conditions using Mini-PROTEAN® TGXTM Precast Gels from Bio-Rad (California 94547 USA). For co-immunoprecipitation experiments, 2 mg of proteins was immunoprecipitated with specific antibodies two hours at 4°C in the presence of 14 μl Dynabeads protein G (30 mg Dynabeads®/mL Invitrogen, Carlsbad, CA, USA). Following SDS-PAGE, proteins were transferred to Nitrocellulose blotting membrane (GE Healthcare Life Sciences), incubated with specific antibodies and then detected with peroxidase-conjugated secondary antibodies and with Bio-Rad’s Clarity ECL on ChemiDoc Touch Imaging System (Biorad). When appropriate, the Nitrocellulose membranes were stripped according to manufacturers’ recommendations and re-probed.
Immunofluorescence
For immunostaining, cells were fixed at RT with 4% paraformaldehyde (PFA) for 10 min. Cells were then permeabilized in 0.25% Triton-X-100 in PBS for 10 min, saturated with 1% BSA and 0.25% Triton-X-100 in PBS for 30 min and incubated with primary antibody p140 (1:500), E-cadherin (1:300), GM130 (1:300), Tiam1 (1:500) at RT for 90 min. Primary antibodies were detected with anti-rabbit or anti-mouse Alexa Fluor 488/568/647 (Molecular Probes, Invitrogen), used at 1:500 dilution for 1 h. For F-actin staining, Acti-stain 488 Phalloidin (Cytoskeleton Denver, CO) was used in accordance with the manufacturer’s instructions. Counterstaining was performed with the DNA dye DAPI (Sigma) at 0.5 μg/ml DAPI for 5 min and washed with PBS. Imaging from TUBO-NeuT and TUBO-NeuT-p140 cells were acquired using a Leica SP8 confocal system with HyVolution 2 (Leica Microsystems) equipped with an argon ion, a 561 nm DPSS and a HeNe 633 nm lasers. Fixed cells were imaged using a HCX PL APO 63×/1.4 NA oil immersion objective. Series of x-y-z images were collected. MDA-MB-231 cells were imaged using an Eclipse 80i-ViCO system (Nikon, Japan). Fixed cells were imaged using a Plan Fluor 40×/1.3 NA oil immersion objective. All the images were analyzed by using Fiji Software (an image processing package distribution of ImageJ, USA).
Rac GTPases in vitro activity assay
HEK293 cells were transfected with the corresponding DNA constructs with “calcium phosphate” method. Forty-eight hours post-transfection cells were washed twice on ice with PBS and then lysed in MLB buffer (25 mM EDTA, 150 mM NaCl, 2% glycerol, 1% NP40, 1 mM EDTA, 10 mM MgCl2, 10 μg/ml each of leupeptin, pepstatin, and aprotinin). For pull-down experiments glutathione-coupled Sepharose 4B beads bound to recombinant GST-PAK CRIB domain fusion proteins (Cytoskeleton Denver, CO) as already described in Grasso et al., 2017, were incubated with cell extracts at 4°C for 30 min, eluted in Laemmli buffer and analyzed for the presence of Rac1 by Western blot.
Tiam1 activity assay
Assays were performed using the active Rac1-GEF assay kit (Cell Biolabs, San Diego, USA) according to the manufacturer’s instructions, as already described in Grasso et al., 2017. HEK293 cells were transfected with the corresponding DNA constructs with “calcium phosphate” method. Forty-eight hours post-transfection cells were washed twice with ice-cold PBS and lysed in ice-cold 1X Assay/Lysis Buffer (1 mM PMSF, 10 μg/ml each of leupeptin, pepstatin, and aprotinin). Two milligrams of proteins were incubated with 40 μl of resuspend Rac1 G15A agarose bead slurry and incubate for 1 h at 4°C. Beads were washed 3 times with the 1X Assay/Lysis Buffer, resuspended in 40 microliters of 2X reducing SDS-PAGE sample buffer and boiled for 5 min. Pull down supernatant were subjected to SDS-PAGE electrophoresis and western-blotting with anti-Tiam1 antibody.
Statistical analysis
Results of three independent experiments are reported as mean ± standard error of the mean (SEM). Statistically significant differences were evaluated using unpaired t-tests. Error bar: SEM. Results were considered significant when P-value < 0.05. Statistical tests used the GraphPad Prism version 6.0 for Windows (GraphPad Software, San Diego California USA, www.graphpad.com).
Survival analysis
Normalized gene expression data have been downloaded from synapse.org [36], and analyzed with R 4.0.0. Her2+ patients have been selected based on HER2 expression, and high- and low-SRCIN1 or TIAM1 classes have been defined dividing patients by the median of gene’s expression. Annotation for 5-years Disease Specific Survival has been used for survival analysis and Kaplan-Meier curve, through “survival” and “survminer” R packages [37,38].
Results
p140Cap affects Tiam1 localization and increases E-cadherin expression at the cell membrane in Her2+ breast cancer cells
The localization of Tiam1 in epithelial cells has been shown to play a crucial role in regulating cellular function [24]. To assess whether p140Cap expression may impact on Tiam1 expression or localization, here we analyzed these features in both TUBO-NeuT and TUBO-NeuT-p140 breast cancer cells, as models of Her2+ breast cancer. Western blot quantification of Tiam1 expression with specific antibodies on total cell extracts showed that p140Cap does not affect the expression of Tiam1 (Figure 1A). Similar results were obtained by analyzing the intensity of Tiam1 immunostaining in the same cells (Figure 1B). We then analyzed the distribution of Tiam1 in the apicobasal junctional axis by confocal microscopy in at least three hundred fifty cells and we found that in the presence of p140Cap, Tiam1 significantly increased its distribution along the apicobasal junctional axis at the cell membrane, represented by the z-x axis, compared to TUBO-NeuT cells (Figure 1C).
Figure 1.
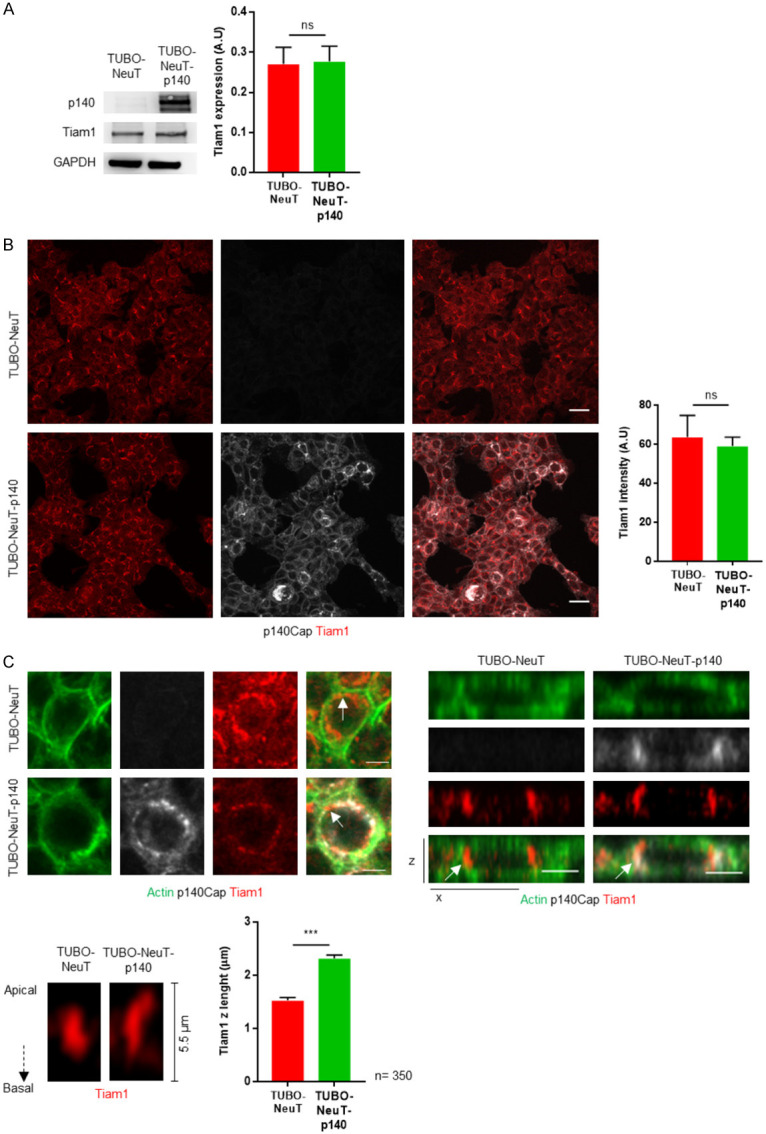
p140Cap does not change Tiam1 expression but affects Tiam1 localization in Her2 transformed cells. A. Extracts from TUBO-NeuT and TUBO-NeuT-p140 cells were run on 4-15% SDS-PAGE and blotted with antibodies to p140Cap and Tiam1. GAPDH was used as an internal standard for protein loading. The histogram shows in arbitrary unit the quantification of three independent experiments. B. TUBO-NeuT and TUBO-NeuT-p140 cells were plated on glass coverslips and then fixed and stained with p140Cap (grey) and Tiam1 (red) (left panels). The histogram shows the quantification of Tiam1 intensity from three independent experiments. The scale bar represents 20 micrometers. C. TUBO-NeuT and TUBO-NeuT-p140 cells were plated on glass coverslips and then fixed and stained with actin (green), p140Cap (grey) and Tiam1 (red). Upper lefts panels show representative images of cells in the x-y planes. The scale bar represents 10 micrometers. Upper right panels show representative images of whole cell in the the x-z plane. The scale bar represents 5 micrometers. Lower panels show Tiam1 staining in the x-z plane at a cross-section along the junction highlighted in upper panels by a white arrow. The histogram shows the Tiam1 z length counted in 350 cells of TUBO-NeuT and TUBO-NeuT-p140 cells from three independent experiments. Statistical significative differences were evaluated using unpaired t-tests (***P < 0.001). Error bar: s.e.m.
To address whether the impact of p140Cap on Tiam1 distribution is specific for Her2 breast cancer cells, we analyzed Tiam1 localization in MDA-MB-231 cells, a cellular model of triple negative breast cancer. These cells are negative for p140Cap expression (MDA-MB-231 mock). Therefore, to obtain p140Cap expressing cells (MDA-MB-231 p140), we infected cells with the same pBABE-p140Cap vector used above, to express p140Cap as shown by western blot and IF staining (Figure 2A). By co-immunoprecipitations assays we found that p140Cap does not associate with Tiam1 in these cells (Figure 2B). In MDA-MB-231 cells, Tiam1 has already been shown to localize nearby the specific Golgi cellular compartment [39]. Co-immunostaining with the Golgi marker GM130 shows that Tiam1 localizes in both mock and p140Cap cells in the same compartment, indicating that p140Cap expression does not grossly change the localization of Tiam1 in Triple negative breast cancer cells (Figure 2C). These data suggest that p140Cap can both interact with Tiam1 and affect its localization, specifically in Her2 transformed cells.
Figure 2.
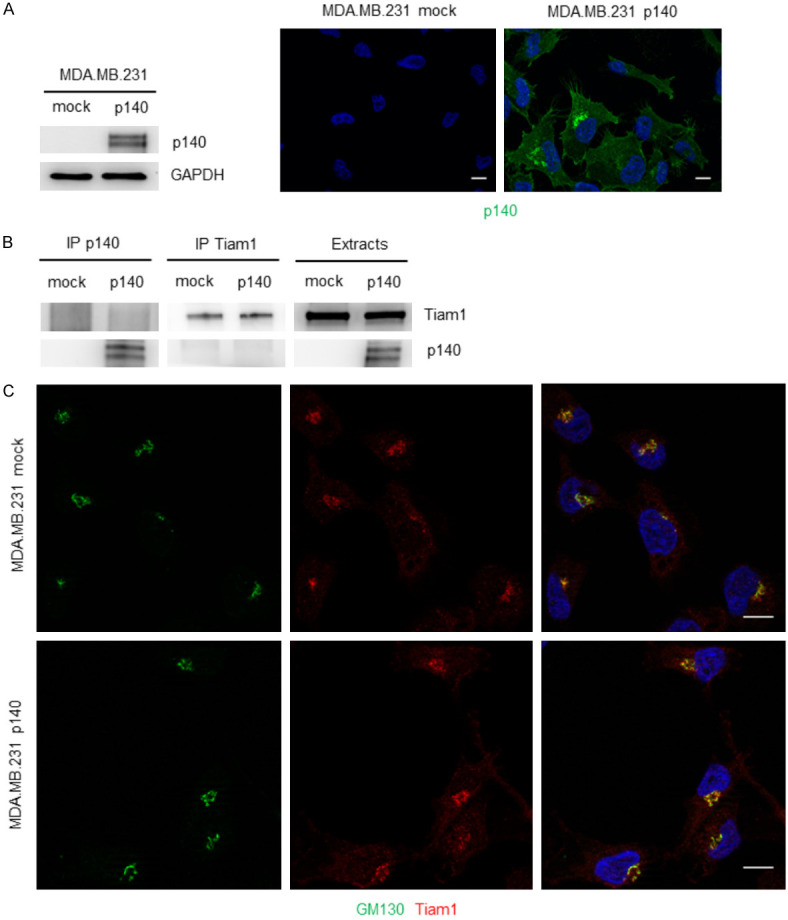
p140Cap does not bind neither affect Tiam1 localization in MDA.MB.231 triple negative breast cancer cells. A. Extracts from MDA.MB.231 mock and p140Cap overexpressing were run on 4-15% SDS-PAGE and blotted with antibodies to p140Cap and Tiam1. GAPDH was used as an internal standard for protein loading (left panels). MDA.MB.231 mock and p140Cap overexpressing were plated on glass coverslips and then fixed and stained with p140 (green) (right panels). The scale bar represents 10 micrometers. B. Extracts from MDA.MB.231 mock and p140Cap overexpressing were immuprecipitated with antibodies to p140Cap or Tiam1. Cell extracts and immunoprecipitates were run on 4-15% SDS-PAGE and blotted with antibodies to p140Cap and Tiam1. C. MDA.MB.231 mock and p140Cap overexpressing were plated on glass coverslips and then fixed and stained with GM130 (green) and Tiam1 (red). The scale bar represents 10 micrometers.
Our previous results show that, in breast cancer cells, p140Cap functionally interacts with E-cadherin at the cell membrane [3]. Further, E-cadherin is a component on the p140Cap interactome in the TUBO-NeuT-p140 breast cancer cells [18]. Moreover, immunostaining of E-cadherin on tumor sections from mice injected with TUBO-NeuT or TUBO-NeuT-p140 cells [5], demonstrated an increased expression of E-cadherin at the cell membrane in tumors expressing p140Cap. Consistent with these data, immunostaining of E-cadherin shows an increased expression of E-cadherin at the cell-cell contact in TUBO-NeuT-p140 cells compared to TUBO-NeuT cells (Figure 3A). Moreover, we found that not only p140Cap, but also Tiam1 co-immunoprecipitated with E-cadherin in these cells (Figure 3B), suggesting the existence of molecular complexes beneath the plasma membrane, including p140Cap, Tiam1, and E-cadherin. Overall, these results demonstrate that in Her2 cancer cells, p140Cap may interact with both Tiam1 and E-cadherin in a molecular complex beneath the membrane, affecting the distribution of Tiam1 along the z-axis and limiting its GEF activity. These may consequently increase the E-cadherin localization at the epithelial junction.
Figure 3.
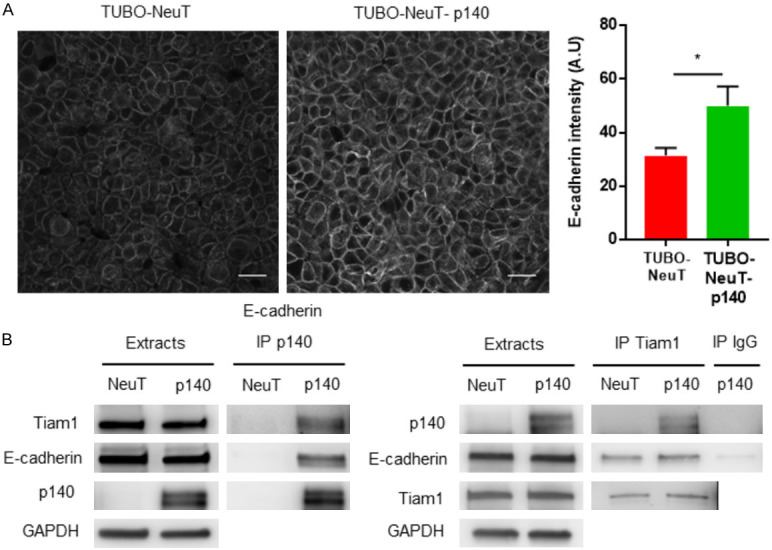
p140Cap increases E-cadherin expression in Her2 transformed cells. A. TUBO-NeuT and TUBO-NeuT-p140 cells were plated on glass coverslips and then fixed and stained for E-cadherin (grey). The histogram shows the quantification of E-cadherin intensity from three independent experiments. Statistical significative differences were evaluated using unpaired t-tests (*P < 0.05). Error bar: s.e.m. The scale bar represents 20 micrometers. B. Extracts from TUBO-NeuT and TUBO-NeuT-p140 expressing cancer cells, were immunoprecipitated with antibodies to p140Cap (left panels) or Tiam1 (right panels). Cell extracts and immunoprecipitates were run on 4-15% SDS-PAGE and blotted with antibodies to p140Cap, Tiam1 and E-cadherin.
p140Cap interacts with Tiam1 through its first N-terminal 1-287 amino acids
p140Cap is an adaptor protein, composed of several regions that can mediate association with specific partners [2]. To define the region of p140Cap associating to Tiam1, we tested if the two full length proteins are able to interact in the HEK293 cell model. p140Cap-Myc protein was expressed together with the Tiam1-GFP protein by co-transfection of adequate amounts of plasmids. After 72 hours, Tiam1 was immunoprecipitated with antibodies to GFP from cell extracts prepared in 1% NP-40 lysis buffer. After immunoblotting with p140Cap antibodies, we detected p140Cap as a protein present in the Tiam1 immunoprecipitate, as shown in Figure 4A. This result indicates that p140Cap and Tiam1 interact in HEK293 cells.
Figure 4.
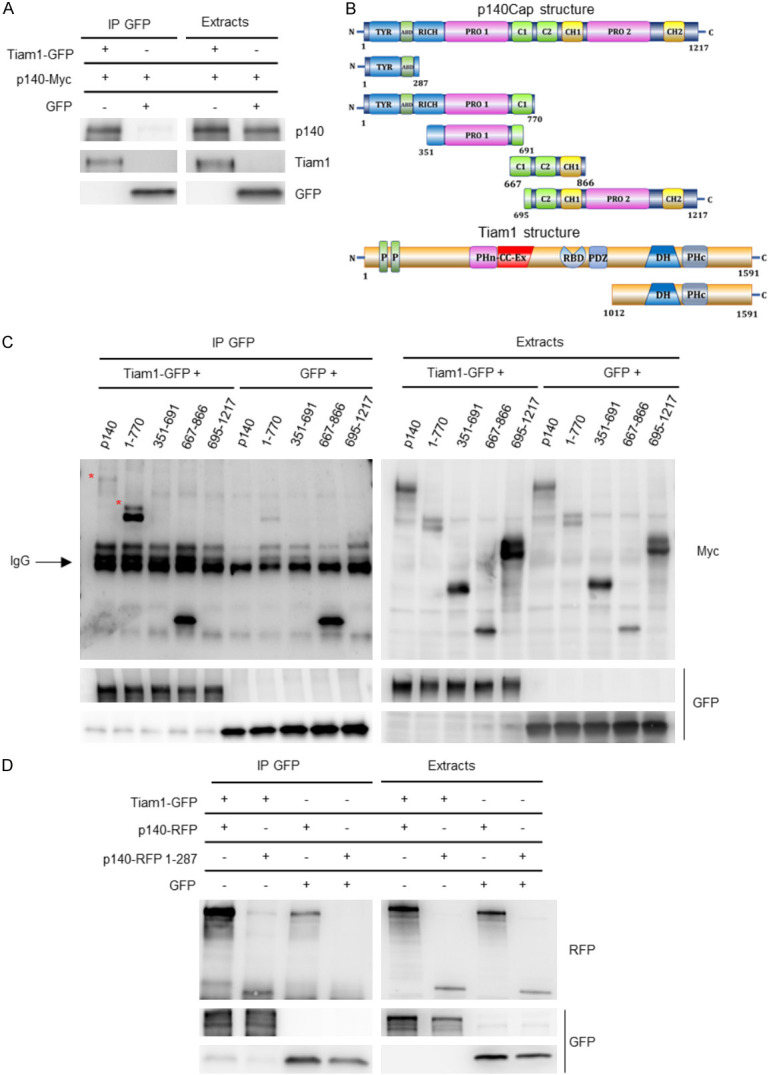
Biochemical characterization of p140Cap and Tiam1 interaction. A. Extracts from HEK293 cells transfected with p140Cap-Myc, Tiam1-GFP and GFP proteins were immunoprecipitated with anti GFP antibody. Cells extracts and immunoprecipitates were run on 4-15% SDS-PAGE and blotted with antibodies to p140, Tiam1 and GFP. B. Schematic representation of different Myc-tagged p140Cap fragments and Tiam1 protein. C. Extracts from HEK293 cells transfected with the different Myc-tagged p140 fragments (1-1217 aa, 1-770 aa, 351-691 aa, 667-866 aa and 695-1217 aa), Tiam1-GFP and GFP proteins were immunoprecipitated with anti GFP antibody. Cells extracts and immunoprecipitates were run on 4-15% SDS-PAGE and blotted with antibodies to Myc and GFP. D. Extracts from HEK293 cells transfected with p140-RFP 1-287 aa, Tiam1-GFP and GFP proteins were immunoprecipitated with anti GFP antibody. Cells extracts and immunoprecipitates were run on 4-15% SDS-PAGE and blotted with antibodies to RFP and GFP.
To define which part of p140Cap is involved in Tiam1 association, various Myc-tagged p140Cap region, described in Figure 4B, were expressed in HEK293 cells together with the Tiam1-GFP construct. After 72 hours, cells extracts were immunoprecipitated with anti-GFP. In western blot analysis, p140Cap was detected through the anti-Myc antibodies against the Tag, since the monoclonal antibody against p140Cap protein, directed to the carboxyterminal domain, does not stain the N-terminal region. The result shows that p140Cap associates with Tiam1 through its N-terminal region (1-770 aa) (Figure 4C). In particular, since we do not detect any interaction with the region of p140Cap corresponding to amino acids 351-691 and 691-1217, we hypothesized that p140Cap could associate with Tiam1 through its N-terminal region, containing amino acids 1-351 including a portion of the tyrosine-rich region and the actin-binding domain.
In order to confirm the interaction of Tiam1 with the N-terminal region of p140Cap, and reduce further the interacting region, an additional RFP-tagged region of p140Cap encoding amino acids 1-287 was transfected into HEK293 cells together with the Tiam1-GFP protein. Protein extracts were immunoprecipitated with GFP antibody. As shown in Figure 4D, we found that Tiam1 specifically associates with the N-terminal region of p140Cap containing amino acids 1-287, thus uncovering a shorter region of p140Cap able to interact with Tiam1.
To assess the proximal interaction between p140Cap and Tiam1, we exploited the BioID assay, which screen for protein interactions that occur in living cells. This technique harnesses a promiscuous biotin ligase that is fused to a protein of interest and expressed in cells, where it biotinylates proteins in the close vicinity of the protein of interest in living cells. The expected range of biotinylation varies from 10 to 20 nm depending on the protein complex under study [40]. We used fusion proteins containing the BirA enzyme located either at the N-terminal (Myc-BirA-p140) or the C-terminal (p140-BirA-HA) of p140Cap (Figure 5A). Firstly, to test whether Tiam1-GFP was able to interact with both these chimeric proteins, we performed an immunoprecipitation assay is HEK293 cells. As shown in Figure 5B and 5C, Tiam1-GFP co-immunoprecipitated with both proteins, upon transfection of the respective plasmids. Therefore, we transfected HEK293 cells with Tiam1-GFP, Myc-BirA-p140 or p140-BirA-HA, respectively, and performed the BioID assay. In cells transfected with Tiam1-GFP and p140-BirA-HA we did not find biotinylated Tiam1, confirming our hypothesis that the C-terminal is not involved in the interaction (Figure 5D). However, we expected a positive result in HEK293 cells transfected with Tiam1-GFP and Myc-BirA-p140, consistent with our data showing that the interaction with Tiam1 occurs through the N-terminal region of p140Cap. On the contrary, Tiam1 was not biotinylated in those cells (Figure 5E), thus indicating that the interaction between p140Cap and Tiam1 is not proximal enough to be detected by the assay. Overall, these data suggest that p140Cap and Tiam1 do not directly interact but belong to a molecular complex where the N-terminal region of p140Cap is required to associate with Tiam1.
Figure 5.
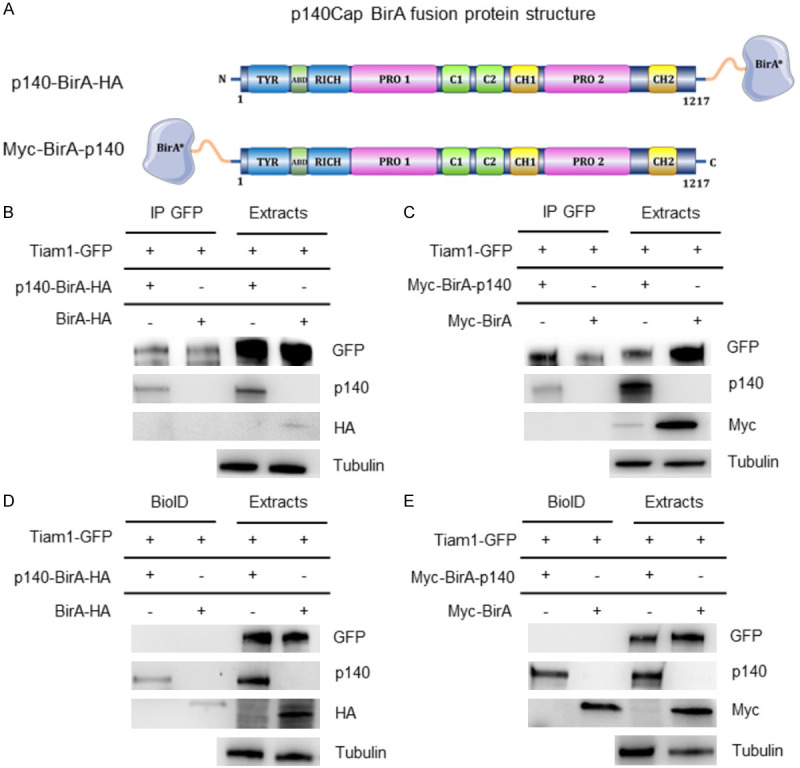
Proxi-tomic analysis of p140Cap in HEK293 cells. (A) Schematic representation of different p140Cap BirA fusion protein structures. (B, C) Extracts from HEK293 cells transfected with p140-BirA-HA (B) and Myc-BirA-p140 (C) constructs in combination with Tiam1-GFP or alone were immunoprecipitated with anti GFP antibody. Cells extracts and immunoprecipitates were run on 4-15% SDS-PAGE and blotted with antibodies to Myc, HA and GFP. Myc-BirA and BirA-HA constructs were used as negative control. (D, E) Extracts from HEK293 cells transfected with p140-BirA-HA (D) and Myc-BirA-p140 (E) constructs in combination with Tiam1-GFP or alone were isolated with the BioID protocol, run together with cell extracts on 4-15% SDS-PAGE and blotted with antibodies to Myc, HA and GFP. Myc-BirA and BirA-HA constructs were used as negative control.
The N-terminal region of p140Cap is sufficient to down-regulate Tiam1 activity in HEK293 cells
We previously reported that p140Cap limits GEF Tiam1 activity towards Rac1 in HER2-amplified breast cancer cells [5]. To test the impact of the p140Cap protein on the Tiam1/Rac1 axis in HEK293 cells, we first analyzed their activity upon transfection with p140Cap-Myc and Tiam1-GFP. To quantify changes in Tiam1 activity, we performed a pulldown assay, exploiting Agarose beads bound to the recombinant GST-RacG15A fusion protein, a nucleotide-free Rac1 mutant that selectively interacts and captures active Tiam1 from the cell extracts [41]. Active Tiam1 bound to the beads was revealed and quantified by western blotting with anti Tiam1 antibodies. The results show a significant decrease in the recovery of active Tiam1 by GST-RacG15A protein in cells transfected with both p140Cap-Myc and Tiam1-GFP proteins, compared to cells expressing only the Tiam1-GFP protein (Figure 6A). As expected, when we analyzed the Rac1 activity in HEK293 cells, by performing a classic pulldown assay with the recombinant GST-PAK fusion protein, we found a decrease in active Rac1 in cells expressing both p140Cap-Myc and Tiam1-GFP proteins, compared to cells expressing only Tiam1-GFP protein (Figure 6B). Thus, the concomitant expression of Tiam1 and p140Cap in HEK293 cells decreases both Tiam1 and Rac1 activities demonstrating that p140Cap is able to control the activation of the Tiam1/Rac1 axis in this exogenous system.
Figure 6.
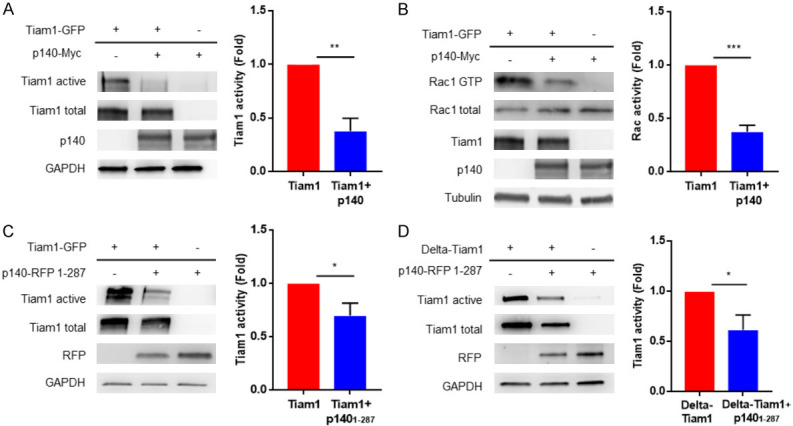
The N-terminal p140Cap region negatively regulates Tiam1 activity. (A, C, D) The level of active Tiam1 was determined using the active Rac-GEF assay kit in HEK293 cells transfected with p140Cap-Myc and Tiam1-GFP proteins in (A), p140-RFP 1-287 aa and Tiam1-GFP in (C), or p140-RFP 1-287 aa and Delta-Tiam1 in (D). Equal amount of extracts was incubated for 1 h at 4°C with Rac1 G15A agarose beads. Active Tiam1 and total Tiam1 levels were determined using an anti-Tiam1 antibody for western blot detection from eluted material and cell extract fractions, respectively. In cell extracts, total amount of p140Cap protein was detected with an anti-p140Cap or anti-RFP and antibody to GAPDH was used as loading control. The histogram represents the quantification of active Tiam1 in three independent experiments, normalizing active Tiam1 levels to the corresponding total Tiam1 levels and using HEK293 cells transfected with only Tiam1-GFP in (A, C) and Delta-Tiam1 in (D) as control. Statistical significative differences were evaluated using unpaired t-tests (*P < 0.05; **P < 0.01). Error bar: s.e.m. (B) Activated Rac1 was pulled down from the same protein extract as in (A), with the CRIB domain of PAK for 1 h at 4°C and detected by Western blot with anti-Rac1. Total amount of Rac1, p140Cap and Tiam1 protein were detected in cell extracts and Tubulin was used as loading control. The histogram shows the ratio between active and total Rac1 protein levels in three independent experiments, normalizing active Rac1 levels to the corresponding total Rac1 levels and using HEK293 cells transfected with only Tiam1-GFP as control. Statistical significative differences were evaluated using unpaired t-tests (***P < 0.001). Error bar: s.e.m.
Furthermore, we investigated whether the N-terminal p140Cap 1-287 amino acids region could affect Tiam1 activity. In HEK293 cells expressing p140Cap 1-287-RFP and Tiam1-GFP we observed a significant decrease of the Tiam1 activity, in comparison to cells expressing only Tiam1-GFP protein (Figure 6C), showing that the N-terminal region of p140Cap is sufficient not only to associate, but also to down-modulate the Tiam1 activity.
Recently, it has been described a novel mechanism for autoinhibition of Tiam1 by intramolecular interactions whereby, following a conformational change, the PHn-CC-Ex domain blocks the Rac1-binding site on the catalytic DH-PHc domain [25]. We thus tested if the N-terminal region of p140Cap could modulate Tiam1 activity through binding with the catalytic domain of Tiam1, thus interfering with the Rac-1 binding site. We express in HEK293 cells the construct encoding amino acids 1012-1591, here called Delta-Tiam1 (Figure 4B), which contains the catalytic Dbl-homology (DH) and the adjacent pleckstrin-homology (PH) regions. This truncated protein represents a constitutive active form of Tiam1. As shown in Figure 6D, we observed a decrease of Tiam1 activity in cells expressing both the Delta-Tiam1 and the p140Cap 1-287-RFP proteins, compared to control cells expressing only Delta-Tiam1 protein. Overall, these results highlight the fact that the concomitant expression of p140Cap and Tiam1 in the exogenous HEK293 cell system, is sufficient to down-modulate the Tiam1/Rac1 axis, and that the N-terminal region of p140Cap can associate to the catalytic domain of Tiam1, resulting in a decreased Tiam1 activity.
In Her2+ breast cancer, high levels of SRCIN1 correlate with increased survival in patients with high TIAM1 expression
We have previously shown that p140Cap expression correlates with a higher survival probability in Her2+ breast tumors [5]. Here, we have investigated the interaction between SRCIN1 and TIAM1 expression in a large cohort of Her2+ breast cancer patients (n=247, [36]) in terms of patients’ survival probability. Indeed, when considering patients with high TIAM1 expression, concurrent high SRCIN1 expression improves patients’ prognosis (p-value = 0.04, Figure 7), supporting a protective role of p140Cap in Her2+ breast cancer through the inhibition of Tiam1 activity, particularly relevant in cells expressing high TIAM1 levels.
Figure 7.
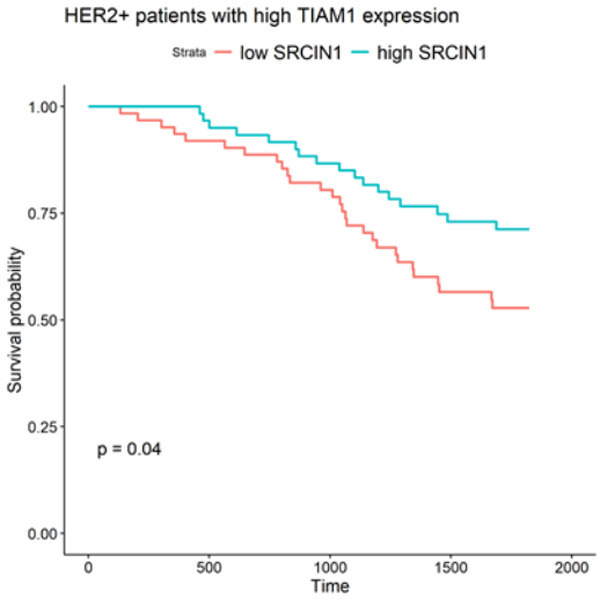
High SRCIN1 expression improves prognosis for HER2 positive patients with high TIAM1 expression. The Kaplan-Meier curve shows survival probability for HER2+ patients expressing high levels of TIAM1. Two classes of patients, divided by the median of SRCIN1 expression in the cohort, are compared, showing a difference in survival with p-value =0.04. Patients with higher SRCIN1 expression have a better survival probability than patients with lower SRCIN1 expression.
Discussion
In this study, we show that, in Her2+ breast cancer cells, the adaptor protein p140Cap impacts on localization and activation of the Rac1 GTPase GEF Tiam1. Indeed, p140Cap expressing cells show an increased Tiam1 distribution along the apicobasal junctional axis. Moreover, we identified the N-terminal region of p140Cap containing the amino acids 1-287 as the region involved in the binding with Tiam1. This region is also sufficient to down-regulate the Tiam1 activity, both against the full length Tiam1 protein and for the truncated constitutively active form of Tiam1, here defined as Delta-Tiam1. Supporting a protective role of p140Cap via interference with Tiam1 activity, the analysis of a human Her2+ breast cancer cohort showed that Her2+ patients with high TIAM1 expression display a significantly better prognosis when also expressing high levels of SRCIN1.
Our results indicate that p140Cap expression correlates with an increased Tiam1 localization at the apicobasal epithelial cell junction. We have previously reported that p140Cap interferes with the Rac1 circuitries that control Her2+ tumor progression, leading to both Tiam1 and Rac1 inactivation in Her2+ breast cancer cells [5]. Together, we may hypothesize that the increased distribution of Tiam1 at the apicobasal junctions, could be determinant for down-regulation of local Rac1 activity nearby the plasma membrane. On the other hand, it has been already described that Tiam1 is a component of the Par complex [26,42] that contributes to spatially restrict Rac1 activation and to define epithelial membrane identity in epithelial MDCK cells [43]. In Her2+ breast cancer cells, the down-regulation of Par3 causes up-regulation of the Tiam1/Rac1-GTP axis, increasing cell invasion and metastasis in vivo. In fact, an abnormal increase in Tiam1-mediated Rac1 activation affects cortical actin and E-cadherin junction dynamics. Tiam1-mediated Rac1 activation leads to uncontrolled actin dynamics that may compromise E-cadherin junctions, promoting metastasis [26,44]. This aberrant actin dynamics likely compromises E-cadherin junctions and decreases cohesion between tumor epithelial cells [45]. Interestingly, in our TUBO-NeuT-p140 cells, the increased distribution of Tiam1 along apicobasal junctional axis and the concomitant decreased activation of Tiam1, is associated with an increased expression of E-cadherin at the cell membrane. In addition, both p140Cap and Tiam1 associates with E-cadherin, indicating the existence of molecular complexes that, in p140Cap expressing cells, could stabilize both Tiam1 and E-Cadherin at the cell membrane. The dynamics of E-Cadherin in p140Cap expressing cells has been previously characterized by Fluorescence Recovery After Photo bleaching (FRAP), indicating that p140Cap overexpressing cells have a higher amount of the immobile fraction, thus confirming that p140Cap stabilizes E-Cadherin molecules at the cell membrane [3]. Our observations provide evidence of a new molecular complex composed by p140Cap, Tiam1 and E-cadherin at the cell membrane of Her2 transformed tumor cells. Therefore, in addition to limit Tiam1 activity, p140Cap could indeed contribute to strengthen the adherence junction stability through the stabilization of E-cadherin expression. Future studies will determine how p140Cap participates to these molecular interactions in a spatial and temporal manner, to affect E-cadherin junction stability, a key step in regulating tumor progression.
Our present data demonstrate that the N-terminal region of p140Cap, including aa 1-287, is sufficient to associate with Tiam1 and to regulate its activity, while the rest of the protein is not involved in the association. This region contains the putative myristoylation site and eight Tyrosine residues, out of 24 tyrosines that forms the so called Tyrosine Enriched Region (TER) of p140Cap [46]. So far, any of the association of p140Cap with known binding partners have never been mapped in this N-Terminal region. Moreover, TER-expressing cells are profoundly impaired in in vivo tumor growth [34], indicating that this p140Cap region is sufficient to down-regulate tumor properties. Whether p140Cap and Tiam1 directly associate was tested with the recent biotin-based proximity labeling technique Bio ID. This technique allows biotinylation of proteins in the close vicinity of the protein of interest in living cells and these biotinylated proteins are presumed to be interacting partners of the target protein [47]. However, when performing BioID assays on our cells, we found that Tiam1 was not biotinylated, indicating that the interaction between p140 and Tiam1 was not proximal enough to be detected by the assay. This result is also supported by our recent proteomic analysis of p140Cap in TUBO-NeuT-p140 breast cancer cells, where Tiam1 was not detected among the closest interactors [18]. p140Cap is an “intrinsic disorder protein” (IDP). IDPs or intrinsically disordered regions (IDRs), do not reach a spontaneously stable, well-defined globular three-dimensional structures, but are dynamically disordered and fluctuate rapidly from coils to collapsed globules [48,49]. p140Cap structure is for the 75-77% disordered, which allows interactions with alternative binding partners that might be indirect or dynamic and therefore difficult to detect with the BioID assay. On the other hand, p140Cap and Tiam1 participate to large complexes, with other partners that could mediate direct interactions.
Tiam1 is inhibited by multiple suppressive interactions tightly regulated by auto-inhibition. In fact, the N-terminal first 50 amino acids (N50) of Tiam1 inhibit its GEF activity by directly binding the PHn-CC-Ex domain and to a lesser extent to the catalytic DH-PHc domain which represents the Rac1-binding site crucial for the GEF activity [42]. More recently, it has also been reported that the PHn-CC-Ex domain of Tiam1 directly inhibited the catalytic function of the DH-PHc domain [25]. Interestingly, here we show that the N-terminal region 1-287 of p140Cap associates to a truncated form of Tiam1, Delta-Tiam1, which contains the catalytic the DH-PHc domain, and represents a constitutive active form of Tiam1. This association, even if not direct, is sufficient to inhibit Delta-Tiam1 activity, indicating that p140Cap may negatively control constitutive active form. Therefore, p140Cap may enhance or mimic the intrinsic auto-inhibitory mechanism of Tiam1, where p140Cap binds the catalytic domain of Tiam1 resulting in an inactivation of Tiam1 activity.
Finally, the analysis of a large Her2+ patients’ cohort allows to sort a positive correlation between high SRCIN1 levels and increased survival in patients harboring high TIAM1, sustaining the protective role of p140Cap in Her2+ breast cancer through the inhibition of Tiam1 activity.
Acknowledgements
This work was supported by MIUR (Ministero Università Ricerca, PRIN 2015 to PD and PRIN 2017 to VP), AIRC (Associazione Italiana Ricerca Cancro) to PD (IG-20107) and to VP (IG-16930), Compagnia San Paolo, Torino, Progetto DEFLECT to PD and to VP; Fondazione CRT 2017.2954 to PD.
Disclosure of conflict of interest
None.
References
- 1.Chin LS, Nugent RD, Raynor MC, Vavalle JP, Li L. SNIP, a novel SNAP-25-interacting protein implicated in regulated exocytosis. J Biol Chem. 2000;275:1191–1200. doi: 10.1074/jbc.275.2.1191. [DOI] [PubMed] [Google Scholar]
- 2.Di Stefano P, Cabodi S, Boeri Erba E, Margaria V, Bergatto E, Giuffrida MG, Silengo L, Tarone G, Turco E, Defilippi P. P130Cas-associated protein (p140Cap) as a new tyrosine-phosphorylated protein involved in cell spreading. Mol Biol Cell. 2004;15:787–800. doi: 10.1091/mbc.E03-09-0689. [DOI] [PMC free article] [PubMed] [Google Scholar]
- 3.Damiano L, Di Stefano P, Camacho Leal MP, Barba M, Mainiero F, Cabodi S, Tordella L, Sapino A, Castellano I, Canel M, Frame M, Turco E, Defilippi P. p140Cap dual regulation of E-cadherin/EGFR cross-talk and Ras signalling in tumour cell scatter and proliferation. Oncogene. 2010;29:3677–3690. doi: 10.1038/onc.2010.128. [DOI] [PubMed] [Google Scholar]
- 4.Grasso S, Cangelosi D, Chapelle J, Alzona M, Centonze G, Lamolinara A, Salemme V, Angelini C, Morellato A, Saglietto A, Bianchi FT, Cabodi S, Salaroglio IC, Fusella F, Ognibene M, Iezzi M, Pezzolo A, Poli V, Di Cunto F, Eva A, Riganti C, Varesio L, Turco E, Defilippi P. The SRCIN1/p140Cap adaptor protein negatively regulates the aggressiveness of neuroblastoma. Cell Death Differ. 2020;27:790–807. doi: 10.1038/s41418-019-0386-6. [DOI] [PMC free article] [PubMed] [Google Scholar]
- 5.Grasso S, Chapelle J, Salemme V, Aramu S, Russo I, Vitale N, Verdun di Cantogno L, Dallaglio K, Castellano I, Amici A, Centonze G, Sharma N, Lunardi S, Cabodi S, Cavallo F, Lamolinara A, Stramucci L, Moiso E, Provero P, Albini A, Sapino A, Staaf J, Di Fiore PP, Bertalot G, Pece S, Tosoni D, Confalonieri S, Iezzi M, Di Stefano P, Turco E, Defilippi P. The scaffold protein p140Cap limits ERBB2-mediated breast cancer progression interfering with Rac GTPase-controlled circuitries. Nat Commun. 2017;8:14797. doi: 10.1038/ncomms14797. [DOI] [PMC free article] [PubMed] [Google Scholar]
- 6.Bai PS, Hou P, Kong Y. Hepatitis B virus promotes proliferation and metastasis in male Chinese hepatocellular carcinoma patients through the LEF-1/miR-371a-5p/SRCIN1/pleiotrophin/Slug pathway. Exp Cell Res. 2018;370:174–188. doi: 10.1016/j.yexcr.2018.06.020. [DOI] [PubMed] [Google Scholar]
- 7.Cao M, Hou D, Liang H, Gong F, Wang Y, Yan X, Jiang X, Wang C, Zhang J, Zen K, Zhang CY, Chen X. miR-150 promotes the proliferation and migration of lung cancer cells by targeting SRC kinase signalling inhibitor 1. Eur J Cancer. 2014;50:1013–1024. doi: 10.1016/j.ejca.2013.12.024. [DOI] [PubMed] [Google Scholar]
- 8.Gao Y, Xue Q, Wang D, Du M, Zhang Y, Gao S. miR-873 induces lung adenocarcinoma cell proliferation and migration by targeting SRCIN1. Am J Transl Res. 2015;7:2519–2526. [PMC free article] [PubMed] [Google Scholar]
- 9.Liu L, Wang W, Gao S, Wang X. MicroRNA208a directly targets Src kinase signaling inhibitor 1 to facilitate cell proliferation and invasion in nonsmall cell lung cancer. Mol Med Rep. 2019;20:3140–3148. doi: 10.3892/mmr.2019.10542. [DOI] [PMC free article] [PubMed] [Google Scholar]
- 10.Ma L, Shao Z, Zhao Y. MicroRNA-374a promotes pancreatic cancer cell proliferation and epithelial to mesenchymal transition by targeting SRCIN1. Pathol Res Pract. 2019;215:152382. doi: 10.1016/j.prp.2019.03.011. [DOI] [PubMed] [Google Scholar]
- 11.Quan X, Chen D, Li M, Chen X, Huang M. MicroRNA-150-5p and SRC kinase signaling inhibitor 1 involvement in the pathological development of gastric cancer. Exp Ther Med. 2019;18:2667–2674. doi: 10.3892/etm.2019.7828. [DOI] [PMC free article] [PubMed] [Google Scholar]
- 12.Sun W, Wang X, Li J, You C, Lu P, Feng H, Kong Y, Zhang H, Liu Y, Jiao R, Chen X, Ba Y. MicroRNA-181a promotes angiogenesis in colorectal cancer by targeting SRCIN1 to promote the SRC/VEGF signaling pathway. Cell Death Dis. 2018;9:438. doi: 10.1038/s41419-018-0490-4. [DOI] [PMC free article] [PubMed] [Google Scholar]
- 13.Wu W, He L, Huang Y, Hou L, Zhang W, Zhang L, Wu C. MicroRNA-510 plays oncogenic roles in non-small cell lung cancer by directly targeting SRC kinase signaling inhibitor 1. Oncol Res. 2019;27:879–887. doi: 10.3727/096504018X15451308507747. [DOI] [PMC free article] [PubMed] [Google Scholar]
- 14.Xu X, Wang W, Su N, Zhu X, Yao J, Gao W, Hu Z, Sun Y. miR-374a promotes cell proliferation, migration and invasion by targeting SRCIN1 in gastric cancer. FEBS Lett. 2015;589:407–413. doi: 10.1016/j.febslet.2014.12.027. [DOI] [PubMed] [Google Scholar]
- 15.Zhou P, Xiong T, Yao L, Yuan J. MicroRNA-665 promotes the proliferation of ovarian cancer cells by targeting SRCIN1. Exp Ther Med. 2020;19:1112–1120. doi: 10.3892/etm.2019.8293. [DOI] [PMC free article] [PubMed] [Google Scholar]
- 16.Zhu J, Han S. miR-150-5p promotes the proliferation and epithelial-mesenchymal transition of cervical carcinoma cells via targeting SRCIN1. Pathol Res Pract. 2019;215:738–747. doi: 10.1016/j.prp.2019.01.004. [DOI] [PubMed] [Google Scholar]
- 17.Lu Q, Chen Y, Sun D, Wang S, Ding K, Liu M, Zhang Y, Miao Y, Liu H, Zhou F. MicroRNA-181a functions as an oncogene in gastric cancer by targeting caprin-1. Front Pharmacol. 2018;9:1565. doi: 10.3389/fphar.2018.01565. [DOI] [PMC free article] [PubMed] [Google Scholar]
- 18.Chapelle J, Sorokina O, McLean C, Salemme V, Alfieri A, Angelini C, Morellato A, Adrait A, Menna E, Matteoli M, Coute Y, Ala U, Turco E, Defilippi P, Armstrong JD. Dissecting the shared and context-dependent pathways mediated by the p140cap adaptor protein in cancer and in neurons. Front Cell Dev Biol. 2019;7:222. doi: 10.3389/fcell.2019.00222. [DOI] [PMC free article] [PubMed] [Google Scholar]
- 19.Hodge RG, Ridley AJ. Regulating Rho GTPases and their regulators. Nat Rev Mol Cell Biol. 2016;17:496–510. doi: 10.1038/nrm.2016.67. [DOI] [PubMed] [Google Scholar]
- 20.Sosa MS, Lopez-Haber C, Yang C, Wang H, Lemmon MA, Busillo JM, Luo J, Benovic JL, Klein-Szanto A, Yagi H, Gutkind JS, Parsons RE, Kazanietz MG. Identification of the Rac-GEF P-Rex1 as an essential mediator of ErbB signaling in breast cancer. Mol Cell. 2010;40:877–892. doi: 10.1016/j.molcel.2010.11.029. [DOI] [PMC free article] [PubMed] [Google Scholar]
- 21.Jaffe AB, Hall A. Rho GTPases: biochemistry and biology. Annu Rev Cell Dev Biol. 2005;21:247–269. doi: 10.1146/annurev.cellbio.21.020604.150721. [DOI] [PubMed] [Google Scholar]
- 22.Yang C, Liu Y, Lemmon MA, Kazanietz MG. Essential role for Rac in heregulin beta1 mitogenic signaling: a mechanism that involves epidermal growth factor receptor and is independent of ErbB4. Mol Cell Biol. 2006;26:831–842. doi: 10.1128/MCB.26.3.831-842.2006. [DOI] [PMC free article] [PubMed] [Google Scholar]
- 23.Wang SE, Shin I, Wu FY, Friedman DB, Arteaga CL. HER2/Neu (ErbB2) signaling to Rac1-Pak1 is temporally and spatially modulated by transforming growth factor beta. Cancer Res. 2006;66:9591–9600. doi: 10.1158/0008-5472.CAN-06-2071. [DOI] [PubMed] [Google Scholar]
- 24.Mertens AE, Roovers RC, Collard JG. Regulation of Tiam1-Rac signalling. FEBS Lett. 2003;546:11–16. doi: 10.1016/s0014-5793(03)00435-6. [DOI] [PubMed] [Google Scholar]
- 25.Xu Z, Gakhar L, Bain FE, Spies M, Fuentes EJ. The Tiam1 guanine nucleotide exchange factor is auto-inhibited by its pleckstrin homology coiled-coil extension domain. J Biol Chem. 2017;292:17777–17793. doi: 10.1074/jbc.M117.799114. [DOI] [PMC free article] [PubMed] [Google Scholar]
- 26.Chen X, Macara IG. Par-3 controls tight junction assembly through the Rac exchange factor Tiam1. Nat Cell Biol. 2005;7:262–269. doi: 10.1038/ncb1226. [DOI] [PubMed] [Google Scholar]
- 27.Minard ME, Ellis LM, Gallick GE. Tiam1 regulates cell adhesion, migration and apoptosis in colon tumor cells. Clin Exp Metastasis. 2006;23:301–313. doi: 10.1007/s10585-006-9040-z. [DOI] [PubMed] [Google Scholar]
- 28.Diamantopoulou Z, White G, Fadlullah MZH, Dreger M, Pickering K, Maltas J, Ashton G, MacLeod R, Baillie GS, Kouskoff V, Lacaud G, Murray GI, Sansom OJ, Hurlstone AFL, Malliri A. TIAM1 antagonizes TAZ/YAP both in the destruction complex in the cytoplasm and in the nucleus to inhibit invasion of intestinal epithelial cells. Cancer Cell. 2017;31:621–634. e6. doi: 10.1016/j.ccell.2017.03.007. [DOI] [PMC free article] [PubMed] [Google Scholar]
- 29.Wertheimer E, Gutierrez-Uzquiza A, Rosemblit C, Lopez-Haber C, Sosa MS, Kazanietz MG. Rac signaling in breast cancer: a tale of GEFs and GAPs. Cell Signal. 2012;24:353–362. doi: 10.1016/j.cellsig.2011.08.011. [DOI] [PMC free article] [PubMed] [Google Scholar]
- 30.Minard ME, Kim LS, Price JE, Gallick GE. The role of the guanine nucleotide exchange factor Tiam1 in cellular migration, invasion, adhesion and tumor progression. Breast Cancer Res Treat. 2004;84:21–32. doi: 10.1023/B:BREA.0000018421.31632.e6. [DOI] [PubMed] [Google Scholar]
- 31.Cook DR, Rossman KL, Der CJ. Rho guanine nucleotide exchange factors: regulators of Rho GTPase activity in development and disease. Oncogene. 2014;33:4021–4035. doi: 10.1038/onc.2013.362. [DOI] [PMC free article] [PubMed] [Google Scholar]
- 32.Li Z, Liu Q, Piao J, Hua F, Wang J, Jin G, Lin Z, Zhang Y. Clinicopathological implications of Tiam1 overexpression in invasive ductal carcinoma of the breast. BMC Cancer. 2016;16:681. doi: 10.1186/s12885-016-2724-0. [DOI] [PMC free article] [PubMed] [Google Scholar]
- 33.Rovero S, Amici A, Di Carlo E, Bei R, Nanni P, Quaglino E, Porcedda P, Boggio K, Smorlesi A, Lollini PL, Landuzzi L, Colombo MP, Giovarelli M, Musiani P, Forni G. DNA vaccination against rat her-2/Neu p185 more effectively inhibits carcinogenesis than transplantable carcinomas in transgenic BALB/c mice. J Immunol. 2000;165:5133–5142. doi: 10.4049/jimmunol.165.9.5133. [DOI] [PubMed] [Google Scholar]
- 34.Sharma N, Repetto D, Aramu S, Grasso S, Russo I, Fiorentino A, Mello-Grand M, Cabodi S, Singh V, Chiorino G, Turco E, Stefano PD, Defilippi P. Identification of two regions in the p140Cap adaptor protein that retain the ability to suppress tumor cell properties. Am J Cancer Res. 2013;3:290–301. [PMC free article] [PubMed] [Google Scholar]
- 35.Kingston RE, Chen CA, Okayama H. Calcium phosphate transfection. Curr Protoc Cell Biol. 2003 doi: 10.1002/0471143030.cb2003s19. Chapter 20: Unit 20.3. [DOI] [PubMed] [Google Scholar]
- 36.Curtis C, Shah SP, Chin SF, Turashvili G, Rueda OM, Dunning MJ, Speed D, Lynch AG, Samarajiwa S, Yuan Y, Graf S, Ha G, Haffari G, Bashashati A, Russell R, McKinney S, Group M, Langerod A, Green A, Provenzano E, Wishart G, Pinder S, Watson P, Markowetz F, Murphy L, Ellis I, Purushotham A, Borresen-Dale AL, Brenton JD, Tavare S, Caldas C, Aparicio S. The genomic and transcriptomic architecture of 2,000 breast tumours reveals novel subgroups. Nature. 2012;486:346–352. doi: 10.1038/nature10983. [DOI] [PMC free article] [PubMed] [Google Scholar]
- 37.Therneau T. A Package for Survival Analysis in R. 2020 R package version 3.2-3. [Google Scholar]
- 38.Kassambara A, Kosinski M, Biecek P, Fabian S. Survminer: drawing survival curves using ‘ggplot2’. 2020 R package version 0.4.7. [Google Scholar]
- 39.Adams HC 3rd, Chen R, Liu Z, Whitehead IP. Regulation of breast cancer cell motility by T-cell lymphoma invasion and metastasis-inducing protein. Breast Cancer Res. 2010;12:R69. doi: 10.1186/bcr2637. [DOI] [PMC free article] [PubMed] [Google Scholar]
- 40.Varnaite R, MacNeill SA. Meet the neighbors: mapping local protein interactomes by proximity-dependent labeling with BioID. Proteomics. 2016;16:2503–2518. doi: 10.1002/pmic.201600123. [DOI] [PMC free article] [PubMed] [Google Scholar]
- 41.Garcia-Mata R, Wennerberg K, Arthur WT, Noren NK, Ellerbroek SM, Burridge K. Analysis of activated GAPs and GEFs in cell lysates. Methods Enzymol. 2006;406:425–437. doi: 10.1016/S0076-6879(06)06031-9. [DOI] [PubMed] [Google Scholar]
- 42.Matsuzawa K, Akita H, Watanabe T, Kakeno M, Matsui T, Wang S, Kaibuchi K. PAR3-aPKC regulates Tiam1 by modulating suppressive internal interactions. Mol Biol Cell. 2016;27:1511–1523. doi: 10.1091/mbc.E15-09-0670. [DOI] [PMC free article] [PubMed] [Google Scholar]
- 43.Ruch TR, Bryant DM, Mostov KE, Engel JN. Par3 integrates Tiam1 and phosphatidylinositol 3-kinase signaling to change apical membrane identity. Mol Biol Cell. 2017;28:252–260. doi: 10.1091/mbc.E16-07-0541. [DOI] [PMC free article] [PubMed] [Google Scholar]
- 44.Boissier P, Huynh-Do U. The guanine nucleotide exchange factor Tiam1: a Janus-faced molecule in cellular signaling. Cell Signal. 2014;26:483–491. doi: 10.1016/j.cellsig.2013.11.034. [DOI] [PubMed] [Google Scholar]
- 45.Xue B, Krishnamurthy K, Allred DC, Muthuswamy SK. Loss of Par3 promotes breast cancer metastasis by compromising cell-cell cohesion. Nat Cell Biol. 2013;15:189–200. doi: 10.1038/ncb2663. [DOI] [PMC free article] [PubMed] [Google Scholar]
- 46.Repetto D, Aramu S, Boeri Erba E, Sharma N, Grasso S, Russo I, Jensen ON, Cabodi S, Turco E, Di Stefano P, Defilippi P. Mapping of p140Cap phosphorylation sites: the EPLYA and EGLYA motifs have a key role in tyrosine phosphorylation and Csk binding, and are substrates of the Abl kinase. PLoS One. 2013;8:e54931. doi: 10.1371/journal.pone.0054931. [DOI] [PMC free article] [PubMed] [Google Scholar]
- 47.Roux KJ, Kim DI, Burke B, May DG. BioID: a screen for protein-protein interactions. Curr Protoc Protein Sci. 2018;91:19.23.1–19.23.15. doi: 10.1002/cpps.51. [DOI] [PMC free article] [PubMed] [Google Scholar]
- 48.Astro V, de Curtis I. Plasma membrane-associated platforms: dynamic scaffolds that organize membrane-associated events. Sci Signal. 2015;8:re1. doi: 10.1126/scisignal.aaa3312. [DOI] [PubMed] [Google Scholar]
- 49.Wright PE, Dyson HJ. Intrinsically disordered proteins in cellular signalling and regulation. Nat Rev Mol Cell Biol. 2015;16:18–29. doi: 10.1038/nrm3920. [DOI] [PMC free article] [PubMed] [Google Scholar]