

Abstract
Objective Markers of illness severity are increasingly captured in emergency department (ED) electronic systems, but their value for surveillance is not known. We assessed the value of age, triage score, and disposition data from ED electronic records for predicting influenza-related hospitalizations.
Materials and Methods From June 2006 to January 2011, weekly counts of pneumonia and influenza (P&I) hospitalizations from five Montreal hospitals were modeled using negative binomial regression. Over lead times of 0–5 weeks, we assessed the predictive ability of weekly counts of 1) total ED visits, 2) ED visits with influenza-like illness (ILI), and 3) ED visits with ILI stratified by age, triage score, or disposition. Models were adjusted for secular trends, seasonality, and autocorrelation. Model fit was assessed using Akaike information criterion, and predictive accuracy using the mean absolute scaled error (MASE).
Results Predictive accuracy for P&I hospitalizations during non-pandemic years was improved when models included visits from patients ≥65 years old and visits resulting in admission/transfer/death (MASE of 0.64, 95% confidence interval (95% CI) 0.54–0.80) compared to overall ILI visits (0.89, 95% CI 0.69–1.10). During the H1N1 pandemic year, including visits from patients <18 years old, visits with high priority triage scores, or visits resulting in admission/transfer/death resulted in the best model fit.
Discussion Age and disposition data improved model fit and moderately reduced the prediction error for P&I hospitalizations; triage score improved model fit only during the pandemic year.
Conclusion Incorporation of age and severity measures available in ED records can improve ILI surveillance algorithms.
Keywords: Age, Disposition, Influenza, Influenza-like illness – ILI, Syndromic surveillance, Triage score
BACKGROUND AND SIGNIFICANCE
Monitoring the incidence of severe illness is useful to inform intervention decisions, plan resources, and guide communication strategies. For influenza surveillance, the burden of severe illness can be monitored through counts of influenza-related hospitalizations and deaths, although hospitalization diagnoses or causes of death may not be readily available for prospective surveillance. Since syndromic surveillance is increasingly used as part of a strategy to monitor influenza, emergency department (ED) visits with influenza-like illness (ILI) are readily available and may be useful for surveillance of severe influenza illness. Patients presenting to the ED are, however, likely to have a wider range of illness severity than hospitalized patients, so methods must be developed to measure the severity of illness among people that visit the ED.
The severity of illness among those visiting the ED can be measured using routinely captured data such as standardized triage scores and patient disposition. However, few studies have reported using severity markers for influenza surveillance. Some authors have suggested that a combination of ED clinical and disposition data could be used for estimation and real-time monitoring of influenza-related hospitalizations. 1,2 The use of triage scores in surveillance systems has been reported,3,4 but their value for surveillance has not been evaluated.
Analysis of age-stratified ED visits, although they are not a direct marker of disease severity, may also enhance surveillance of severe influenza disease. Children and young adults with ILI have been identified as a sentinel population heralding the occurrence of epidemics, as measured by virological isolates, influenza-related hospitalizations, or influenza-related mortality, although the exact age group providing the earliest lead time varied across studies and seasons.5–10 ILI visits by older adults7 and the youngest children8 have been most strongly associated with overall influenza-related hospitalizations or mortality.
OBJECTIVE
The objective of this study was to evaluate the potential value of age, triage score, and disposition data contained in ED electronic records for predicting influenza-related hospitalizations. Our hypothesis was that counts of severe ILI visits, or visits from specific age groups, would better predict counts of influenza-related hospitalizations than would overall ILI ED visits.
METHODS
Study setting
The Montreal Public Health Department, responsible for a population of 1.85 million, conducts routine influenza surveillance.11 Data available for surveillance include detailed records of ED visits for a subset of the hospitals in Montreal, via the Regional Emergency Department Warehouse (Entrepôt Régional des Urgences). This database contains records for each ED visit to a participating hospital, including data on chief complaint, age, triage score, and disposition. Hospitals transmit records once daily to the database, which the Public Health Department accesses for surveillance. Complete data were available for five hospitals, including three tertiary centers, covering ∼28% of the ED visits to non-psychiatric, non-pediatric hospitals of the Montreal region.
The triage urgency for each visit is recorded in the database using the Canadian Triage and Acuity Scale (CTAS). CTAS is used throughout Canada.12 It has been validated as a predictor of individual patient outcomes, including admission, length of stay, resource utilization, and mortality.13,14 The CTAS categories are 1 (resuscitation – needs immediate care), 2 (emergent – needs physician assessment within 15 min), 3 (urgent – 30 min), 4 (semi-urgent – 1 h), and 5 (nonurgent – 2 h).
The Public Health Department also has access to detailed information on all hospitalizations in acute care hospitals in the province of Québec, Canada, through a registry called MED-ÉCHO (Maintenance et exploitation des données pour l'étude de la clientèle hospitalière). However, these data are only available with a delay of approximately 1 year after the date of discharge and are not suitable for real-time surveillance.
The study period spanned from June 25, 2006 to January 29, 2011. In the analysis, the H1N1 influenza pandemic year was defined as the 52 weeks between April 12, 2009 and April 10, 2010, covering both H1N1 waves. Statistical analyses were performed using STATA 10 (StataCorp LP, College Station, Texas, USA). This research was approved by the Research Ethics Committee of the Montreal Regional Health and Social Services Agency.
ILI ED visits
Weekly ILI counts were obtained from the Regional Emergency Departments Warehouse. Visits were classified using the chief complaint, which triage nurses select for each visit using a drop-down menu. One or more symptoms, syndromes, or presumptive diagnoses may be selected for each visit to describe the chief complaint. A case definition based on fever and (cough or sore throat) was chosen to be consistent with the World Health Organization (WHO) and Centers for Disease Control and Prevention (CDC) definitions of ILI,15,16 and to be comparable to what has been used elsewhere.5,17 The case definition was extended to include direct mention of influenza or ILI, since a descriptive analysis of the chief complaints indicated that these keywords were used commonly in the participating hospitals. Thus, a record was classified as an ILI syndrome if the chief complaint met the following condition: “(fever + cough) OR (fever + sore throat) OR influenza OR influenza-like illness.” Weekly counts were used, based on the date of registration to the ED.
Counts of ILI visits were stratified by age group, triage score, and disposition. Age was categorized into <18, 18–64, and ≥65 years old. Triage scores were grouped into “severe” (scores 1–3) and “non-severe” (4 and 5) categories. Dispositions of “Admission,” “transfer (to another facility),” or “death” were grouped together into a “severe” disposition category. Counts of disposition-stratified ILI visits were based on the date of discharge from the ED (as opposed to the date of registration).
Influenza-related hospitalizations
Hospitalization data for the five hospitals in the study were obtained from the MED-ÉCHO registry. Influenza-related hospitalizations were defined as hospitalizations with a primary or secondary diagnosis of pneumonia and influenza (P&I) (International Classification of Disease 10th revision J09–J18). P&I hospitalizations have been used elsewhere to estimate influenza-related hospitalizations.1,5–7,18–20 Weekly counts were tabulated based on date of admission.
To facilitate visualization of the data, a smoothed time series was produced where each data point was replaced by a value obtained from a locally weighted regression using values in an interval or bandwidth centered on the data point.21 A bandwidth of 4 weeks was chosen to smooth week-to-week variation while leaving seasonal patterns.
Statistical model
Weekly counts of P&I hospitalizations were modeled using negative binomial regression. Negative binomial models, which account for over-dispersion of count data as compared to a Poisson distribution (ie, where the variance is greater than the mean), have been used by others to model influenza-related outcomes.22–25 Secular trends were modeled with polynomial terms, and seasonal trends with sine and cosine terms. The number of polynomial terms and harmonics was chosen based on the Akaike information criterion (AIC), which is a measure of goodness of fit while taking into account parsimony. A lower AIC suggests a better model fit.26 P&I hospitalization counts from previous weeks were included as independent variables, when an analysis of the residuals indicated the presence of autocorrelation. This baseline model was fit separately for non-pandemic and pandemic years because the pandemic year did not exhibit the usual influenza seasonality.
To this baseline model we added, in separate models, weekly counts of 1) all-cause ED visits, 2) overall ILI visits, 3) age-stratified ILI visits (one model per age category), 4) severe-triage ILI visits, and 5) severe-disposition ILI visits. Lead times of up to 5 weeks were tested (ED visits occurring before the P&I hospitalization count date). In all models, the dependent variable remained the overall weekly counts of P&I hospitalizations. Models were fit separately for the non-pandemic and pandemic periods.
The predictive accuracy of the models was assessed using the mean absolute scaled error (MASE), which quantifies prediction accuracy and is comparable across data sets and prediction methods.27 The MASE is defined as the mean of the prediction error of the model (the absolute difference between predicted and observed counts) over the mean of the prediction error for a one-step-ahead naïve forecast (where each predicted count equals the previous observed count). A MASE of one indicates a model equivalent to naïve forecasts; the lower the MASE, the lower the prediction error.28 To compute the MASE of one-step-ahead forecasts for the non-pandemic period, each model was first fit using as a training period June 25, 2006 to February 7, 2009. P&I hospitalizations were then predicted over the testing period of February 8, 2009 to January 29, 2011, excluding the pandemic year. Errors were then computed for each data point of the testing period, and the mean of those errors was compared to the mean of the errors obtained with a naïve model, thus obtaining the MASE.
Because we did not want to make assumptions about the distribution of the MASE values, we used bootstrapping to estimate the standard error of the MASE. We resampled (with replacement) 50,000 times the testing period data for which prediction errors had been calculated, each time re-calculating the MASE and thus obtaining a distribution and a standard error. The number of resampling repetitions was chosen to ensure convergence of the estimated standard errors. Reported confidence intervals (CIs) are bias-corrected 95% CIs.29
In secondary analyses, we selected the most promising predictors (counts of age- or severity-stratified ILI visits) and lags from models using a single predictor and combined the multiple predictors into a single model. To assess whether predictability varied by hospital, we selected the most accurate predictive model with the pooled data, and applied it to hospital-stratified data, where the predicted outcome was each hospital’s P&I hospitalizations.
MASE values could not be obtained for models fit to pandemic data, due to the lack of data to evaluate forecast accuracy. These models were therefore compared using the AIC, which allows qualitative comparisons between models based on goodness of fit, but does not quantify predictive accuracy. The AIC was also obtained for models fit to the entire non-pandemic data set, to allow comparison of the rank ordering of models between the non-pandemic and pandemic periods.
RESULTS
There were on average 3634 ED visits per week over the study period. At least one chief complaint was recorded for 98% of visits, and 2.1% and 3.5% of these visits had chief complaints that met the ILI definition during the non-pandemic and the H1N1 periods, respectively. Table 1 shows the distribution of visits by age group, triage category, and disposition in non-pandemic and pandemic years. There was an increase in ILI visits during the H1N1 period for almost all subgroups. The mean weekly count of P&I hospitalizations was 39.9 (standard deviation (SD) 8.9) during the non-H1N1 period and 43.3 (SD 10.1) during the H1N1 period. Figure 1 illustrates the time series of ED visits with ILI and the time series of P&I hospitalizations. ILI visits, and to a lesser extent P&I hospitalizations, display clear seasonal variation, in addition to peaks corresponding to each H1N1 wave.
Table 1:
Mean number of weekly influenza-like illness emergency department visits according to visit characteristics, Montreal hospitals contributing records to the Regional Emergency Department Warehouse, June 25, 2006 to January 29, 2011
| Weekly mean (interquartile range) |
||
|---|---|---|
| Non-pandemic period (N = 188) | Pandemic yeara (N = 52) | |
| Age (years) | ||
| <18 | 16 (9–20) | 27 (15–28) |
| 18–64 | 49 (32–61) | 86 (5–99) |
| ≥65 | 10 (6–14) | 13 (10–16) |
| Triage score | ||
| 1-Resuscitation | 0.1 (0–0) | 0.1 (0–0) |
| 2-Emergent | 3 (1–4) | 5 (3–6) |
| 3-Urgent | 25 (16–33) | 38 (24–42) |
| 4-Semi-urgent | 39 (25–50) | 71 (43–84) |
| 5-Nonurgent | 8 (5–10) | 12 (7–14) |
| Disposition | ||
| Home/residence | 71 (46–92) | 121 (76–136) |
| Admission | 3 (1–5) | 5 (2–6) |
| Transfer | 0.4 (0–1) | 0.7 (0–1) |
| Death | 0.02 (0–0) | 0.00 (0–0) |
| Total | 75 (48–96) | 126 (80–142) |
aPandemic (H1N1) year: April 12, 2009 to April 10, 2010.
Figure 1:
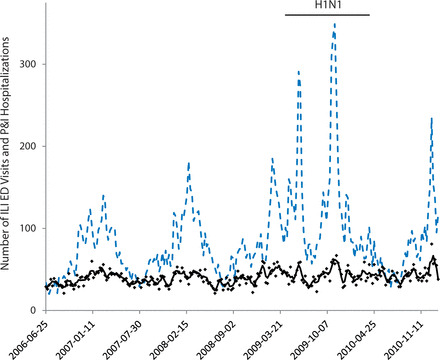
Weekly emergency department visits with influenza-like illness and pneumonia and influenza hospitalizations, Montreal hospitals contributing records to the Regional Emergency Department Warehouse, June 25, 2006 to January 29, 2011.
Weekly ILI ED visits (dotted line), and weekly P&I hospitalization counts (dots) and smoothed series (line).
ILI: influenza-like illness; ED: emergency department; P&I: pneumonia and influenza.
The baseline prediction model included linear and quadratic terms and sine–cosine terms up to the second harmonic. Residual autocorrelation remained at 4 weeks, thus P&I hospitalization counts from the 4 previous weeks were included in the model. The baseline model was as follows:
where Yi is the number of P&I hospitalizations at week i, t is the time elapsed in weeks from a time t0 arbitrarily set at the beginning of the study period, and 52.18 represents the average number of weeks per year.
Figure 2 presents the MASE values for the non-pandemic period, where darker shading indicates a lower MASE and thus, better prediction. Prediction error was lowest for models with ILI visits from patients ≥65 years old, with MASEs of 0.75 (95% CI 0.58–0.93) and 0.78 (95% CI 0.60–0.97) at lead times of 0 and 1 week, respectively. In comparison, the MASE was 0.91 (95% CI 0.71–1.12) for the baseline model; at lead times of 0 and 1 week, MASE values were 0.92 (95% CI 0.72–1.14) and 0.93 (95% CI 0.73–1.16) for all ED visits, and 0.92 (95% CI 0.72–1.14) and 0.86 (95% CI 0.67–1.07) for overall ILI visits. ILI visits with admission/transfer/death also resulted in lower prediction errors at lead times of 0 and 1 week, with MASEs of 0.77 (95% CI 0.60–0.95) and 0.80 (95% CI 0.63–0.99).
Figure 2:
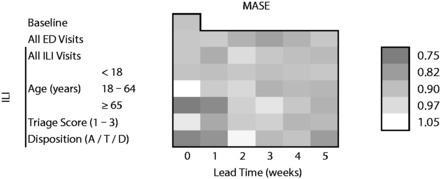
Mean absolute scaled error (MASE) of one-step ahead forecasts of pneumonia and influenza hospitalizations, Montreal hospitals contributing records to the Regional Emergency Department Warehouse, June 25, 2006 to January 29, 2011, excluding April 12, 2009 to April 10, 2010.
Models adjusted for secular trends, seasonality, and autocorrelation. Disposition A/T/D: admission, transfer, or death. Lower MASE (darker color) indicates better prediction. A MASE of 1 is equivalent to forecasts from a naïve model and a MASE of 0 means perfect prediction.
Combining the four most promising predictors (ILI visits from patients ≥65 years old and ILI visits with admission/transfer/death, both with 0- and 1-week lead times) resulted in a model with a MASE of 0.64 (95% CI 0.54–0.80). This model compared favorably to a model with overall ILI visits with lead times of 0 and 1 week (MASE 0.89, 95% CI 0.69–1.10). Figure 3 shows the predictions from these two models as well as from the baseline model, against observed P&I counts, for the reserved test data during the non-pandemic interval. The baseline model and the model with all ILI visits produced nearly identical forecasts and tended to underestimate observed P&I hospitalizations. The model combining age and severity indicators predicted P&I hospitalizations with greater accuracy, especially towards the end of the series.
Figure 3:
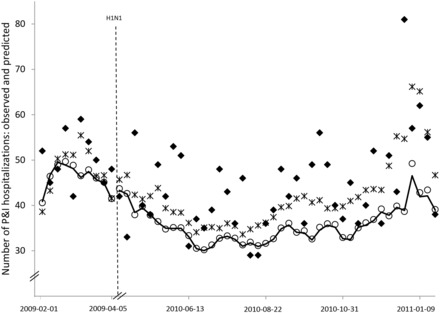
Weekly pneumonia and influenza hospitalizations, observed and predicted, Montreal hospitals contributing records to the Regional Emergency Department Warehouse, February 1, 2009 to January 29, 2011 (excluding H1N1 year).
Weekly P&I hospitalizations observed counts (diamonds), and counts predicted by baseline model (line), model with all ILI ED visits with 0 and 1-week lead time (circles), and model combining ILI ED visits from ≥65 year-olds and ILI ED visits resulting in admission/transfer/death with 0 and 1-week lead time (stars). Models adjusted for secular trends, seasonality, and autocorrelation.
ILI: influenza-like illness; ED: emergency department; P&I: pneumonia and influenza.
We were able to estimate the MASE for the model with the four most promising predictors, stratified by hospital, for four out of the five hospitals. Counts were too low for the other hospital to obtain stable parameter estimates. None performed better than the model applied to the pooled data, and significant differences were observed in the predictive accuracy of the model applied to the different hospitals.
Figure 4 shows the AIC goodness of fit of the models, where darker shading indicates lower AIC and thus, better fit. During the non-pandemic period, the models with the better fit (lower AIC) were generally the same as the models with better predictive accuracy (lower MASE). The models with ILI visits among patients ≥65 years old provided a better fit to the data than models with overall ED visits or overall ILI ED visits, at lead times of 0 and 1 week. With 1-week lead time, the model with ILI visits resulting in admissions/transfers/deaths also provided a better fit than the models with overall ED visits or overall ILI ED visits. Models with visit counts from the other age groups, and visits with severe triage categories, did not improve the fit over the models with all ILI visits. The model with the best fit to the data included ILI visits from patients ≥65 years old, followed by the model with all ED visits and all ILI visits, with 0 lead time.
Figure 4:
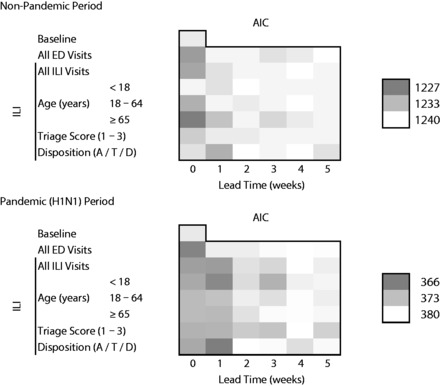
Akaike’s information criterion of predictive models for pneumonia and influenza hospitalizations, Montreal hospitals contributing records to the Regional Emergency Department Warehouse, June 25, 2006 to January 29, 2011.
Pandemic (H1N1) period: April 12, 2009 to April 10, 2010. Models adjusted for secular trends, seasonality, and autocorrelation. Disposition A/T/D: admission, transfer, or death. Lower AIC (darker color) indicates better fit.
During the pandemic (H1N1) year, on the other hand, the models including ILI visits from patients <18 years old had a lower AIC than models with all ED or all ILI visits, at lead times of 1–3 weeks. Models that included ILI visits with severe triage category at 2- and 3-week lead times, and those with admissions/transfers/deaths at 1-week lead time, had a better fit than models with all ED visits and models with all ILI visits at the corresponding lead times. The model with the best fit was the one with admissions/transfers/deaths with 1-week lead time, followed by the models with overall ED visits with 0 lead time and ILI visits from patients <18 years old at 1-week lead time.
DISCUSSION
Stratification by age and disposition from the ED during both non-pandemic and pandemic periods, as well as by triage category during pandemic period, improved the fit and accuracy of models for predicting overall P&I hospitalizations. During the non-pandemic period, models including visits from patients ≥65 years old reduced the mean absolute prediction error for P&I hospitalizations by 18% and 9% at leads times of 0 and 1 week, respectively, compared to models that included all ILI visits. Similarly, models including visits resulting in admission/transfer/death (severe ED disposition) reduced mean absolute prediction error by 16% and 7%, respectively. A model combining visits from patients ≥65 years old and visits resulting in admission/transfer/death with lead times of 0 and 1 week reduced the mean absolute prediction error by 26% compared to a model including all ILI visits.
There was no significant difference in predictive accuracy between the model that included visits from patients ≥65 years old and the model that included visits with severe ED disposition, but both models had a prediction accuracy that was significantly greater than a naïve model. In contrast, the model using overall ILI visits as a predictor did not have a predictive accuracy that was significantly different from the naïve model. These results suggest that the use of age, disposition from the ED and, possibly, triage score data from ED electronic records in surveillance algorithms may enhance the ability of public health agencies to monitor and predict the burden of severe illness in a timely manner. Although hospitalizations are only an indirect measure of illness severity, in most situations they are still, arguably, better than other available measures such as ED visits — hence the role of monitoring and predicting hospitalizations as part of severe illness surveillance.
Our hospital-stratified analysis suggests that a predictive model fit to data pooled from many hospitals may perform poorly when applied to the individual hospitals, and that predictive accuracy can vary significantly between hospitals. One possible explanation for this finding is that as counts are lower, random variation becomes relatively more important and prediction accuracy decreases. Another possible explanation is that there may be hospital-specific factors (for instance, related to case load, patient populations, clinical management, and coding practices) that influence model performance at the hospital level but that average out with the pooled data.
The age group providing the greatest improvement in prediction differed during non-pandemic years (patients ≥65 years old) and the H1N1 year (patients <18 years old). Our results suggest that the older age group may be a sentinel population for trends in hospitalizations during seasonal influenza, and similarly for the younger age group during the H1N1 pandemic influenza. However, a decision to hospitalize a patient can be influenced by considerations beyond the actual illness severity, such as the age of the patient, the circulating strain, and the associated perception of risk. These factors could explain in part findings that ED visits from some age groups are predictors of hospitalizations. Beyond improving prediction of hospitalizations and heralding epidemic trends, age-stratified information may also allow detection of shifts in age-specific attack rates associated with novel strains, and may inform decisions such as which age group to prioritize for vaccination.
Others have found that ILI ED visits by patients ≥65 years old were associated with overall P&I hospitalizations, with higher correlation coefficients than for other age groups.7 However, this relationship has not been observed consistently. Some studies have reported no significant difference in predictive value of different age groups for influenza-related hospitalizations,6 while others have found that the youngest age groups (patients <3 and 3–4 years old) provide the best predictive value, although for P&I mortality rather than hospitalizations.8 The use of different metrics between studies prevented us from quantifying differences in model performance.
A decrease in the importance of patients ≥65 years old and an increase in the importance of patients <18 years old in predictive value for P&I hospitalizations during the H1N1 period, compared to the non-pandemic period, is consistent with the age-specific attack rates for H1N1 reported in the literature. In one study, the greatest increase of ILI visits to sentinel physicians was observed for school-age children, adolescents, and young adults in the United States when compared to seasonal influenza; the lowest increase was for adults ≥65 years old. As for influenza-related hospitalizations, the greatest increase was in young and middle-aged adults, followed by school age children and adolescent; the lowest increase being in individuals ≥65 and <4 years old.30 Another study found the proportion of individuals 10–19 and 20–29 years old affected by H1N1 to be greater than the proportion usually affected by seasonal influenza.10
In our study, ILI ED visits resulting in admission/transfer/death were consistently associated with P&I hospitalizations with a 1-week lead time, during both non-pandemic and pandemic periods. Similarly, using ILI visits with “severe” triage category improved the fit of models predicting P&I hospitalizations, although only during the H1N1 year. Counts of ILI visits with “severe” disposition status or triage score may be a marker of the severity of an influenza epidemic in the community, rising earlier than counts of hospitalizations with a discharge diagnosis of P&I. Thus, monitoring them could potentially be useful for timely surveillance of influenza epidemic severity. It is not clear why using triage category improved the predictive models for hospitalizations during the H1N1 year only. It is conceivable that during the pandemic, ILI visit counts reflected, in addition to the incidence of influenza in the population, care-seeking by individuals with mild symptoms who would not normally visit the ED during a seasonal epidemic. In this context, ILI visits with “severe” triage categories may have a stronger association with true influenza as compared to visits assigned other triage categories.
A few studies assessed the use of ED disposition data to predict influenza-related hospitalizations. The use of ED data (signs and symptoms, chief complaints, ED or admission diagnosis) allowed prediction of hospitalizations with a discharge diagnosis of P&I (or pneumonia) with moderate sensitivity (40–62%), high specificity (94–99%), and moderate positive predictive value (41–71%).1,2 To our knowledge, however, no study has previously reported the disposition of ED visits for ILI to be a leading indicator of P&I hospital admissions. Finally, although the use of triage category in surveillance systems has been reported in the literature3,4 and has been deemed useful,4 performance metrics, association measures, or other quantitative analyses have not been reported.
One limitation of our study is that hospitals included in the surveillance system may not be representative of the whole Montreal health region. Notably, the absence of a pediatric hospital in the dataset limits generalization of the results to the pediatric population, although our dataset does include general EDs that serve patients of all ages. Another limitation is that it was not possible to verify the specificity and sensitivity of the chief complaint for ILI detection, since no gold standard was available. However, the fact that the triage nurse may select more than one symptom and may also select “influenza” or “ILI” as a chief complaint increases the likelihood that the chief complaint will have good sensitivity for detecting ILI as defined by the WHO or the CDC.15,16
Neither ILI nor P&I are specific for influenza, and both case definitions can capture diseases due to other respiratory pathogens, such as respiratory syncytial virus or bacteria. However, we defined ILI to be consistent with the WHO and CDC definitions,15,16 and P&I hospitalizations have often been used as a measure of influenza-related hospitalizations.5–7,9,31,32 We chose to report the MASE as a measure of forecast accuracy, so that the results of future research can be compared quantitatively to our results.
Public health organizations that conduct syndromic surveillance for influenza may use our results to guide the selection and further evaluation of covariates for inclusion in their surveillance algorithms. In the most accurate model, inclusion of age- and severity-stratified ED visits reduced mean absolute prediction error by 26% over a model using all ILI visits. Improved surveillance algorithms can help decision making and prioritization of interventions.
CONCLUSIONS
Stratifying ILI ED visits by age group, triage score, and disposition status improved the fit and the predictive accuracy of models for overall P&I hospitalizations, as compared to models using only overall ILI ED visits. In settings where the capacity exists, it may be valuable to incorporate age and severity measures as covariates in algorithms used in ED-based ILI surveillance systems. However, future research should evaluate the practical utility of using these covariates, in terms of informing decisions and improving the use of influenza control measures, while taking into account surveillance information available from other data sources.
Supplementary Material
Acknowledgments
The authors wish to thank André Bilodeau, from the Direction de santé publique de l’Agence de la santé et des services sociaux de Montréal, for his valuable help with the databases.
CONTRIBUTORS
All authors contributed to the conception and design of the study. N.S. analyzed and interpreted the data with contributions from D.L.B., R.A., and L.B. N.S. drafted the manuscript, and all coauthors revised it critically for important intellectual content. All authors approved the final version.
FUNDING
This research received no specific grant from any funding agency in the public, commercial, or not-for-profit sectors.
COMPETING INTERESTS
None.
REFERENCES
- 1. Berenbaum P, Gibson M, Blevins LZ. Accuracy versus timeliness for influenza detection: a comparison of hospital syndromic surveillance data with discharge data. Adv Dis Surveillance. 2007;2:93. [Google Scholar]
- 2. Townes JM, Kohn MA, Southwick KL, et al. Investigation of an electronic emergency department information system as a data source for respiratory syndrome surveillance. J Public Health Manag Pract. 2004;10(4):299–307. [DOI] [PubMed] [Google Scholar]
- 3. Zheng W, Aitken R, Muscatello DJ, Churches T. Potential for early warning of viral influenza activity in the community by monitoring clinical diagnoses of influenza in hospital emergency departments. BMC Public Health. 2007;7:250. [DOI] [PMC free article] [PubMed] [Google Scholar]
- 4. Moore KM, Edgar BL, McGuinness D. Implementation of an automated, real-time public health surveillance system linking emergency departments and health units: rationale and methodology. CJEM. 2008;10(2):114–119. [DOI] [PubMed] [Google Scholar]
- 5. Olson DR, Heffernan RT, Paladini M, et al. Monitoring the impact of influenza by age: emergency department fever and respiratory complaint surveillance in New York City. PLoS Med. 2007;4(8):e247. [DOI] [PMC free article] [PubMed] [Google Scholar]
- 6. Sebastian R, Skowronski DM, Chong M, Dhaliwal J, Brownstein JS. Age-related trends in the timeliness and prediction of medical visits, hospitalizations and deaths due to pneumonia and influenza, British Columbia, Canada, 1998-2004. Vaccine. 2008;26(10):1397–1403. [DOI] [PMC free article] [PubMed] [Google Scholar]
- 7. Chan EH, Tamblyn R, Charland KML, Buckeridge DL. Outpatient physician billing data for age and setting specific syndromic surveillance of influenza-like illnesses. J Biomed Inform. 2011;44(2):221–228. [DOI] [PubMed] [Google Scholar]
- 8. Brownstein JS, Kleinman KP, Mandl KD. Identifying pediatric age groups for influenza vaccination using a real-time regional surveillance system. Am J Epidemiol. 2005;162(7):686–693. [DOI] [PMC free article] [PubMed] [Google Scholar]
- 9. Schanzer D, Vachon J, Pelletier L. Age-specific differences in influenza A epidemic curves: do children drive the spread of influenza epidemics? Am J Epidemiol. 2011;174(1):109–17. [DOI] [PMC free article] [PubMed] [Google Scholar]
- 10. Timpka T, Eriksson O, Spreco A, et al. Age as a determinant for dissemination of seasonal and pandemic influenza: an Open Cohort Study of Influenza Outbreaks in Östergötland County, Sweden. PLoS ONE. 2012;7(2):e31746. [DOI] [PMC free article] [PubMed] [Google Scholar]
- 11. Agence de la santé et des services sociaux de Montréal. Espace montréalais d'information sur la santé. Secondary Espace montréalais d’information sur la santé 2011. http://emis.santemontreal.qc.ca/. Accessed August 19, 2011.
- 12. Christ M, Grossmann F, Winter D, Bingisser R, Platz E. Modern triage in the emergency department. Dtsch Arztebl Int. 2010;107(50):892–898. [DOI] [PMC free article] [PubMed] [Google Scholar]
- 13. Dong SL, Bullard MJ, Meurer DP, et al. Predictive validity of a computerized emergency triage tool. Acad Emerg Med. 2007;14(1):16–21. [DOI] [PubMed] [Google Scholar]
- 14. Jimenez JG, Murray MJ, Beveridge R, et al. Implementation of the Canadian Emergency Department Triage and Acuity Scale (CTAS) in the Principality of Andorra: can triage parameters serve as emergency department quality indicators? CJEM. 2003;5(5):315–322. [PubMed] [Google Scholar]
- 15. Center for Disease Control and Prevention. Overview of Influenza Surveillance in the United States. Secondary Overview of Influenza Surveillance in the United States 2011. http://www.cdc.gov/flu/weekly/overview.htm. Accessed May 22, 2012.
- 16. World Health Organization. WHO Recommended Surveillance Standards, 2nd edn. Secondary WHO Recommended Surveillance Standards, 2nd edn. 2006. http://www.who.int/csr/resources/publications/surveillance/WHO_CDS_CSR_ISR_99_2_EN/en/. Accessed April 4, 2012.
- 17. Pendarvis J, Gunn J, Smith AK, Donovan M, Barry A. Sneezes vs. wheezes: syndrome definitions for influenza-like illness. Adv DisSurveillance. 2007;2(115):1. [Google Scholar]
- 18. Thompson WW, Comanor L, Shay DK. Epidemiology of seasonal influenza: use of surveillance data and statistical models to estimate the burden of disease. J Infect Dis. 2006;194(Suppl 2):S82–S91. [DOI] [PubMed] [Google Scholar]
- 19. Tsui FC, Wagner MM, Dato V, Chang CC. Value of ICD-9 coded chief complaints for detection of epidemics. Proc AMIA Symp. 2001:711–715. [PMC free article] [PubMed] [Google Scholar]
- 20. Das D, Olson D, Heffernan R. Estimating hospital admissions for influenza using emergency department (ED) syndromic surveillance data, New York City. Adv Dis Surveillance. 2007;2:150. [Google Scholar]
- 21. Cleveland WS. Robust locally weighted regression and smoothing scatterplots. J Am Stat Assoc. 1979;74(368):829–836. [Google Scholar]
- 22. Yang L, Chiu SS, Chan K-P, et al. Validation of statistical models for estimating hospitalization associated with influenza and other respiratory viruses. PLoS ONE. 2011;6(3):e17882. [DOI] [PMC free article] [PubMed] [Google Scholar]
- 23. Gilca R, De Serres G, Skowronski D, Boivin G, Buckeridge DL. The need for validation of statistical methods for estimating respiratory virus–attributable hospitalization. Am J Epidemiol. 2009;170(7):925–936. [DOI] [PubMed] [Google Scholar]
- 24. Zhou H, Thompson WW, Viboud CG, et al. Hospitalizations associated with influenza and respiratory syncytial virus in the United States, 1993–2008. Clin Infect Dis. 2012;54(10):1427–1436. [DOI] [PMC free article] [PubMed] [Google Scholar]
- 25. Hardelid P, Pebody R, Andrews N. Mortality caused by influenza and respiratory syncytial virus by age group in England and Wales 1999–2010. Influenza Other Respi Viruses. 2012. [DOI] [PMC free article] [PubMed] [Google Scholar]
- 26. Burnham KP, Anderson DR. Model Selection and Multimodel Inference: A Practical Information-Theoretic Approach.. 2nd ed.New York, NY:Springer-Verlag;2002:49–97. [Google Scholar]
- 27. Zinszer K, Verma AD, Charland K, et al. A scoping review of malaria forecasting: past work and future directions. BMJ Open. 2012;2(6):e001992. [DOI] [PMC free article] [PubMed] [Google Scholar]
- 28. Hyndman RJ, Koehler AB. Another look at measures of forecast accuracy. Int J Forecasting. 2006;22(4):679–688. [Google Scholar]
- 29. Carpenter J, Bithell J. Bootstrap confidence intervals: when, which, what? A practical guide for medical statisticians. Stat Med. 2000;19:1141–1164. [DOI] [PubMed] [Google Scholar]
- 30. Karageorgopoulos DE, Vouloumanou EK, Korbila IP, Kapaskelis A, Falagas ME. Age distribution of cases of 2009 (H1N1) pandemic influenza in comparison with seasonal influenza. PLoS ONE. 2011;6(7):e21690. [DOI] [PMC free article] [PubMed] [Google Scholar]
- 31. Muscatello DJ, Morton PM, Evans I, Gilmour R. Prospective surveillance of excess mortality due to influenza in New South Wales: feasibility and statistical approach. Commun Dis Intell. 2008;32(4):435–442. [PubMed] [Google Scholar]
- 32. Simonsen L, Clarke MJ, Williamson GD, et al. The impact of influenza epidemics on mortality: introducing a severity index. Am J Public Health. 1997;87(12):1944–1950. [DOI] [PMC free article] [PubMed] [Google Scholar]
Associated Data
This section collects any data citations, data availability statements, or supplementary materials included in this article.