Abstract
Background
This study aimed to investigate the relationship between the expression of aspartate β-hydroxylase (ASPH) and the molecular mechanisms of ASPH-related genes in breast cancer (BC).
Material/Methods
ASPH expression was determined by immunohistochemistry and western blot analysis in samples of BC tissues and adjacent normal tissues. ASPH mRNA expression data and their clinical significance in BC were retrieved from the Oncomine and GEPIA datasets. Enrichment analysis of genes coexpressed with ASPH and annotation of potential pathways were performed with Kyoto Encyclopedia of Genes and Genomes (KEGG) and gene ontology (GO) analysis. Hub genes were shown in an ASPH coexpression gene-interaction network. The expression of the hub genes associated with patient survival were analyzed to determine the role of ASPH in the progression of BC.
Results
ASPH levels were overexpressed in BC and correlated with cancer type, lymph node involvement, and TNM stage. Conversely, ASPH levels did not correlate with patient age, invasive carcinoma types, or molecular subtypes. Enrichment analysis showed the involvement of multiple pathways, including lipid metabolism and oxidation-reduction processes. Six hub genes, PPARG, LEP, PLIN1, AGPAT2, CAV1, and PNPLA2, were related to ASPH expression and had functional roles in the occurrence and progression of BC.
Conclusions
ASPH may be involved in the development of BC and may have utility as a prognostic biomarker in BC. The coexpression of ASPH-associated genes may also be beneficial in improving BC prognosis.
MeSH Keywords: Biological Markers, Breast Neoplasms, Dioxygenases, Prognosis
Background
Breast cancer (BC) is the most frequently occurring malignancy in women and its worldwide incidence continues to rise [1–4]. BC that is identified early is highly curable; however, the overall cure rates are reduced by the outcomes of patients whose initial symptoms are not detected early and patients who present with advanced disease. Molecular targeted therapy is curative in BC, but patients diagnosed with advanced disease and distant metastases have poor 5-year survival rates of less than 25% [5,6]. BC can be divided into 4 molecular subtypes, namely, Luminal A, Luminal B, triple-negative BC (TNBC), and human epidermal growth receptor (HER2) positive tumors, according to estrogen receptor (ER), progesterone receptor (PR), Ki67, and HER2 expression [7]. There is a critical unmet need for more effective biomarkers of early BC detection and prediction of response to therapy.
Aspartate β-hydroxylase (ASPH) is a type-II transmembrane 86-kDa protein that functions as an α-ketoglutarate-dependent dioxygenase, which leads to the hydroxylation of aspartyl and asparagine residues in the epidermal growth factor-like domains of various proteins [8,9]. During embryonic development, ASPH promotes cell migration and organ development. Although it is rarely detected in normal adult tissues, ASPH is related to the occurrence and progression of cancers [10]. ASPH has recently been shown to promote BC development and metastasis by activating the Notch cascade [11]. ASPH is also overexpressed and strongly correlated with tumor invasiveness and poor prognosis in various tumor types, including colorectal [12], hepatocellular [13], non-small cell lung [14], pancreatic [15–17], and prostate cancer [18], and cholangiocarcinoma [19,20].
ASPH regulates cancer cell proliferation, invasion, and metastasis via several signaling pathways, but its specific regulatory mechanisms in BC have not been fully determined [21]. To identify the role of ASPH in BC, we aimed to investigate correlations between ASPH expression and the clinical characteristics of patients with BC. Also, using bioinformatics analyses, we explored the potential corresponding molecular pathways of the hub genes coexpressed with ASPH.
Material and Methods
Patients and Tissues
Tissue samples were obtained from patients with BC who underwent surgical resection at the Liaocheng People’s Hospital between August 2018 and June 2019. The samples included 96 BC tissue samples and 22 normal tissue samples adjacent to the tumors. The clinical characteristics of the study participants were retrospectively retrieved from medical records. A total of 96 paraffin blocks of fixed tissues were prepared for immunohistochemistry, and 30 matched pairs of fresh tumor and healthy tissues were analyzed by western blot analysis.
Of the 96 patients, 43 had an age of diagnosis ≤50, and 53 had an age of diagnosis >50. None of the patients had received chemotherapy before surgery. All tissues underwent standard histopathological analyses to determine histological type, tumor grade, molecular type, and lymph node metastasis. Of the 96 tumor samples, 65 were determined to be early-stage (I–II) and 31 were determined to be advanced stage (III–IV) tumors. Subtype analysis of the samples showed 17 tumors were Luminal A, 44 tumors were Luminal B, 12 tumors were HER2 positive, and 13 tumors were TNBC. Study approval was obtained from the Ethics Committee of the Liaocheng People’s Hospital. All clinicians agreed to the study, and all patients gave their written informed consent.
Immunohistochemistry
Immunohistochemistry was performed in 4-μm serial sections using a mouse streptavidin-biotin detection system (SP-9002; Zhongshan Jinqiao Biological Technology Co, Beijing, China), according to the manufacturer’s instructions. The following primary antibodies were used for immunohistochemical analysis: mouse monoclonal anti-ASPH (A-10, sc-271391; Santa Cruz Biotechnology), anti-ER (790–4325, 1: 100; Roche Diagnostic GmbH), anti-PR (790–4296, 1: 100; Roche Diagnostic GmbH), and anti-HER2 (790–4493, 1: 100; Roche Diagnostic GmbH). Cells from 5 randomly selected high-power fields in each tissue section were counted, and the level of expression was estimated from the percentage of sections with ASPH-positive cells.
Each slide was assessed by 2 independent pathologists to obtain the average percentage of expression levels and the intensity of the immunostained cells. The average percentage was scored as follows: 0 (0–5%); 1 (5–25%); 2 (26–50%); 3 (51–75%); and 4 (76–100%). The intensity of stained cells was scored as follows: 0 (negative); 1 (low); 2 (moderate); and 3 (high). The final immunohistochemistry scores were calculated by multiplying the intensity of the stained cells (0 to 3) by the average percentage of cell staining (0 to 4).
Western blot analysis
For western blot analysis, total protein was extracted with radioimmunoprecipitation assay lysis buffer, and the protein concentration of samples was determined using a bicinchoninic acid assay. Amounts of 20 μg to 40 μg of cell lysates were separated by sodium dodecyl sulfate polyacrylamide gel electrophoresis and wet-transferred to a polyvinylidene fluoride membrane. The primary antibody used was a mouse monoclonal anti-ASPH (A-10, sc-271391; Santa Cruz Biotechnology). The membrane was then incubated with a goat anti-mouse IgG (H+L) antibody (A0216; Beyotime Biotechnology) labeled with horseradish peroxidase, and the bands were detected using an ECL chemiluminescent detection kit. The band intensity was detected using the Image J software (National Institutes of Health, Bethesda, MD, USA), and the relative expression of ASPH was calculated by normalization to the expression of β-actin (C4; sc-47778; Santa Cruz Biotechnology).
Expression of ASPH mRNA in BC
Expression data on ASPH in BC and across 20 other solid tumor types were retrieved from the Oncomine database (https://www.oncomine.org) [22], and analyzed using box diagrams drawn with Origin software (https://www.originlab.com). Oncomine data were used to analyze the relationships between ASPH mRNA expression and BC cancer type, lymph node involvement, and TNM stage. Data from the Cancer Genome Atlas were used to analyze the relationship between ASPH mRNA expression and BC. Patient prognosis was investigated using cBioPortal (http://www.cbioportal.org) and the gene expression profile interactive analysis tool (GEPIA) (http://gepia.cancer-pku.cn).
Screening and cluster analysis of genes coexpressed with ASPH
Genes coexpressed with ASPH in BC were identified using the gene expression-based outcome for breast cancer online (GOBO, http://co.bmc.lu.se/gobo/gsa.pl), GEPIA, and cBioPortal resources. ASPH mutations including amplification and deletion were retrieved from cBioPortal. The database for annotation, visualization and integrated discovery v6.8 (DAVID) and Cytoscape were used to analyze the functional and signaling pathway enrichment of genes coexpressed with ASPH.
Screening and analysis of hub genes
A protein-protein interaction (PPI) network was created with the STRING database (http://www.string-db.org) and drawn using Cytospace 3.4.0. The rank of gene connectivity degree in the PPI network was identified using the cytoHubba plugin. The relationships between ASPH expression and the hub genes were analyzed online with GEPIA. Overall survival and relapse-free survival associated with the expression of hub genes were evaluated using the Kaplan-Meier Plotter (http://kmplot.com/analysis).
Data analysis
Statistical analyses were performed using SPSS software (IBM SPSS, Armonk, NY, USA). Chi-square tests were used to evaluate the relationships between ASPH expression and clinicopathological characteristics of patients. Data are presented as the mean±SEM and were evaluated by 1-way ANOVA followed by Turkey correction. Values of P<0.05 and P<0.01 were considered statistically significant.
Results
ASPH Expression in BC
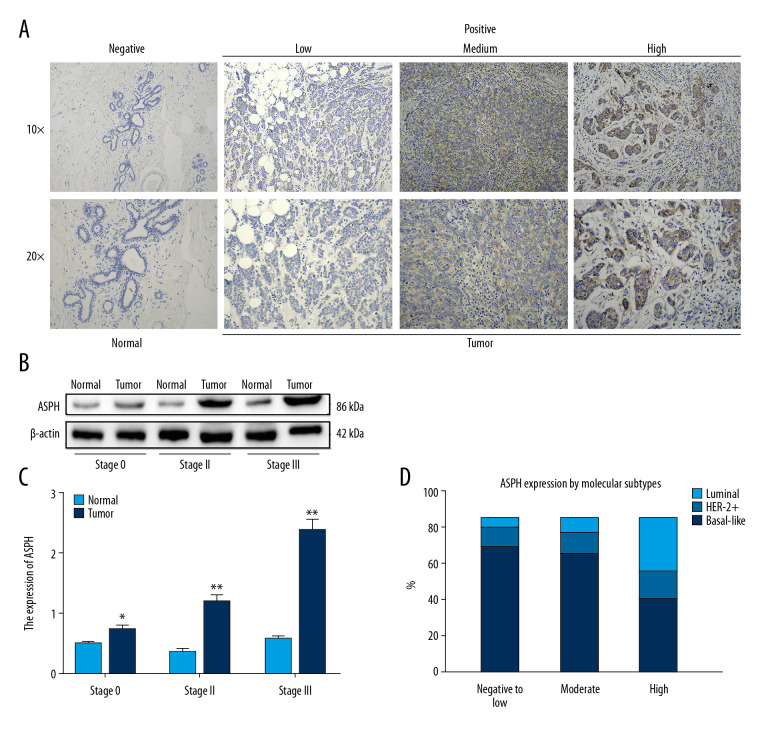
Representative photomicrographs of tissues with positive immunohistochemical staining of ASPH are shown in Figure 1A. The ASPH protein staining of BC tissues and adjacent normal tissues is shown in Figure 1B. Patients were stratified into 3 groups (Stages 0, II, and III) according to the TNM data obtained from medical records for correlation with the results from western blot analysis. The expression of ASPH was enhanced in tumors compared to in adjacent normal tissues, and the level of expression was related to TNM stage (Figure 1B, 1C). ASPH expression was significantly higher in Stage II than in Stage 0 patients (t=−11.778, P=0.007) and significantly higher in Stage III than in Stage 0 patients (t=−10.049, P=0.010). The difference in expression between Stage II and III patients was not significant (t=−1.978, P=0.187) (Figure 1B, 1C).
Figure 1.
Aspartate β-hydroxylase (ASPH) expression in breast cancer (BC). (A) Representative immunostaining for ASPH expression in negative normal breast tissue and in BC tissue showing weakly positive, moderately positive, and strongly positive staining. (B) Western blotting results of ASPH expression in tissues from patients with different stages of BC. (C) Quantitative analysis of ASPH expression in different stages of BC; n=30. (D) ASPH expression by molecular subtypes in BC. * P<0.05, ** P<0.01.
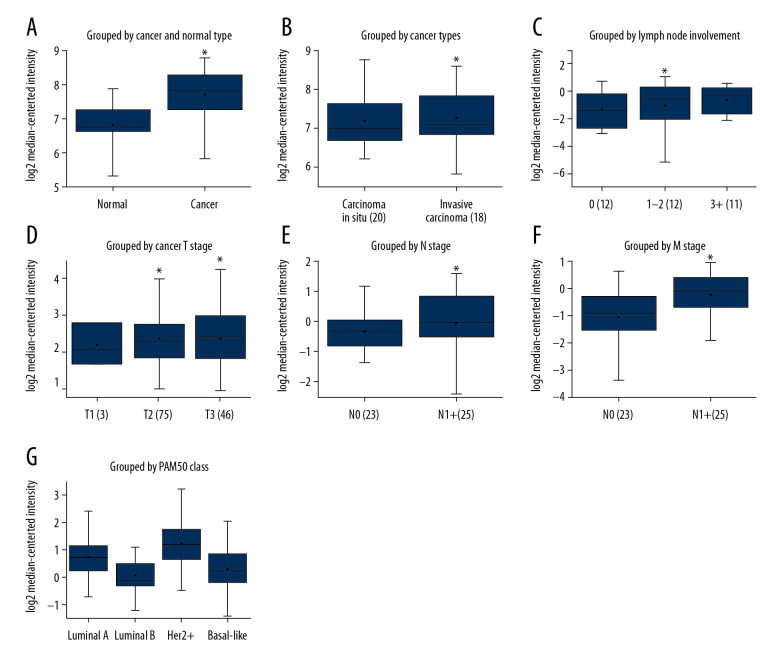
The Oncomine database was used to retrieve the levels of ASPH mRNA expression in BC and normal breast tissue. ASPH mRNA expression was rarely detected in normal tissue in the tumor epithelium and had a high level of expression in cancer tissues (Figure 2A), with higher expression in invasive ductal carcinoma than in ductal carcinoma in situ tissues (Figure 2B). ASPH mRNA expression was correlated with the degree of lymphatic involvement (Figure 2C) and with increasing TNM stage (Figure 2D–2F), and showed no association with ER, PR, or HER2 status (P>0.05) (Figure 2G).
Figure 2.
Boxplots of aspartate β-hydroxylase (ASPH) mRNA expression in breast cancer (BC) extracted from Oncomine. (A) ASPH mRNA expression in BC compared to normal breast tissues in the Ma 4 dataset [36]. (B) ASPH mRNA expression grouped by cancer type in the Ma 4 dataset [36]. (C) ASPH mRNA expression grouped by lymph node involvement in the Radvanyi dataset [37]. (D) ASPH mRNA expression grouped by T stage in the Bonnefoi dataset [38]. (E) ASPH mRNA expression grouped by N stage in the Zhao dataset [39]. (F) ASPH mRNA expression grouped by M stage in the Bonnefoi dataset [38]. (G) ASPH expression in the Esserman dataset grouped by PAM50 Class [40]. * P<0.05 for all comparisons.
Data from the Oncomine database showed that ASPH was also strongly upregulated in other tumor types including brain and central nervous system, colorectal, esophageal, head and neck, kidney, liver, and pancreatic cancers and lymphoma and sarcoma (Supplementary Figure 1).
Correlation of clinicopathological characteristics with ASPH expression
The clinicopathological characteristics and ASPH expression levels of the study participants are summarized in Table 1. ASPH protein expression was higher in BC (83.3±1.8%) compared to adjacent normal tissues (36.4±2.6%) and was significantly lower in carcinoma in situ (55.6±6.4%) than in invasive carcinoma (86.2±0.66%). ASPH expression was higher in late-stage disease (93.5±.9%) than in early-stage disease (80.0±0.9%). However, APSH expression was not associated with ER, PR, or HER2 status (Figure 1D, Table 1) (P>0.05).
Table 1.
Summary of the clinicopathological characteristics and aspartate β-hydroxylase (ASPH) expression in breast cancer (BC).
| Clinical pathology | Samples | Positive (n) | Positive rate (%) | χ2 | P-value | ||
|---|---|---|---|---|---|---|---|
| Low | Moderate | High | |||||
| Tissue types | |||||||
| Adjacent tissues | 22 | 6 | 2 | 0 | 36.36 | 25.892 | 0.000* |
| Breast cancer tissues | 96 | 20 | 34 | 26 | 83.33 | ||
| Cancer types | |||||||
| Carcinoma in situ | 9 | 4 | 1 | 0 | 55.56 | 11.601 | 0.009* |
| Invasive carcinoma | 87 | 16 | 33 | 26 | 86.21 | ||
| Age (years) | |||||||
| ≤50 | 43 | 11 | 17 | 7 | 81.40 | 4.748 | 0.191 |
| >50 | 53 | 9 | 17 | 19 | 84.91 | ||
| Lymph node metastasis | |||||||
| No | 37 | 13 | 9 | 6 | 75.68 | 12.746 | 0.005* |
| Yes | 59 | 7 | 25 | 20 | 88.14 | ||
| Tumor diameter (T), cm | |||||||
| ≤2 | 51 | 17 | 14 | 8 | 76.47 | 18.050 | 0.000* |
| >2 | 45 | 4 | 20 | 18 | 93.33 | ||
| Regional lymph nodes stage (N) | |||||||
| Stage 0–1 | 67 | 19 | 21 | 13 | 79.10 | 14.278 | 0.003* |
| Stage 2–3 | 29 | 1 | 13 | 13 | 93.10 | ||
| TNM stage | |||||||
| Stage 0–II | 65 | 20 | 21 | 11 | 80.00 | 17.902 | 0.000* |
| Stage III–IV | 31 | 1 | 13 | 15 | 93.55 | ||
| Invasive carcinoma types | |||||||
| Ductal breast cancer | 61 | 11 | 23 | 21 | 90.16 | 5.260 | 0.511 |
| Lobular breast cancer | 19 | 3 | 8 | 3 | 73.68 | ||
| Mucinous breast cancer | 7 | 2 | 2 | 2 | 85.71 | ||
| ER | |||||||
| Negative | 27 | 3 | 7 | 12 | 81.48 | 7.008 | 0.072 |
| Positive | 59 | 14 | 23 | 11 | 81.36 | ||
| PR | |||||||
| Negative | 33 | 5 | 10 | 13 | 84.85 | 4.446 | 0.217 |
| Positive | 53 | 12 | 20 | 10 | 79.25 | ||
| HER-2 | |||||||
| Negative | 31 | 7 | 10 | 10 | 87.10 | 1.688 | 0.640 |
| Positive | 55 | 10 | 20 | 13 | 78.18 | ||
| Molecular types | |||||||
| Luminal A | 17 | 6 | 6 | 2 | 82.35 | 13.884 | 0.126 |
| Luminal B | 44 | 9 | 17 | 9 | 79.55 | ||
| HER-2+ | 12 | 1 | 4 | 4 | 75.00 | ||
| Basal-like | 13 | 1 | 3 | 8 | 92.31 | ||
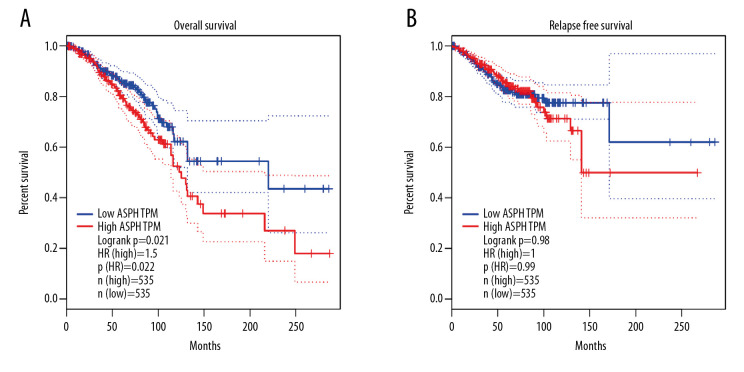
Analysis of 1070 BC samples carrying the BRCA gene in GEPIA showed lower overall survival in patients with high ASPH expression compared to those with low ASPH expression, using a group cutoff of median expression. The difference in relapse-free survival was not significant between the 2 groups (Figure 3).
Figure 3.
Kaplan-Meier estimates of (A) overall survival and (B) relapse-free survival for patients with breast cancer (BC), stratified by aspartate β-hydroxylase (ASPH) expression.
Screening and analysis of ASPH-related genes
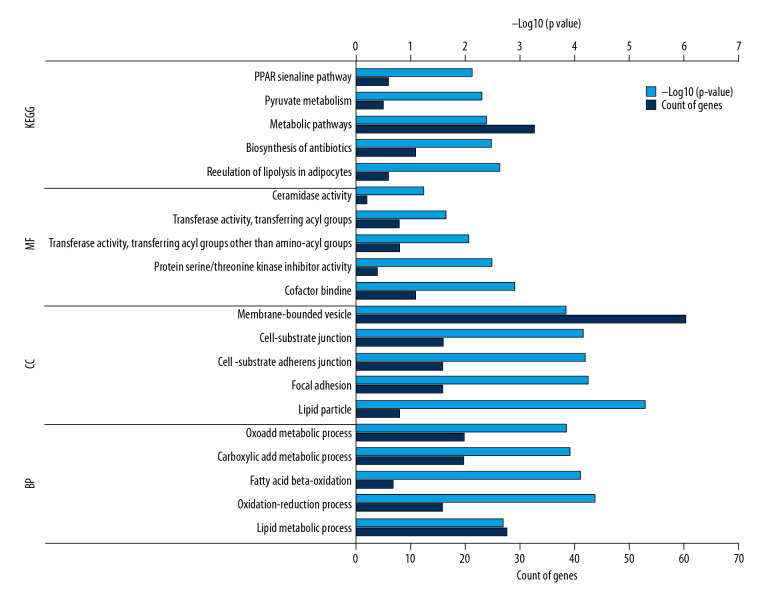
Screening and analysis of ASPH-related genes were based on 254 coexpression genes, of which 35 genes were found in GOBO, 197 in GEPIA, and 25 in cBioPortal. DAVID software was used to perform functional and pathway enrichment analysis. Enrichment analysis identified pathways including 3 types of biological processes, cellular components, and molecular functions. Data outputs from the Kyoto Encyclopedia of Genes and Genomes (KEGG) are shown in Table 2 and Figure 4.
Table 2.
The top 5 GO and KEGG pathway analysis of coexpressed genes associated with aspartate β-hydroxylase (ASPH).
| Category | Term | Description | Count | P-value |
|---|---|---|---|---|
| GOTERM_BP | GO: 0006629 | Lipid metabolic process | 28 | 1.96E-05 |
| GOTERM_BP | GO: 0055114 | Oxidation-reduction process | 16 | 4.08E-05 |
| GOTERM_BP | GO: 0006635 | Fatty acid beta-oxidation | 7 | 7.57E-05 |
| GOTERM_BP | GO: 0019752 | Carboxylic acid metabolic process | 20 | 0.000119 |
| GOTERM_BP | GO: 0043436 | Oxoacid metabolic process | 20 | 0.000135 |
| GOTERM_CC | GO: 0005811 | Lipid particle | 8 | 4.83E-06 |
| GOTERM_CC | GO: 0005925 | Focal adhesion | 16 | 5.55E-05 |
| GOTERM_CC | GO: 0005924 | Cell-substrate adherens junction | 16 | 6.24E-05 |
| GOTERM_CC | GO: 0030055 | Cell-substrate junction | 16 | 6.73E-05 |
| GOTERM_CC | GO: 0031988 | Membrane-bounded vesicle | 61 | 0.000139 |
| GOTERM_MF | GO: 0048037 | Cofactor binding | 11 | 0.001212 |
| GOTERM_MF | GO: 0030291 | Protein serine/threonine kinase inhibitor activity | 4 | 0.003229 |
| GOTERM_MF | GO: 0016747 | Transferase activity, transferring acyl groups other than amino-acyl groups | 8 | 0.008737 |
| GOTERM_MF | GO: 0016746 | Transferase activity, transferring acyl groups | 8 | 0.022229 |
| GOTERM_MF | GO: 0017040 | Ceramidase activity | 2 | 0.05641 |
| KEGG_PATHWAY | cfa04923 | Regulation of lipolysis in adipocytes | 6 | 0.002 |
| KEGG_PATHWAY | cfa01130 | Biosynthesis of antibiotics | 11 | 0.003 |
| KEGG_PATHWAY | cfa01100 | Metabolic pathways | 33 | 0.004 |
| KEGG_PATHWAY | cfa00620 | Pyruvate metabolism | 5 | 0.005 |
| KEGG_PATHWAY | cfa03320 | PPAR signaling pathway | 6 | 0.007 |
Figure 4.
The top 5 GO terms and KEGG enriched pathways. The horizontal axis represents the count of the enriched genes and P value; the vertical axis represents the enriched GO terms and KEGG pathway. KEGG – Kyoto Encyclopedia of Gene and Genomes; GO – gene ontology; MF – molecular function; CC – cellular component; BP – biological processes.
Construction of a PPI network and selection of hub genes
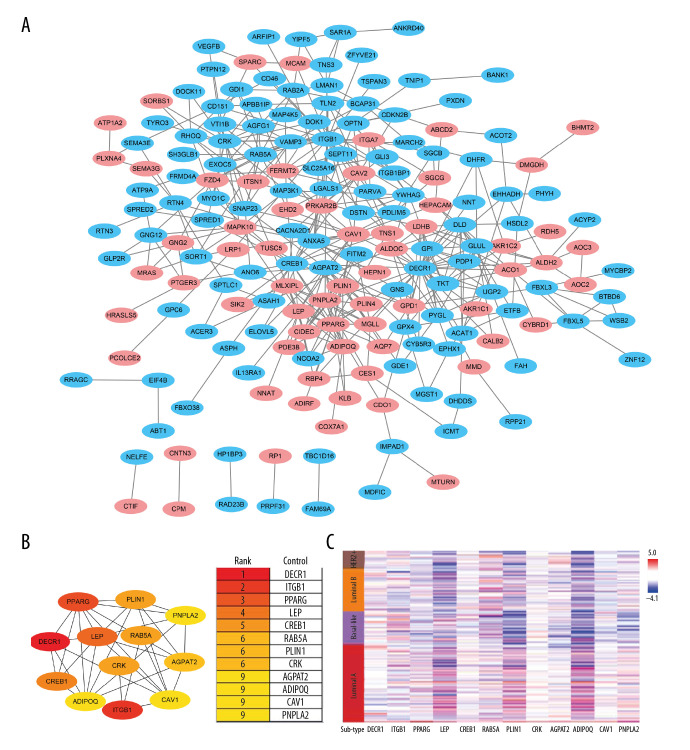
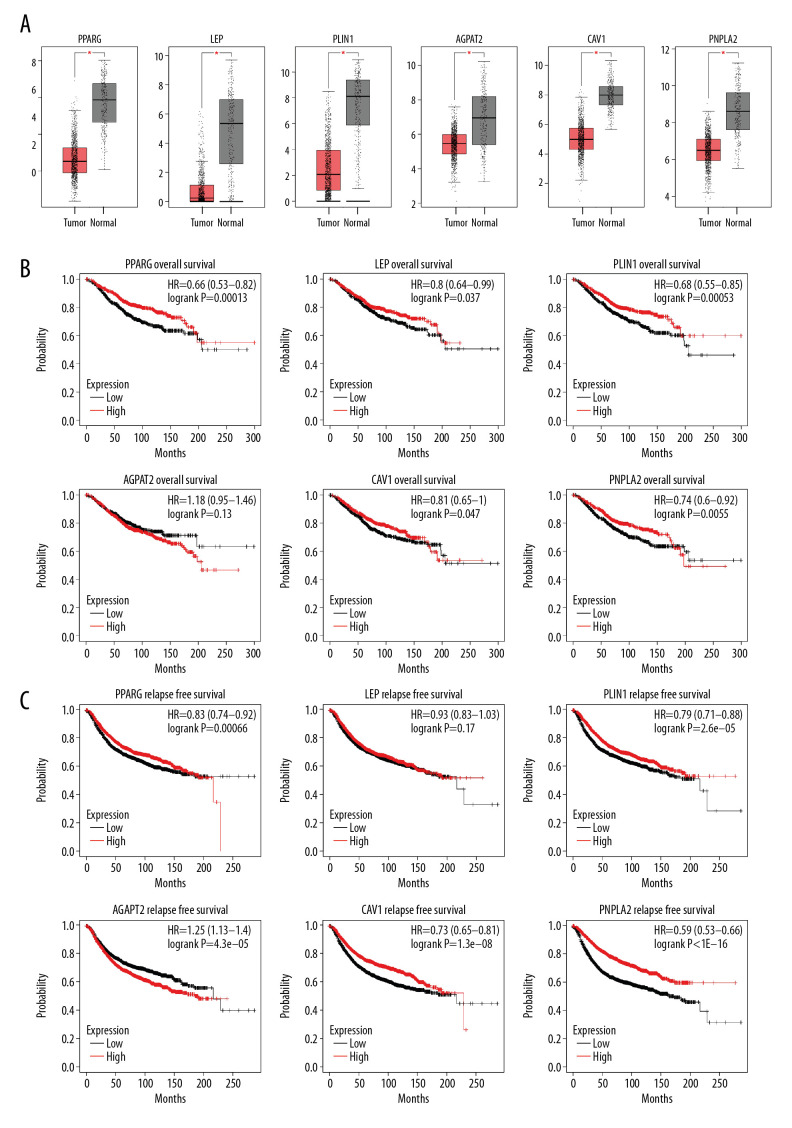
Interactions between the 254 coexpression genes were detected using the Cytoscape software following STRING analysis with a combined score of >0.4. The PPI network of the coexpressed genes consisted of 186 nodes and 425 edges. Of these, 91 genes were differentially expressed in BC (Figure 5A). CytoHubba analysis identified 12 hub genes (Figure 5B). The correlation of molecular subtypes with hub genes was visualized using heat map analysis (Figure 5C). Of the 12 hub genes, 6 were downregulated in BC tissues (Figure 6A). Survival analysis with the Kaplan-Meier Plotter revealed that patients with high AGPAT2 expression had a poor prognosis. Also, patients with low expression of PPARG, LEP, PLIN1, CAV1, and PNPLA2 had a poor prognosis (Figure 6B, 6C).
Figure 5.
Protein-protein interaction (PPI) network of the aspartate β-hydroxylase (ASPH)-correlated genes. (A) The PPI network for coexpressed genes constructed using Cytoscape. Pink dots represented the strong ASPH-correlated genes. (B) The rank of the degree of gene connectivity using the cytoHubba plugin represented by different degrees of color (from red to yellow). (C) Heat map analysis showing the correlation of molecular subtypes with the hub genes.
Figure 6.
(A) Expression of hub genes in breast cancer (BC) tissues and (B) the overall survival and (C) relapse-free survival curves using the Kaplan-Meier Plotter online platform. * P<0.05 was considered statistically significant.
Discussion
During tumor progression in BC, many biomarkers are overexpressed, including H3K9-specific histone methyltransferase and SETDB1 [23]. ASPH is a highly conserved β-dioxygenase enzyme which is sequestered in normal adult tissues. ASPH is overexpressed in a variety of cancer types, including non-small cell lung, pancreatic, cholangiocarcinoma [12,19], hepatocellular [13], and colorectal cancer [12]. ASPH overexpression promotes tumor cell invasion and migration [24]. The specific small molecular inhibitor MO-I-1182 inhibits cancer migration and invasion by targeting ASPH [11,13,19]. Activation of the Notch cascade by ASPH has been shown to promote tumor progression in BC [11]. The pro-tumor activities of ASPH-mediated Notch activation lead to poor prognosis in lung, thyroid, pancreatic, renal, and cervical cancers (protein atlas database: https://www.proteinatlas.org/ENSG00000198363-ASPH) [25,26]. Also, ASPH can activate other growth factor signaling pathways, such as WNT/β-catenin and IN/IGF1/IRS1/PI3K/AKT [26,27], which have been implicated in the development and progression of other malignancies.
In the present study, we hypothesized that ASPH could be used as a prognostic biomarker in BC patients and explored the expression and possible mechanisms of ASPH. Similar to the results of a previous study [11], we found ASPH overexpression in BC tissues, particularly in invasive BC tissues, in which it was significantly upregulated and correlated with lymph node involvement and TNM stage. Furthermore, patients with high ASPH expression showed poor overall survival. However, we found no significant differences among different BC molecular subtypes (Luminal, HER2 amplified, or TNBC), which is in contrast to the results of the previously published study [11]. This may have been due to the relatively small number of samples analyzed in our study.
Gene ontology (GO) analysis showed that differences in the biological processes of coexpressed genes were significantly enriched for lipid metabolism, oxidation-reduction, fatty acid beta-oxidation, carboxylic acid metabolism, and oxoacid metabolic processes. Changes in the cell components of coexpressed genes were mainly enriched in lipid particles, focal adhesion, cell-substrate adherent junctions, cell-substrate junctions, and membrane-bounded vesicles. Changes in the molecular function were mainly enriched in cofactor binding, protein serine/threonine kinase inhibitor activity, and transferase activity. KEGG pathway analysis revealed that coexpressed genes were mainly enriched in processes including the regulation of lipolysis in adipocytes, the biosynthesis of antibiotics, metabolic pathways, pyruvate metabolism and the PPAR signaling pathway. Interestingly, both lipid and carboxylic acid metabolism are important in BC progression [28]. Also, ASPH is thought to play an important role in calcium homeostasis, which can regulate oxidative phosphorylation and impact the structure and function of cells. Therefore, ASPH and coexpressed genes may have important roles in BC development, mediated by several complex molecular mechanisms.
Six hub genes, namely, PPARG, LEP, PLIN1, AGPAT2, CAV1, and PNPLA2, formed a PPI network. These hub genes were significantly downregulated in BC tissue compared to in adjacent normal tissue. Previous studies have shown that these genes are involved in the development of BC. PPARG, peroxisome proliferator-activated receptor-gamma, is an important part of the PPAR signaling pathway, which participates in tumor pathology [29]. PPARG is related to chemoresistance in BC [30], which is consistent with the survival analysis of the present study. Also, LEP expression is low in BC. High levels of LEP expression were associated with good prognosis in our study, which differed from an earlier report indicating LEP overexpression in BC [31]. PLIN1 promotes BC cell proliferation and migration [32]. CAV1 plays a key role in the stress response of BC cells by regulating lysosomal function and autophagy [33]. The biological processes of AGPAT2 and PNPLA2 are closely related to fat metabolism [34,35], which is consistent with the enrichment of this pathway analysis in the present study. These results show that the hub genes and ASPH may play important roles in the development of BC. However, it is unclear whether the above hub genes directly interact with ASPH. Further evaluation of the potential role of the hub genes identified in this study is needed.
Conclusions
High ASPH expression was strongly correlated with poor prognosis in BC samples, suggesting that ASPH is a promising prognostic biomarker. The functional roles of ASPH and its coexpressed hub genes may be potential therapeutic targets in the treatment of BC.
Supplementary Data
mRNA expression levels of aspartate β-hydroxylase (ASPH) in various cancer types. The dataset was retrieved from the Oncomine database. The number of analyses meeting the thresholds is shown in the cells. The color of the cell is dependent on the gene rank. Dark red represents genes that were significantly upregulated, and dark blue represents genes that were significantly downregulated.
Footnotes
Source of support: Medical and Health Science and Technology Development Plan Project of Shandong Province (2017WSA15057)
References
- 1.Bray F, Ferlay J, Soerjomataram I, et al. Global cancer statistics 2018: GLOBOCAN estimates of incidence and mortality worldwide for 36 cancers in 185 countries. Cancer J Clin. 2018;68:394–424. doi: 10.3322/caac.21492. [DOI] [PubMed] [Google Scholar]
- 2.Torre LA, Siegel RL, Ward EM, Jemal A. Global cancer incidence and mortality rates and trends – an update. Cancer Epidemiol Biomarkers Prev. 2016;25:16–27. doi: 10.1158/1055-9965.EPI-15-0578. [DOI] [PubMed] [Google Scholar]
- 3.DeSantis CE, Ma J, Goding Sauer A, et al. Breast cancer statistics, 2017, racial disparity in mortality by state. Cancer J Clin. 2017;67:439–48. doi: 10.3322/caac.21412. [DOI] [PubMed] [Google Scholar]
- 4.Miller KD, Siegel RL, Lin CC, et al. Cancer treatment and survivorship statistics, 2016. Cancer J Clin. 2016;66:271–89. doi: 10.3322/caac.21349. [DOI] [PubMed] [Google Scholar]
- 5.Jia H, Truica CI, Wang B, et al. Immunotherapy for triple-negative breast cancer: Existing challenges and exciting prospects. Drug Resist Update. 2017;32:1–15. doi: 10.1016/j.drup.2017.07.002. [DOI] [PubMed] [Google Scholar]
- 6.Meirson T, Gil-Henn H. Targeting invadopodia for blocking breast cancer metastasis. Drug Resist Update. 2018;39:1–17. doi: 10.1016/j.drup.2018.05.002. [DOI] [PubMed] [Google Scholar]
- 7.Cheang MC, Chia SK, Voduc D, et al. Ki67 index, HER2 status, and prognosis of patients with luminal B breast cancer. J Natl Cancer Inst. 2009;101:736–50. doi: 10.1093/jnci/djp082. [DOI] [PMC free article] [PubMed] [Google Scholar]
- 8.Gronke RS, VanDusen WJ, Garsky VM, et al. Aspartyl beta-hydroxylase: In vitro hydroxylation of a synthetic peptide based on the structure of the first growth factor-like domain of human factor IX. Proc Natl Acad Sci USA. 1989;86:3609–13. doi: 10.1073/pnas.86.10.3609. [DOI] [PMC free article] [PubMed] [Google Scholar]
- 9.Jia S, VanDusen WJ, Diehl RE, et al. cDNA cloning and expression of bovine aspartyl (asparaginyl) beta-hydroxylase. J Biol Chem. 1992;267:14322–27. [PubMed] [Google Scholar]
- 10.Yang H, Li J, Tang R, et al. The aspartyl (asparaginyl) beta-hydroxylase in carcinomas. Front Biosci (Landmark Ed) 2015;20:902–9. doi: 10.2741/4344. [DOI] [PubMed] [Google Scholar]
- 11.Lin Q, Chen X, Meng F, et al. ASPH-notch axis guided exosomal delivery of prometastatic secretome renders breast cancer multi-organ metastasis. Mol Cancer. 2019;18:156. doi: 10.1186/s12943-019-1077-0. [DOI] [PMC free article] [PubMed] [Google Scholar]
- 12.Benelli R, Costa D, Mastracci L, et al. Aspartate-beta-hydroxylase: A promising target to limit the local invasiveness of colorectal cancer. Cancers (Basel) 2020;12(4):971. doi: 10.3390/cancers12040971. [DOI] [PMC free article] [PubMed] [Google Scholar]
- 13.Zou Q, Hou Y, Wang H, et al. Hydroxylase activity of ASPH promotes hepatocellular carcinoma metastasis through epithelial-to-mesenchymal transition pathway. EBioMedicine. 2018;31:287–98. doi: 10.1016/j.ebiom.2018.05.004. [DOI] [PMC free article] [PubMed] [Google Scholar]
- 14.Xu L, Ma Y, Zhang H, et al. HMGA2 regulates circular RNA ASPH to promote tumor growth in lung adenocarcinoma. Cell Death Dis. 2020;11:593. doi: 10.1038/s41419-020-2726-3. [DOI] [PMC free article] [PubMed] [Google Scholar]
- 15.Ogawa K, Lin Q, Li L, et al. Prometastatic secretome trafficking via exosomes initiates pancreatic cancer pulmonary metastasis. Cancer Lett. 2020;481:63–75. doi: 10.1016/j.canlet.2020.02.039. [DOI] [PMC free article] [PubMed] [Google Scholar]
- 16.Ogawa K, Lin Q, Li L, et al. Aspartate beta-hydroxylase promotes pancreatic ductal adenocarcinoma metastasis through activation of SRC signaling pathway. J Hematol Oncol. 2019;12:144. doi: 10.1186/s13045-019-0837-z. [DOI] [PMC free article] [PubMed] [Google Scholar]
- 17.Nagaoka K, Bai X, Ogawa K, et al. Anti-tumor activity of antibody drug conjugate targeting aspartate-beta-hydroxylase in pancreatic ductal adenocarcinoma. Cancer Lett. 2019;449:87–98. doi: 10.1016/j.canlet.2019.02.006. [DOI] [PMC free article] [PubMed] [Google Scholar]
- 18.Barboro P, Benelli R, Tosetti F, et al. Aspartate beta-hydroxylase targeting in castration resistant prostate cancer modulates the NOTCH/HIF1alpha/GSK3beta crosstalk. Carcinogenesis. 2020 doi: 10.1093/carcin/bgaa053. [Online ahead of print] [DOI] [PubMed] [Google Scholar]
- 19.Nagaoka K, Ogawa K, Ji C, et al. Targeting aspartate beta-hydroxylase with the small molecule inhibitor MO-I-1182 suppresses cholangiocarcinoma metastasis. Dig Dis Sci. 2020 doi: 10.1007/s10620-020-06330-2. [Online ahead of print] [DOI] [PubMed] [Google Scholar]
- 20.Huang CK, Iwagami Y, Zou J, et al. Aspartate beta-hydroxylase promotes cholangiocarcinoma progression by modulating RB1 phosphorylation. Cancer Lett. 2018;429:1–10. doi: 10.1016/j.canlet.2018.04.041. [DOI] [PMC free article] [PubMed] [Google Scholar]
- 21.Shimoda M, Hori A, Wands JR, et al. Endocrine sensitivity of estrogen receptor-positive breast cancer is negatively correlated with aspartate-β-hydroxylase expression. Cancer Sci. 2017;108:2454–61. doi: 10.1111/cas.13416. [DOI] [PMC free article] [PubMed] [Google Scholar]
- 22.Rhodes DR, Kalyana-Sundaram S, Mahavisno V, et al. Oncomine 3.0: Genes, pathways, and networks in a collection of 18,000 cancer gene expression profiles. Neoplasia (New York, NY) 2007;9:166–80. doi: 10.1593/neo.07112. [DOI] [PMC free article] [PubMed] [Google Scholar]
- 23.Zhou Z, Wu B, Tang X, et al. High SET domain bifurcated 1 (SETDB1) expression predicts poor prognosis in breast carcinoma. Med Sci Mon Int Med J Exp Clin Res. 2020;26:e922982. doi: 10.12659/MSM.922982. [DOI] [PMC free article] [PubMed] [Google Scholar]
- 24.Hou G, Xu B, Bi Y, et al. Recent advances in research on aspartate beta-hydroxylase (ASPH) in pancreatic cancer: A brief update. Bosn J Basic Med Sci. 2018;18:297–304. doi: 10.17305/bjbms.2018.3539. [DOI] [PMC free article] [PubMed] [Google Scholar]
- 25.Cantarini MC, de la Monte SM, Pang M, et al. Aspartyl-asparagyl beta hydroxylase over-expression in human hepatoma is linked to activation of insulin-like growth factor and notch signaling mechanisms. Hepatology (Baltimore, MD) 2006;44:446–57. doi: 10.1002/hep.21272. [DOI] [PubMed] [Google Scholar]
- 26.Aihara A, Huang CK, Olsen MJ, et al. A cell-surface β-hydroxylase is a biomarker and therapeutic target for hepatocellular carcinoma. Hepatology (Baltimore, MD) 2014;60:1302–13. doi: 10.1002/hep.27275. [DOI] [PMC free article] [PubMed] [Google Scholar]
- 27.Tomimaru Y, Koga H, Yano H, et al. Upregulation of T-cell factor-4 isoform-responsive target genes in hepatocellular carcinoma. Liver Int. 2013;33:1100–12. doi: 10.1111/liv.12188. [DOI] [PMC free article] [PubMed] [Google Scholar]
- 28.Slebe F, Rojo F, Vinaixa M, et al. FoxA and LIPG endothelial lipase control the uptake of extracellular lipids for breast cancer growth. Nat Commun. 2016;7:11199. doi: 10.1038/ncomms11199. [DOI] [PMC free article] [PubMed] [Google Scholar]
- 29.Aihara A, Huang CK, Olsen MJ, et al. A cell-surface β-hydroxylase is a biomarker and therapeutic target for hepatocellular carcinoma. Hepatology (Baltimore, MD) 2014;60:1302–13. doi: 10.1002/hep.27275. [DOI] [PMC free article] [PubMed] [Google Scholar]
- 30.Wu T, Wang X, Li J, et al. Identification of personalized chemoresistance genes in subtypes of basal-like breast cancer based on functional differences using pathway analysis. PLoS One. 2015;10:e0131183. doi: 10.1371/journal.pone.0131183. [DOI] [PMC free article] [PubMed] [Google Scholar]
- 31.Tayel SI, Alhanafy AM, Ahmed SM, et al. Biochemical study on modifying role of variants of leptin gene and its receptor on serum leptin levels in breast cancer. Mol Biol Rep. 2020;47:3807–20. doi: 10.1007/s11033-020-05436-0. [DOI] [PubMed] [Google Scholar]
- 32.Lu C, Wang X, Zhao X, et al. Long non-coding RNA ARAP1-AS1 accelerates cell proliferation and migration in breast cancer through miR-2110/HDAC2/PLIN1 axis. Biosci Rep. 2020;40(4):BSR20191764. doi: 10.1042/BSR20191764. [DOI] [PMC free article] [PubMed] [Google Scholar]
- 33.Shi Y, Tan SH, Ng S, et al. Critical role of CAV1/caveolin-1 in cell stress responses in human breast cancer cells via modulation of lysosomal function and autophagy. Autophagy. 2015;11:769–84. doi: 10.1080/15548627.2015.1034411. [DOI] [PMC free article] [PubMed] [Google Scholar]
- 34.Cruz-Color L, Hernández-Nazará ZH, Maldonado-González M, et al. Association of the PNPLA2, SCD1 and leptin expression with fat distribution in liver and adipose tissue from obese subjects. Exp Clin Endocrinol Diabetes. 2019 doi: 10.1055/a-0829-6324. [Online ahead of print] [DOI] [PubMed] [Google Scholar]
- 35.Cautivo KM, Lizama CO, Tapia PJ, et al. AGPAT2 is essential for postnatal development and maintenance of white and brown adipose tissue. Mol Metab. 2016;5:491–505. doi: 10.1016/j.molmet.2016.05.004. [DOI] [PMC free article] [PubMed] [Google Scholar]
- 36.Ma XJ, Dahiya S, Richardson E, et al. Gene expression profiling of the tumor microenvironment during breast cancer progression. Breast Cancer Res. 2009;11:R7. doi: 10.1186/bcr2222. [DOI] [PMC free article] [PubMed] [Google Scholar]
- 37.Radvanyi L, Singh-Sandhu D, Gallichan S, et al. The gene associated with trichorhinophalangeal syndrome in humans is overexpressed in breast cancer. Proc Natl Acad Sci USA. 2005;102:11005–10. doi: 10.1073/pnas.0500904102. [DOI] [PMC free article] [PubMed] [Google Scholar]
- 38.Bonnefoi H, Potti A, Delorenzi M, et al. Validation of gene signatures that predict the response of breast cancer to neoadjuvant chemotherapy: A substudy of the EORTC 10994/BIG 00-01 clinical trial. Lancet Oncol. 2007;8:1071–78. doi: 10.1016/S1470-2045(07)70345-5. [DOI] [PubMed] [Google Scholar]
- 39.Zhao H, Langerod A, Ji Y, et al. Different gene expression patterns in invasive lobular and ductal carcinomas of the breast. Mol Biol Cell. 2004;15:2523–36. doi: 10.1091/mbc.E03-11-0786. [DOI] [PMC free article] [PubMed] [Google Scholar]
- 40.Esserman LJ, Berry DA, Cheang MC, et al. Chemotherapy response and recurrence-free survival in neoadjuvant breast cancer depends on biomarker profiles: results from the I-SPY 1 TRIAL (CALGB 150007/150012;ACRIN 6657) Breast Cancer Res Tr. 2012;132:1049–62. doi: 10.1007/s10549-011-1895-2. [DOI] [PMC free article] [PubMed] [Google Scholar]
Associated Data
This section collects any data citations, data availability statements, or supplementary materials included in this article.
Supplementary Materials
mRNA expression levels of aspartate β-hydroxylase (ASPH) in various cancer types. The dataset was retrieved from the Oncomine database. The number of analyses meeting the thresholds is shown in the cells. The color of the cell is dependent on the gene rank. Dark red represents genes that were significantly upregulated, and dark blue represents genes that were significantly downregulated.


