Abstract
Precursor states of Multiple Myeloma (MM) and its native tumor microenvironment need in-depth molecular characterization to better stratify and treat patients at risk. Using single-cell RNA sequencing of bone marrow cells from precursor stages, MGUS and smoldering myeloma (SMM), to full-blown MM alongside healthy donors, we demonstrate early immune changes during patient progression. We find NK cell abundance is frequently increased in early stages, and associated with altered chemokine receptor expression. As early as SMM, we show loss of GrK+ memory cytotoxic T-cells, and show their critical role in MM immunosurveillance in mouse models. Finally, we report MHC class II dysregulation in CD14+ monocytes, which results in T cell suppression in vitro. These results provide a comprehensive map of immune changes at play over the evolution of pre-malignant MM, which will help develop strategies for immune-based patient stratification.
Keywords: single-cell RNA sequencing, tumor microenvironment, immune microenvironment, plasma cells, multiple myeloma, MGUS, SMM
INTRODUCTION
The bone marrow (BM) plasma cell malignancy Multiple Myeloma (MM) remains an incurable disease1. Despite readily detectable precursor states of monoclonal gammopathy of undetermined significance (MGUS) and smoldering multiple myeloma (SMM)1–3, treatment is not administered until patients progress to MM. As the early pre-malignancy will not always lead to progression, treatment cannot be justified solely on this basis. Low and high-risk SMM exhibit 5-year progression rates of 15% and 70%, respectively, compared to a 20-year rate of 2% and 27% for low- and high-risk MGUS4,5. Therefore, further molecular characterization is required to accurately identify and intervent high-risk pre-malignant MM.
We learned that MGUS/SMM clones may already harbor chromosomal alterations that define MM (translocations involving IgH or hyperdiploidy2,6) and that progression is driven by the acquisition of events like MYC translocations, 1q gains and TP53 mutations7,8. However, not all MGUS/SMM patients with a similar genetic makeup eventually progress to MM, implying further non-genomic alterations may be required for disease progression4,9–11. Indeed, it is becoming more recognized that tumors represent complex ecosystems12. Not only can tumor behavior be regulated by the extracellular milieu13–15, emerging evidence documents that compositional and expression changes of individual immune and stromal components correlate with disease subtypes, prognostic and therapeutic outcomes in breast, colorectal and other solid cancers16–20.
Prior studies have confirmed that the BM microenvironment in MM includes dysregulation in receptor signaling21, cytokine expression21,22 and numerical alterations in T, NK and dendritic cells23–26. MM cells induce an immunosuppression, which comprises expansion of regulatory T cells (Tregs)27,28, myeloid derived suppressor cells (MDSCs)29,30, tumor-associated macrophages31,32, and dysfunction of NK cells33. The alterations in the microenvironment have been linked to reduced anti-tumor responses, induction of angiogenesis, chemotherapy resistance and progression27,31,34,35.
Here, we use single-cell transcriptomics to dissect the immune microenvironment in the BM of MGUS, SMM and overt MM as compared to healthy donors. We observe that the tumor microenvironment exhibits substantial alterations beginning at the MGUS stage, with increased populations of NK-, T cells and non-classical monocytes. Among T cells, we observe an early accumulation of regulatory and gamma-delta T cells, followed by loss of CD8+ memory populations and elevation of IFN signaling at the SMM stage. We demonstrate the critical importance of memory cells for MM immunosurveillance. In CD14+ monocytes we find dysregulated expression of MHC type II genes. We show that MM cells lead to loss of antigen presentation, inducing a T cell suppressive phenotype in monocytes. Together, our results characterize transcriptional and compositional changes occurring in BM compartment during MM progression. They hint at mechanisms of anti-tumor immune response and immune evasion. Importantly, the immune patterns observed are often heterogeneous across patients, and thus may prove important biomarkers for risk assessment and therapeutic strategies for prevention of progression in MM.
RESULTS
To better understand the changes occurring in the tumor microenvironment during MM progression, we performed single-cell RNA sequencing (10xGenomics) on BM aspirates from patients at varying stages of progression. We sequenced ~19K CD45+/CD138− cells from the microenvironment (~15K from MM stages) from patients with MGUS (n=5 patients), low-risk SMM (SMMl; n=3), high-risk SMM (SMMh; n=8) and newly diagnosed MM (n=7), as well as 9 healthy donors (NBM, n=9; Supplemental Table 1, 2). One patient contributed sequential samples (SMMl-1 & MM-8). Patients with SMM were stratified by risk of progression into low (SMMl) and high (SMMh), based on the Mayo clinic established criteria10,36.
The CD45+CD138− subset was isolated using magnetic bead sorting of the BM samples and further in silico cell filtering based on gene expression (Experimental procedures). By clustering the cells based on expression profile we isolated 21 subpopulations. Using (i) the expression of known marker genes (Extended Data Fig. 1); and (ii) finding the top differentially expressed genes for each cluster (Supplemental Table 3), we classified our clusters with 10 broad cell types, ranging from hematopoietic progenitor cells and pre-B cells to mature populations engaged in immune response (Figure 1A).
Figure 1. The immune landscape in healthy and MM samples.
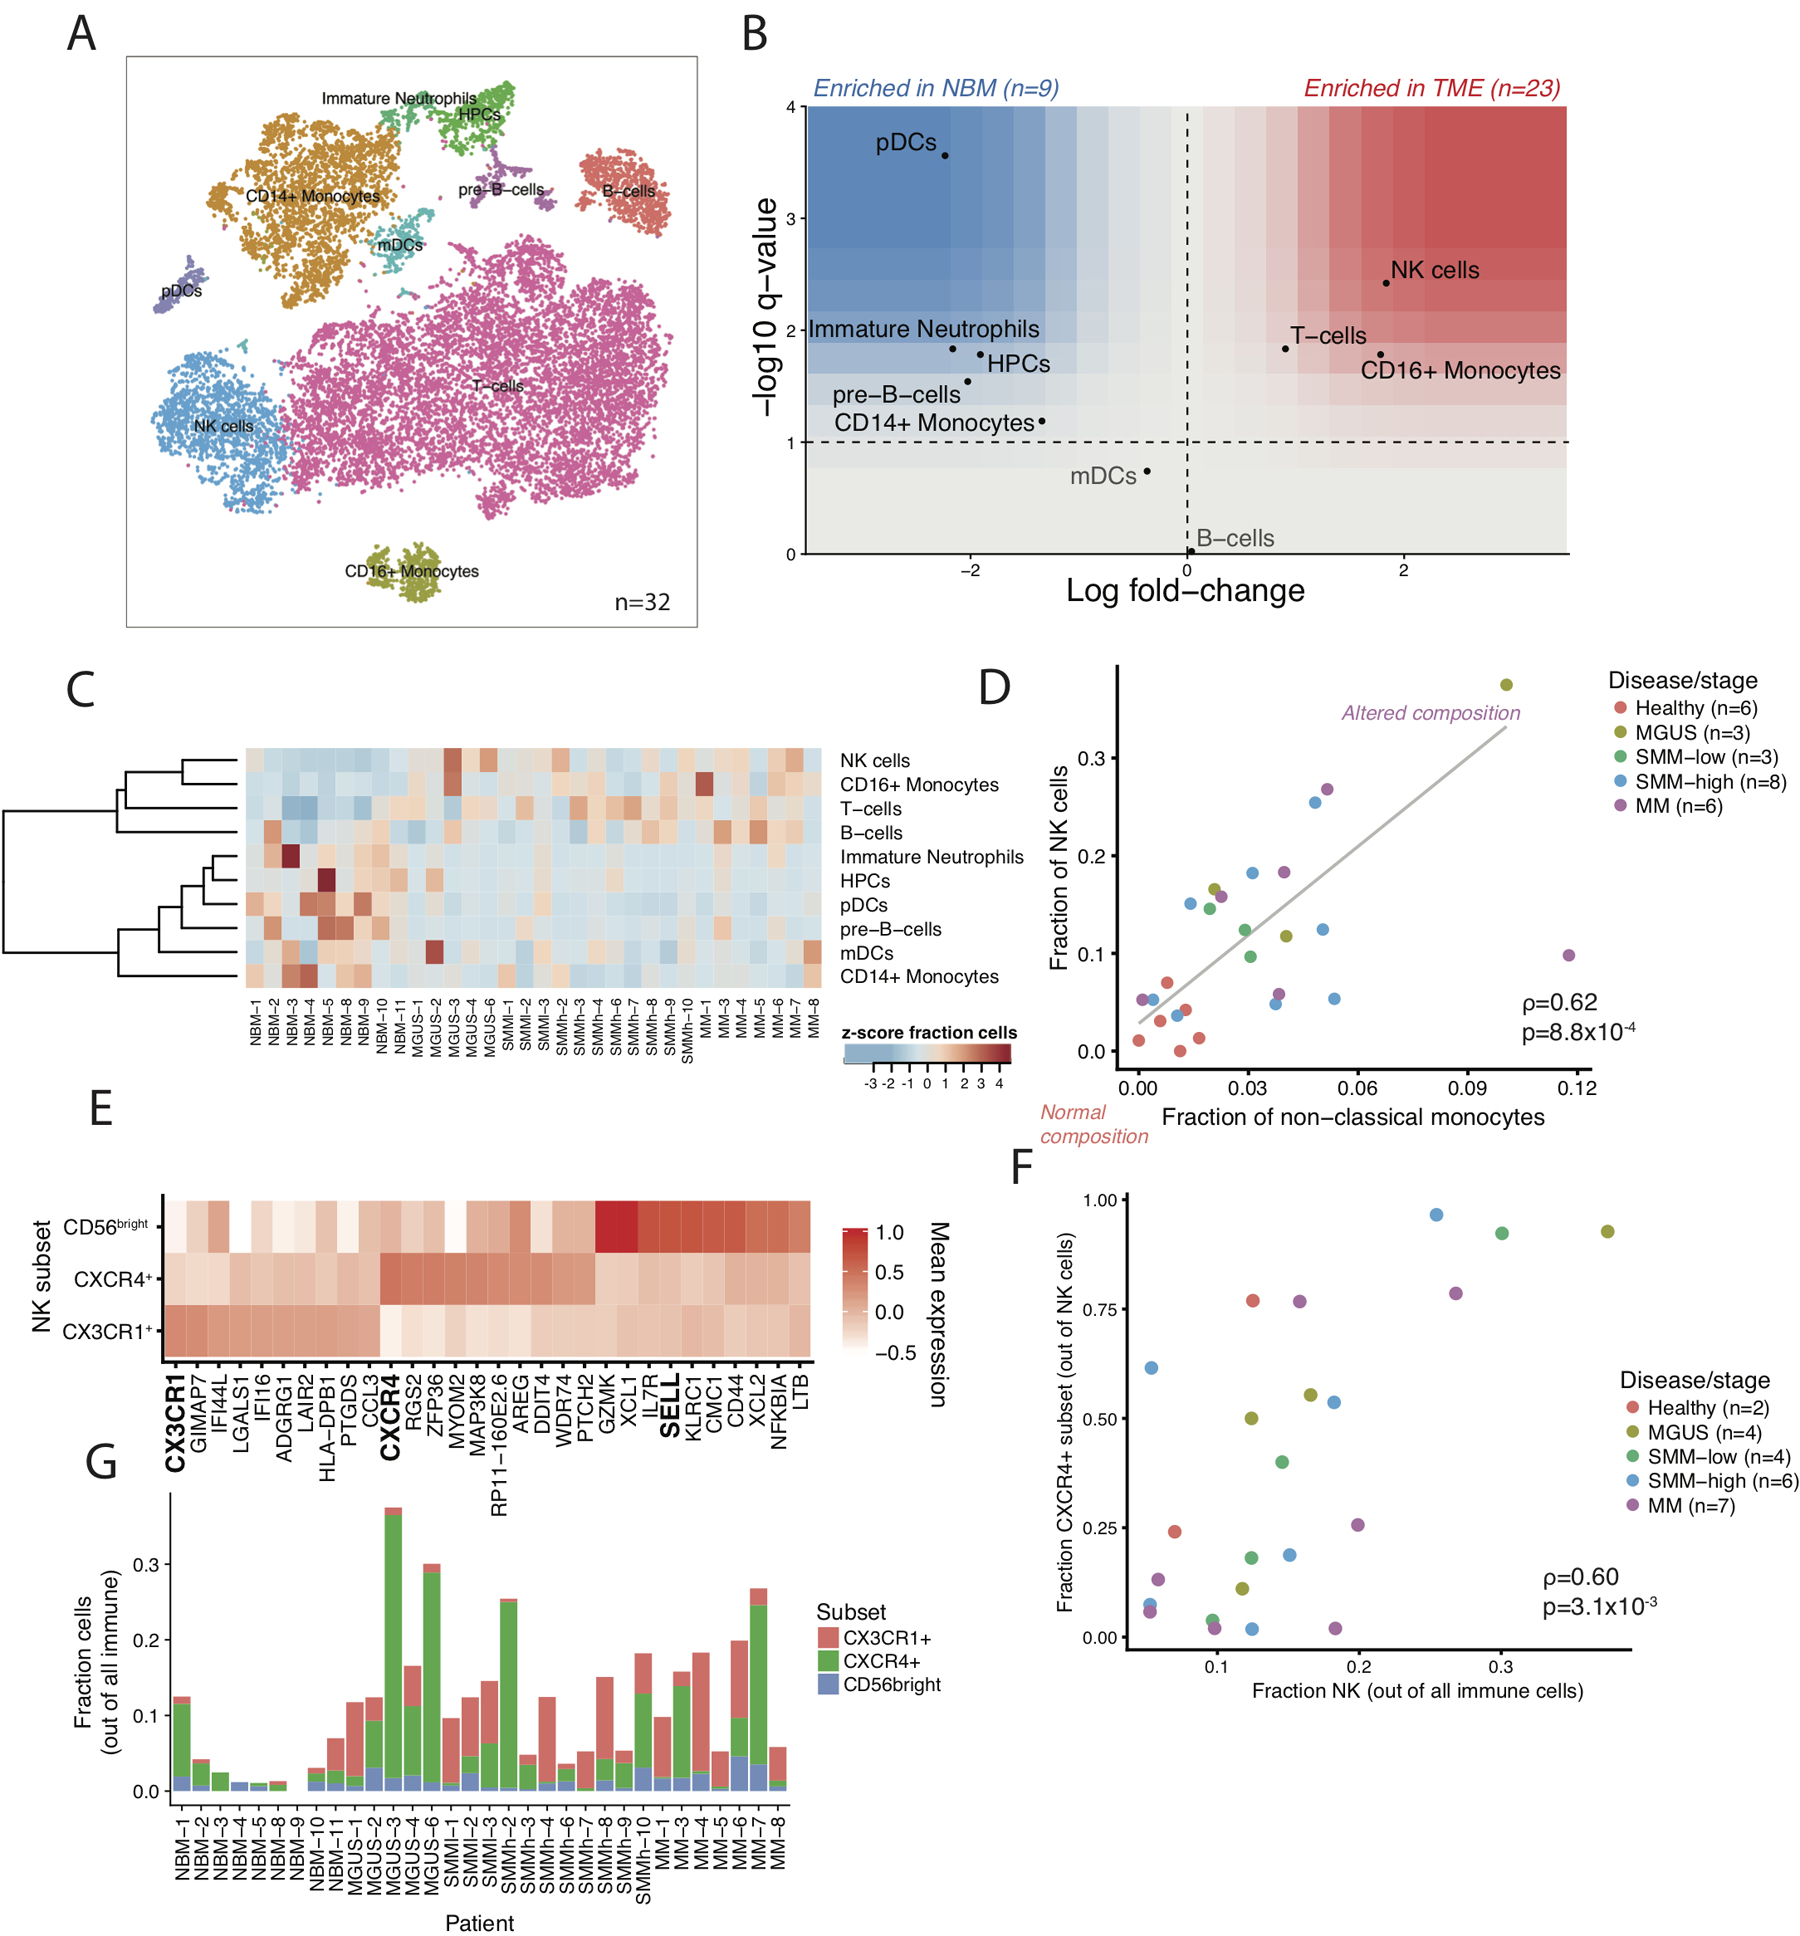
(A) tSNE representation of immune cells identified in CD45+ population. (B) Immune composition changes between normal and cancer samples. For each cell type, the log fold- change in mean cell fraction between tumor and normal samples, with -log10 Benjamin-Hochberg corrected two-sided Wilcoxon rank sum p- values on the y-axis using n=32 patient samples. (C) Distribution of different cell types in CD45+ fraction for individual patients and healthy donors. Cell type fractions are z-standardized across patients. (D) Proportion of NK cells correlated with numbers of non-classical monocyte cell fractions indicating inflammatory environment in patients as compared to healthy controls. Only samples with at least 200 total cells are shown. Correlation is assessed by Spearman coefficient on n=26 patient samples. (E) Distribution of NK cell subsets in the BM microenvironment. Heatmap shows the mean expression of highly represented individual marker genes per cluster. (F) Scatter plot of the fraction of NK cells in a given patient that are CXCR4+ vs the fraction of all immune cells that are NK. Only samples with at least 50 NK cells are shown. Correlation is assessed by Spearman coefficient on n=23 patient samples. (G) Proportion of distinct NK-cell subsets per sample. Samples with high NK-cell enrichment are largely composed of the CXCR4+ subtype. Only samples with at least 50 NK cells are shown on n=23 patient samples.
Compositional Alterations in the Microenvironment Occur Early in MM Progression
To investigate the relative contribution of different cell types to the microenvironmental repertoire across different stages of disease, we searched for populations that were enriched on average in the tumor samples compared to normal. Consistent with previous data23–26, we observed a significant enrichment in NK, T, and CD16+ cells in the diseased BM, as well as a relative decrease in plasmacytoid DCs, immature neutrophils, CD14+ monocytes and other progenitor cells (Figure 1B–C). Several of these alterations could already be observed as early as the MGUS stage. Interestingly, the degree of this compositional shift was not uniform across patients. While healthy BM samples universally had <2% CD16+ macrophages and <10% NK cells, tumor samples occupied a spectrum from unaltered compositions to ~12% CD16+ macrophages and ~40% NK cells. These changes were observed independent of disease stage or tumor burden, suggesting they were mediated by the properties of the tumor itself or the immune response of the individual patients (Figure 1C). In particular, NK cell fractions correlated with the proportion of non-classical monocytes and this relationship did not correspond to the cytogenetic characteristics of the tumor, disease stage or tumor burden (Figure 1D).
NK levels were mostly elevated in patients with IgG-secreting tumors, which given their interaction with IgG via Fc receptor III in normal physiology37, could indicate a reason for their presence or be a factor in their failure to clear the disease (Extended Data Fig. 2A). Furthermore, samples with overall increases in NK cells were accompanied by a shift in their phenotype. Subclustering of NK cells revealed three populations: a CXCR4+, a CX3CR1+/CCL3+ and a less frequent IL7R+CD62L+ population (markers of the classical immature CD56bright subset38). Notably, we observed a correlation between the overall fraction of NK cells in a given sample and the representation of the CXCR4+ subset (spearman ⍴=0.60, 95% bootstrapped CI [0.18,0.86] n=23, samples with >=5% NK cells, Figure 1E–G, Extended Data Fig. 2B). Samples with enrichment (greater than median) for NK cell frequency also had significant enrichment for the CXCR4+ subset (Fisher exact test p=0.012 n=23), while samples with lower NK cell frequencies displayed a shift towards the CX3CR1+ subset (Extended Data Fig. 2C). The current understanding is that CXCR4 is required for NK homing towards CXCL12-producing cells in the BM and signifies the less mature NK cells, while CX3CR1-expression causes migration towards BM sinusoids, leading to egress from the BM39. This suggests chemotactic relocalization could be the basis for the observed heterogeneity in NK cell frequency.
To further validate the compositional changes observed in our sequencing data, we performed simultaneous deep phenotyping of viably frozen BM aspirates of MGUS, SMM and MM patients (n=13) and healthy BM controls (n=4) using Mass Cytometry By Time-of-Flight (CyTOF). Overall, CyTOF data correlated with the RNA-sequencing results (Extended Data Fig. 3A–C). We did observe significantly lower neutrophil output from 10xGenomics assay, as compared to CyTOF data. While in CyTOF neutrophils represented 8%−50% of live cells in the BM (Extended Data Fig. 3D), the 10xGenomics-cell distribution favors T cells and monocytes. Due to low mRNA content in mature neutrophils, they may not be distinguishable as cells in scRNA data from empty droplets with ambient RNA. This type of bias, however, decreases neutrophil counts in both healthy and MM samples, and thus should not alter the results for comparisons of a given cell type across samples.
Composition of Non-cytotoxic T cells Shows Increased Treg Numbers and Patient-specific Heterogeneity
To delve deeper into the T cell subtypes and states, we used two complementary approaches. Firstly, we performed additional subclustering at higher resolution using genes variably expressed among T cells, resulting in 12 subclusters (Figure 2). Then, because activation of continuous gene expression modules may not be captured by discrete clustering, we used the Bayesian variant of non-negative matrix factorization to extract seven expression signatures (Figure 3). First, we examined the non-cytotoxic subsets marked by high expression of signature T-sig1 (Figure 3A). T cell clusters distinguished by the T-sig1 included three CCR7-expressing naive CD4 subsets, two populations of CD4 helper cells, and a population of Tregs (Figure 2A–C). An additional cluster of CD4 helper cells showed upregulated interferon (IFN) type I-activated genes, and indeed in our signature analysis we found a corresponding signature of interferon response that was highly upregulated in five late stage samples (T-sig2, Figure 4A, 1 SMMh and four MM). In addition, as described before27,28, we see a significant upregulation of Tregs in the diseased microenvironment (Figure 2D–E, q=0.0005 df=26.1, BH-corrected t-test of NBM vs. disease samples). Interestingly, transcriptional profiles of Tregs demonstrate high expression of MHC type II proteins, which have been reported to inhibit T cell proliferation and cytokine production via an early contact-dependent mechanism40. Additionally, we observed our patient with sequential samples to have CD4+ subsets that express corticotropin-releasing hormone (CRH), which promotes inflammation41.
Figure 2. Heterogeneous composition of T cells in diseased bone marrow microenvironment.
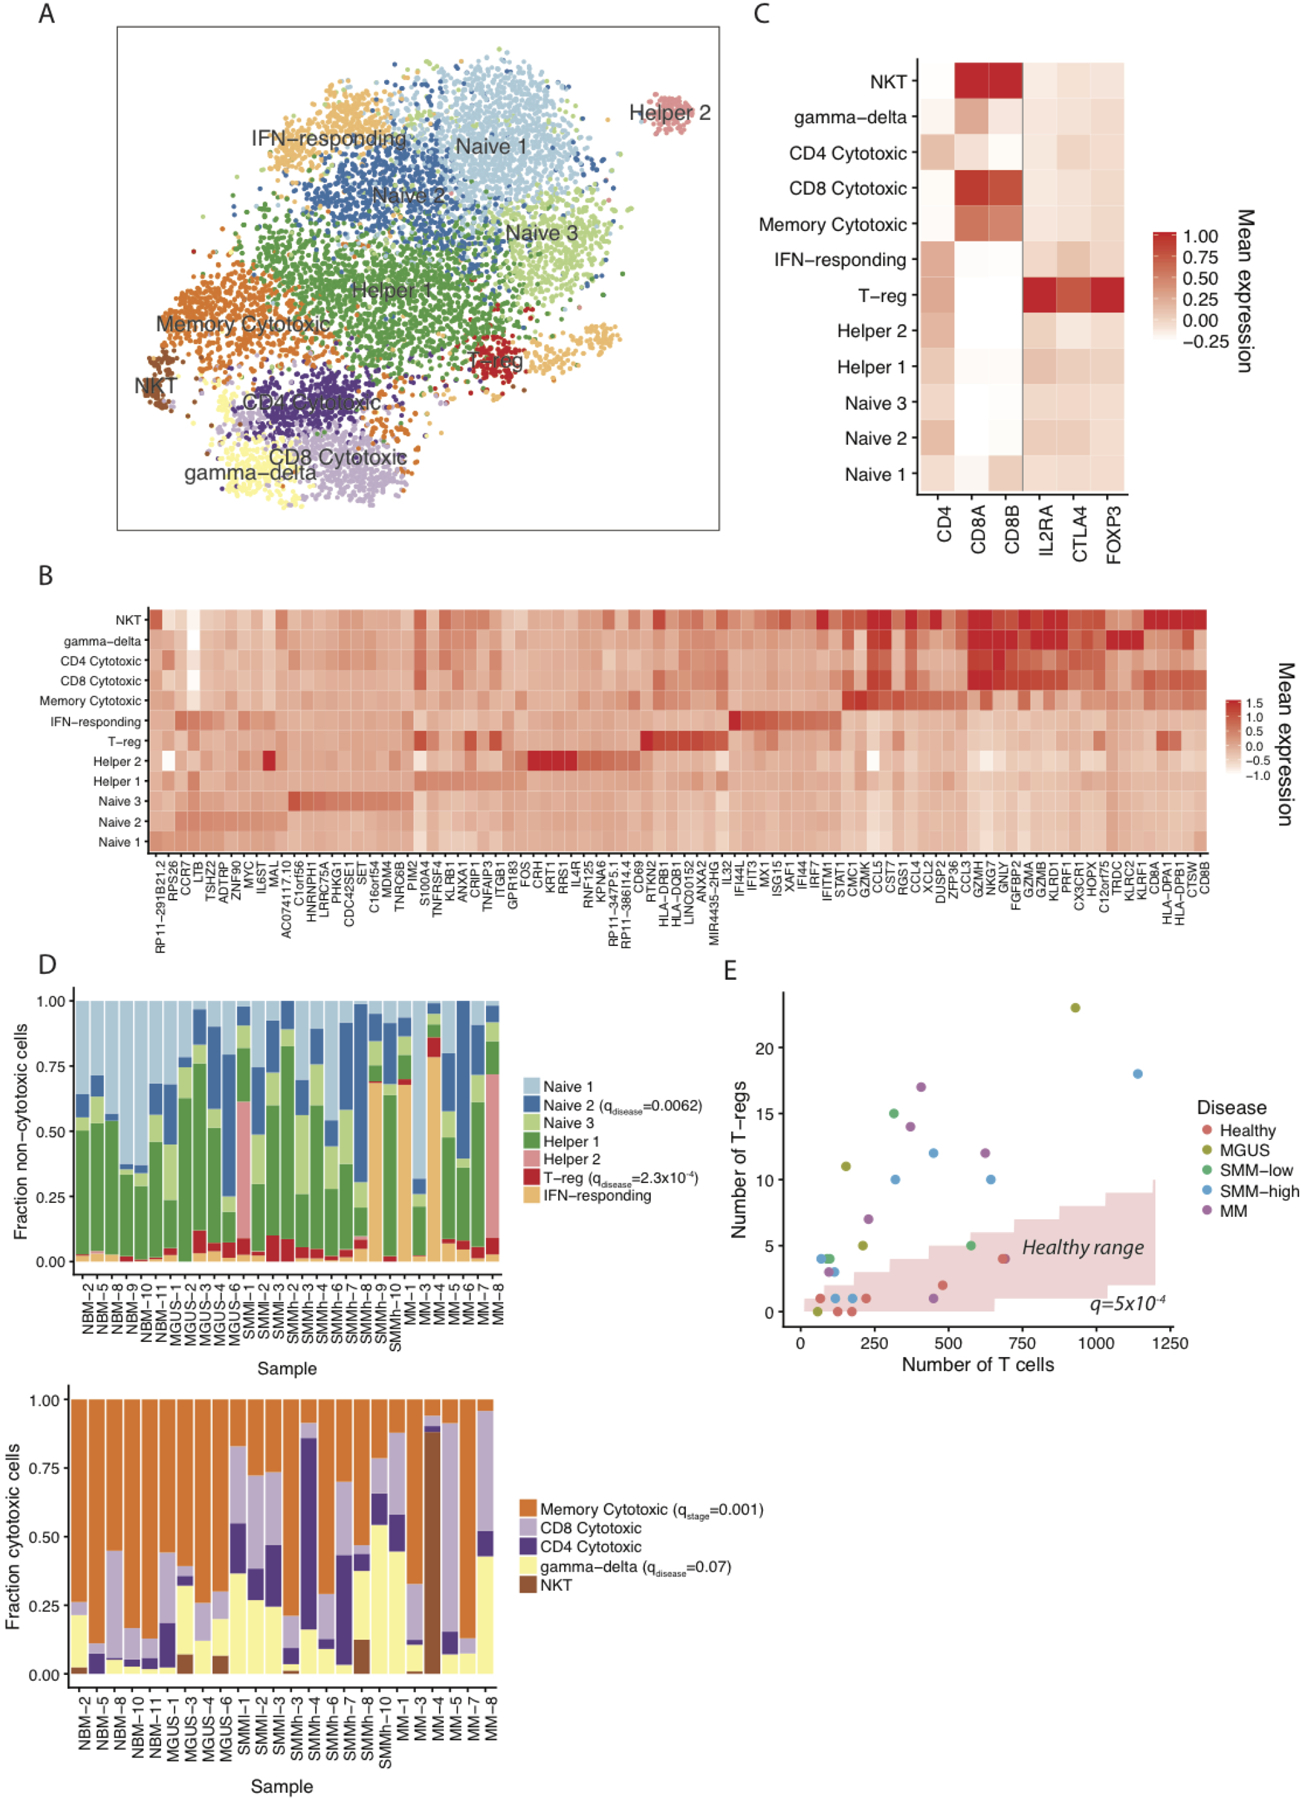
(A) tSNE visualization of T cell clusters localized in the BM. (B) Mean expression of differentially expressed marker genes per cluster. (C) Mean expression of individual genes additionally used for cluster definition. (D) Distribution of non-cytotoxic and cytotoxic T populations in individual samples. Only samples with at least 50 cells of the corresponding type are shown. (E) Significant enrichment of regulatory T cells in the bone marrow of diseased patients (q=0.0005 df=26.1, BH-corrected two-tailed t-test on fraction of Tregs between NBM and disease samples using n=29 patient samples with at least 50 T cells).
Figure 3. Skewed differentiation of cytotoxic T cells in MM patients at early disease stage.
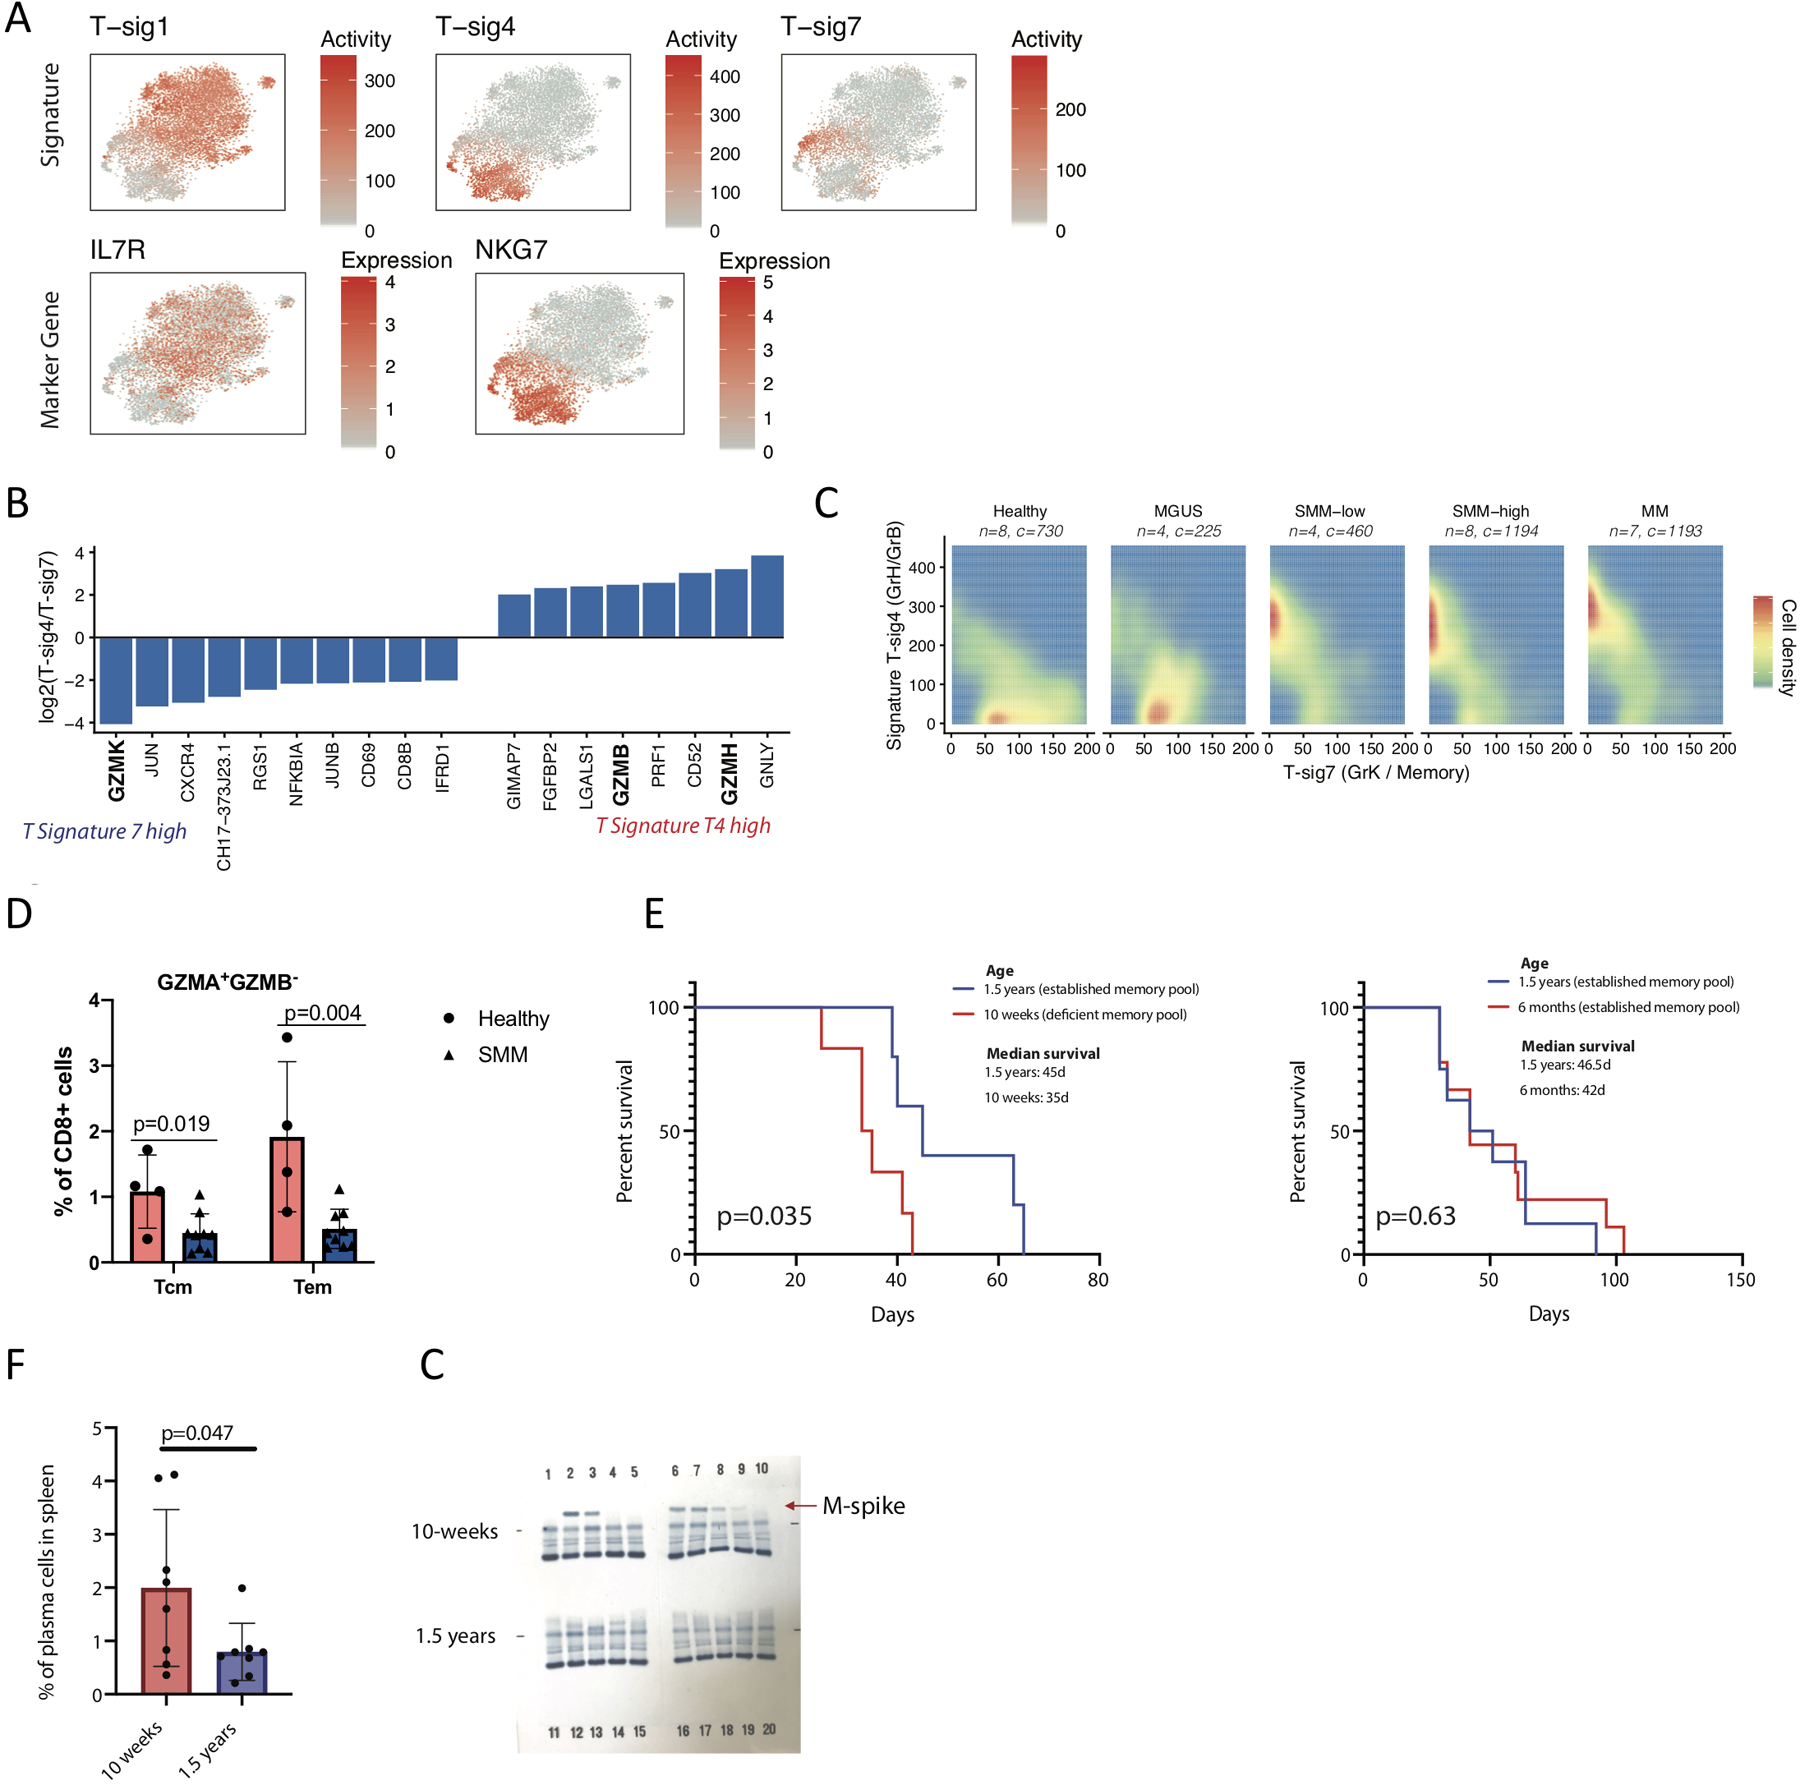
(A) tSNE representation colored by T cell signature activity and marker genes for broad characteristic signatures. (B) Log fold-change of NMF gene weightings between cytotoxic T cell signatures T4 and T7. (C) Distribution of cells expressing Granzyme B/H (T-sig7) and Granzyme K (T-sig4) cytotoxic signatures in healthy donors and different stages of disease. Only T cells expressing one of the two signatures (>100 T-sig4 or >50 T-sig7 activity) are shown. (D) CyTOF data shows decreased numbers of cytotoxic memory cells in the BM of SMM patients as compared to healthy donors (with median value of 1.08 vs 0.45 for central memory cells, Tcm; 1.92 vs. 0.51 for effector memory cells, Tem, in healthy BM and SMM patients respectively). CyTOF was performed on CD138- cells from BM aspirates of SMM patients (n=9) and healthy donors (n=4) using Granzyme B-171Yb, Granzyme A-149Sm and Maxpar® Human T-Cell Phenotyping Panel Kit, 16 Marker. Cell subsets were defined as suggested by the manufacturer. Significance was tested with two-tailed t-test, bars represent SD. (E) Memory cells are critical for immunosurveillance in MM. Significantly shorter survival of 10 weeks old KaLwRj mice (n=6) after injection with 5TGM1 MM cells compared to older animals (n=5). No difference in survival of myeloma-injected mice was obtained in groups with established memory cell pool (6 months old KaLwRj mice, n=9, vs. 1.5 years old KaLwRj mice, n=10). Significance was tested with the log-rank (Mantel-Cox) test. (F) Early accumulation of CD138+ plasma cells in the spleen of 10 weeks old Bl6 mice (n=8) at 3 weeks post Vk*MYC MM cell injection as compared to older animals (n=8), with median value of 1.99 in younger animals as compared to 0.78 in older mice. Significant difference was tested with two-tailed t-test, bars represent SD. (G) Faster abundance of monoclonal proteins (M-spike) in the blood of 10 weeks old Bl6 mice (n=10) at 3 weeks post Vk*MYC MM cell injection compared to 1.5 years old mice (n=10). QuickGel Split-Beta gels separate serum proteins by the classic electrophoresis zones with monoclonal proteins appearing as a specific band (M-spike). Gel has been cut from outside, no samples/bands are removed. Experiment was repeated twice with the same results, representative data from one experiment is shown.
Figure 4. Interferon type-1 target genes are significantly upregulated in patients compared to healthy donors.
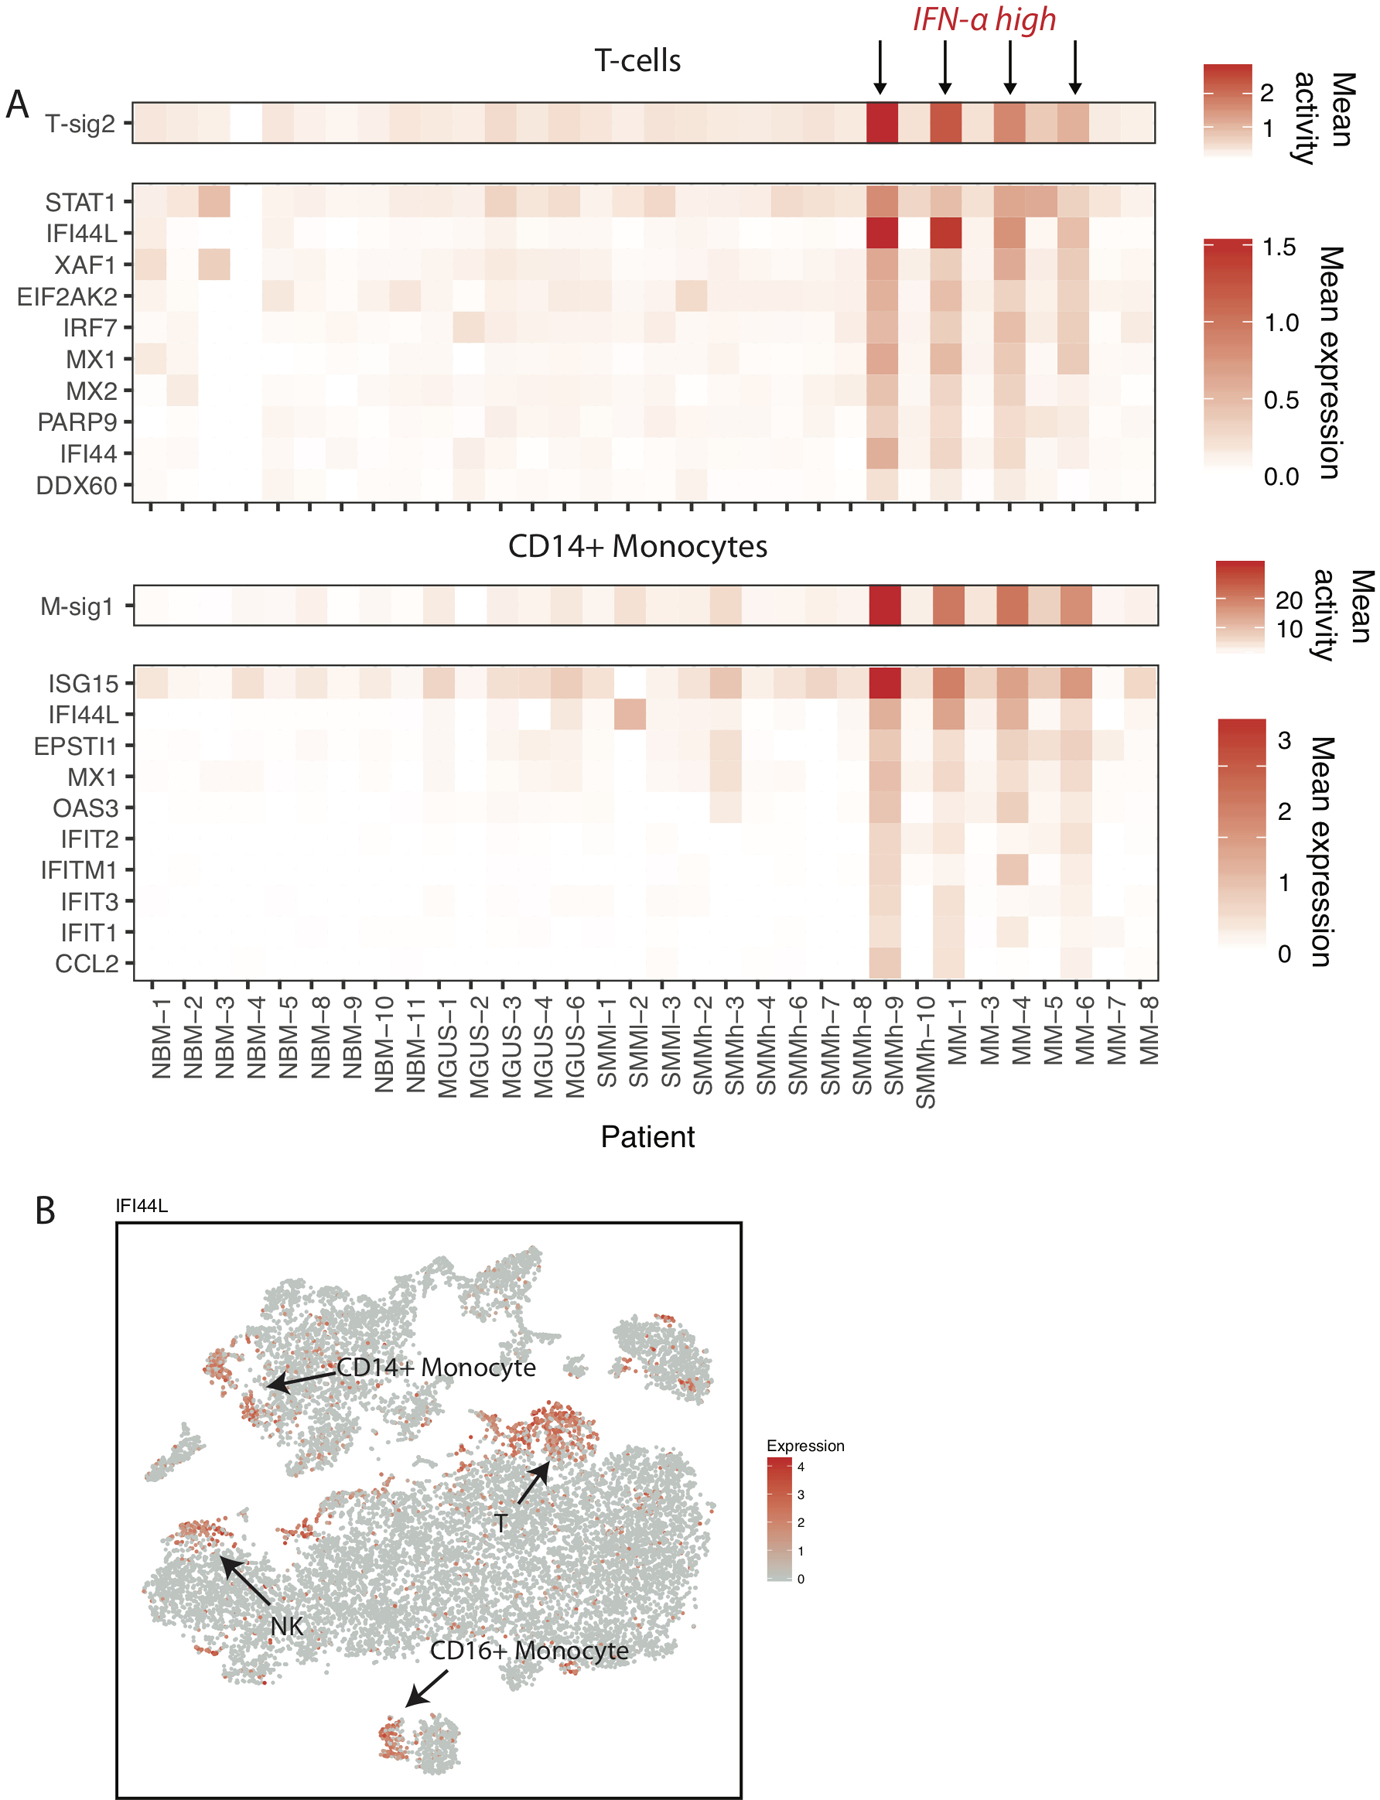
(A) Mean T-sig2 and M-sig1 cell signature activity across samples, and mean expression of genes most highly weighted in these signatures. (B) tSNE representation of cells colored by IFI44L expression.
Cytotoxic T cell Populations Shift Towards Effector Phenotype During Disease Progression
Our cytotoxic T cells were broadly separated by two signatures of (Figure 3A, T-sig4 and T-sig7), most notably corresponding to expression of either Granzymes B (GZMB, GrB) and H (GZMH, GrH; T-sig4) or Granzyme K (GZMK, GrK; T-sig 7) (Figure 3B), present in exclusively CD8+ cells. The GrK-to-GrB transition has been associated with the differentiation of cytotoxic T cells from memory to effector state42. The T cells marked by GrB expression signature included clusters of CD8+ cytotoxic effector and gamma-delta T cells, in addition to subpopulation of CD4+ cytotoxic cells and NKT cells predominantly derived from one patient (Figure 2D).
Among cells expressing one of two cytotoxic signatures (considered as >100 and >50 activity for signatures T-sig4 and T-sig7 based on their distribution), T-sig7 was more prevalent in healthy and MGUS individuals (p=0.0013 df=21.5 n=30, t-test on patient mean signature activity across these cytotoxic cells between Healthy/MGUS and SMM/MM), while SMM and MM stages presented a striking shift to T-sig4 (p=3.1×10⁻⁴ df=27.9 n=30, Figure 3C), suggesting a depletion of memory CD8+ T cells later during disease progression. In support of this result, we observed in our CyTOF data a two-fold decrease in CD8+ memory cells in the BM aspirates of SMM patients (T central- and effector memory cells, GrA+GrB−, Figure 3D, Extended Data Fig. 4A).
We next examined whether these populations displayed characteristics of T cell exhaustion. Of four key markers of exhaustion (PDCD1, HAVCR2, LAG3, and TIGIT), we found only LAG3 and TIGIT are expressed at detectable levels, and are relatively specific to the cytotoxic subsets (with the exception of TIGIT expression on T-regs) (Extended Data Fig. 4B). Across cytotoxic T cells, we did not see a difference between healthy and patients in expression of these genes (Extended Data Fig. 4C). However, since healthy donor samples primarily are composed of GrK+ cytotoxic subsets, we cannot reliably compare the expression of specifically GrB+ subsets, which likely would be the relevant subsets to display classical exhaustion.
Of note, in our CyTOF data we observed significantly higher expression of the checkpoint receptor PD-1 on memory cells in healthy individuals than in SMM (Extended Data Fig. 4D–E, p=0.047). Recent publications have connected expression of PD-1 at early stages of T-cell differentiation with a mechanism for T-cell activation to balance effector and memory responses43,44, however its role in MM remains to be elucidated.
Notably, the degree of the shift from memory to effector was variable, and in several samples such as MM-7 completely absent. We did not observe any correlation between plasma cell cytogenetics and types of cells composing the cytotoxic T cell cluster.
To address the role of GrK-expressing cytotoxic memory cells in MM progression, we performed in vivo assays using syngeneic transplantable myeloma mice with different maturation stages of the memory cell pool. For this, ten week old KaLwRiJ mice with impaired memory cell function and fully immunocompetent older animals (1.5 years) were injected with 5TGM1 MM cells. Young mice with impaired memory cells showed significantly shorter survival as compared to older animals (Figure 3E). In a similar assay with C57BL/6J mice injected with Vk*MYC MM cells, we observed early accumulation of plasma cells in the spleen, and faster abundance of monoclonal proteins in the blood of younger animals (Figure 3F–G). However, no difference in survival of myeloma-injected mice was obtained when animal groups with fully established memory cell pool were compared (6 months old vs. 1.5 years old KaLwRiJ mice, Figure 3E right panel), providing compelling evidence for a previously undetermined critical role of memory cells for immunosurveillance against MM. Future studies in age-matched mice will be necessary to further eliminate potential age-associated confounding factors.
Interferon Response is Seen Across Immune Cell Types in Late Stage Disease
Signature T-sig2 was highly enriched for IFN responsive genes (e.g. STAT1, IFI44L, ISG15) and uniquely present among a subset of late stage patients (Figure 4A). Likewise, signature analysis in CD14+ monocytes was able to isolate an expression program (M-sig1) with highly overlapping marker genes. This signature was present in precisely the same samples, suggesting a common response to the external signals. Indeed, when we visualized expression of the top genes, we observed IFN response in subpopulations of different cell types, including NK, non-classical monocytes, and small numbers of B cells (Figure 4B). While as this signature is strongly present in 4/23 samples so we are underpowered to directly link it to myeloma progression (Fisher exact test p=0.054, n=27), we have shown in previous work that interferon signaling is significantly upregulated in malignant plasma cells27. Interrogating publicly available dataset from CD138-enriched plasma cells at different stages of the MM disease (n=147) and healthy donors (n=15, GSE6477) for the expression of ISG-15 and MX1, which scored highly in gene signature analyses in our single-cell data, we found a significantly increased expression of these genes throughout multiple myeloma progression (Extended Data Fig. 5). Thus, our data from the immune microenvironment provides evidence that signaling in this context occurs not just in myeloma cells, but across immune populations.
CD14+ Monocytes in the MM Microenvironment Show Defective Antigen Presentation Due to Intracellular Accumulation of HLA-DR
In addition to the IFN signature found in CD14+ monocytes, we discovered that the signature M-sig2 was significantly upregulated in all malignant cases (t-test n=30 df=19.7 q=1.3×10⁻⁶). The majority of genes highly contributing to this signature were encoding the MHC class II cell surface receptor (HLA-DRA, HLA-DPB1, HLA-DRB1 and HLA-DPA1; q≤2×10⁻⁴; Figure 5A, Extended Data Fig. 6A). Expression of MHC-II encoding genes individually was significantly upregulated in CD14+ monocytes/macrophages across all disease stages, including MGUS (Figure 5A, Extended Data Fig. 6A). mRNA levels of MHC-II receptors together with the expression of IFN-activated genes predominantly determined organization of CD14+ monocytic subclusters (Extended Data Fig. 6B). Additional subclusters were built from individual patients with high expression of the Mannose Receptor C-Type 1 (MRC1), CCL3/4 and CCAAT/enhancer binding protein (C/EBP) signaling (Extended Data Fig. 6B).
Figure 5. Dysregulation of MHC II in CD14+ monocytes in MM environment.
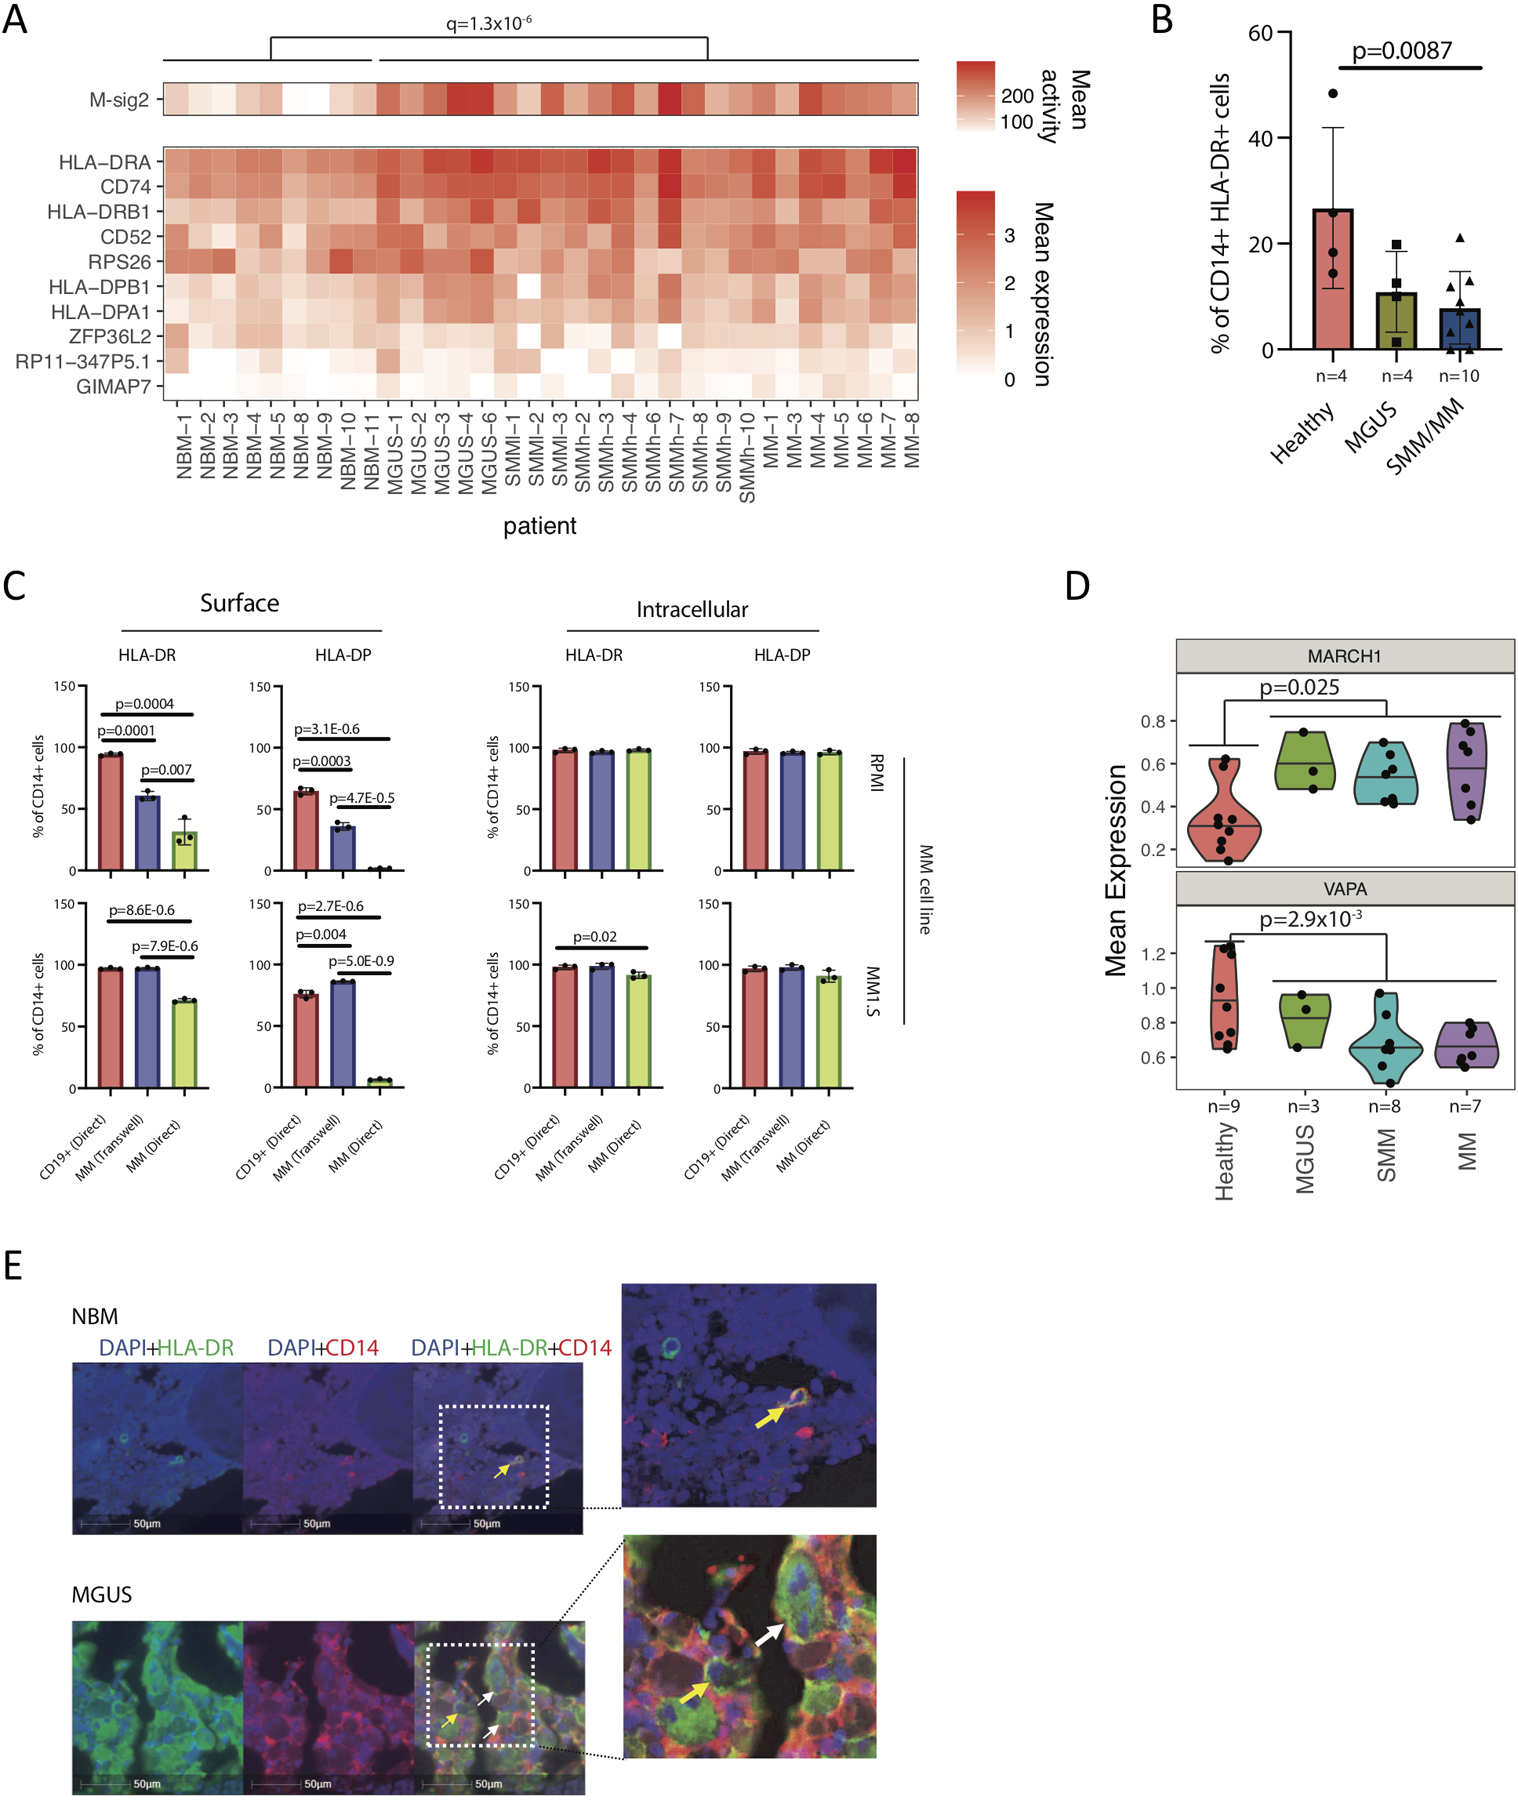
(A) Mean activity of MHC II gene signature (M-sig2) and mean expression of these genes across samples, grouped by stage of progression. Significance was tested by a BH-corrected two-tailed t-test with df=19.7 on n=30 patient samples with at least 10 CD14+ monocytes. (B) HLA-DR cell surface protein expression measured by CyTOF across samples. Significantly lower levels of HLA-DR molecules were observed on the surface of CD14+ monocytes/macrophages in patients (SMM and MM samples) as compared to healthy donors (NBM), with median value of 26.7 for NBM, 10.9 and 7.9 for SMM and MM samples respectively. Significant difference was tested with two-tailed t-test, bars representing SD. (C) Myeloma cells significantly downregulate surface representation of MHC II on CD14+ monocytes after direct co-culture. Human CD14+ monocytes were isolated from blood of healthy donors and co-cultured with CD19+ B cells or MM1.S and RPMI8226 (RPMI) myeloma cells. FACS analysis was performed on day 3 of co-culture. Median values for surface expression on CD14+ cells co-cultured with CD19+ cells or with RPMI cells in transwell or direct co-culture were 94.2, 60.4 and 31.3 for HLA-DR; 64.6, 35.9 and 1.7 for HLA-DP respectively. Median values of 97.0, 97.2 and 91.2 for HLA-DR; 75.8, 86.2 and 6.4 for HLA-DP were detected on the surface of CD14+ cells after similar experimental settings with MM1.S cells. The median proportion of CD14+ intracellularly expressing HLA-DR was 97.8, 96.4 and 98.0; 96.7, 95.9 and 96.0 for HLA-DP in co-culture with RPMI; 97.9, 98.6 and 91.9 for HLA-DR, 96.8, 97.8 and 90.9 for HLA-DP in co-culture with MM1.S cells respectively. Experiment was performed with three independent donors/2 different cell lines in triplicates. (Significance was derived from technical replicates, but different donors demonstrate similar loss of HLA-DR expression as compared to controls, t-test 2-sided; error bars indicate SD) (D) Immunofluorescence staining of tissue microarrays from MGUS patients demonstrates intracellular accumulation of HLA-DR (green) in CD14-expressing monocytes (red) as compared to membrane-bound localization of HLA-DR in healthy bone marrow monocytes (BM tissue microarrays of MGUS, SMM and MM patients (n=45, performed in triplicates, total of 135 BM sections, yellow arrows point on cells with HLA-DR localized to the cell membrane, white arrows point on cells with HLA-DR accumulated in the cytoplasm). (E) Upregulated MARCH-1 expression and decreased VAPA levels in CD14+ cells from BM of MM patients, compared to healthy donors. Violin plots show minimum, medium, and maximum values, and a BH-corrected two-tailed t-test was performed on n=27 patient samples with >=50 CD14+ monocytes.
However, study of MHC-II expression using CyTOF revealed that despite elevated mRNA levels, CD14+ cells from SMM and MM patients exhibited significantly lower HLA-DR surface expression as compared to healthy donors (Figure 5B), suggesting the pathway dysregulation yet resulting in compromised antigen presentation in these cells. To elucidate whether this change in expression represented a shift in cell subpopulations (for example, MDSCs are known to have low levels of MHC II surface presentation), or a phenotypic change specifically induced by the myeloma cells, we co-cultured CD14+ cells isolated from the peripheral blood of healthy donors with MM.1S or RPMI-8226 myeloma cells and analyzed HLA-DRA mRNA and HLA-DR and HLA-DP surface expression levels. Indeed, while quantitative reverse transcription PCR showed a significant increase of HLA-DRA mRNA in monocytes co-cultured with MM cells compared to co-culture with CD19+ control cells (Extended Data Fig. 7A), a dramatic drop in the surface expression of both HLA-DR and HLA-DP molecules was observed (Figure 5C, left panel). The proportion of CD14+ cells expressing HLA-DR and HLA-DP intracellularly, however, remained similar or slightly lower as compared to the controls (Figure 5C, right panel), and we observed intracellular accumulation of HLA-DR in CD14-expressing cells in TMA slides of MM patients as compared to membrane-bound HLA-DR in healthy CD14 monocytes (Figure 5D, Extended Data Fig. 7B). Taken together, our results suggest that MM cells induce internalization of MHC-II in CD14+ cells, reducing their potential for antigen presentation.
Looking for the alterations in the expression of genes responsible for the post-translational control of MHC-II, we found the gene encoding E3 ubiquitin-ligase MARCH-1 to be progressively upregulated in patients, compared to healthy individuals (p=0.008), and found decreased levels of the gene encoding ER-resident protein VAMP-associated protein A (VAPA), which plays a role in the inward transportation of MHC-II (p=0.01, Figure 5E). By treating CD14+ cells co-cultured with MM cell lines with anti-MARCH-1 siRNAs, we were able to rescue HLA-DR surface presentation (Extended Data Fig. 8). Thus, our results suggest that the upregulation of MARCH-1 observed in our single-cell RNA dataset could indeed lead to internalization of MHC-II in monocytes in the MM microenvironment.
CD14+ Monocytes in the MM Microenvironment Can Promote Proliferation of Myeloma Cells and Suppress T-cell Activation
Since CD14+CD11b+HLA-DRlow cells have been previously defined as one of the subsets of monocytic myeloid-derived suppressor cells (M-MDSC), we wanted to further characterize the CD14+HLA-DRlow cell population from MM environment and understand its role in myeloma progression and immune suppression. According to our sequencing results, the above described population of CD14+ cells does express CD11b at levels similar to healthy cells. Likewise, it expresses various markers that define mature macrophages, such as CD86, CD163, CD68 with highly elevated CD206 in one patient (Extended Data Fig. 9A). According to suggested guidelines for characterization of MDSCs45, we did not observe increased expression of MDSC-associated genes in patients relative to healthy donors (Extended Data Fig. 9B). Furthermore, CD14+ cells from healthy donors after co-culture with MM cells express iNOS, CD206 and CD163 and do not polarize towards the Lin−CD11b+CD33+ M-MDSC phenotype (Extended Data Fig. 9C). Thus, while this cell population may overlap with CD14+CD11b+HLA-DRlow populations termed M-MDSCs described in other literature, our results agree with the observation of others that additional markers are needed to isolate myeloid cells with a specific M-MDSC phenotype.
Interestingly, after co-culture of myeloma cell lines (MM1.S, RPMI-8226, OPM-2, KMS-18) with CD14+HLA-DRlow cells, we observed significant changes in the cell cycle of MM1.S cells resulting in significantly increased fraction of cells in the S (p=0.006) and G2M (p=0.0012) phase of the cell cycle as compared to control cells, indicating that CD14+HLA-DRlow cells can accelerate the proliferation of MM cells (Figure 6A–B).
Figure 6. CD14-expressing monocytes from myeloma environment can enhance proliferation of myeloma cells and suppress the T cell activation.
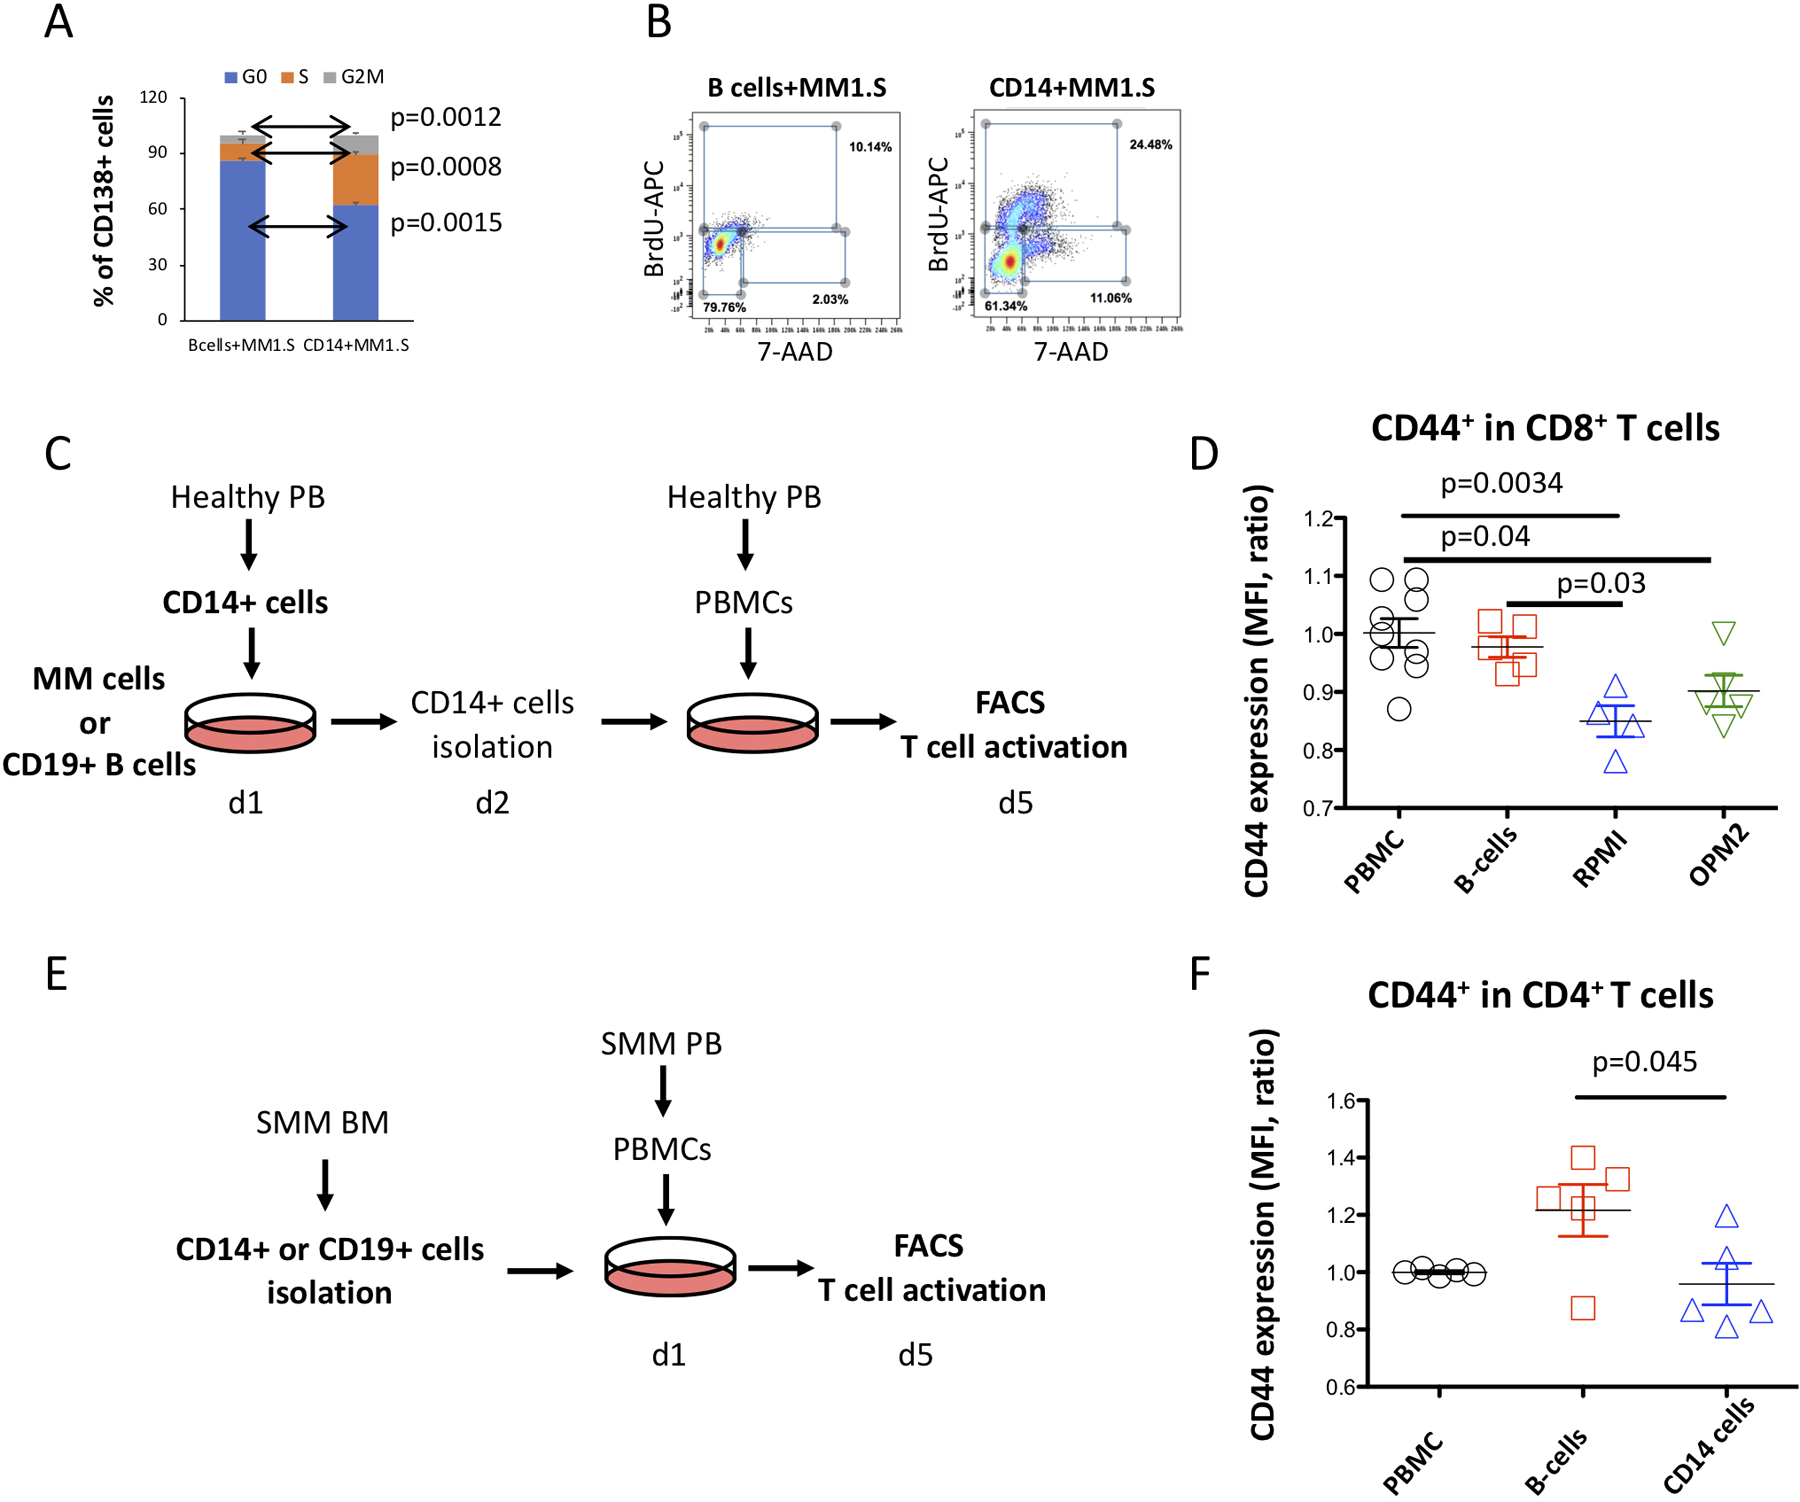
(A) Proportion of MM1.S cells in the G0, S- and G2M cell cycle phases assessed from frequency of myeloma cells that incorporated 5-bromo-2’-deoxyuridine (BrdU) into cellular DNA in presence of CD14+HLA-DRlow monocytes or B-cells. Median values for MM1.S cells in G0, S and G2M phase of cell cycle were 86.1, 9.3 and 4.6 for controls co-cultured with B-cells as compared to 62.4, 27.1 and 10.6 for co-culture with CD14+HLA-DRlow cells. Error bars indicate average deviation, representative data from one out of three independent experiments performed with three healthy donors. (B) Representative FACS profiles show distribution of MM cells in the different cell cycle phases. (C) Experimental design for T cell activation assay of CD14+ cells from MM environment. CD14+ cells isolated from PB of healthy donors were co-cultured with MM cell lines or healthy B-cells as a control. Next day, CD14+ cells were isolated from the MM co-culture and placed into culture with healthy PBMC. At day 5, activation of T cells was analyzed using FACS. (D) CD8+ T cells co-cultured with CD14+ cells pre-conditioned with RPMI myeloma cells show decreased levels of CD44 as compared to controls pre-cultured with B cells. Median fluorescence intensity for PBMC controls were 1.0 as compared to 0.98 for B cells, 0.85 for RPMI and 0.9 for OPM2 cells. (One-way ANOVA and Tukey multiple comparison tests were used to test significant differences between groups, statistics were derived from three independent experiments performed in duplicates, bars indicate SD). (E) Experimental design for T cell activation assay of CD14+ cells from SMM patients. CD14+ or B cells isolated from the BM of SMM patients were co-cultured with PBMC. At day 5, activation of T cells was analyzed using FACS. (F) CD4+ T cells co-cultured with CD14+ cells from SMM patients show decreased levels of CD44 as compared to controls. Median fluorescence intensity for PBMC controls were 1.0 as compared to 1.2 for B cells and 0.96 for CD14+ SMM cells. (One-way ANOVA and Tukey multiple comparison tests were used to test significant differences between groups, statistics were derived from three independent experiments performed in duplicates, bars indicate SD).
Then, we tested the ability of CD14+ cells from the MM environment to alter T-cell activity. We assessed the expression of the CD44 activation marker in T cells after co-culture with CD14+ cells that were pre-conditioned with MM cells (Figure 6C). In contrast to B-cell controls, CD8+ cells after co-culture with CD14+ monocytes from MM environment showed reduced expression of CD44 (Figure 6D), indicating suppression of T cell activation. In a similar experiment with PBMCs co-cultured with either CD14+ cells or CD19+ B cells isolated from BM aspirates of SMM patients (Figure 6E), we observed downregulation of CD44 in CD4+ T cells co-cultured with the CD14+ cells (Figure 6F).
Altogether, these results indicate that CD14+HLA-DRlow cells from the myeloma environment are able to accelerate proliferation of MM cells and exhibit suppressive activity by inhibiting T-cell activation.
DISCUSSION
Myeloma is an incurable disease that can cause irreversible organ damage. Early intervention represents an attractive alternative for treatment, although we cannot accurately predict which MGUS/SMM patients will progress. Further understanding of the disease progression requires comprehensive molecular characterization, including the tumor’s microenvironment and the host’s immune response. Here, for the first time, we used single-cell RNA sequencing of patient samples across all stages of MM to elucidate the transcriptomic alterations within the immune microenvironment along disease progression.
Through analysis of the cellular composition of the tumor microenvironment, we showed a significant, albeit heterogeneous, enrichment of T, CD16+ monocytes and NK cells established at the MGUS stage of the disease, indicating an early launch of an immune response. Indeed, expansion of T and NK cells in the PB and BM of patients with hematopoietic malignancies, including MM, has been previously reported23–25,46–48 and associated with improved outcomes in MM33,38,49,50. Using single-cell sequencing, we were able to characterize the subtypes and expression states of these populations.
Our analysis further reveals that in patients with high NK cell infiltration, this fraction is predominantly composed of CXCR4-expressing cells, while samples with fewer NK cells have a shift towards CX3CR1 expression. Previous studies have shown these receptors responsible for chemotaxis, mediating homing to the BM or facilitating the BM egress39. If in certain subsets MM may initiate the egress of NK cells into circulation51, this may explain the heterogeneous frequency of NK cells observed in our data and could suggest an MM-orchestrated mechanism of immune evasion.
Interrogation of the cytotoxic compartment demonstrates that, starting from SMM, there is a loss of memory cells with considerable skewing of T-cell differentiation towards the GrB/H-expressing effector state. From our in vivo results, we now demonstrate the previously unrecognized pivotal role of memory cells in the immune response against tumor cells. It is important to note that the proportion of the effector cell subtypes did not correlate with the cytogenetic characteristics of the tumor. Individual subpopulations of cytotoxic effectors, including NKT, gamma-delta T cells, CD4+ and CD8+ effector cells are well described and their functionality in MM is under extensive investigation. In MM these cytotoxic cells often exhibit either suppressed phenotype (as CD8+ T cells52) or anergy (as in gamma-delta T cells53) and impaired functionality as reported for NKT cells54, and several approaches have been tested to overcome this dysregulation55,56.
The immunosuppressive role of MDSCs, CD14+HLA-DRlow/neg cells from the monocytic lineage, has been previously established in lymphoma, glioblastoma, prostate cancer, renal cell carcinoma and MM29,57–59. Our data demonstrate that in addition to MDSCs, mature CD14+ monocytes/macrophages also undergo a phenotypic shift leading to loss of MHC type II surface representation as early as in the MGUS stage. These CD14+ cells with compromised MHC-II representation acquire immunosuppressive potential and are able to suppress T-cell activation. We demonstrated that overexpression of MARCH-1 contributes to the internalization of MHC-II proteins. Importantly, this condition can be rescued by downregulating the MARCH-1 expression, offering a potential for therapeutic interventions. Overall, this signaling was impaired in the majority of patients already at the early precursor MGUS stage, indicating that monocyte/macrophages are very sensitive to the MM-directed shaping of a permissive tumor microenvironment.
Extensive co-regulatory networks have been described in the tumor microenvironment, whereby tumor cells regulate stromal and immune microenvironment and vice versa, all in support of tumor growth and dissemination16,17. We have previously demonstrated that IFN type-1 secreted from MM cells promotes immunosuppression, which favors the MM growth60. In this study we find highly upregulated IFN signaling across immune subsets. Our results thus further implicate IFN signaling in MM and indicate that such a complex regulatory network could already be in place at the high-risk SMM stage of disease, identifying it as a potential target for therapeutic intervention to prevent progression.
Taken together, we profiled sequential immune alterations occurring during MM progression, beginning at the earliest stage. MM represents a unique setting with a readily detectable pre-malignant stage, and observing early immune alterations in response to neoplastic environment raises the possibility of similar mechanisms appearing in the precursors of other cancers. It is our hope that understanding this evolution of the myeloma microenvironment will provide new targets for therapeutic approaches, and that leveraging inter-patient heterogeneity will enable stratification of patients by risk of progression and create the opportunity for early intervention.
EXPERIMENTAL PROCEDURES
Patient samples and cell preparation
Primary peripheral blood (PB) cells or bone marrow (BM) samples from MGUS, SMM or MM patients, as well as healthy donors were collected at the Dana-Farber Cancer Institute. These studies were approved by the Dana-Farber Cancer Institute Institutional Review Board. Informed consent was obtained from all patients and healthy volunteers in accordance with the Declaration of Helsinki protocol. CD138-negative or CD45-positive BM cell fractions were isolated using Magnetic Activated Cell Sorting technology (MACS, Miltenyi Biotec). Selected cells were either viably cryopreserved in dimethyl sulfoxide (DMSO) at a final concentration of 10% or used immediately for single-cell RNA sequencing.
Human MM.1S and RPMI-8226 cells were purchased from ATCC, while KMS-18 myeloma cell line was obtained from the Japanese Collection of Research Bioresources (JCRB), Japan and OPM2 cells were obtained from DSMZ. For in vitro experiments, these cell lines were cultured in RPMI-1640 containing 10% fetal bovine serum/FBS (Sigma Chemical, St Louis, MO), 2mM L-glutamine, 100 U/mL penicillin, and 100 μg/mL streptomycin (GIBCO, Grand Island, NY).
Sequencing library construction using the 10x Genomics platform
Frozen BM cells were rapidly thawed, washed, counted and resuspended in PBS and 0.04% BSA to a final concentration of 1000 cells/μl. The Chromium™ Controller (10x Genomics, Pleasanton, CA, USA) was used for parallel sample partitioning and molecular barcoding61. To generate a single-cell Gel bead in EMulsion (GEMs), cellular suspensions were loaded on a Single Cell 3’ chips together with the Single cell 3’ Gel Beads, according to the manufacturer’s instructions (10x Genomics). Single-cell RNA-Seq libraries were prepared using ChromiumTM Single Cell 3’ Library Kit v2 (10x Genomics). 14 cycles were used for the total cDNA amplification reaction and for the total sample index PCR. Generated libraries were combined according to Illumina specifications and paired-end sequenced on HiSeq 2500–4000 platforms with standard Illumina sequencing primers for both, sequencing and index reads. 100 cycles were used for sequencing Read1 and Read2.
Pre-processing of single-cell RNA-seq data
Sample demultiplexing, barcode processing, alignment to the human genome (hg38), and single-cell 3′ gene counting was performed using Cell Ranger Single-Cell Software Suite. Cells called by Cell Ranger were further filtered to those with <10% mitochondrial expression, >200 genes covered, and >600 total UMIs. Expression values were calculated as:
for a cell c with Nc total UMIs, ng,c of which map to gene g.
Separation of plasma and immune cell populations
To remove cells incorrectly sorted during bead selection (i.e. plasma cells in the CD138- fractions), we first performed coarse clustering of the data including all cells. We selected 2744 genes with high expression and dispersion, excluding genes on the sex chromosomes, and z-normalized the data after regressing out variation due to total number of UMIs or percentage mitochondrial RNA in each cell. We then performed Seurat KNN clustering with resolution 0.6 on the first 20 principle components of the resulting data. A plasma cell score was calculated for each cluster as the mean expression of CD138 (SDC1), CD319 (SLAMF7), and BCMA (TNFRSF17) and clusters with a score of >1 were identified as PC clusters. Clusters with >4 mean HBA1 expression were deemed to be erythroid clusters, and cells in these clusters were excluded from future analysis. Cells originating from CD138- fraction in non-plasma non-erythroid clusters formed our immune cell dataset.
Gene selection
When selecting genes for downstream analysis, we excluded genes with high potential to be influenced by cross-cell contamination effects. 10X technology exhibits lows rates of mRNAs being associated with barcodes of cells from which they did not originate, possibly from sources such as extracellular mRNAs captured in the droplet. While in the vast majority of cases this is undetectable, for ultra-highly expressed genes such as immunoglobulins the contributions can become noticeable. Thus, we excluded genes that were drastically higher in expression for the excluded compartments (plasma cells, and erythroid cells).
In addition, we filtered genes found to have a strong sex bias in our data. For the purposes of clustering analyses, we removed all genes from the sex chromosomes to avoid any cumulative effects that could separate samples based on gender. For downstream gene or signature-level analyses, so as not to lose informative genes on the X chromosome, we only excluded genes found to have a statistically significant sex bias (two-sample t-test on mean gene expression at an FDR threshold of 10%).
Analysis of immune cell populations
2,100 variably expressed genes were identified using the filtering procedure described above and the same expression and dispersion criteria as in the analysis of PCs. Clusters were identified using Seurat KNN clustering with resolution 1.4 on the first 20 principal components of the z-normalized data. Cell types were then identified for each cluster by examining the expression of marker genes, as well as the top differentially expressed genes in each cluster. Cells were visualized by a t-SNE embedding on the same 20 principal components.
NMF-derived gene expression signatures
We defined gene expression signatures for T cells and CD14+ Monocytes using our SignatureAnalyze-GPU62 tool (https://github.com/broadinstitute/SignatureAnalyzer-GPU), which implements a previously described Bayesian non-negative matrix factorization algorithm63. This method approximates the expression profile of each cell (represented as a column in the input matrix) as an additive combination of latent expression programs (each column in the W matrix output), each with an associated weight or “activity” in each cell given by the H matrix. This Bayesian variant of non-negative matrix factorization encourages sparse interpretable solutions by imposing an exponential prior distribution on the weights of the W and H matrix and allows automatic discovery of the number of signatures required to explain the data.
After signature discovery, the columns of W were normalized to a sum of 1, and all the weight was shifted into the H matrix:
for gene g (out of G total genes), signature k, and patient p. Signatures significantly altered between disease states were identified by calculating the mean signature activity for each patient, and performing a two-sample t-test a reporting results below a 10% Benjamini-Hochberg FDR level. Marker genes for each signature were identified by sorting genes according to their relative contribution to each signature:
and taking the top 10 genes where the gene contributes at least 1% of the total signature activity.
Analysis of cells by CyTOF
Sample staining for mass cytometry (CyTOF) was performed according to the manufacturer’s guidelines (Fluidigm Sciences Inc.). Briefly, the CD138-negative or CD45-positive populations of BM samples from MM patients or healthy donors were thawed, washed and barcoded using the Cell-IDTM 20-Plex Pd Barcoding Kit (Fluidigm Sciences Inc.). After barcoding, cells were incubated with human Fc Receptor Blocking Reagent (Miltenyi Biotec Inc., San Diego, CA) and human surface marker antibodies as a single multiplexed sample (Maxpar® Human Immune Monitoring Panel Kit, 29-marker panel). After staining, cells were washed in MaxPar Cell staining buffer, resuspended at the concentration of 1×10⁶ cells/mL and acquired on a CyTOF Helios Mass Cytometer (Fluidigm Sciences Inc.). Downstream analysis of the individual component samples was performed after running the debarcoding application. An automated analysis GemStone software (Verity) was used to clean the data files by automatically identifying and removing cell doublets, debris and dead cells, as well as to identify major immune cell subsets. Expression levels of HLA-DR molecules on the cell surface were analyzed in Cytobank (Cytobank, Inc., Menlo Park, CA).
To phenotype the Gr-expressing T-cell populations, CyTOF was performed on CD138- cells from BM aspirates of SMM patients and healthy donors using TIGIT-143Nd, PD1–175Lu, TIM3–153Eu (Maxpar) and Maxpar® Human T-Cell Phenotyping Panel Kit, 16 Marker. T-cell subsets were defined as suggested by the manufacturer.
Flow cytometric analysis
Anti-human antibodies against CD138 (clone MI15), CD14 (63D3), HLA-DR (L243) from BioLegend, HLA-DP (DP11.1, Santa Cruz Biotechnologies), iNOS (Abcam, ab115819), CD33 (BioLegend, 303413), CD11b (BioLegend, 301341), CD206 (BioLegend, 321113), CD163 (BioLegend, 333621)and FITC anti-human Lineage Cocktail (BioLegend, 348801) were used for FACS analyses. The LIVE/DEAD™ Fixable Aqua Dead Cell Stain Kit (Molecular Probes, Life Technologies) was used for discrimination of dead cells. The data of the stained samples was acquired using FACS Canto II flow cytometer (BD Biosciences). The acquired results were analyzed in Cytobank (Cytobank, Inc.).
Myeloma cell co-culture assay
Human CD14+ monocytes or CD19+ B-cells were obtained from fresh PB cells using CD14 and CD19 Microbeads (Miltenyi Biotec). Briefly, red blood cells were lysed (RBC lysis buffer, BioLegend), washed and CD14+ and CD19+ cell populations were isolated according to the manufacturer’s instructions. CD14+ monocytes at 2×10⁶ were co-cultured with 1×10⁶ myeloma cell lines. CD19+ B cells were used as a negative control. Trans-well-permeable inserts with a pore size 0.4μm were used to prevent cell-cell interactions (Corning). After 3– 4 days of co-culture cells were harvested and analyzed for HLA-DR expression using flow cytometry or quantitative PCR.
siRNA knockdown of MARCH-1
MARCH-1 knockdown in CD14+ cells was performed using anti-MARCH-1 siRNAs (Thermo Fisher Scientific, siRNA ID:127048, 127049) and Lipofectamine® RNAiMAX Transfection Reagent according to the manufacturer’s instructions. Briefly, CD14+ monocytes were isolated from PB of healthy donors using CD14 Microbeads (Miltenyi Biotec) and plated into 24-well plates at 0.5×10⁶ in 500ul. 5pmol siRNA was used per well. Ambion Silencer Negative Control #1 siRNA (Life Technologies, AM4611) was used as a negative control. 12h post transfection, 1×10⁶ MM cells were added and cultured for the next 24 hours. Cells were collected and analyzed for the HLA-DR and MARCH-1 expression using flow cytometry or immunofluorescence microscopy.
RNA isolation and RT-qPCR
mRNA was isolated using miRNeasy Mini Kit (Qiagen, Cat no.217004). Purified RNA was measured by Nanodrop (Thermo Fisher) and cDNA was synthesized from 500ng of total RNA using a high capacity cDNA reverse transcription kit (Applied Biosystems, Cat no.4368814). Expression levels of HLA-DRA were obtained using Taqman qPCR assay (ID- Hs.PT.58.14332844) and an Actin assay as internal control (ID- Hs.PT.39a.22214847) from Integrated DNA Technologies. To measure expression of different MARCH1 transcripts, two primer pairs were designed and MARCH1 RT-qPCR reactions were prepared using Power SYBR Green PCR Master Mix (Applied Biosystems, REF 4367659). Taqman and SYBR green reactions were carried out on Quant Studio 7 (Applied Biosystems). The assays were run in triplicate using CD14+ cells isolated from three independent donors. The ddCt method was used for normalization on Actin and GAPDH housekeeping genes. Primer sequences of MARCH1 and GAPDH were: MARCH1 pair 2 forward, 5’-CAGGAGCCAGTCAAGGTTGT-3’; MARCH1 pair 2 reverse, 5’-AGAGCTCACAGCAGCGTGTA-3’; MARCH1 pair 3 forward, 5’-TAATCGCGATCACCTGTGTG-3’; MARCH1 pair 3 reverse, 5’-GCGCCACAACTGAACATAGA-3’, GAPDH forward, 5’-AGCACATCGCTCAGACAC-3’ and GAPDH reverse, 5’-GCCCAATACGACCAAATCC-3’.
BRDU proliferation assay
MM cells were co-cultured with CD14+ monocytes isolated from PBMC of healthy donors for 48h. MM cells co-cultured with CD19+ B cells were used as a control. After co-culture, cells were labelled with 1mM BrdU for 2h and then stained with antibodies for surface expression of CD138 (clone MI15, BioLegend) and CD14 (63D3, BioLegend). After this, cells were fixed and permeabilized with BD Life Sciences cytofix/cytoperm buffer as per manufacturer’s protocol (Catalog No. 552598) before staining with APC conjugated anti-BrdU for 20 minutes. Total DNA was stained using 7-AAD solution. Cell cycle of CD138+ MM cells was analyzed using flow cytometry.
Mixed lymphocyte reaction (MLR)
MLR was performed in duplicate in 96-well, round-bottom plates (Corning, 7007). PBMCs were cultured in the RPMI-1640 medium (Gibco, 11875) supplemented with 100U/mL Penicillin-Streptomycin (Gibco, 15140122), 10% (vol./vol.) fetal bovine serum (Gibco, A31604) and 50uM 2-mercaptoethanol (Sigma, M6250), 2mM L-Glutamine (Gibco, 25030081) for 3 days at 37 °C in 5% CO2in air. Cells were stimulated with 4ug/mL anti-human CD3 antibody (BioLegend, 317302, clone OKT3), 4ug/mL anti-human CD28 antibody (BioLegend, 302902, clone CD28.2) and 200ng/recombinant human IL-2 (PeproTech, 200–02).
CD14+ cells were isolated from healthy PBMCs and co-cultured with either MM cell lines (OPM2, MM1.S) or healthy CD19+ B cells for 24h in 1:2 ratio. After 24h CD14+ cells were isolated and added as modulators to the freshly isolated PBMCs from healthy donors. The cell number of responder cells vs. modulator cells was 1×10⁵: 8×10³ in the final volume of 200uL per well. PBMC without modulator cells served as a reaction system control. In the second experimental setup, CD14+ or CD19+ cells isolated from fresh BM aspirate of a SMM patient were used as modulators and PBMCs from the same patient were used as responders. Cells were harvested at day 3–5 for flow cytometry (BD, Canto-II). LIVE/DEAD™ Fixable Green Dead Cell Stain Kit (Life Technologies, L23101) was used to gate out the dead cells. The antibodies used in this experiment are: PerCP/Cy5.5 anti-human CD4 (BioLegend, 317428, clone OKT4); BV510 anti-human CD44 (BioLegend, 103044, clone IM7); APC/Cy7 anti-human CD8 (BioLegend, 300926, clone HIT8a).
Immunohistochemistry and immunofluorescence
Formalin-fixed and paraffin-embedded (FFPE) tissue sections were baked in Isotemp Oven at 60°C for 30 mins to melt excess paraffin. Tumor sections were stained with Bond Rx Autostainer (Leica Biosystems, Buffalo Grove, IL) using the Bond Polymer Refine Detection Kit (DS9800; Leica Biosystems). Antigen retrieval was performed with Bond Epitope Retrieval Solution 1 (Citrate, pH = 6.0) for 30 minutes. Dual-Immunohistochemistry staining was performed using anti-CD14 (1:100; clone D7A2T, Cell Signaling Technologies) that is detected by Alexa Fluor™ 594 Tyramide Reagent from Life Technologies catalogue #B40957, and anti-HLA-DR (1:500; clone TAL.1B5, Dako) detected by Alexa Fluor™ 488 Tyramide Reagent from Life Technologies catalogue # B40953. NucBlue® Fixed Cell ReadyProbes® -DAPI (Life Technologies catalogue #R37606) was used as background stain.
For cytospins, CD14+ cells transfected with siRNA and co-cultured with MM cells for 24 hours were purified using flow cytometry. Cells were fixed with 4% PFA, washed with PBS and diluted to not more than 0.5 × 10⁶ cells/ml. 100ul of cell suspension was loaded into a cuvette with the slides mounted with the paper pad. Cuvette was placed into metal holder and centrifuged at 800 rpm for 5min. After centrifugation, the cells were immediately fixed, permeabilized with cytofix/cytoperm buffer (BD Life Sciences, Catalog No. 552598) and incubated with primary antibodies for MARCH-1 (Life Technologies, PA553199, 1:100) and HLA-DR (BioLegend, 307602, 1:100) for 1 hour. Slides were washed for 15 min in PBS and incubated with corresponding secondary antibodies (Abcam) for 1 hour. Post incubation, slides were washed twice and mounted using DAPI-Mounting solution (Dako).
In vivo assays
C57BL/6 mice were purchased from Jackson Laboratories (Bar Harbor, Maine). C57BL/KalwRiJ mice were purchased from Harlan Laboratories (Horst, Netherlands). All mice were treated, monitored, and sacrificed in accordance with an approved protocol of the Dana-Farber Cancer Institute Animal Care and Use Committee.
4 × 10⁶ 5TGM1 cells were injected i.v into C57BL/KalwRiJ mice for survival studies.
4 × 10⁶ Vk*MYC cells were injected i.v into C57BL/6 mice for monoclonal protein secretion (M-spike) and plasma cell infiltration analyses. At 3 weeks post injection, BM cells and peripheral blood were harvested. BM cells were obtained through flushing of femurs with 1xPBS. Proportion of CD138+ plasma cells was determined after cell staining with the APC anti-mouse CD138 (BioLegend, #142505) by flow cytometry. A M-spike analysis was performed with 1μl of blood serum using QuickGel electrophoresis (Helena Laboratories, Beaumont, TX).
Statistical analysis of in vivo and in vitro studies
One-way ANOVA and Tukey multiple comparison test was used when three or more independent groups were compared. The unpaired Student t-test was used to compare two independent groups. All tests were two-tailed. Log-rank test was used to analyze survival data. A p-value < 0.05 was considered statistically significant.
Statistics & Reproducibility
No statistical method was used to predetermine sample size. Samples with insufficient numbers of cells or library complexity were excluded from analysis. Investigators were not blinded for study of human sequencing data. Further information on research design is available in the Nature Research Reporting Summary linked to this article.
Study approval
Human studies were approved by the Dana-Farber Cancer Institute Institutional Review Board (Boston, USA). Informed consent was obtained from all patients and healthy volunteers in accordance with the Declaration of Helsinki protocol.
Data availability
scRNAseq data that support the findings of this study have been deposited in the Gene Expression Omnibus (GEO) under accession codes GSE124310. Raw sequencing data has been deposited in dbGaP (phs001323.v1.p1). Previously published microarray data that were re-analysed here are available under accession code GSE6477. Source data for Fig. 1–6 and Extended Data Fig. 2–4 and 6–9 have been provided in corresponding Data Source Tables. All other data supporting the findings of this study are available from the corresponding author on reasonable request.
Code availability
scRNA data processed using cellranger v2.0.1 (https://www.10xgenomics.com/) and analyzed using the Seurat R package v2.3.1 (https://satijalab.org/seurat/). Gene expression signatures were extracted using our SignatureAnalyzer algorithm available on github (https://github.com/broadinstitute/getzlab-SignatureAnalyzer).
Extended Data
Extended Data Figure 1. Marker genes demonstrating cell type identity of immune cell clusters.
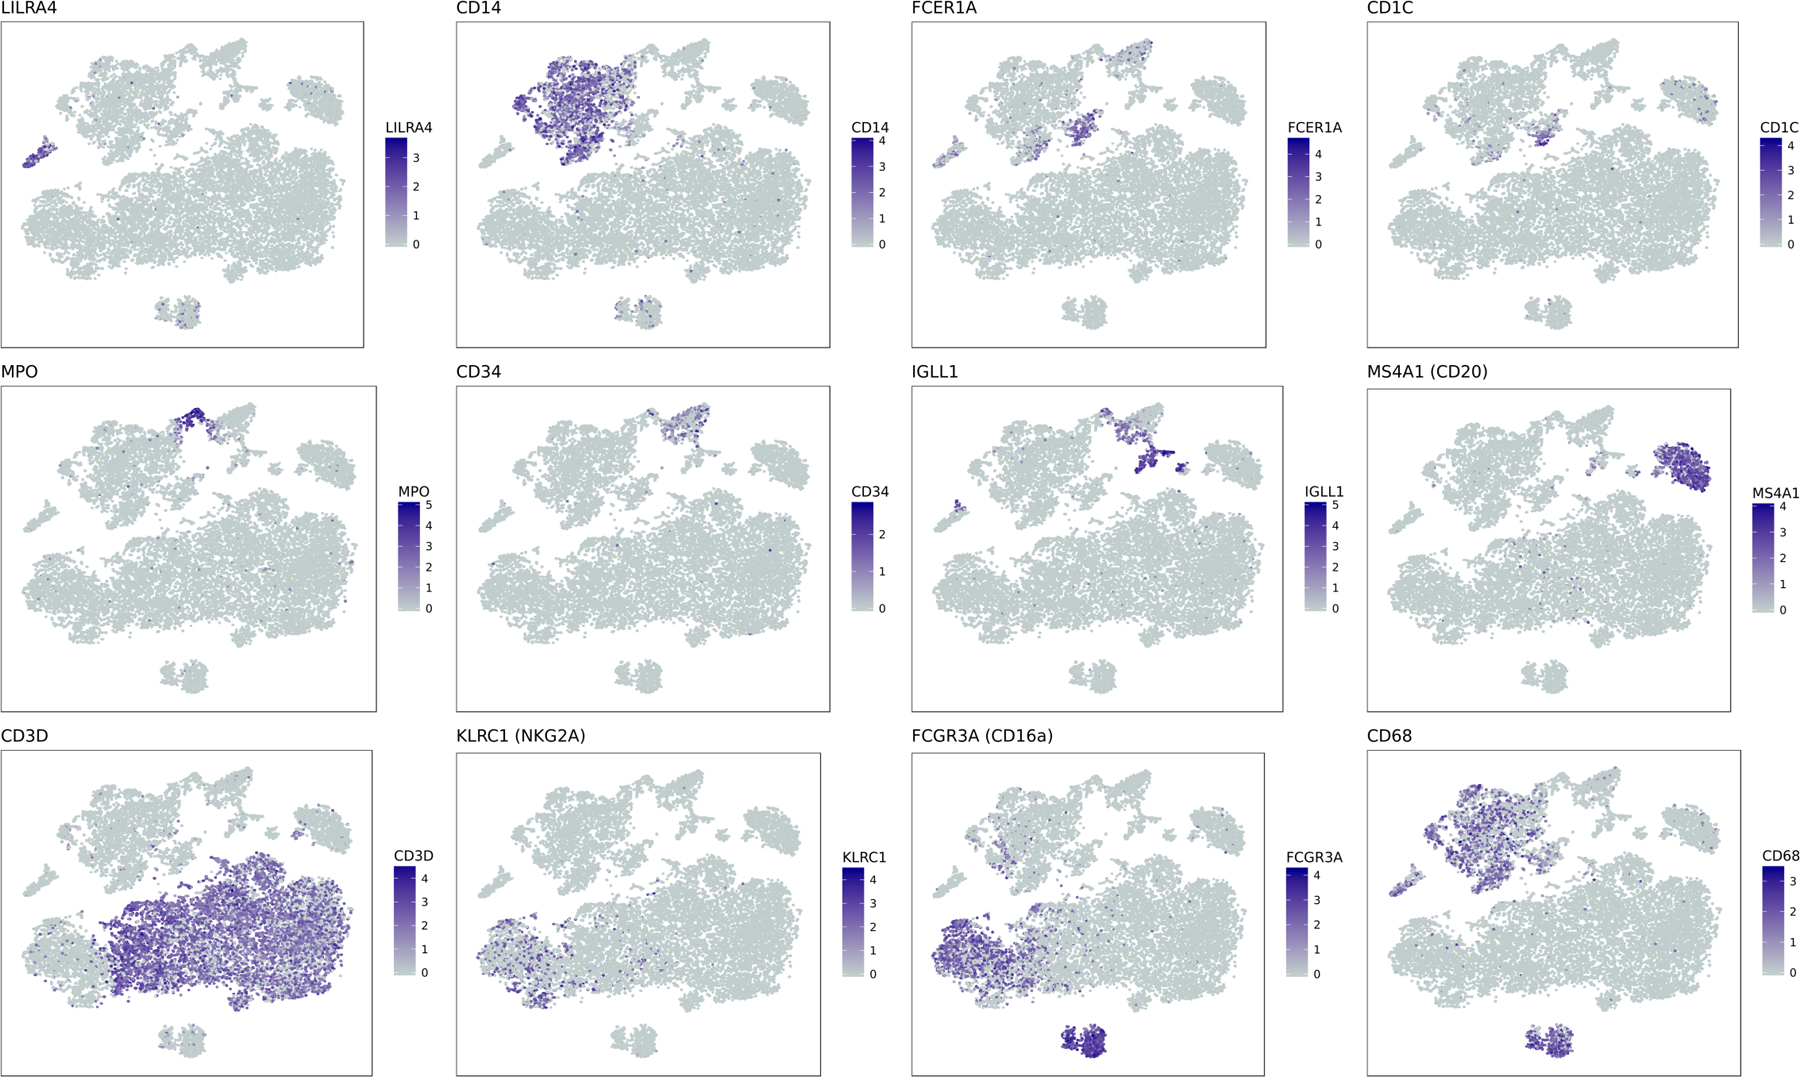
tSNE representation of CD45 cell populations. In each subplot, cells are colored by log-normalized expression values for a given cell type specific marker gene.
Extended Data Figure 2. Single-cell RNA sequencing results indicate changes in NK cell compartment as compared to healthy donors.

(A) A significant increase in fraction of NK cells in patients with malignant cells expressing IgG heavy chain. Fractions of NK cells are plotted for patients grouped by immunoglobulin heavy chain. Violin plots show minimum, median, and maximum values. A two-tailed t-test was performed on n=19 patient samples with df=12. (B) Spearman correlation between NK cell fraction and CXCR4+ subset frequency calculated on 10,0000 samples with replacement of data points. 95% confidence interval is shown. (C) Grouping of samples above and below median values for NK cell frequencies and CXCR4+ subset fractions. Points on the median were assigned in the conservative direction (i.e. to obtain a less significant p-value). A two-sided fisher-exact test was performed on n=23 patient samples.
Extended Data Figure 3. Compositional alterations in immune populations of diseased patients as compared to healthy donors.
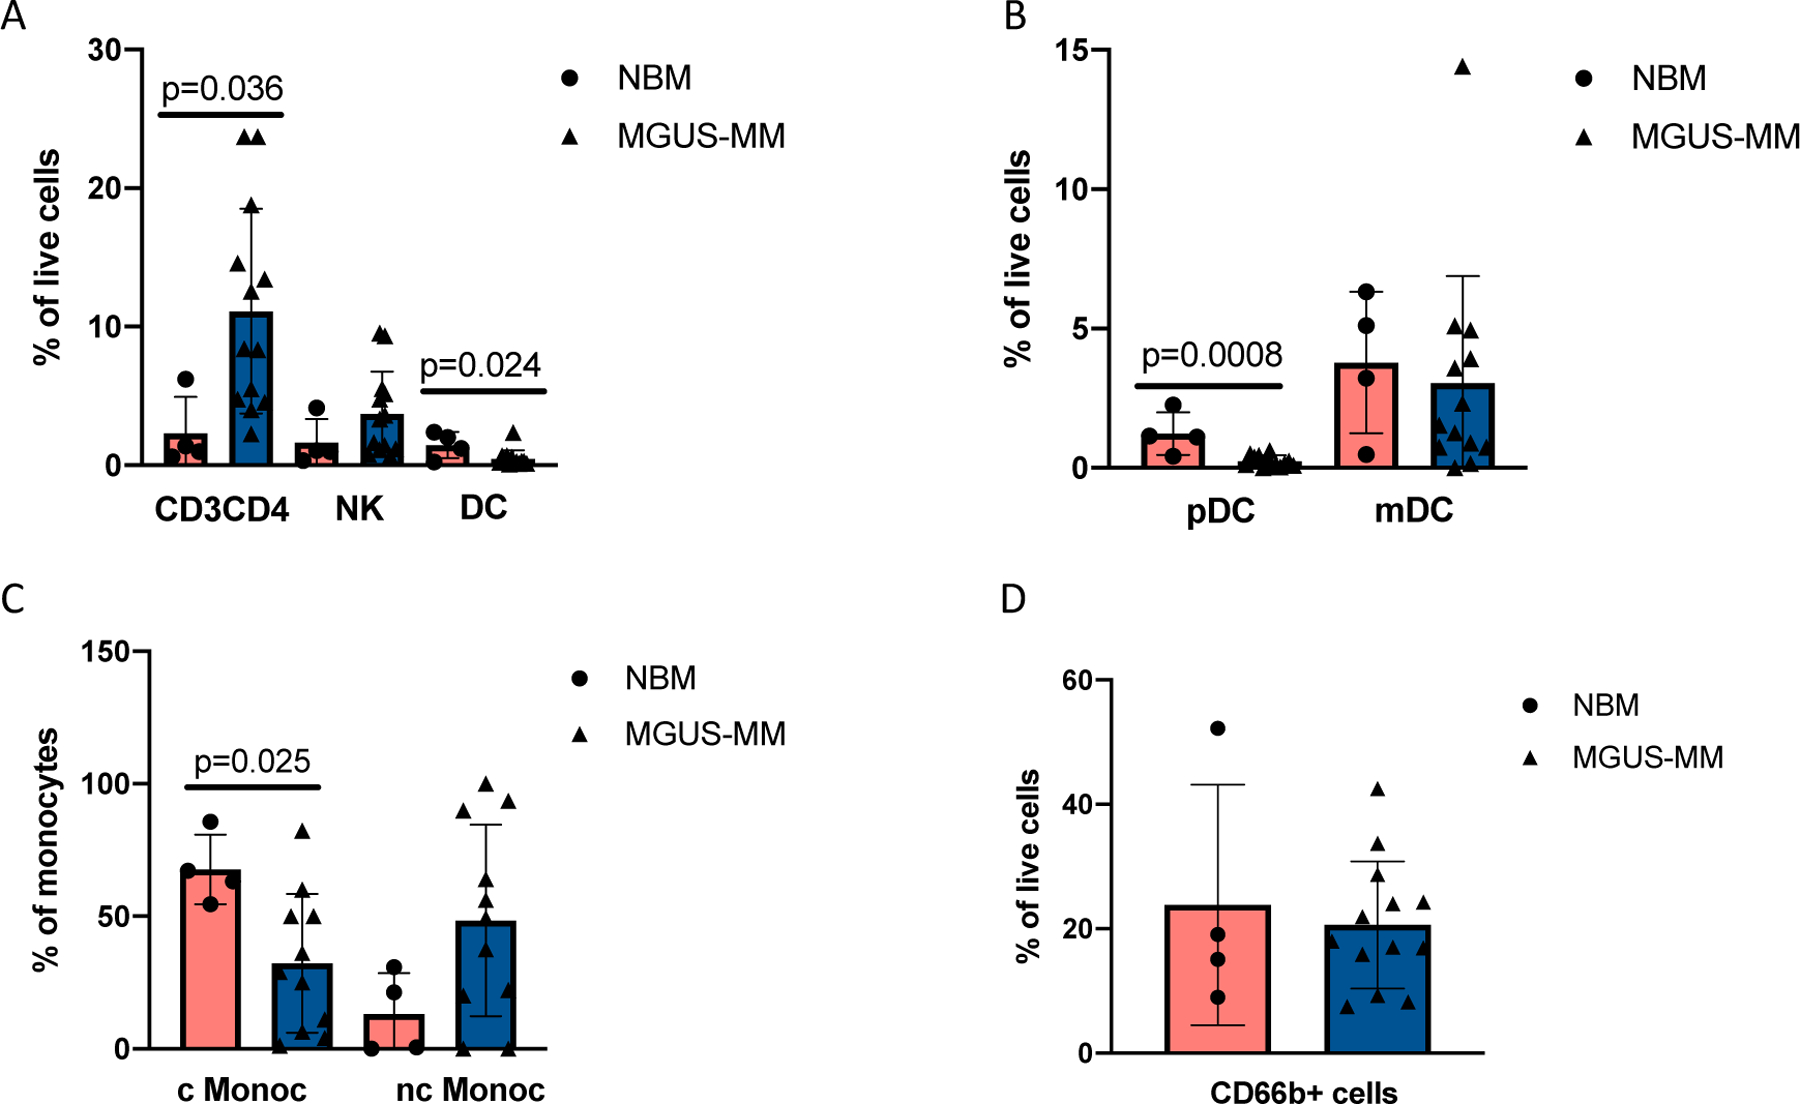
CyTOF profiling of 4 healthy donors and 13 MGUS-MM patients show (A) significantly increased numbers of CD3+CD4+ T cells in BM aspirates of the patients as compared to healthy BM with mean values of 2.3 and 11.12 for CD3+CD4+, 1.6 and 3.7 for NK, 1.5 and 0.5 for dendritic cells (DC) in healthy donors and MM patients respectively. Significant difference between groups was tested using a two-sided t-test. Bars represent SD. (B) Plasmacytoid DC (pDC) are significantly enriched in healthy BM as compared to MM patients with mean values of 1.2 and 0.26 respectively. Mean values for monocytic DC (mDC) are 3.7 and 3.2 for healthy donors and MM patients respectively. Significant difference between groups was tested using a two-sided t-test. Bars represent average deviation. (C) Classical monocytes (cMonoc) are enriched in BM aspirates of healthy donors compared to MM patients with respective mean values of 67.7and 26.5. Mean values for non-classical monocytes (nc Monoc) were 13.1 and 44.4 for healthy donors and MM patients respectively. Significant difference between groups was tested using a two-sided t-test. Bars represent average deviation. (D) Proportion of CD66b+ cells in BM aspirates of SMM patients and healthy donors. Mean values are 23.8 and 20.6 for healthy donors and MM patients respectively. Significant difference between groups was tested using a two-sided t-test. Bars represent SD.
Extended Data Figure 4. Transcriptional alterations in cytotoxic T cell populations of diseased patients as compared to healthy donors.
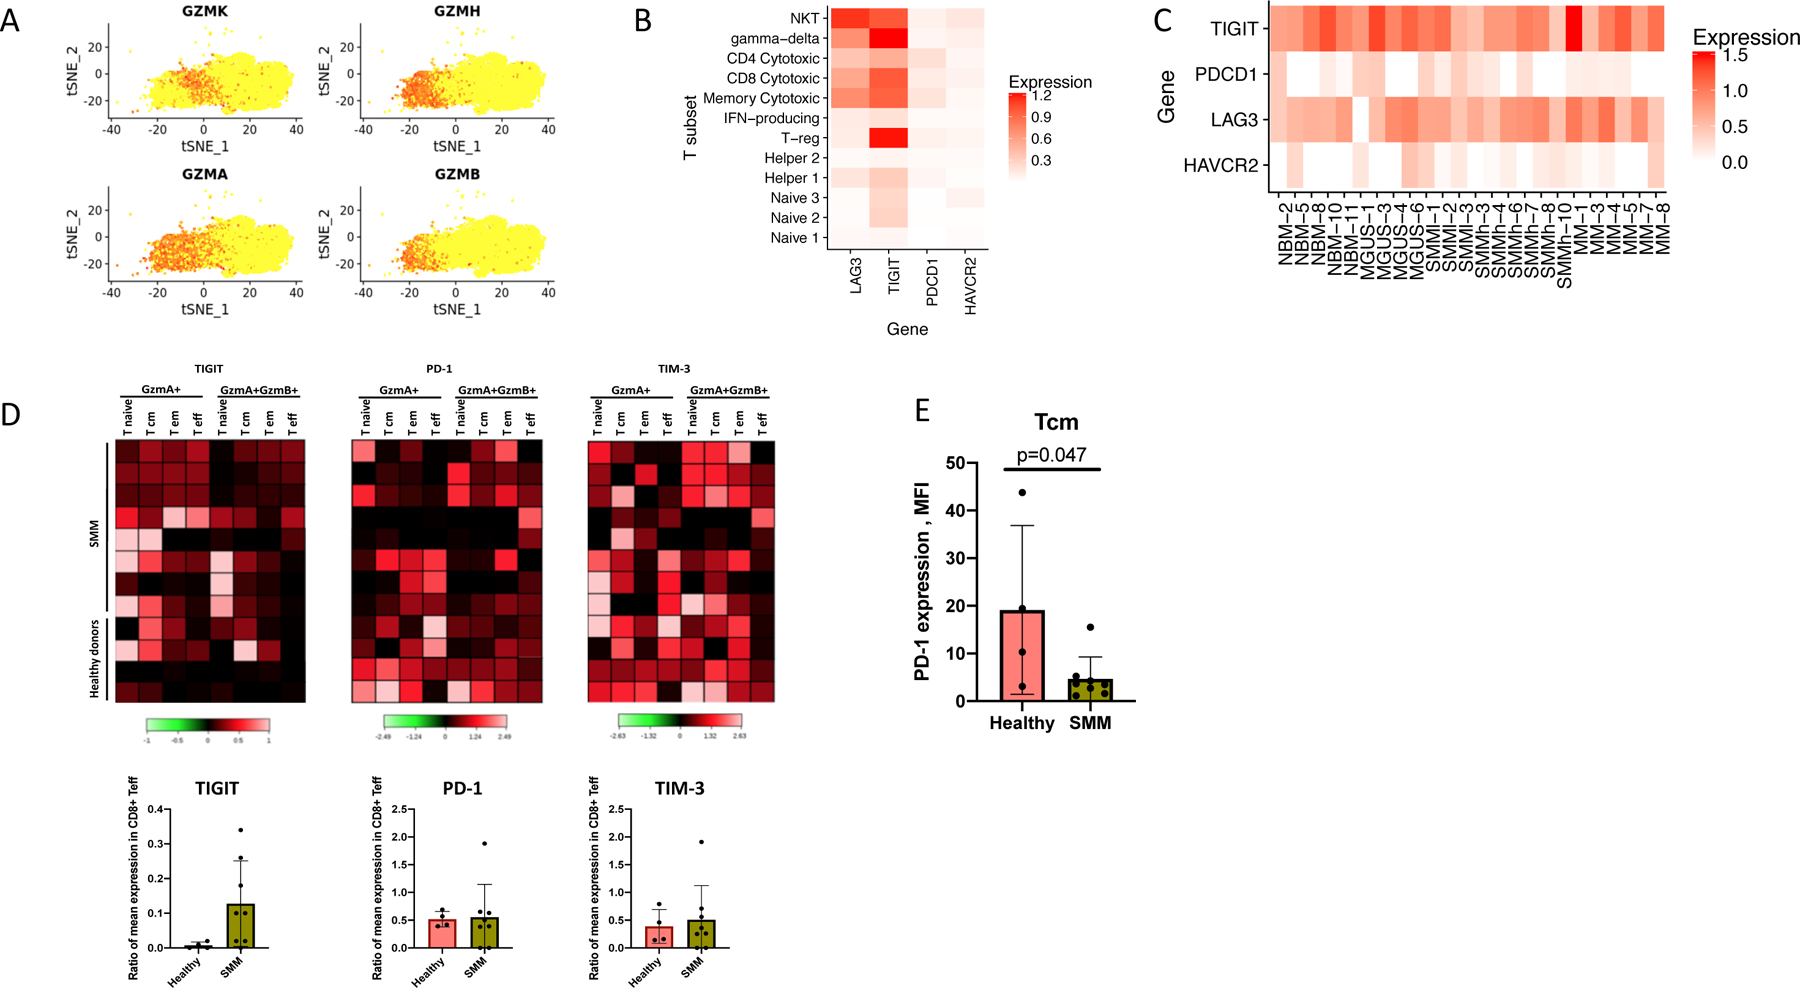
(A) Distribution of the Granzyme expression in T-cell cluster. GZMA+GZMB− corresponds to the Granzyme K expressing cells. (B) Normalized expression values for four exhaustion-related genes across different T cell subsets, pooling cells across patients. (C) Normalized expression values for four exhaustion-related genes across different donors and patients, pooling cells across T subsets. (D) Heatmap of immune checkpoint molecules expression levels on different subsets of bone marrow T cells in SMM patients (n=8) as compared to healthy donors (n=4). Individual patients show increased levels of PD-1 and TIGIT in GrB expressing effector cells. Colored scale represents transformed ratio of protein expression. Barplots show variable expression of TIGIT (with mean values of 0.01 vs 0.12), PD-1 (0.52 vs. 0.55) and TIM-3 (0.39 vs. 0.51) in GrB-expressing T effectors from healthy BM and SMM patients respectively. Significant difference between groups was tested using a two-sided t-test. Bars represent SD. (E) Healthy memory cells show significantly higher expression of PD-1 compared to those of SMM patients with mean values of 19.5 and 4.7 respectively. Significant difference between groups was tested using a two-sided t-test. Bars represent SD.
Extended Data Figure 5. IFN type-1 signaling increases in plasma cells during disease progression.
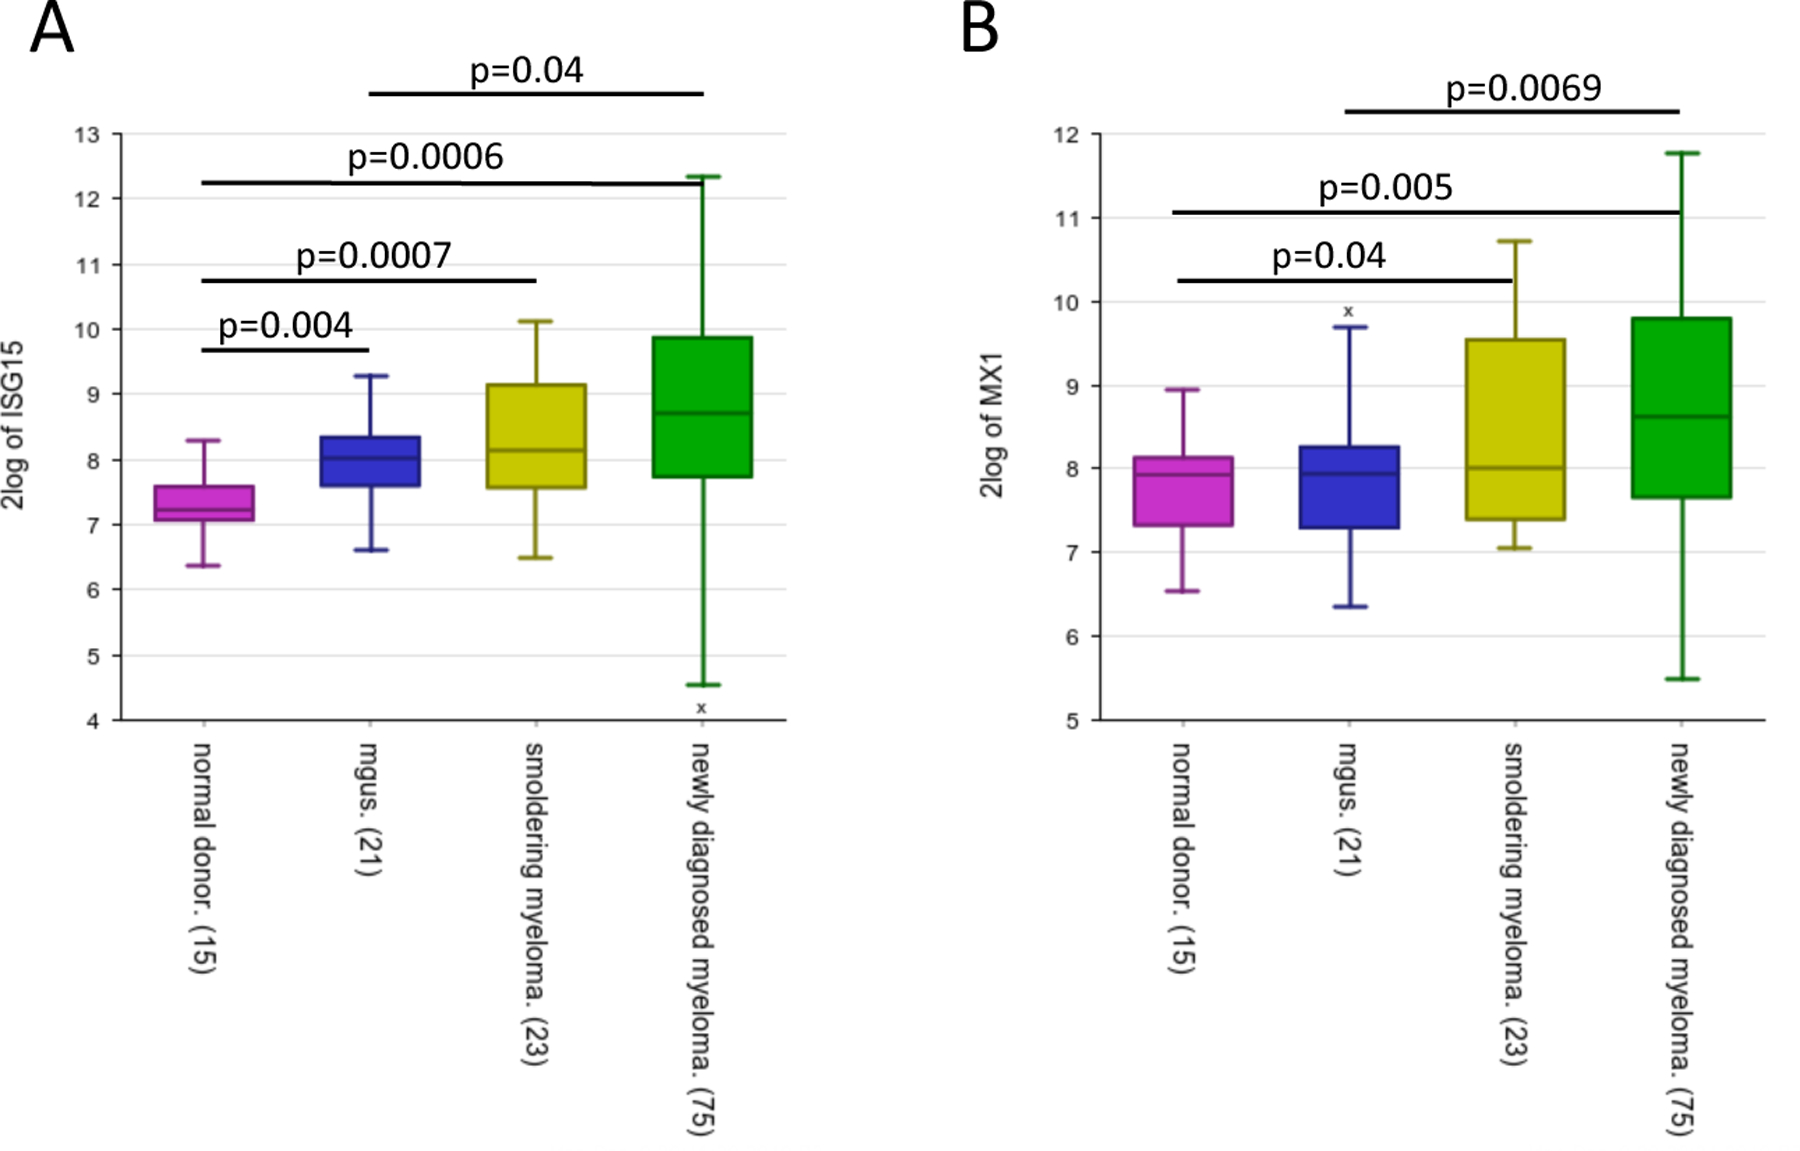
Expression of ISG-15 (A) and MX1 (B) increases during disease progression. Significant difference is observed between MGUS and MM stage, indicating an increase of IFN signals at later stages in the disease progression (GSE6477). Box plot displays the first quartile, median and third quartile for the gene expression levels, bars indicate the minimum and maximum value. Significant difference between groups was tested using one-way ANOVA and Tukey multiple comparison tests for healthy donors (ND, n=15), MGUS (n=21), SMM (n=23) and newly diagnosed MM (n=75).
Extended Data Figure 6. Marker genes demonstrating cell type identity of monocytic clusters.
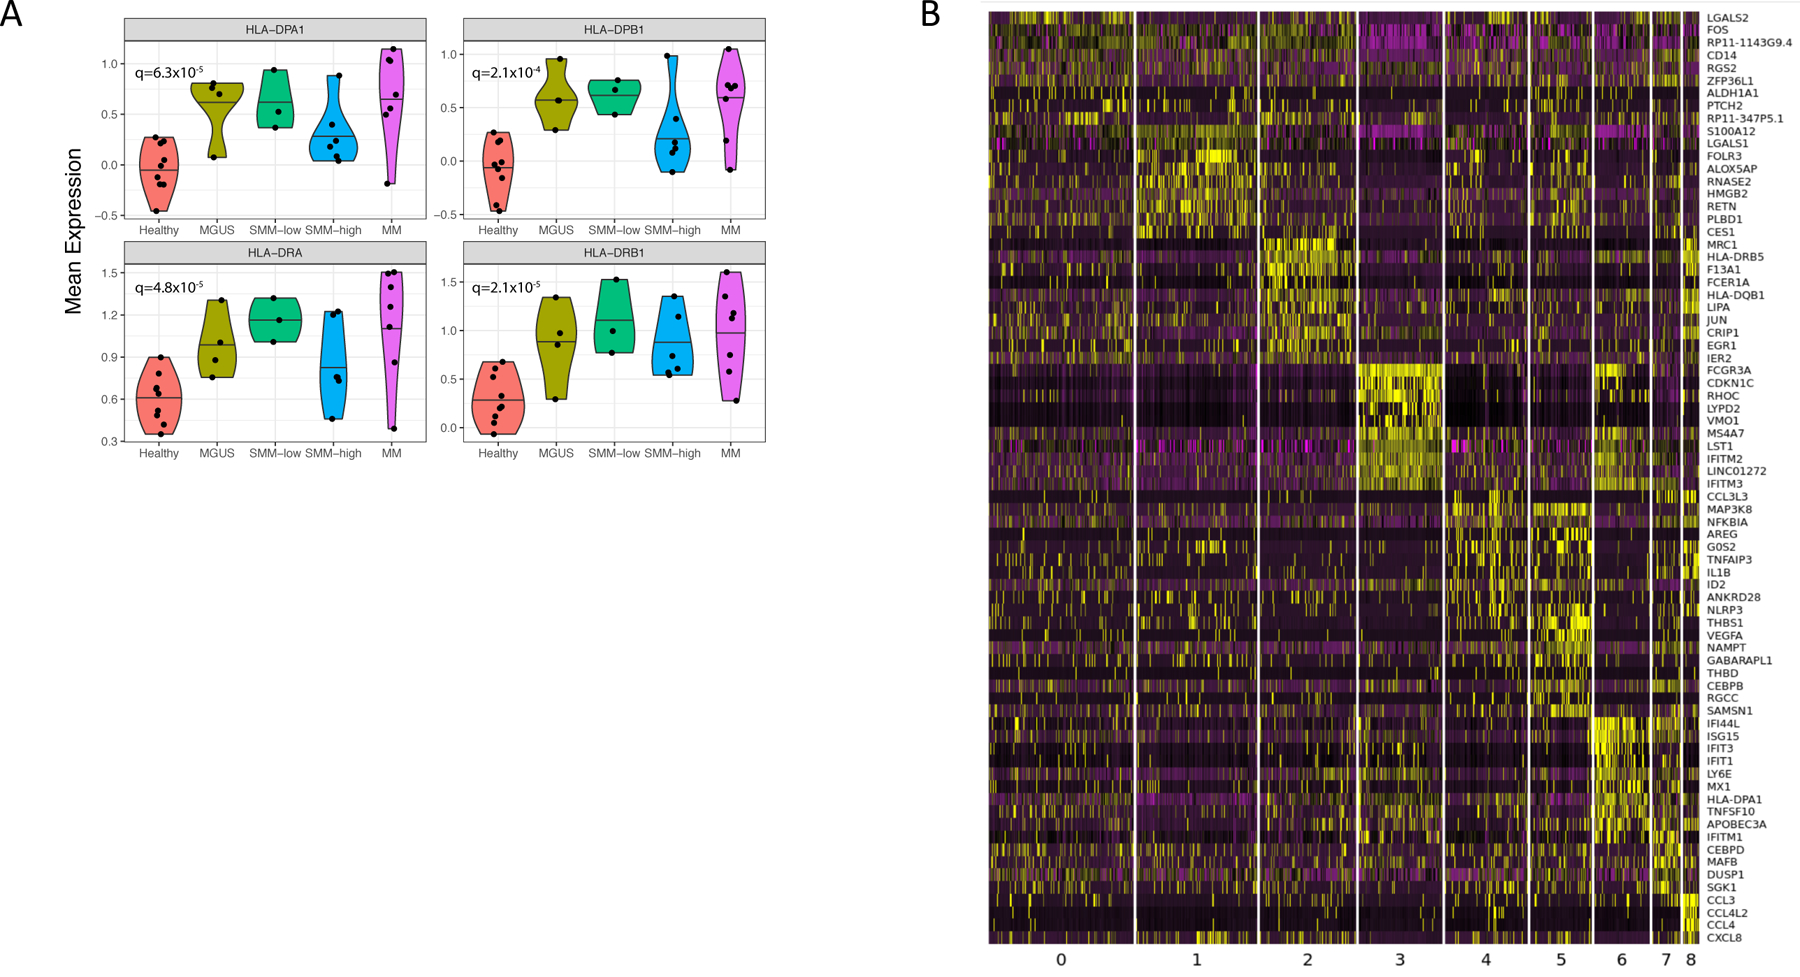
(A) Mean expression of MHC II encoding genes. Violin plots show minimum, median, and maximum values. A BH-corrected two-tailed t-test was performed on n=32 patient samples. (B) Heatmap of expression values for the top 10 genes with enriched expression in all monocytes discovered by k-nearest neighbors’ subclustering. Expression values are centered and normalized for each gene.
Extended Data Figure 7. Dysregulation of HLA-DR surface representation in monocytes from diseased environment.
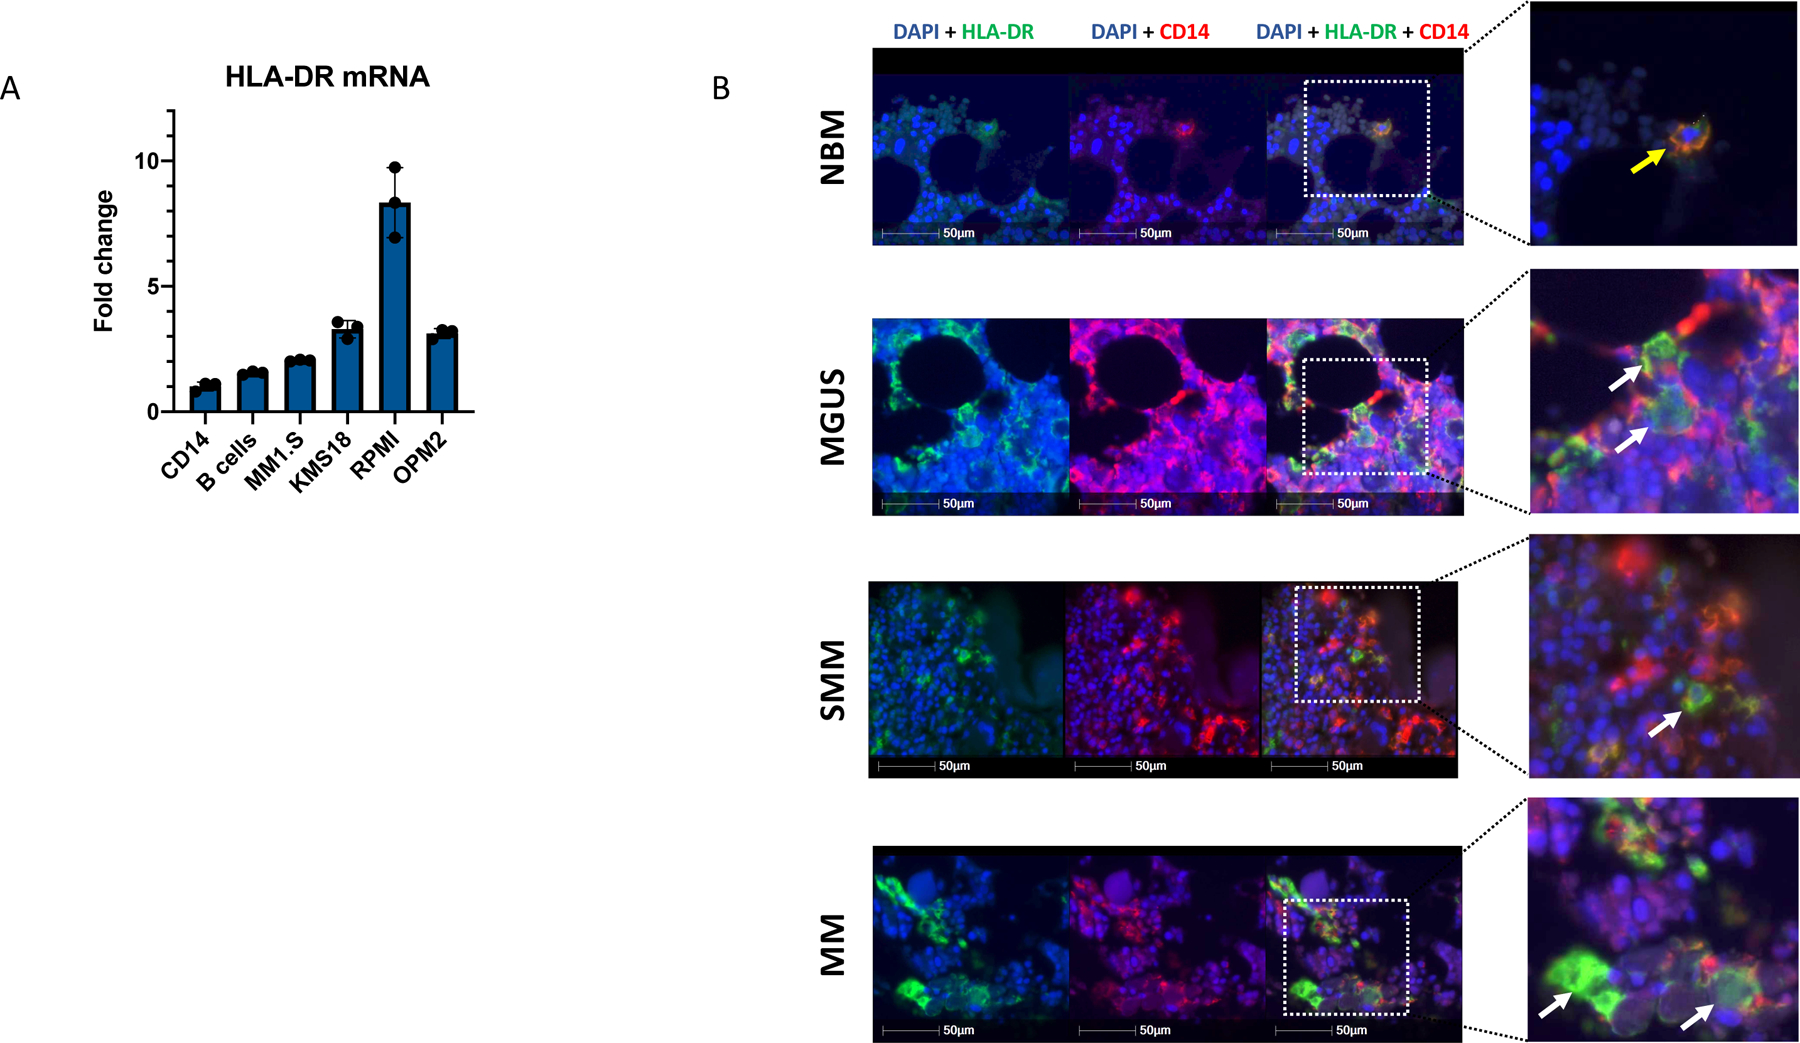
(A) qPCR data demonstrate significant increase of HLA-DR expression in CD14+ monocytes after co-culture with MM cell lines. CD14+ cells alone and those co-cultured with B cells were used as a control. Median ratios were 1.54 for B cells, 2.07 for MM1.S cells, 3.28 for KMS-18, 8.34 for RPMI and 3.12 for OPM2 cells as compared to CD14+ control (1.0). Bars represent SD. Experiment was performed twice with independent donors in triplicates. Representative data from one experiment is shown. (B) Immunofluorescence staining of tissue microarrays from MGUS, SMM and MM patients (n=45, TMA performed in triplicates, total of 135 BM sections analysed) demonstrates prevalent intracellular accumulation of HLA-DR (green) in CD14-expressing monocytes (red) in disease settings. Membrane-bound localization of HLA-DR was observed in healthy bone marrow monocytes. (yellow arrows point on cells with HLA-DR localized to the cell membrane, white arrows point on cells with HLA-DR accumulated in the cytoplasm.
Extended Data Figure 8. MARCH-1 dependent internalization of HLA-DR in CD14+ monocytes in myeloma environment.
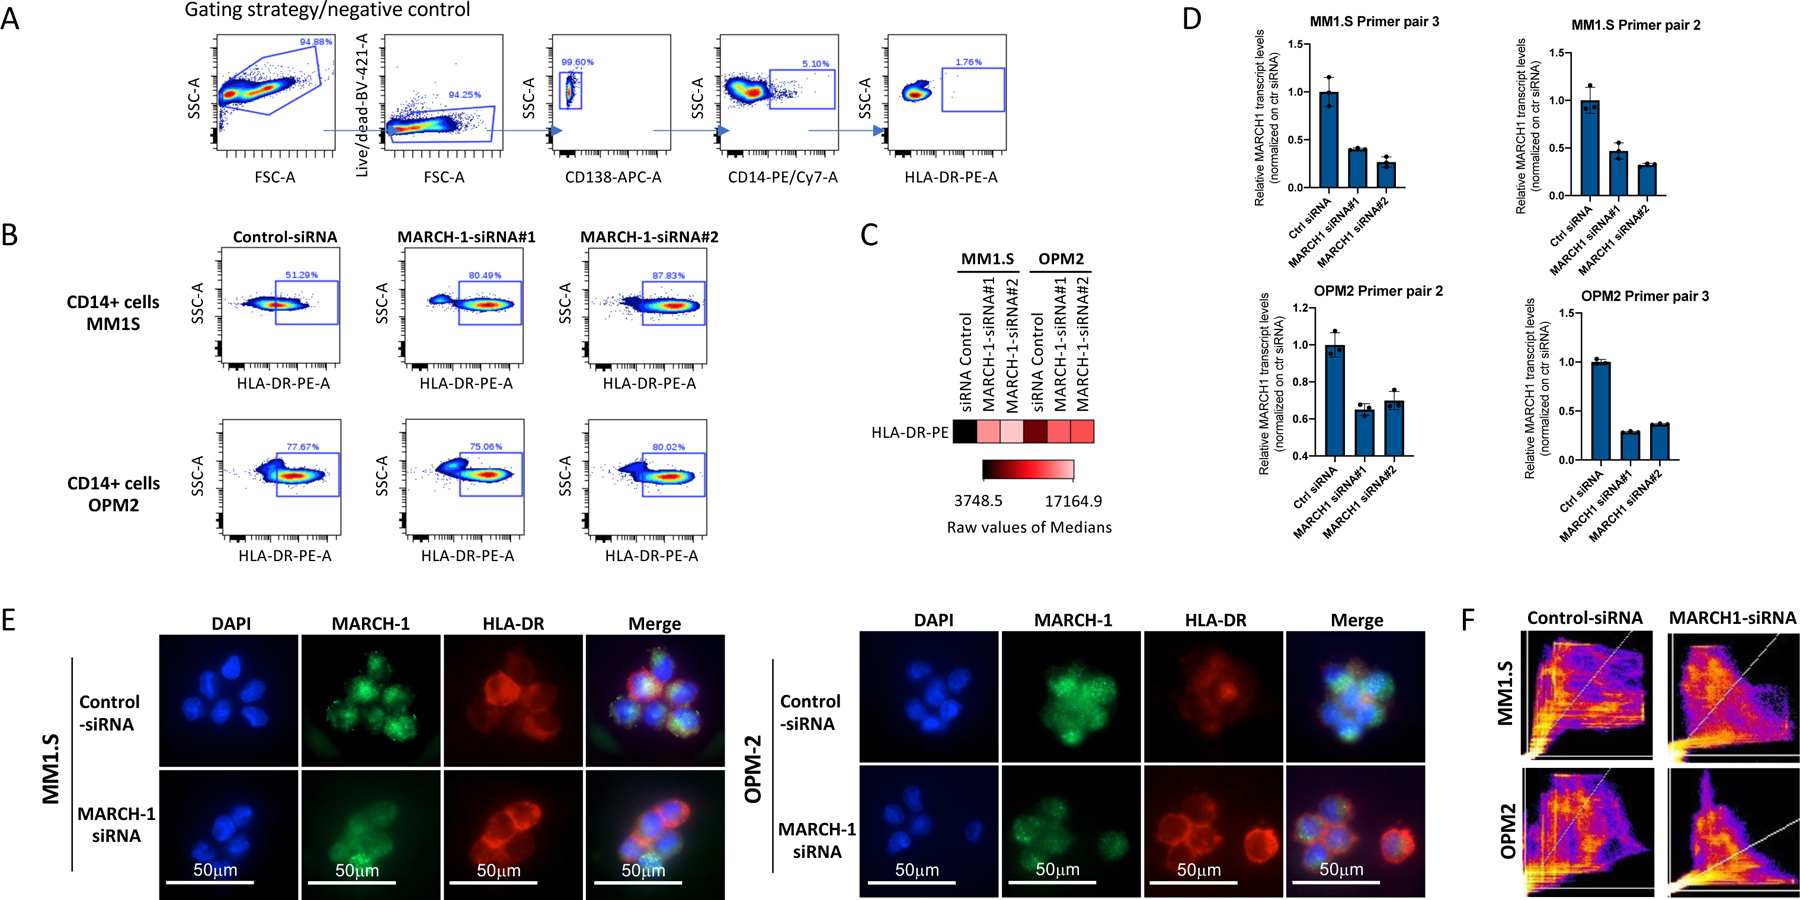
(A) Gating strategy for HLA-DR on CD14+ cells. (B) Knockdown of MARCH-1 by siRNA rescues presentation of HLA-DR molecules on the surface of CD14+ monocytes co-cultured with MM cells. Representative FACS profiles show higher numbers of HLA-DR+ cells after MARCH-1 knockdown with siRNA (experiment performed 3 times with 3 different donors using 2 different cell lines/2 different siRNA for MARCH-1, non-targeting si-RNA is used as a control). (C) Mean fluorescence intensity demonstrates the two to 4.5-fold increase in the levels of HLA-DR protein expression on the cell surface of CD14+ cells. (D) qPCR data for relative expression of MARCH-1 in CD14+ cells after siRNA knockdown as compared to the si-RNA control. Assay performed twice with independent donors/2 cell lines/2 siRNAs, performed in triplicates. Representative data from one experiment is shown. In MM1.S cells, siRNA knockdown leads to reduction of MARCH-1 expression to 0.46 and 0.32 (median value, amplified with primer pair 2) and to 0.40 and 0.26 (median value, amplified with primer pair 3) as compared to control siRNA (median value, 1.0). In OPM2 cells, siRNA knockdown leads to reduction of MARCH-1 expression to 0.65 and 0.7 (median value, amplified with primer pair 2) and to 0.29 and 0.36 (median value, amplified with primer pair 3) as compared to control siRNA (median value, 1.0). Bars represent STDEVP. (E) CD14+ cells with lower levels of MARCH-1 have increased HLA-DR protein on their cell surface. Experiment performed twice with two independent donors/2 cell lines/2 siRNAs. (F) Stronger correlation of DAPI and HLA-DR localization in MM1.S and OPM2 cells in control cells as compared to those after MARCH-1-siRNA transfection. Experiment performed twice with two independent donors/2 cell lines/2 siRNAs.
Extended Data Figure 9. CD14+ monocytes do not show the M-MDSC phenotype after co-culture with MM cells.
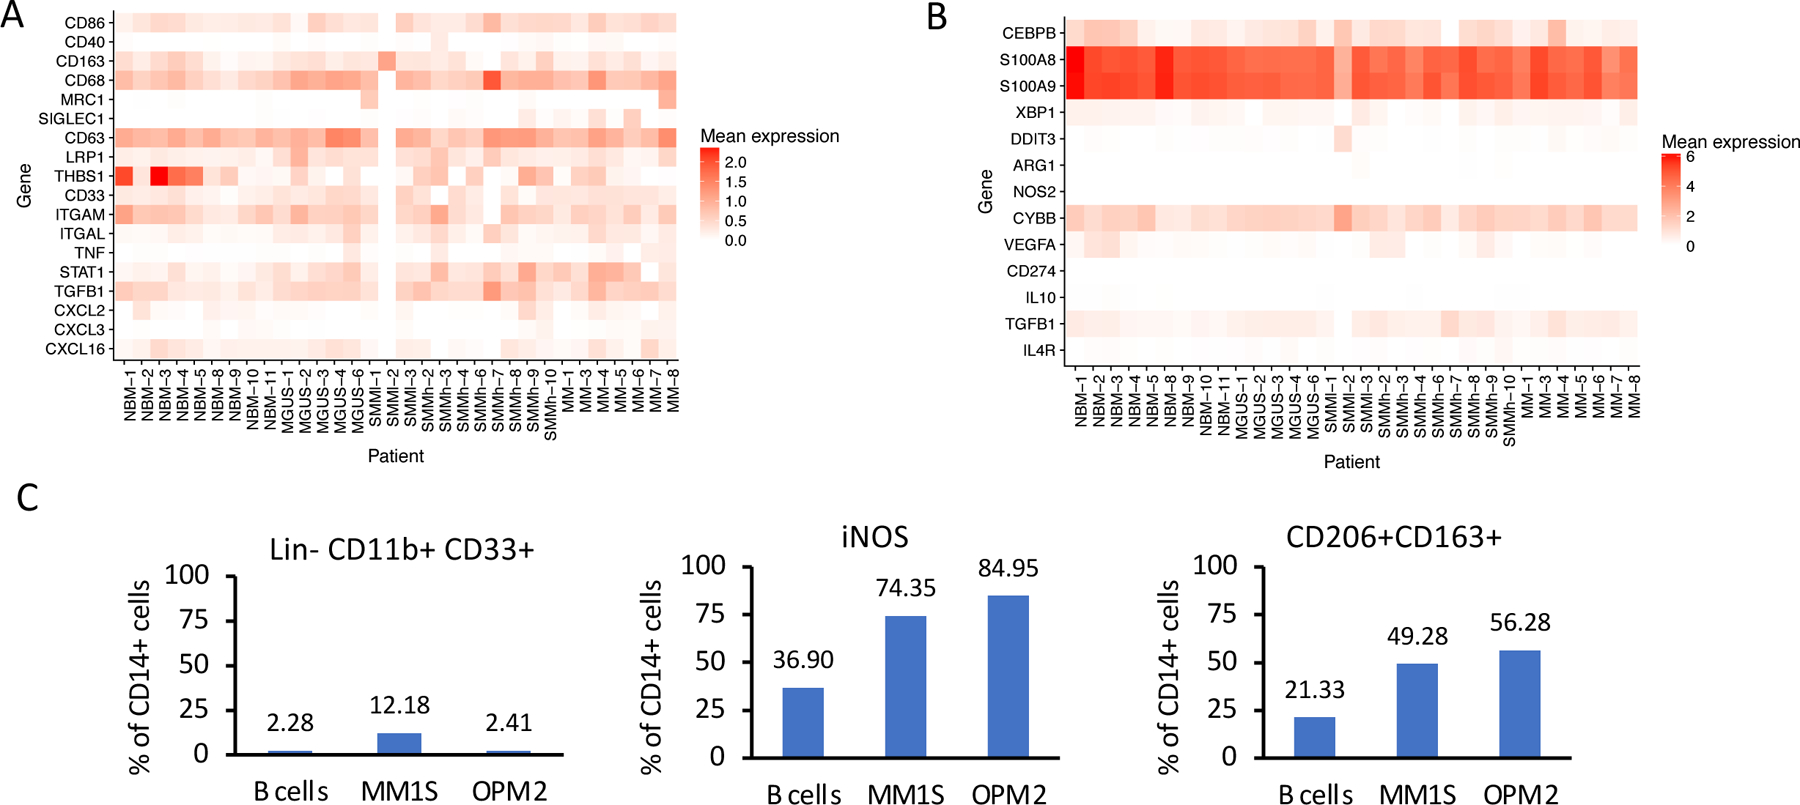
Expression of different markers for (A) macrophages/monocytes and (B) MDSCs on CD14+ cells in patients and healthy donors. (C) CD14+ cells from healthy donors were co-cultured with MM cells. FACS analysis was performed on day 3 after co-culture. Representative results from one out of two independent experiments performed with two healthy donors/2 different cell lines. Due to restricted cell numbers, no replicates could be used. All donors have similar distribution of cells as compared to controls.
Extended Data Figure 10: Alterations in tumor microenvironment start from the precursor stages of the MM and exhibit heterogeneous changes in the immune cell repertoire.
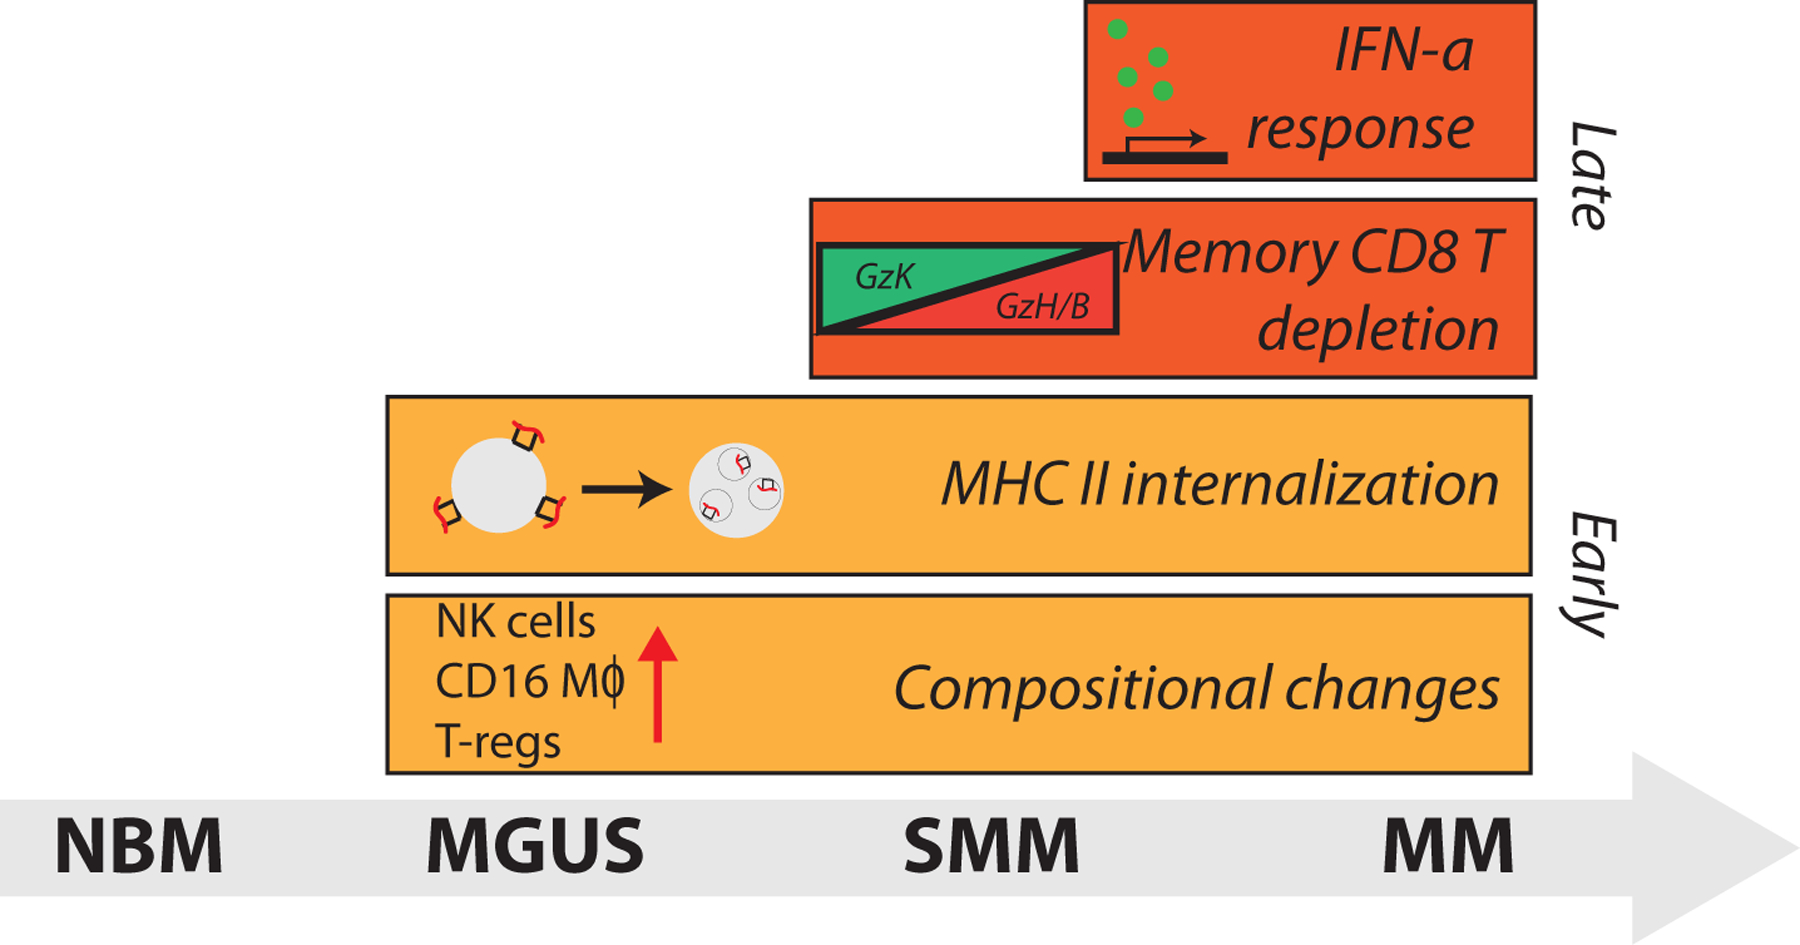
Illustration of immune alterations observed during progression. Bars begin at the stage in which they are first observed in our dataset.
Supplementary Material
Supplemental table 1: Patient data and clinical information. List of clinical measurements for samples used for single-cell RNA sequencing.
Supplemental table 2: Sample information. Bead selection and quality metrics for single-cell RNA samples.
Supplemental table 3: Marker genes demonstrating cell type identity of immune cell clusters. List of top 10 differentially expressed genes with average log fold-change (mean-expression in within-cluster cells compared to mean expression of all out-of-cluster cells) and FDR-corrected ranksum p-values in immune cell clusters discovered by k-nearest neighbors clustering on cells from n=32 patient samples.
ACKNOWLEDGMENTS
We thank Dana-Farber/Harvard Cancer Center in Boston, MA, for the use of the Specialized Histopathology Core for histology and immunohistochemistry service. Dana-Farber/Harvard Cancer Center is supported in part by an NCI Cancer Center Support Grant # NIH 5 P30 CA06516. G.G. was partially funded by the Paul C. Zamecnik Chair in Oncology, Massachusetts General Hospital Cancer Center. N.J.H. was partially funded by G.G. startup funds at Massachusetts General Hospital, R01 (PI: I.M.G.) and the Harvard Graduate Program in Biophysics, Harvard University. Molecular Biophysics Training Grant NIH/ NIGMS T32 GM008313 (PI: James M. Hogle).
Funding and support: Partially funded by the National Institutes of Health grant (NIH R01 CA 205954 and R01CA181683), Leukemia and Lymphoma Society (LLS), Multiple Myeloma Research Foundation (MMRF), Stand Up to Cancer (SU2C), and the Dr. Miriam and Sheldon G. Adelson Medical Research Foundation.
Footnotes
COMPETING INTERESTS STATEMENT
G.G. receives research funds from IBM and Pharmacyclics.
I.M.G. has a consulting/advisory role with GSK, AbbVie, Bristol-Myers Squibb (BMS). I.M.G has a consulting role with Sanofi, Janssen, Takeda, Celgene, Karyopharm, GNS, Cellectar, Medscape, Genetech, Adaptive, Aptitude, Curio Science, Magenta, Oncopeptides. I.M.G. received research funding/ honoraria from Celgene, Takeda, BMS, Janssen Pharmaceuticals, and Amgen.
REFERENCES
- 1.Kyle RA & Rajkumar SV Multiple myeloma. Blood 111, 2962–2972, doi: 10.1182/blood-2007-10-078022 (2008). [DOI] [PMC free article] [PubMed] [Google Scholar]
- 2.Landgren O Monoclonal gammopathy of undetermined significance and smoldering multiple myeloma: biological insights and early treatment strategies. Hematology Am Soc Hematol Educ Program 2013, 478–487, doi: 10.1182/asheducation-2013.1.478 (2013). [DOI] [PubMed] [Google Scholar]
- 3.Rajkumar SV Multiple myeloma: 2011 update on diagnosis, risk-stratification, and management. Am J Hematol 86, 57–65, doi: 10.1002/ajh.21913 (2011). [DOI] [PubMed] [Google Scholar]
- 4.Kyle RA et al. Monoclonal gammopathy of undetermined significance (MGUS) and smoldering (asymptomatic) multiple myeloma: IMWG consensus perspectives risk factors for progression and guidelines for monitoring and management. Leukemia 24, 1121–1127, doi: 10.1038/leu.2010.60 (2010). [DOI] [PMC free article] [PubMed] [Google Scholar]
- 5.Rajkumar SV et al. Serum free light chain ratio is an independent risk factor for progression in monoclonal gammopathy of undetermined significance. Blood 106, 812–817, doi: 10.1182/blood-2005-03-1038 (2005). [DOI] [PMC free article] [PubMed] [Google Scholar]
- 6.Rajkumar SV et al. Impact of primary molecular cytogenetic abnormalities and risk of progression in smoldering multiple myeloma. Leukemia 27, 1738–1744, doi: 10.1038/leu.2013.86 (2013). [DOI] [PMC free article] [PubMed] [Google Scholar]
- 7.Hanamura I et al. Frequent gain of chromosome band 1q21 in plasma-cell dyscrasias detected by fluorescence in situ hybridization: incidence increases from MGUS to relapsed myeloma and is related to prognosis and disease progression following tandem stem-cell transplantation. Blood 108, 1724–1732, doi: 10.1182/blood-2006-03-009910 (2006). [DOI] [PMC free article] [PubMed] [Google Scholar]
- 8.Manier S et al. Genomic complexity of multiple myeloma and its clinical implications. Nat Rev Clin Oncol 14, 100–113, doi: 10.1038/nrclinonc.2016.122 (2017). [DOI] [PubMed] [Google Scholar]
- 9.Blade J, Dimopoulos M, Rosinol L, Rajkumar SV & Kyle RA Smoldering (asymptomatic) multiple myeloma: current diagnostic criteria, new predictors of outcome, and follow-up recommendations. J Clin Oncol 28, 690–697, doi: 10.1200/JCO.2009.22.2257 (2010). [DOI] [PMC free article] [PubMed] [Google Scholar]
- 10.Kyle RA et al. Clinical course and prognosis of smoldering (asymptomatic) multiple myeloma. N Engl J Med 356, 2582–2590, doi: 10.1056/NEJMoa070389 (2007). [DOI] [PubMed] [Google Scholar]
- 11.Landgren O et al. Monoclonal gammopathy of undetermined significance (MGUS) consistently precedes multiple myeloma: a prospective study. Blood 113, 5412–5417, doi: 10.1182/blood-2008-12-194241 (2009). [DOI] [PMC free article] [PubMed] [Google Scholar]
- 12.Hanahan D & Weinberg RA The hallmarks of cancer. Cell 100, 57–70 (2000). [DOI] [PubMed] [Google Scholar]
- 13.Tyekucheva S et al. Stromal and epithelial transcriptional map of initiation progression and metastatic potential of human prostate cancer. Nat Commun 8, 420, doi: 10.1038/s41467-017-00460-4 (2017). [DOI] [PMC free article] [PubMed] [Google Scholar]
- 14.Glavey SV et al. Proteomic characterization of human multiple myeloma bone marrow extracellular matrix. Leukemia 31, 2426–2434, doi: 10.1038/leu.2017.102 (2017). [DOI] [PubMed] [Google Scholar]
- 15.El-Haibi CP et al. Critical role for lysyl oxidase in mesenchymal stem cell-driven breast cancer malignancy. Proc Natl Acad Sci U S A 109, 17460–17465, doi: 10.1073/pnas.1206653109 (2012). [DOI] [PMC free article] [PubMed] [Google Scholar]
- 16.Pearce OMT et al. Deconstruction of a Metastatic Tumor Microenvironment Reveals a Common Matrix Response in Human Cancers. Cancer Discov 8, 304–319, doi: 10.1158/2159-8290.CD-17-0284 (2018). [DOI] [PMC free article] [PubMed] [Google Scholar]
- 17.Finak G et al. Stromal gene expression predicts clinical outcome in breast cancer. Nat Med 14, 518–527, doi: 10.1038/nm1764 (2008). [DOI] [PubMed] [Google Scholar]
- 18.Calon A et al. Stromal gene expression defines poor-prognosis subtypes in colorectal cancer. Nat Genet 47, 320–329, doi: 10.1038/ng.3225 (2015). [DOI] [PubMed] [Google Scholar]
- 19.Petitprez F et al. PD-L1 Expression and CD8(+) T-cell Infiltrate are Associated with Clinical Progression in Patients with Node-positive Prostate Cancer. Eur Urol Focus 5, 192–196, doi: 10.1016/j.euf.2017.05.013 (2019). [DOI] [PubMed] [Google Scholar]
- 20.Zhang L et al. Intratumoral T cells, recurrence, and survival in epithelial ovarian cancer. N Engl J Med 348, 203–213, doi: 10.1056/NEJMoa020177 (2003). [DOI] [PubMed] [Google Scholar]
- 21.Podar K, Hideshima T, Chauhan D & Anderson KC Targeting signalling pathways for the treatment of multiple myeloma. Expert Opin Ther Targets 9, 359–381, doi: 10.1517/14728222.9.2.359 (2005). [DOI] [PubMed] [Google Scholar]
- 22.Klein B Cytokine, cytokine receptors, transduction signals, and oncogenes in human multiple myeloma. Semin Hematol 32, 4–19 (1995). [PubMed] [Google Scholar]
- 23.Sawanobori M et al. Natural killer cell frequency and serum cytokine levels in monoclonal gammopathies: correlation of bone marrow granular lymphocytes to prognosis. Acta Haematol 98, 150–154, doi: 10.1159/000203610 (1997). [DOI] [PubMed] [Google Scholar]
- 24.Pessoa de Magalhaes RJ et al. Analysis of the immune system of multiple myeloma patients achieving long-term disease control by multidimensional flow cytometry. Haematologica 98, 79–86, doi: 10.3324/haematol.2012.067272 (2013). [DOI] [PMC free article] [PubMed] [Google Scholar]
- 25.Bailur JK et al. Early alterations in stem-like/resident T cells, innate and myeloid cells in the bone marrow in preneoplastic gammopathy. JCI Insight 5, doi: 10.1172/jci.insight.127807 (2019). [DOI] [PMC free article] [PubMed] [Google Scholar]
- 26.Leone P et al. Dendritic cells accumulate in the bone marrow of myeloma patients where they protect tumor plasma cells from CD8+ T-cell killing. Blood 126, 1443–1451, doi: 10.1182/blood-2015-01-623975 (2015). [DOI] [PMC free article] [PubMed] [Google Scholar]
- 27.Kawano Y et al. Blocking IFNAR1 inhibits multiple myeloma-driven Treg expansion and immunosuppression. J Clin Invest 128, 2487–2499, doi: 10.1172/JCI88169 (2018). [DOI] [PMC free article] [PubMed] [Google Scholar]
- 28.Feng X et al. Targeting CD38 Suppresses Induction and Function of T Regulatory Cells to Mitigate Immunosuppression in Multiple Myeloma. Clin Cancer Res 23, 4290–4300, doi: 10.1158/1078-0432.CCR-16-3192 (2017). [DOI] [PMC free article] [PubMed] [Google Scholar]
- 29.Ramachandran IR et al. Myeloid-derived suppressor cells regulate growth of multiple myeloma by inhibiting T cells in bone marrow. J Immunol 190, 3815–3823, doi: 10.4049/jimmunol.1203373 (2013). [DOI] [PMC free article] [PubMed] [Google Scholar]
- 30.Nakamura K et al. Dysregulated IL-18 Is a Key Driver of Immunosuppression and a Possible Therapeutic Target in the Multiple Myeloma Microenvironment. Cancer Cell 33, 634–648 e635, doi: 10.1016/j.ccell.2018.02.007 (2018). [DOI] [PubMed] [Google Scholar]
- 31.Zheng Y et al. Macrophages are an abundant component of myeloma microenvironment and protect myeloma cells from chemotherapy drug-induced apoptosis. Blood 114, 3625–3628, doi: 10.1182/blood-2009-05-220285 (2009). [DOI] [PMC free article] [PubMed] [Google Scholar]
- 32.De Beule N et al. Tumour-associated macrophage-mediated survival of myeloma cells through STAT3 activation. J Pathol 241, 534–546, doi: 10.1002/path.4860 (2017). [DOI] [PubMed] [Google Scholar]
- 33.Osterborg A, Nilsson B, Bjorkholm M, Holm G & Mellstedt H Natural killer cell activity in monoclonal gammopathies: relation to disease activity. Eur J Haematol 45, 153–157, doi: 10.1111/j.1600-0609.1990.tb00443.x (1990). [DOI] [PubMed] [Google Scholar]
- 34.Scavelli C et al. Vasculogenic mimicry by bone marrow macrophages in patients with multiple myeloma. Oncogene 27, 663–674, doi: 10.1038/sj.onc.1210691 (2008). [DOI] [PubMed] [Google Scholar]
- 35.Minnie SA et al. Myeloma escape after stem cell transplantation is a consequence of T-cell exhaustion and is prevented by TIGIT blockade. Blood 132, 1675–1688, doi: 10.1182/blood-2018-01-825240 (2018). [DOI] [PubMed] [Google Scholar]
- 36.Dispenzieri A et al. Immunoglobulin free light chain ratio is an independent risk factor for progression of smoldering (asymptomatic) multiple myeloma. Blood 111, 785–789, doi: 10.1182/blood-2007-08-108357 (2008). [DOI] [PMC free article] [PubMed] [Google Scholar]
- 37.Perussia B Fc receptors on natural killer cells. Curr Top Microbiol Immunol 230, 63–88, doi: 10.1007/978-3-642-46859-9_6 (1998). [DOI] [PubMed] [Google Scholar]
- 38.Yang C et al. Heterogeneity of human bone marrow and blood natural killer cells defined by single-cell transcriptome. Nat Commun 10, 3931, doi: 10.1038/s41467-019-11947-7 (2019). [DOI] [PMC free article] [PubMed] [Google Scholar]
- 39.Bernardini G, Sciume G & Santoni A Differential chemotactic receptor requirements for NK cell subset trafficking into bone marrow. Front Immunol 4, 12, doi: 10.3389/fimmu.2013.00012 (2013). [DOI] [PMC free article] [PubMed] [Google Scholar]
- 40.Baecher-Allan C, Wolf E & Hafler DA MHC class II expression identifies functionally distinct human regulatory T cells. J Immunol 176, 4622–4631, doi: 10.4049/jimmunol.176.8.4622 (2006). [DOI] [PubMed] [Google Scholar]
- 41.Karalis K et al. Autocrine or paracrine inflammatory actions of corticotropin-releasing hormone in vivo. Science 254, 421–423, doi: 10.1126/science.1925600 (1991). [DOI] [PubMed] [Google Scholar]
- 42.Bratke K, Kuepper M, Bade B, Virchow JC Jr. & Luttmann W Differential expression of human granzymes A, B, and K in natural killer cells and during CD8+ T cell differentiation in peripheral blood. Eur J Immunol 35, 2608–2616, doi: 10.1002/eji.200526122 (2005). [DOI] [PubMed] [Google Scholar]
- 43.Ahn E et al. Role of PD-1 during effector CD8 T cell differentiation. Proc Natl Acad Sci U S A 115, 4749–4754, doi: 10.1073/pnas.1718217115 (2018). [DOI] [PMC free article] [PubMed] [Google Scholar]
- 44.Odorizzi PM, Pauken KE, Paley MA, Sharpe A & Wherry EJ Genetic absence of PD-1 promotes accumulation of terminally differentiated exhausted CD8+ T cells. J Exp Med 212, 1125–1137, doi: 10.1084/jem.20142237 (2015). [DOI] [PMC free article] [PubMed] [Google Scholar]
- 45.Roccaro AM et al. CXCR4 Regulates Extra-Medullary Myeloma through Epithelial-Mesenchymal-Transition-like Transcriptional Activation. Cell Rep 12, 622–635, doi: 10.1016/j.celrep.2015.06.059 (2015). [DOI] [PMC free article] [PubMed] [Google Scholar]
- 46.Brown RD et al. Prognostically significant cytotoxic T cell clones are stimulated after thalidomide therapy in patients with multiple myeloma. Leuk Lymphoma 50, 1860–1864, doi: 10.3109/10428190903216804 (2009). [DOI] [PubMed] [Google Scholar]
- 47.Raitakari M et al. T-cell expansions in patients with multiple myeloma have a phenotype of cytotoxic T cells. Br J Haematol 110, 203–209 (2000). [DOI] [PubMed] [Google Scholar]
- 48.Tienhaara A & Pelliniemi TT Peripheral blood lymphocyte subsets in multiple myeloma and monoclonal gammopathy of undetermined significance. Clin Lab Haematol 16, 213–223, doi: 10.1111/j.1365-2257.1994.tb00414.x (1994). [DOI] [PubMed] [Google Scholar]
- 49.Wu L et al. Lenalidomide enhances antibody-dependent cellular cytotoxicity of solid tumor cells in vitro: influence of host immune and tumor markers. Cancer Immunol Immunother 60, 61–73, doi: 10.1007/s00262-010-0919-9 (2011). [DOI] [PMC free article] [PubMed] [Google Scholar]
- 50.Jurisic V, Srdic T, Konjevic G, Markovic O & Colovic M Clinical stage-depending decrease of NK cell activity in multiple myeloma patients. Med Oncol 24, 312–317 (2007). [DOI] [PubMed] [Google Scholar]
- 51.Ponzetta A et al. Multiple Myeloma Impairs Bone Marrow Localization of Effector Natural Killer Cells by Altering the Chemokine Microenvironment. Cancer Res 75, 4766–4777, doi: 10.1158/0008-5472.CAN-15-1320 (2015). [DOI] [PubMed] [Google Scholar]
- 52.Zelle-Rieser C et al. T cells in multiple myeloma display features of exhaustion and senescence at the tumor site. J Hematol Oncol 9, 116, doi: 10.1186/s13045-016-0345-3 (2016). [DOI] [PMC free article] [PubMed] [Google Scholar]
- 53.Castella B, Foglietta M, Riganti C & Massaia M Vgamma9Vdelta2 T Cells in the Bone Marrow of Myeloma Patients: A Paradigm of Microenvironment-Induced Immune Suppression. Front Immunol 9, 1492, doi: 10.3389/fimmu.2018.01492 (2018). [DOI] [PMC free article] [PubMed] [Google Scholar]
- 54.Chan AC et al. Natural killer T cell defects in multiple myeloma and the impact of lenalidomide therapy. Clin Exp Immunol 175, 49–58, doi: 10.1111/cei.12196 (2014). [DOI] [PMC free article] [PubMed] [Google Scholar]
- 55.Dhodapkar MV & Richter J Harnessing natural killer T (NKT) cells in human myeloma: progress and challenges. Clin Immunol 140, 160–166, doi: 10.1016/j.clim.2010.12.010 (2011). [DOI] [PMC free article] [PubMed] [Google Scholar]
- 56.Castella B, Melaccio A, Foglietta M, Riganti C & Massaia M Vgamma9Vdelta2 T Cells as Strategic Weapons to Improve the Potency of Immune Checkpoint Blockade and Immune Interventions in Human Myeloma. Front Oncol 8, 508, doi: 10.3389/fonc.2018.00508 (2018). [DOI] [PMC free article] [PubMed] [Google Scholar]
- 57.Ortiz ML, Lu L, Ramachandran I & Gabrilovich DI Myeloid-derived suppressor cells in the development of lung cancer. Cancer Immunol Res 2, 50–58, doi: 10.1158/2326-6066.CIR-13-0129 (2014). [DOI] [PMC free article] [PubMed] [Google Scholar]
- 58.Fang Z et al. Myeloid-derived suppressor cell and macrophage exert distinct angiogenic and immunosuppressive effects in breast cancer. Oncotarget 8, 54173–54186, doi: 10.18632/oncotarget.17013 (2017). [DOI] [PMC free article] [PubMed] [Google Scholar]
- 59.Gabrilovich DI, Ostrand-Rosenberg S & Bronte V Coordinated regulation of myeloid cells by tumours. Nat Rev Immunol 12, 253–268, doi: 10.1038/nri3175 (2012). [DOI] [PMC free article] [PubMed] [Google Scholar]
- 60.Quail DF & Joyce JA Microenvironmental regulation of tumor progression and metastasis. Nat Med 19, 1423–1437, doi: 10.1038/nm.3394 (2013). [DOI] [PMC free article] [PubMed] [Google Scholar]
- 61.Zheng GX et al. Massively parallel digital transcriptional profiling of single cells. Nat Commun 8, 14049, doi: 10.1038/ncomms14049 (2017). [DOI] [PMC free article] [PubMed] [Google Scholar]
- 62.Taylor-Weiner A et al. Scaling computational genomics to millions of individuals with GPUs. Genome Biol 20, 228, doi: 10.1186/s13059-019-1836-7 (2019). [DOI] [PMC free article] [PubMed] [Google Scholar]
- 63.Tan VY & Fevotte C Automatic relevance determination in nonnegative matrix factorization with the beta-divergence. IEEE Trans Pattern Anal Mach Intell 35, 1592–1605, doi: 10.1109/TPAMI.2012.240 (2013). [DOI] [PubMed] [Google Scholar]
Associated Data
This section collects any data citations, data availability statements, or supplementary materials included in this article.
Supplementary Materials
Supplemental table 1: Patient data and clinical information. List of clinical measurements for samples used for single-cell RNA sequencing.
Supplemental table 2: Sample information. Bead selection and quality metrics for single-cell RNA samples.
Supplemental table 3: Marker genes demonstrating cell type identity of immune cell clusters. List of top 10 differentially expressed genes with average log fold-change (mean-expression in within-cluster cells compared to mean expression of all out-of-cluster cells) and FDR-corrected ranksum p-values in immune cell clusters discovered by k-nearest neighbors clustering on cells from n=32 patient samples.
Data Availability Statement
scRNAseq data that support the findings of this study have been deposited in the Gene Expression Omnibus (GEO) under accession codes GSE124310. Raw sequencing data has been deposited in dbGaP (phs001323.v1.p1). Previously published microarray data that were re-analysed here are available under accession code GSE6477. Source data for Fig. 1–6 and Extended Data Fig. 2–4 and 6–9 have been provided in corresponding Data Source Tables. All other data supporting the findings of this study are available from the corresponding author on reasonable request.


