

Abstract
BACKGROUND:
Ovarian cancer cells in malignant effusions lack attachment to solid-phase matrix substrata and receive survival stimuli through cell-cell and cell- soluble matrix molecule interactions. We hypothesized adhesion-related survival and proliferation pathway signals can inform clinical outcomes and guide targeted therapeutics.
METHODS:
Lysed cell pellets from a blinded set of benign (20) and malignant (51) peritoneal and pleural ovarian cancer patient effusions were applied to reverse phase protein arrays and examined using validated antibodies to adhesion-associated protein endpoints. Results were subjected to hierarchical clustering for signature development. Association between specimen type, protein expression, and clinicopathologic associations were analyzed with the Mann-Whitney U test. Survival outcomes were estimated using the Kaplan-Meier method with log-rank comparison.
RESULTS:
A cell adhesion protein signature obtained from unsupervised clustering distinguished malignant from benign effusions (p=6.18E-06). Protein subset analyses from malignant cases defined three cell adhesion protein clusters driven by E-cadherin, EpCAM, and N-cadherin, respectively. The components of the E- and N-cadherin clusters correlated with clinical outcome by Kaplan-Meier statistics. Univariate analysis indicated FAK and phospho-AKT were associated with higher overall and progression-free survival (PFS, p=0.03), and Akt, phospho-paxillin, and E- and N-cadherin were associated with improved PFS (p≤0.05). If 4 or 5 of the index adhesion proteins were high, PFS was improved by multivariate analysis (p≤0.01).
CONCLUSIONS:
This hypothesis-testing examination of tumor-cell adhesion molecules and pathways has yielded potential predictive biomarkers with which to triage patients to selected molecular therapeutics and may serve as a starting platform for biomarker-based stratification for clinical application.
Keywords: adhesion molecules, ascites, ovarian cancer, proteomics array
Condensed abstract:
Malignant effusions of ovarian cancer patients are rich in viable tumor cells. Understanding the biology of these cells may lead to targeted interventions to reduce the morbidity and burden of ascites and pleural effusions. We demonstrate that quantity and expression pattern of effusion cell adhesion molecules and signaling proteins can prognosticate progression-free intervals.
INTRODUCTION
Ovarian cancer (OvCa) remains the deadliest gynecologic malignancy with an estimated 13,850 deaths out of almost 22,000 new cases in 2010, a fractional death rate of 63%1. Widespread metastases to serosal surfaces with associated pleural and peritoneal effusions are common and contribute to OvCa mortality2. Malignant epithelial cells, reactive mesothelial cells, and leukocytes are the primary cell types found in OvCa effusions3. The microenvironment within these malignant effusions is uniquely enriched in growth factors, cytokines, and soluble adhesion molecules that facilitate resistance to attachment-independent programmed cell death, a process known as anoikis4, 5. Resistance to anoikis allows cancer cells to survive despite the absence of extracellular matrix (ECM) substrata, allowing malignant cells to shed from their primary site of origin, survive in suspension, and later to implant at distant sites within the pleural or peritoneal cavity. The cancer cell overcomes anoikis via adhesion, either to other cancer cells within the effusion or to soluble ECM glycoproteins such as laminin, collagens, or fibronectin. These ECM components have been reported to act through the FAK pathway to contribute to anoikis resistance6.
Homotypic, or cell-cell, contact is another cellular protection mechanism and occurs via cell adhesion molecules. Members of the cadherin family of proteins or other cell adhesion molecules such as epithelial cell adhesion molecule (EpCAM) mediate spheroid formation and promote cell survival and proliferation through “outside-in” signal transduction pathways7–9. Ovarian cancer is unique in its expression of cadherin proteins. Unlike most epithelial surfaces, E-, P-, and N-cadherin have been reported expressed in normal ovarian epithelium10 and in the cells of malignant effusions11. E-cadherin protein expression is increased in both OvCa malignant effusions and solid metastases12, 13. However, the expression and role of the other cadherins is less well explored. Akt and extracellular signal related kinase (ERK) pathways are downstream intracellular pathways activated by homotypic and cell-matrix and cell-cell interactions and are critically involved in the survival and invasive properties of OvCa cells found in effusions14, 15.
New methods to examine expression of activated and total proteins in clinical samples have emerged. We and others have used the reverse phase protein array (RPPA) to profile key signal transduction pathways in ovarian cancer15–17. RPPA may be applied in a high throughput fashion to allow simultaneous quantitative examination of a large number of cases18, 19. Use of this sensitive detection system allows analysis of expression patterns of multiple intra- and extra-cellular proteins, including phosphorylated (p-) proteins. Prior analysis of malignant ovarian effusion cells yielded identification of prominent signaling molecules and pathways15. However, that study did not examine downstream integrin and adhesion molecule signaling. Advances in analytical software allow unbiased, unsupervised data examination, such as two-way hierarchical clustering that can group samples with similar expression profiles. Clustering analyses are used to define protein signatures that may be used to differentiate benign from malignant samples and may be prognostic of clinical outcome.
Here we report the results of RPPA profiling of viably flash frozen cells from benign and malignant ovarian cancer-associated effusions. We hypothesized that proteomic expression profiling of cell adhesion and associated downstream intracellular proteins would yield both diagnostic and prognostic signal signatures. We correlate differential expression of adhesion and adhesion-related proteins with specimen type (benign vs. malignant cells), clinicopathologic parameters, and overall and progression-free survival.
MATERIALS AND METHODS
Patients and specimens.
Specimens and relevant clinical data were obtained prospectively and biobanked by the Departments of Gynecologic Oncology and Pathology, Norwegian Radium Hospital under Ethics Committee-approved informed consent according to national Norwegian and institutional guidelines. The National Institutes of Health Office of Human Subjects Research reviewed and approved examination of coded samples. Proteomic analyses using blinded samples were executed and results forwarded to and analyzed by the primary site. The dataset consisted of 71 peritoneal and pleural effusions archived between May 1998 and June 2003. Benign (20) and malignant peritoneal and pleural (51) effusion samples were obtained from patients with OvCa, carcinoma of the fallopian tube, and primary peritoneal carcinoma. In order to minimize contamination of tumor cell-specific expression, all specimens selected for the present study contained >50% carcinoma cells, the majority having tumor cell population of 80–100%. Benign effusions were obtained from patients with clinical suspicion of new or recurrent cancer in which morphological evaluation, immunohistochemistry, and flow cytometry ruled out the presence of malignant cells20, 21. Specimens were viably frozen within minutes of removal, in equal volumes of RPMI-1640 medium supplemented with 20% FCS and 20% DMSO; samples were shipped overnight on dry ice and received solidly frozen, and stored at −80°C until use.
RPPA and immunoblot.
After rapid thaw on ice, samples were lysed with a TPER-based buffer (Pierce, Rockford IL) as optimized by Winters and colleagues18. Samples were arrayed onto 25 replicate Whatman FAST slides (Whatman Ltd., Stanford, ME) using the Aushon 2470 arrayer (Burlington, MA) as described18. Each case was printed in a five-point 1:1 dilution curve to ensure that the linear detection range for all antibodies was achieved. Each sample dilution set was arrayed in triplicate on the same slide to minimize bias from ambient printing conditions, slide lot number, antibody incubation, and staining. All antibodies were from Cell Signaling Technologies (Beverly, MA) and were used at 1:1000 dilution, optimized using the following control cell lysates as described18. Anti-EPCAM is a mouse monoclonal antibody and all others are rabbit polyclonal antibodies. Cell lysates from human microvascular endothelial cells (HMVEC) with and without recombinant vascular endothelial growth factor treatment (VEGF 50ng/ml × 5minutes), HeLa cells treated with and without etoposide (25μM × 5hrs), HeLa cells treated with recombinant EGF (100ng/ml × 2hrs), and untreated A431 cells were printed on all slides as internal controls for vascular cell activation, apoptosis, and receptor tyrosine kinase pathway activation, respectively. In addition, a sample buffer-only negative control was printed with each dilution replicate for ambient background. Location of cases was randomly assigned on the slides. Slides were subsequently blocked and stained as described18. Effusion cell pellet lysates were subject to polyacrylamide gel electrophoresis and immunoblotted with indicated antibodies using standard methods22.
Reproducibility and reliability.
Relative total arrayed protein was quantitated by colloidal gold stain (BioRad, Hercules, CA) using slides 1, 8, 16, and 25. Stained slides were scanned, saved as .tif files and spot intensity measured as reported18. Reproducibility of slide printing was assessed through assessment of the correlation coefficient (R2) between total protein in slides 1, 8, 16, and 25. Reliability of printing was assessed by the coefficient of variation (CV) of the control lysates (N=6) and randomly selected patient sample lysates (N=8) on each slide followed by comparison of intra-slide CV.
Endpoint analyses.
Proteomic endpoints were examined using specific and sensitive antibodies with optimized titers (supplemental Table 1). All phosphorylation endpoints tested (p-protein) were activating signaling events. All antibodies were verified to have a single band on immunoblot and only optimized antibody lots were applied. The negative control slide was incubated with antibody diluent without primary antibody. Each array was scanned, spot intensity integrated over a fixed area, normalized to total protein colloidal gold stain from the most proximate of the colloidal gold controls, and a standardized, single data relative intensity unit value generated for each spot (ImageQuant Ver. 5.2, Molecular Dynamics, Sunnyvale, CA). This data point was used in the statistical analyses. Data presented are mean of triplicate spots.
Statistical analysis.
Hierarchical clustering and cell plots were performed with JMP7 (SAS, Cary, NC). Statistical analysis was performed applying the SPSS-PC package (v17.0, Chicago, IL). A 2-sided value of p<0.05 was considered significant. The association between specimen type (benign vs. malignant) and protein expression by array, and associations between protein expression and clinicopathologic parameters were analyzed using the Mann-Whitney U test. Clinicopathologic parameters were grouped as follows: Age: ≤60 vs. >60 years; histological grade: 1–2 vs. 3; FIGO stage: III vs. IV; optimal v. suboptimal surgical debulking; previous chemotherapy: yes vs. no; response to chemotherapy for primary disease and for disease recurrence: complete vs. partial response/ stable disease/ progression/allergic or adverse reaction. Survival data were available for the 51 patients with malignant effusions. Overall survival (OS) and progression-free survival (PFS) were estimated using the Kaplan-Meier method and groups compared with the log-rank test. For this analysis, protein expression was grouped as low or high based on median values; the 4- and 5- high groups were determined by having either 4 or 5 of the indicator univariate proteins highly expressed.
RESULTS
Patient Characteristics
Anonymized benign (20) and malignant (51) ovarian cancer patient effusion cell pellets obtained from therapeutic or diagnostic effusion sampling were used. Table 1 describes the clinicopathologic characteristics of the patient cohort. Most patients had high grade, advanced stage serous cancers at diagnosis, consistent with the normal distribution of epithelial ovarian cancer worldwide. Approximately equal numbers of patients underwent optimal or suboptimal debulking and most effusions were ascites.
Table 1:
Clinicopathologic data for 51 ovarian cancer patients.
| Parameter | Number of patients | |
|---|---|---|
| Age | (Mean; Range) | 62; 44–83 |
| FIGO stage | II | 1 |
| III | 28 | |
| IV | 21 | |
| NAa | 1 | |
| Grade | I | 3 |
| II | 13 | |
| III | 29 | |
| NAb | 6 | |
| Residual disease | ≤ 1 cm | 23 |
| > 1 cm | 22 | |
| NAc | 6 | |
| Histology | Serous | 44 |
| Endometrioid | 1 | |
| Mixed type | 5 | |
| Undifferentiated | 1 | |
| Effusion site | Peritoneum | 42 |
| Pleura | 9 | |
NA = non available
Four inoperable patients, for whom the primary tumor was unavailable for evaluation of histological grade, and two patients operated at another hospital, for whom the primary tumor was not accessible for review
Four inoperable patients and two patients who were operated at other hospitals, where residual disease volume was not registered
Quality Assessment
Each case was printed in 5 point 1:1 serial dilution in triplicate. Quality control was validated prior to examination of specific protein endpoints. Intra-slide reliability was examined by determining the coefficient of variation (CV) of total protein measures in control lysates and randomly selected patient lysates, consisting of 6 controls and 8 patient samples. Table 2 shows the CV within each slide and across the 4 slides stained with colloidal gold. The mean and median CV were less than 4% for each slide (range 0.55 – 5.72%), and mean and median CV for all samples was <10%, demonstrating intra-slide reliability of printing. Reproducibility of printing across slides was assessed by analysis of total protein staining over a series of 4 slides (slides 1, 8, 16, and 25). An equivalence plot is shown in Figure 1, demonstrating results for RPPA slide 1 v. RPPA slide 25 (R2=0.905; inset table shows all equivalence regressions). Excellent reproducibility in total protein printing was observed between slides with a median regression coefficient of 0.91 (range 0.88 – 0.93).
Table 2:
Coefficient of variation (%) of control and selected patient lysates.
| Sample | Slide 1 | Slide 8 | Slide 16 | Slide 25 |
|---|---|---|---|---|
| HeLa untreated | 1.55 | 2.05 | 2.30 | 2.56 |
| HeLa +EGF* | 1.77 | 2.31 | 4.33 | 2.44 |
| HeLa +etoposide | 1.51 | 2.94 | 3.13 | 2.66 |
| A431 untreated | 3.36 | 3.79 | 0.55 | 1.44 |
| HMVEC+VEGF** | 4.33 | 4.88 | 2.98 | 5.22 |
| HMVEC untreated | 3.25 | 3.57 | 0.96 | 3.45 |
| Patient 20 | 3.11 | 0.81 | 2.55 | 1.41 |
| Patient 52 | 2.42 | 2.58 | 5.72 | 1.69 |
| Patient 54 | 1.45 | 4.02 | 2.75 | 2.86 |
| Patient 58 | 2.71 | 2.40 | 1.45 | 3.82 |
| Patient 27 | 3.52 | 3.68 | 3.50 | 4.70 |
| Patient 14 | 2.01 | 3.71 | 4.86 | 2.63 |
| Patient 30 | 3.47 | 5.02 | 2.24 | 2.41 |
| Patient 29 | 1.84 | 5.88 | 4.85 | 1.27 |
| Median CV% | 2.57 | 3.63 | 2.86 | 2.60 |
| Mean CV% | 2.59 | 3.40 | 3.01 | 2.75 |
EGF: epidermal growth factor
VEGF: vascular endothelial growth factor
Figure 1. RPPA quality control.

Unity graph comparing colloidal gold stain results of arrays 1 and 25 (R2=0.905). Results are presented as relative intensity units. Inset table shows comparative regression coefficients for other quality control comparisons between arrays 1, 8, 16, and 25.
Cell Adhesion Protein Signature Discriminates Benign from Malignant Cells
We first tested the ability of the expression values of cell adhesion and adhesion-related target proteins to discriminate benign from malignant effusions using unsupervised hierarchical clustering. Figure 2A demonstrates near complete segregation of the benign and malignant samples. The aggregate protein expression data were then median-centered and used to define a cell adhesion protein (CAP) signature. Evaluation of clustering of benign v. malignant cases as a function of protein distribution clusters was examined. The biology leading to a differential distribution of the benign and cancer samples between the two protein clusters is significantly different (p=2E-05; Fig. 2B). The relative organization of protein expression in all samples weighted by the CAP signature is shown in Figure 2C. A statistically significant difference in expression of the average CAP signature was found between the benign (N=20) and malignant (N=51) samples (p=6.18E-06; Fig. 2D). Proteins with statistically significant differences in expression between benign and malignant samples are presented in the inset in Figure 2. These individual findings are consistent with the dendrogram linkage in Figure 2 and implicate survival, proliferation, and cell-matrix and cell-cell molecule signaling events. We confirm differential expression of these proteins in randomly selected representative effusion cell pellet lysates using immunoblots for index proteins with a surrogate total protein measure using GAPDH expression (Fig. 2E).
Figure 2. Unsupervised clustering of benign and malignant effusion data.

A. Unsupervised 2-way hierarchical clustering of malignant (c, red) and benign (b, green) samples. Most benign cases express low relative amounts of total and activated adhesion proteins. Inset: P value for greater differential protein expression in malignant samples. B. Statistical evaluation of the differential distribution of benign and cancer samples between clusters. C. Median-centered cell adhesion protein (CAP) signature. The CAP average was derived from the average signal intensity of all proteins examined. D. The CAP signature significantly segregates benign from malignant samples; p=6.2E-06. E. Immunoblot of representative randomly selected effusion cell lysates. After approximation of protein content, immunoblots were run from randomly selected lysates. Representative replicate blots are shown; relative protein loading is addressed with glyceraldehyde dehydrogenase protein content in the lysates. Lanes 1–4: benign; lanes 5–11, malignant effusions.
Cell Adhesion Protein Expression Correlates with Clinicopathologic Parameters
Clinicopathologic parameters such as age, FIGO stage, and the presence of residual disease after cytoreductive surgery are the most important known clinical predictors of disease outcome in ovarian cancer23. We examined the relationship of expression levels of individual arrayed total and p-proteins with these parameters (Table 3). The expression of p-Pyk2 and the ratio of p-Pyk2 to p-FAK were higher in younger patients, as was the expression of EpCAM and the EpCAM to P-cadherin ratio. We also found that the expression of P-cadherin and ratio of total Pyk to total FAK were higher in FIGO stage III when compared to the samples derived from FIGO stage IV. The expression of EpCAM and the ratio of the expression of EpCAM to N-cadherin were associated with greater residual disease following debulking surgery.
Table 3:
Expression of cell adhesion related proteins is higher in younger, stage III, sub-optimally debulked patients.
| Age | <60 vs. ≥60 yr |
|---|---|
| p-Pyk2 | p=0.016 |
| EpCAM | p=0.022 |
| EpCAM:P-cadherin ratio | p=0.019 |
| p-Pyk2:p-FAK ratio | p=0.017 |
| FIGO stage | III vs. IV |
| P-cadherin | p=0.049 |
| Pyk:FAK ratio | p=0.031 |
| Residual disease | >1 cm vs. ≤1 cm |
| EpCAM | p=0.016 |
| EpCAM :N-cadherin ratio: | p=0.03 |
Cell Adhesion Protein Clusters Prognosticate Outcome in Malignant Samples
We next analyzed protein by a 2-way unsupervised expression profile using all malignant samples (Fig. 3A). Three clusters, median-centered around the CAP (defined in Fig. 2B), were segregated and renamed by the dominant cell adhesion protein in the cluster: E-cadherin, EpCAM, and N-cadherin clusters (Fig. 3B–D, respectively). Figure 3E shows high ERK is prognostic of better overall survival and high p-paxillin, p-cadherin, and e-cadherin to improved progression-free survival. This led to independent evaluation of the driver proteins in the clusters. Kaplan-Meier estimates (Fig. 4) revealed overexpression of FAK was associated with longer OS and PFS and overexpression of E-cadherin, p-paxillin, Akt, and p-AKT were associated with higher PFS. FAK, E-cadherin, and p-paxillin were clustered together in the E-cadherin signature, suggesting that this group of proteins may make up an important signaling pathway in the malignant cells found in effusions. Higher expression of most of this group of proteins and AKT was associated with better PFS by univariate analysis (Fig. 4A–H). Statistical significantly improved PFS was observed in a multivariate analysis if 4 or 5 of those index proteins were highly expressed as a cassette (p=0.012 and 0.001, respectively; univariate survival curve, Fig. 4I, J).
Figure 3. Unsupervised clustering of malignant samples.
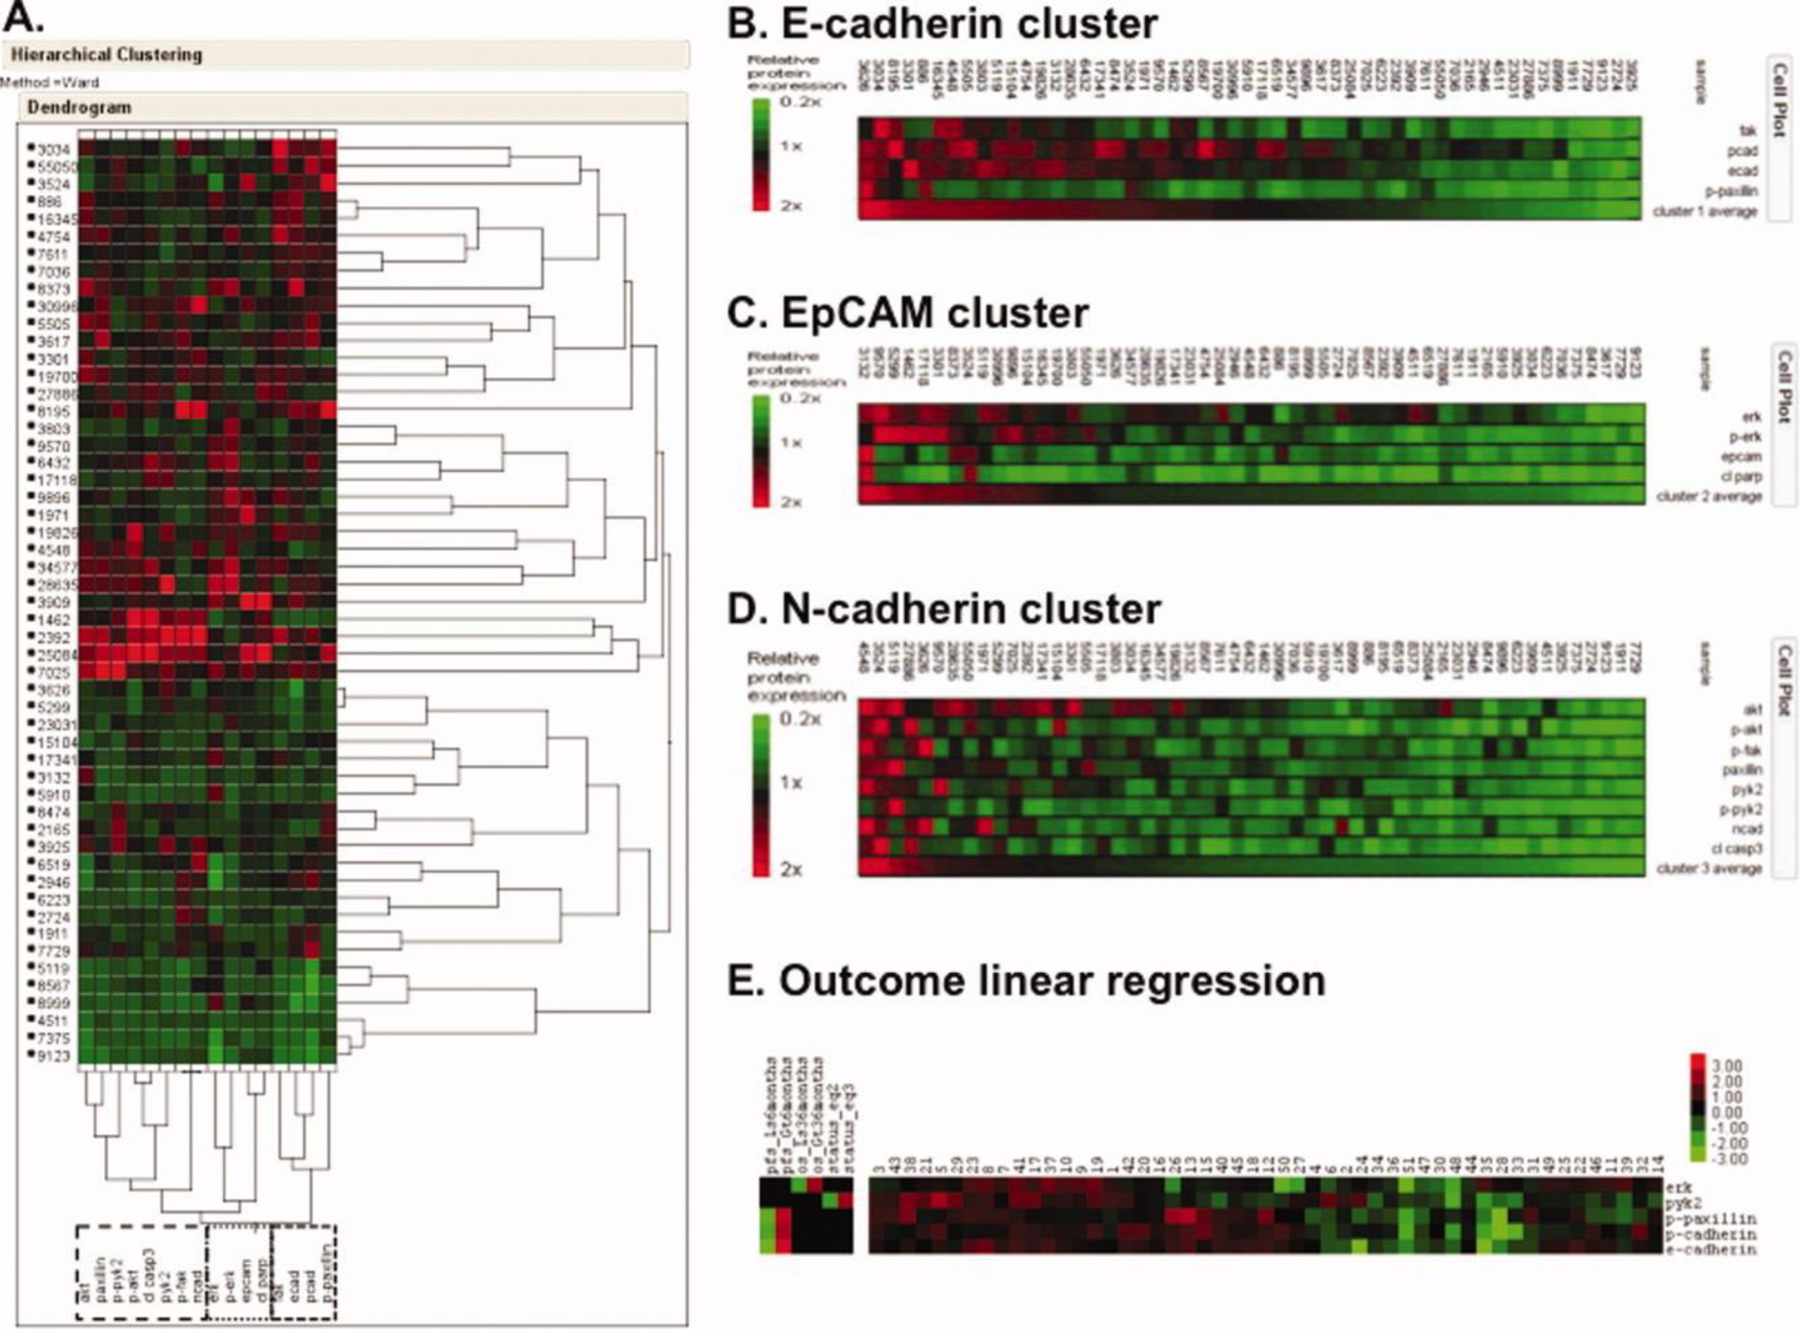
A. Unsupervised 2-way hierarchical clustering of 51 malignant samples segregates two groups by expression of adhesion proteins. B-D. E-cadherin (B), EpCAM (C), and N-cadherin (D) cell adhesion protein clusters were generated by from the unsupervised clustering in A. Results are median-centered around the CAP derived in Figure 2B. E. Outcome linear regression. Cluster results incorporating progression-free and overall survival.
Figure 4. Survival estimates based on expression of individual proteins.
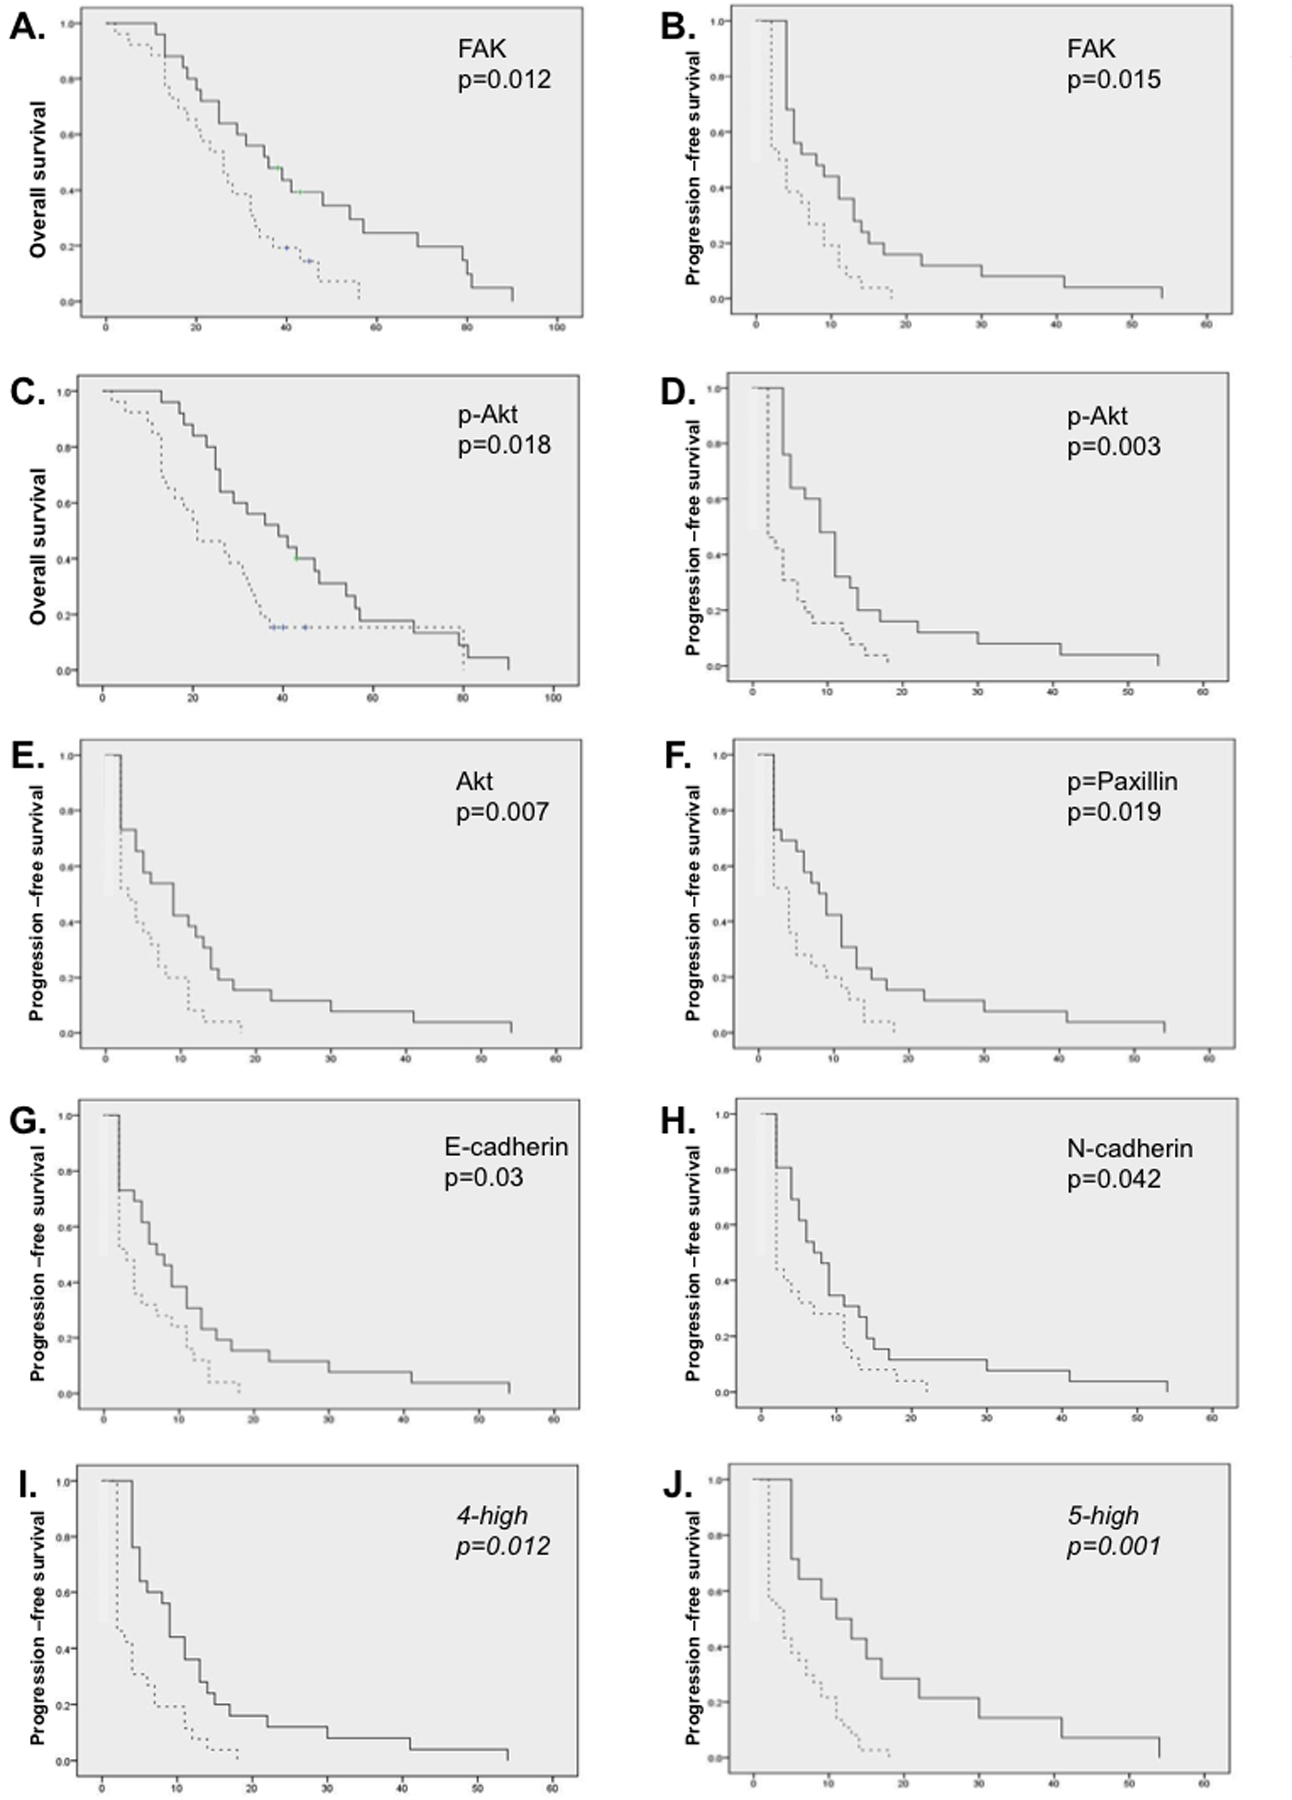
Kaplan-Meier survival was estimated around the median protein expression value for the indicated proteins (A-H) with OS (A and C) or PFS, and univariate p value indicated on the graph. I, J. Univariate survival (PFS) analysis based upon segregation by having 4 (I) or 5 (J) of the 6 index proteins highly expressed.
DISCUSSION
The presence of malignant cells in effusions of ovarian cancer patients has long had clinical prognostic implications and can impact treatment planning at time of diagnosis and at disease recurrence24, 25. Dissection of the biochemical processes that allow for cell survival in attachment-independent conditions may facilitate discovery of signaling molecules that are aberrantly expressed early in the process of ovarian cancer dissemination and in the later stages of disease recurrence and progression. This led us to hypothesize that a signature of cell-cell and cell-adhesion protein pathways in ovarian cancer effusions will uncover discriminating prognostic and potentially predictive informative biomarkers and/or therapeutic targets. We thus measured key cell-cell adhesion molecules within the cadherin and integrin signaling pathways to evaluate the relationship of cell-cell and cell-ECM signaling proteins with outcome and to posit a model where this signature may be applied. Selected survival signals with their immediate and downstream signal transduction effectors were included to complement the adhesion molecule data. Protein expression by reverse phase proteomic array indicated that both cell-cell and cell-integrin signaling events are active in the suspended cells of the effusions, and that both pathways had prognostic load in survival analyses. The ability to quantitate these proteins and relate their quantity to survival risks is a step in credentialing them as biomarkers for ovarian cancer outcome and therapy. Small molecule inhibitors against several of the proteins that were identified as prognostically important in our study are under clinical investigation26, 27. Our findings can be considered support for a prospective evaluation guiding targeted therapy selection for patients with malignant ovarian cancer effusions, which also will provide further evidence of the potential therapeutic predictive and prognostic value of the expression of these proteins.
Cadherins are transmembrane proteins that mediate homotypic cell adhesion through their extracellular domains and connect to the actin cytoskeleton28. They provide the transmembrane component of adherens junctions that are critical for cell polarity and tissue integrity. Cadherin expression has been found to be cell type-dependent with most normal epithelial cells expressing E-cadherin and most cells of mesenchymal origin expressing N-cadherin. E-cadherin was initially identified as a tumor suppressor gene and later confirmed in a number of cancers including diffuse gastric carcinomas29, and ovarian cancer10, 30–32. It has been shown to suppress cellular transformation by blocking nuclear beta-catenin signaling33. Inappropriate expression of cadherins, such as loss of E-cadherin and expression of N-cadherin or P-cadherin, is associated with epithelial-to-mesenchymal transition (EMT), a proposed mechanism involved in metastatic dissemination34, 35 and chemotherapy drug resistance36. Loss of adherent matrix contact survival signals is compensated with increased spheroid cell-cell survival, a hallmark of suspended cells of effusions, and one associated with increased cadherin expression34, 37. Normal ovarian surface epithelium and ovarian cancer have been described to express E, P-, and N-cadherin38, 39; these cells are known to actively remodel their environment during healing of ovulation wounds, a form of physiologic migration and invasive behavior. Thus, increased and varied cadherin quantities and patterns may represent targetable survival signals.
We suggest that the balance between the cadherins may be different in ovarian cancers with different degrees of aggressiveness and that this may also be manifest in part by the ability of the cancer to survive absent scaffolding, such as in an effusion. Patel and coworkers evaluated solid and effusion tumor samples showing P-cadherin was the predominant cadherin in ascites and was associated with disease progression10. Tothill and colleagues40 stratified ovarian cancer by gene expression profiles and identified two groups, a stromal-like group enriched for integrin, adhesion, motility, and angiogenesis signals (C1) and a mesenchymal subtype with prominent cadherin and developmental signaling genes (C5)40. Both C1 and C5 had relatively low E-cadherin membrane staining, consistent with their stromal/mesenchymal-like behavior and poor outcome. Our opposite findings of high E-cadherin protein association with improved outcome may be related to evaluation of solid v. suspension tumor, or examination of gene v. protein. The median age, proportion of high stage and grade, serous histological predominance, and proportion of optimally debulked patients in their C1 and C5 series parallels that of our effusion cases. Similar to our findings, Elloul and colleagues found up regulation of E-cadherin protein in ovarian cancer effusions13. Further study will be needed to understand these dichotomous results.
We sought to identify a prognostic signature of cell-adhesion molecules and downstream effector molecules in order to build a prognostic adhesion protein signature that could later be examined for prediction of targeted drug activity. Our confirmation of high E-cadherin expression itself as a positive prognostic factor provides support for the technique and analytical platforms applied. Total FAK, activated paxillin, E-cadherin, and P-cadherin were clustered together in an unsupervised analysis, and all are positively correlated with a longer progression-free survival. FAK and paxillin are recognized mediators of integrin signaling. These molecules may regulate contact inhibition and decrease the migratory capabilities of effusion cells in the context of cadherin-mediated cell-cell contact by promoting proper assembly of those contacts41, 42. Although cadherin-mediated adhesion can facilitate resistance to anoikis via cell-cell contact and spheroid formation, these cells may be less motile and have less of an invasive drive43. Our data suggest OvCa cells are able to survive in a cadherin-independent fashion, described by under expression of the E-cadherin signature in those cases with a worse clinical outcome. Activated FAK, PYK2, and AKT in the N-cadherin group are consistent with activation of pro-survival effects6, 27, 44, although individually, high FAK expression predicts better outcome.
The segregation of the malignant samples by cell adhesion protein signature has implications in clinical practice, as cell adhesion molecule expression relationship to drug response is emerging as a potential biomarker45, 46. Paclitaxel resistance in an ovarian cancer cell line was associated with a more mesenchymal, motile, and invasive phenotype, with reduced expression levels of E-cadherin45. Restoration of E-cadherin expression in gefitinib-resistant cell lines resulted in renewed sensitivity to gefitinib, a small molecule inhibitor of the epidermal growth factor receptor45, 46. Cells with little to no E-cadherin expression may be more resistant to cytotoxic and targeted chemotherapy36, but therapy directed at cell adhesion proteins such as EpCAM may have beneficial effects47. The trifunctional anti-EpCAM monoclonal antibody, catumaxomab, has demonstrated benefit and has been approved in Europe for the palliative relief of malignant ascites48, 49. Our intermediate EpCAM signature may be applied in a trial setting to select a patient population for catumaxomab use. In a similar context, small molecule inhibitors of FAK and its upstream partner, src, are now under clinical investigation. Dasatinib, an abl and src kinase inhibitor, is being studied in solid tumors as a single agent, and in our group in combination with bevacizumab (NCT00792545). Collection and proteomic adhesion protein signatures evaluation of paired tissue biopsies and fluid samples prior to and on therapy may provide insight into susceptibility or resistance to the clinical intervention. Such findings will form the basis for subsequent clinical investigation.
The effusion adhesion protein clusters identified herein may have value as a predictive biomarker tool with which to examine stratification or selection of patients who might have increased benefit from agents such as catumaxomab, FAK or Src inhibitors, for treatment of effusion-associated ovarian cancer. We have demonstrated that small numbers of cells, such as from a needle core biopsy50, 51 or spun down from a small diagnostic volume of effusion can be applied to RPPA and the multiple adhesion signaling protein endpoints analyzed. This type of pre-treatment evaluation of the CAP signature in malignant effusions can thus be done from pathologic waste remaining after therapeutic or diagnostic taps. A proposed schema for application of the adhesion protein signature for treatment decisions is presented in Figure 5. Our findings confirm individual protein studies and show greater potential value from an adhesion protein and pathway signature over single protein endpoint information.
Figure 5. Proposed schema for pre-treatment evaluation and treatment stratification of ovarian cancer patients with malignant ascites.
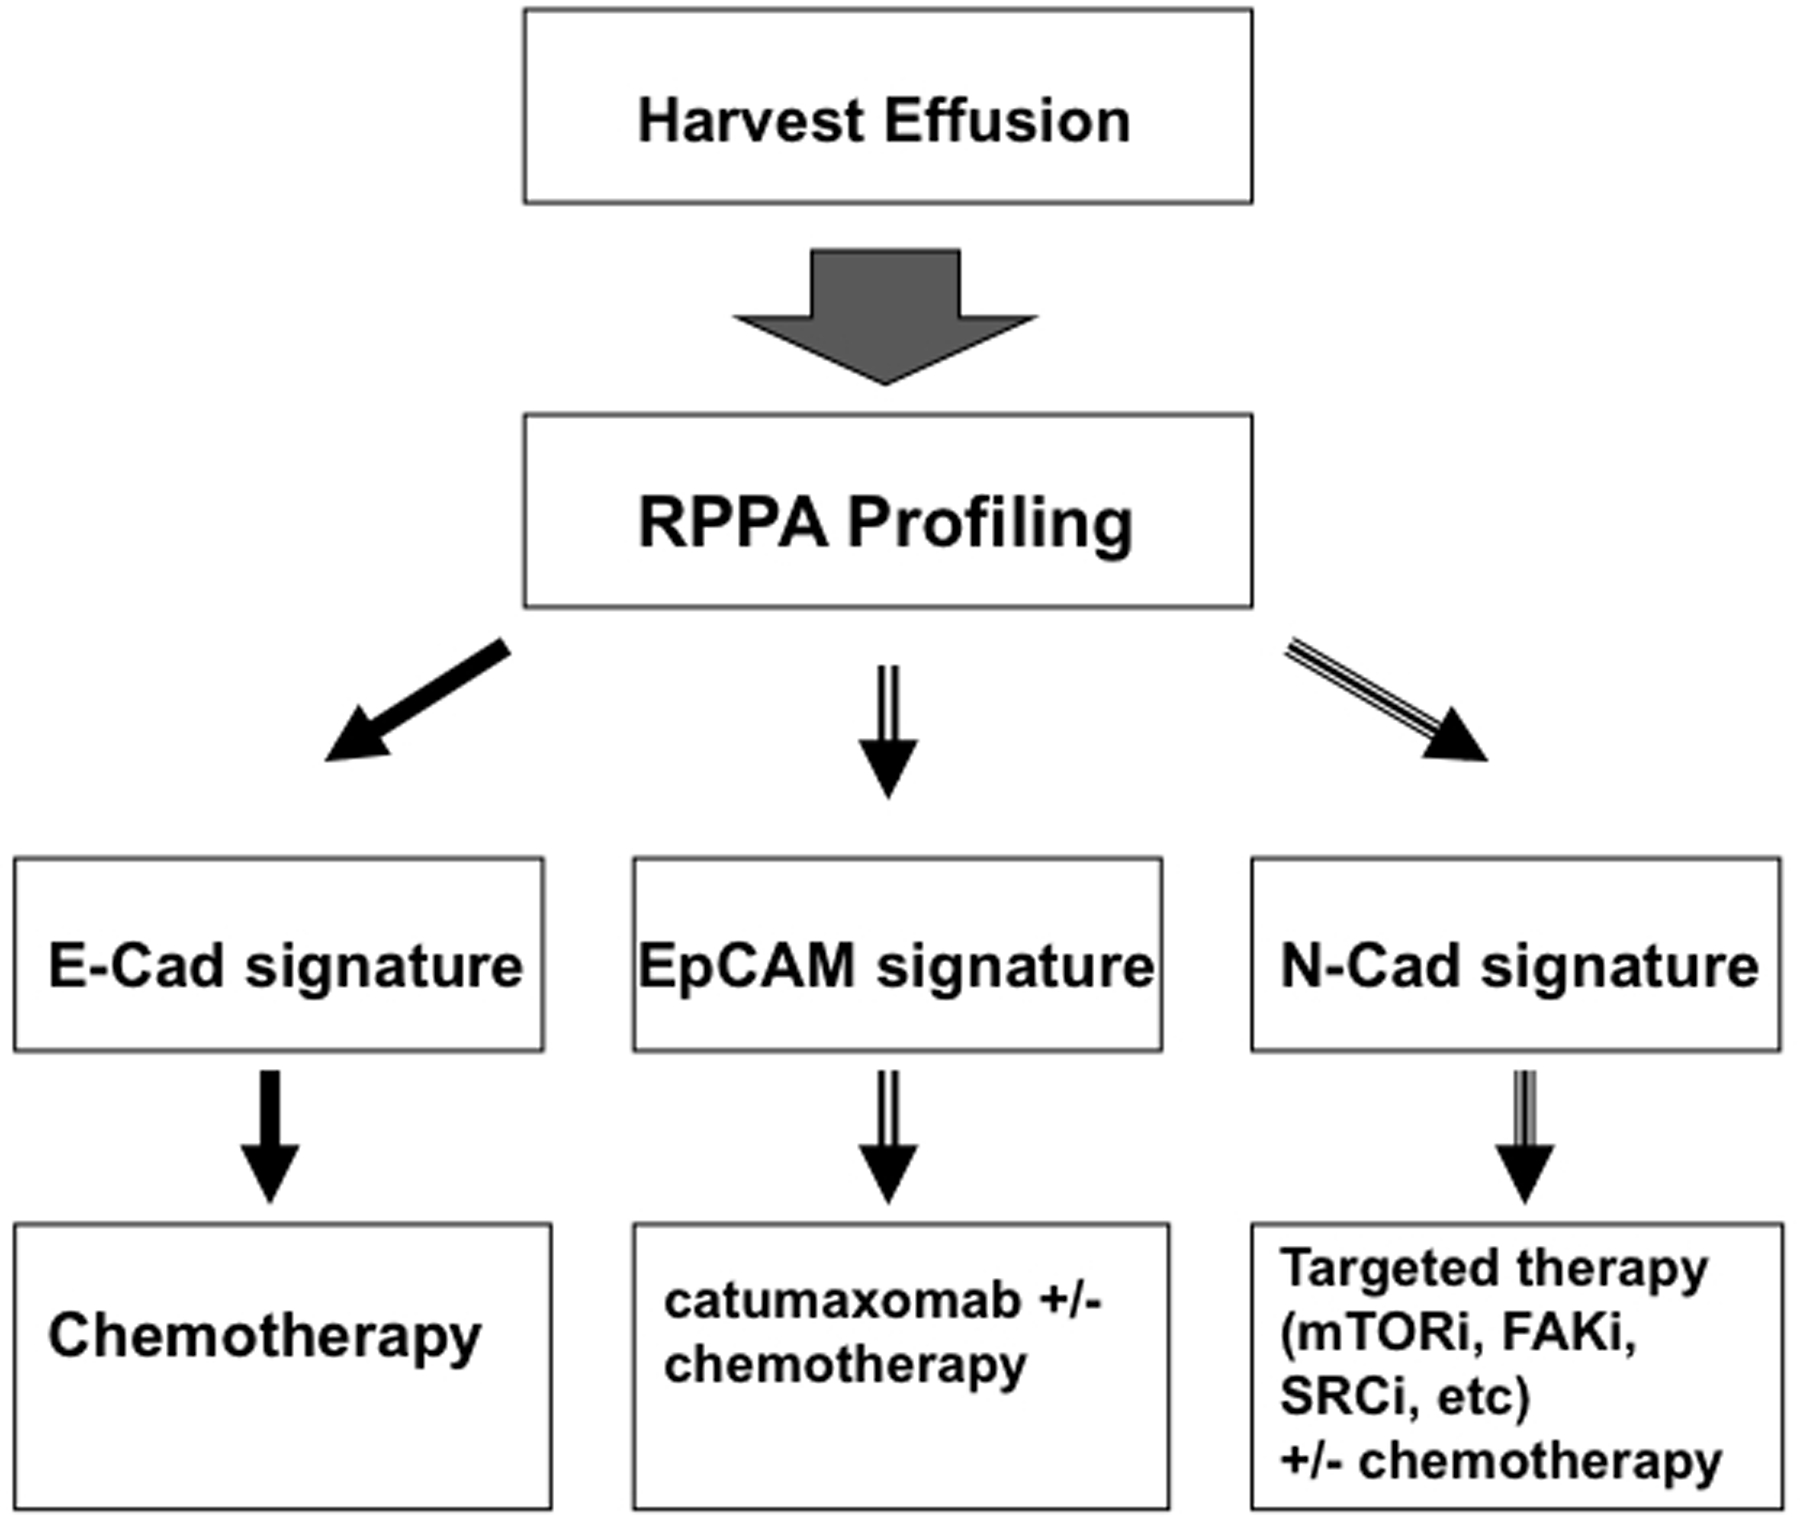
This potential clinical trial schema would examine and further credential the RPPA adhesion protein signatures. It suggests potential clinical applications of signature expression in effusions.
Acknowledgements:
This work was supported by the Intramural Program of the Center for Cancer Research, NCI, and by a grant from the Norwegian Cancer Society and by the Inger and John Fredriksen Foundation for Ovarian Cancer Research.
References:
- 1.Jemal A, Siegel R, Xu J, Ward E. Cancer statistics, 2010. CA Cancer J Clin 2010;60(5):277–300. [DOI] [PubMed] [Google Scholar]
- 2.Bonnefoi H, A’Hern RP, Fisher C, Macfarlane V, Barton D, Blake P, et al. Natural history of stage IV epithelial ovarian cancer. J Clin Oncol 1999;17(3):767–75. [DOI] [PubMed] [Google Scholar]
- 3.Davidson B Malignant effusions: from diagnosis to biology. Diagn Cytopathol 2004;31(4):246–54. [DOI] [PubMed] [Google Scholar]
- 4.Frisch SM, Francis H. Disruption of epithelial cell-matrix interactions induces apoptosis. J Cell Biol 1994;124(4):619–26. [DOI] [PMC free article] [PubMed] [Google Scholar]
- 5.Liotta LA, Kohn E. Anoikis: cancer and the homeless cell. Nature 2004;430(7003):973–4. [DOI] [PubMed] [Google Scholar]
- 6.Frisch SM, Vuori K, Ruoslahti E, Chan-Hui PY. Control of adhesion-dependent cell survival by focal adhesion kinase. J Cell Biol 1996;134(3):793–9. [DOI] [PMC free article] [PubMed] [Google Scholar]
- 7.Fouquet S, Lugo-Martinez VH, Faussat AM, Renaud F, Cardot P, Chambaz J, et al. Early loss of E-cadherin from cell-cell contacts is involved in the onset of Anoikis in enterocytes. J Biol Chem 2004;279(41):43061–9. [DOI] [PubMed] [Google Scholar]
- 8.Kang HG, Jenabi JM, Zhang J, Keshelava N, Shimada H, May WA, et al. E-cadherin cell-cell adhesion in ewing tumor cells mediates suppression of anoikis through activation of the ErbB4 tyrosine kinase. Cancer Res 2007;67(7):3094–105. [DOI] [PMC free article] [PubMed] [Google Scholar]
- 9.Maetzel D, Denzel S, Mack B, Canis M, Went P, Benk M, et al. Nuclear signalling by tumour-associated antigen EpCAM. Nat Cell Biol 2009;11(2):162–71. [DOI] [PubMed] [Google Scholar]
- 10.Patel IS, Madan P, Getsios S, Bertrand MA, MacCalman CD. Cadherin switching in ovarian cancer progression. Int J Cancer 2003;106(2):172–7. [DOI] [PubMed] [Google Scholar]
- 11.Sivertsen S, Hadar R, Elloul S, Vintman L, Bedrossian C, Reich R, et al. Expression of Snail, Slug and Sip1 in malignant mesothelioma effusions is associated with matrix metalloproteinase, but not with cadherin expression. Lung Cancer 2006;54(3):309–17. [DOI] [PubMed] [Google Scholar]
- 12.Davidson B, Berner A, Nesland JM, Risberg B, Berner HS, Trope CG, et al. E-cadherin and alpha-, beta-, and gamma-catenin protein expression is up-regulated in ovarian carcinoma cells in serous effusions. J Pathol 2000;192(4):460–9. [DOI] [PubMed] [Google Scholar]
- 13.Elloul S, Silins I, Trope CG, Benshushan A, Davidson B, Reich R. Expression of E-cadherin transcriptional regulators in ovarian carcinoma. Virchows Arch 2006;449(5):520–8. [DOI] [PubMed] [Google Scholar]
- 14.Elstrand M, Phuc Dong H, Ødegaard E, Holth A, Elloul S, Reich R, et al. Mammalian target of rapamycin is a biomarker of poor survival in metastatic serous ovarian carcinoma. Human Pathology 2010;Epub available online February 15 2010. [DOI] [PubMed] [Google Scholar]
- 15.Davidson B, Espina V, Steinberg SM, Florenes VA, Liotta LA, Kristensen GB, et al. Proteomic analysis of malignant ovarian cancer effusions as a tool for biologic and prognostic profiling. Clin Cancer Res 2006;12(3 Pt 1):791–9. [DOI] [PubMed] [Google Scholar]
- 16.Sheehan KM, Calvert VS, Kay EW, Lu Y, Fishman D, Espina V, et al. Use of reverse phase protein microarrays and reference standard development for molecular network analysis of metastatic ovarian carcinoma. Mol Cell Proteomics 2005;4(4):346–55. [DOI] [PubMed] [Google Scholar]
- 17.Annunziata CM, Walker AJ, Minasian L, Yu M, Kotz H, Wood BJ, et al. Vandetanib, designed to inhibit VEGFR2 and EGFR signaling, had no clinical activity as monotherapy for recurrent ovarian cancer and no detectable modulation of VEGFR2. Clin Cancer Res 2010;16(2):664–72. [DOI] [PMC free article] [PubMed] [Google Scholar]
- 18.Winters M, Dabir B, Yu M, Kohn EC. Constitution and quantity of lysis buffer alters outcome of reverse phase protein microarrays. Proteomics 2007;7(22):4066–8. [DOI] [PubMed] [Google Scholar]
- 19.Carey MS, Agarwal R, Gilks B, Swenerton K, Kalloger S, Santos J, et al. Functional proteomic analysis of advanced serous ovarian cancer using reverse phase protein array: TGF-beta pathway signaling indicates response to primary chemotherapy. Clin Cancer Res 2010;16(10):2852–60. [DOI] [PMC free article] [PubMed] [Google Scholar]
- 20.Davidson B, Risberg B, Kristensen G, Kvalheim G, Emilsen E, Bjamer A, et al. Detection of cancer cells in effusions from patients diagnosed with gynaecological malignancies. Evaluation of five epithelial markers. Virchows Arch 1999;435(1):43–9. [DOI] [PubMed] [Google Scholar]
- 21.Davidson B, Nielsen S, Christensen J, Asschenfeldt P, Berner A, Risberg B, et al. The role of desmin and N-cadherin in effusion cytology: a comparative study using established markers of mesothelial and epithelial cells. Am J Surg Pathol 2001;25(11):1405–12. [DOI] [PubMed] [Google Scholar]
- 22.Rasool N, LaRochelle W, Zhong H, Ara G, Cohen J, Kohn EC. Secretory leukocyte protease inhibitor antagonizes paclitaxel in ovarian cancer cells. Clin Cancer Res 2010;16:600–9. [DOI] [PMC free article] [PubMed] [Google Scholar]
- 23.du Bois A, Reuss A, Pujade-Lauraine E, Harter P, Ray-Coquard I, Pfisterer J. Role of surgical outcome as prognostic factor in advanced epithelial ovarian cancer: a combined exploratory analysis of 3 prospectively randomized phase 3 multicenter trials: by the Arbeitsgemeinschaft Gynaekologische Onkologie Studiengruppe Ovarialkarzinom (AGO-OVAR) and the Groupe d’Investigateurs Nationaux Pour les Etudes des Cancers de l’Ovaire (GINECO). Cancer 2009;115(6):1234–44. [DOI] [PubMed] [Google Scholar]
- 24.Curtin JP, Malik R, Venkatraman ES, Barakat RR, Hoskins WJ. Stage IV ovarian cancer: impact of surgical debulking. Gynecol Oncol 1997;64(1):9–12. [DOI] [PubMed] [Google Scholar]
- 25.Akahira JI, Yoshikawa H, Shimizu Y, Tsunematsu R, Hirakawa T, Kuramoto H, et al. Prognostic factors of stage IV epithelial ovarian cancer: a multicenter retrospective study. Gynecol Oncol 2001;81(3):398–403. [DOI] [PubMed] [Google Scholar]
- 26.Peng DJ, Wang J, Zhou JY, Wu GS. Role of the Akt/mTOR survival pathway in cisplatin resistance in ovarian cancer cells. Biochem Biophys Res Commun 2010;394(3):600–5. [DOI] [PMC free article] [PubMed] [Google Scholar]
- 27.Parsons JT, Slack-Davis J, Tilghman R, Roberts WG. Focal adhesion kinase: targeting adhesion signaling pathways for therapeutic intervention. Clin Cancer Res 2008;14(3):627–32. [DOI] [PubMed] [Google Scholar]
- 28.Yap AS, Brieher WM, Gumbiner BM. Molecular and functional analysis of cadherin-based adherens junctions. Annu Rev Cell Dev Biol 1997;13:119–46. [DOI] [PubMed] [Google Scholar]
- 29.Perl AK, Wilgenbus P, Dahl U, Semb H, Christofori G. A causal role for E-cadherin in the transition from adenoma to carcinoma. Nature 1998;392(6672):190–3. [DOI] [PubMed] [Google Scholar]
- 30.Faleiro-Rodrigues C, Macedo-Pinto I, Pereira D, Lopes CS. Prognostic value of E-cadherin immunoexpression in patients with primary ovarian carcinomas. Ann Oncol 2004;15(10):1535–42. [DOI] [PubMed] [Google Scholar]
- 31.Shim HS, Yoon BS, Cho NH. Prognostic significance of paired epithelial cell adhesion molecule and E-cadherin in ovarian serous carcinoma. Hum Pathol 2009;40(5):693–8. [DOI] [PubMed] [Google Scholar]
- 32.Voutilainen KA, Anttila MA, Sillanpaa SM, Ropponen KM, Saarikoski SV, Juhola MT, et al. Prognostic significance of E-cadherin-catenin complex in epithelial ovarian cancer. J Clin Pathol 2006;59(5):460–7. [DOI] [PMC free article] [PubMed] [Google Scholar]
- 33.Gottardi CJ, Wong E, Gumbiner BM. E-cadherin suppresses cellular transformation by inhibiting beta-catenin signaling in an adhesion-independent manner. J Cell Biol 2001;153(5):1049–60. [DOI] [PMC free article] [PubMed] [Google Scholar]
- 34.Elloul S, Vaksman O, Stavnes HT, Trope CG, Davidson B, Reich R. Mesenchymal-to-epithelial transition determinants as characteristics of ovarian carcinoma effusions. Clin Exp Metastasis;27(3):161–72. [DOI] [PubMed] [Google Scholar]
- 35.Wheelock MJ, Shintani Y, Maeda M, Fukumoto Y, Johnson KR. Cadherin switching. J Cell Sci 2008;121(Pt 6):727–35. [DOI] [PubMed] [Google Scholar]
- 36.Singh A, Settleman J. EMT, cancer stem cells and drug resistance: an emerging axis of evil in the war on cancer. Oncogene 2010;29:4741–51. [DOI] [PMC free article] [PubMed] [Google Scholar]
- 37.Kassis J, Klominek J, Kohn EC. Tumor microenvironment: what can effusions teach us? Diagn Cytopathol 2005;33(5):316–9. [DOI] [PubMed] [Google Scholar]
- 38.Hudson LG, Zeineldin R, Stack MS. Phenotypic plasticity of neoplastic ovarian epithelium: unique cadherin profiles in tumor progression. Clin Exp Metastasis 2008;25(6):643–55. [DOI] [PMC free article] [PubMed] [Google Scholar]
- 39.Sundfeldt K, Piontkewitz Y, Ivarsson K, Nilsson O, Hellberg P, Brannstrom M, et al. E-cadherin expression in human epithelial ovarian cancer and normal ovary. Int J Cancer 1997;74(3):275–80. [DOI] [PubMed] [Google Scholar]
- 40.Tothill RW, Tinker AV, George J, Brown R, Fox SB, Lade S, et al. Novel molecular subtypes of serous and endometrioid ovarian cancer linked to clinical outcome. Clin Cancer Res 2008;14(16):5198–208. [DOI] [PubMed] [Google Scholar]
- 41.Huttenlocher A, Lakonishok M, Kinder M, Wu S, Truong T, Knudsen KA, et al. Integrin and cadherin synergy regulates contact inhibition of migration and motile activity. J Cell Biol 1998;141(2):515–26. [DOI] [PMC free article] [PubMed] [Google Scholar]
- 42.Yano H, Mazaki Y, Kurokawa K, Hanks SK, Matsuda M, Sabe H. Roles played by a subset of integrin signaling molecules in cadherin-based cell-cell adhesion. J Cell Biol 2004;166(2):283–95. [DOI] [PMC free article] [PubMed] [Google Scholar]
- 43.Hofmann C, Obermeier F, Artinger M, Hausmann M, Falk W, Schoelmerich J, et al. Cell-cell contacts prevent anoikis in primary human colonic epithelial cells. Gastroenterology 2007;132(2):587–600. [DOI] [PubMed] [Google Scholar]
- 44.Wu C, Cipollone J, Maines-Bandiera S, Tan C, Karsan A, Auersperg N, et al. The morphogenic function of E-cadherin-mediated adherens junctions in epithelial ovarian carcinoma formation and progression. Differentiation 2008;76(2):193–205. [DOI] [PubMed] [Google Scholar]
- 45.Kajiyama H, Shibata K, Terauchi M, Yamashita M, Ino K, Nawa A, et al. Chemoresistance to paclitaxel induces epithelial-mesenchymal transition and enhances metastatic potential for epithelial ovarian carcinoma cells. Int J Oncol 2007;31(2):277–83. [PubMed] [Google Scholar]
- 46.Witta SE, Gemmill RM, Hirsch FR, Coldren CD, Hedman K, Ravdel L, et al. Restoring E-cadherin expression increases sensitivity to epidermal growth factor receptor inhibitors in lung cancer cell lines. Cancer Res 2006;66(2):944–50. [DOI] [PubMed] [Google Scholar]
- 47.Xiang W, Wimberger P, Dreier T, Diebold J, Mayr D, Baeuerle PA, et al. Cytotoxic activity of novel human monoclonal antibody MT201 against primary ovarian tumor cells. J Cancer Res Clin Oncol 2003;129(6):341–8. [DOI] [PMC free article] [PubMed] [Google Scholar]
- 48.Burges A, Wimberger P, Kumper C, Gorbounova V, Sommer H, Schmalfeldt B, et al. Effective relief of malignant ascites in patients with advanced ovarian cancer by a trifunctional anti-EpCAM x anti-CD3 antibody: a phase I/II study. Clin Cancer Res 2007;13(13):3899–905. [DOI] [PubMed] [Google Scholar]
- 49.Heiss MM, Murawa P, Koralewski P, Kutarska E, Kolesnik OO, Ivanchenko VV, et al. The trifunctional antibody catumaxomab for the treatment of malignant ascites due to epithelial cancer: Results of a prospective randomized phase II/III trial. Int J Cancer 2010. [DOI] [PMC free article] [PubMed] [Google Scholar]
- 50.Posadas EM, Kwitkowski V, Kotz HL, Espina V, Minasian L, Tchabo N, et al. A prospective analysis of imatinib-induced c-KIT modulation in ovarian cancer: a phase II clinical study with proteomic profiling. Cancer 2007;110(2):309–17. [DOI] [PubMed] [Google Scholar]
- 51.Posadas EM, Liel MS, Kwitkowski V, Minasian L, Godwin AK, Hussain MM, et al. A phase II and pharmacodynamic study of gefitinib in patients with refractory or recurrent epithelial ovarian cancer. Cancer 2007;109(7):1323–30. [DOI] [PMC free article] [PubMed] [Google Scholar]