Abstract
Virus based epidemic is one of the speedy and widely spread infectious disease which can affect the economy of the country as well as it is life-threatening too. So, there is a need to forecast the epidemic lifespan, which can help us in taking preventive measures and remedial action on time. These preventive measures and corrective action may consist of closing schools, closing malls, closing theaters, sealing of borders, suspension of public services, and suspension of traveling. Resuming such restrictions is depends upon the outbreak momentum and its decay rate. The accurate forecasting of the epidemic lifespan is one of the enormously essential and challenging tasks. It is a challenging task because the lack of knowledge about the novel virus-based diseases and its consequences with complicated societal-governmental factors can influence the widespread of this newly born disease. At this stage, any forecasting can play a vital role, and it will be reliable too. As we know, the novel virus-based diseases are in a growing phase, and we also do not have real-time data samples. Thus, the biggest challenge is to find out the machine learning-based best forecasting model, which could offer better forecasting with the limited training samples. In this paper, the Multi-Task Gaussian Process (MTGP) regression model with enhanced predictions of novel coronavirus (COVID-19) outbreak is proposed. The purpose of the proposed MTGP regression model is to predict the COVID-19 outbreak worldwide. It will help the countries in planning their preventive measures to reduce the overall impact of the speedy and widely spread infectious disease. The result of the proposed model has been compared with the other prediction model to find out its suitability and correctness. In subsequent analysis, the significance of IoT based devices in COVID-19 detection and prevention has been discussed.
Keywords: IoT, Machine learning, Novel coronavirus (COVID-19), HealthCare, Virus
Introduction
In the last two decades, we have seen various epidemics conditions. These conditions were started from SARS in 2002 and followed by SWINE FLU in 2009, after that EBOLA in 2013, then MARS in 2014, and now COVID-19 in 2019 [1–5]. These epidemic encounters can cause severe human and economic losses. If we talk about the latest COVID-19 disease, which came into the picture in late December of 2019 from china. The first case of this virus came from Wuhan city of China, which was new and never seen before. Initially, it was known as the Wuhan virus, and after that, it was coded as COVID-19 or novel coronavirus or 2019-nCov [6]. According to the hypothesis, this virus had come from the fish market (probably from the bat) of Wuhan city. Initially, it started infecting the people of Wuhan city and spread in other cities in a short span [7]. In fifteen days, china was brutally affected, and within a month, it becomes a global epidemic. Initially, it was claimed that it is an air-born disease, but after the proper assessment, the scientist told that it is a touched contagious disease, and it lasts from hours to days in different environments or surfaces. As we know, it is touched contagious disease, so we can say that it can be spread from the human to human interaction or human to surface contact. Due to the rapid spread rate of COVID-19 worldwide, the warning regarding global health emergency had been issued by the World Health Organization (WHO) [8] in the last week of January 2020. In the first week of March 2020, the WHO had declared the COVID-19 as a pandemic disease [9].
The novel coronavirus, or COVID-19, has come from the same virus family from where the Severe Acute Respiratory Syndrome (SARS-CoV) and Middle East Respiratory Syndrome (MERS-CoV) came. It is a new disease for the human that came into the picture at the end of December 2019 [10]. Before 2019 it was not identified in humans, so we did not know much about it. The COVID-19 is a zoonotic disease, which means it was transmitted from animal to people. This hypothesis is correct because some known coronaviruses are circulated from animals but have not affected humans yet. From the studies, we found that the SARS-CoV and MERS-CoV were transmitted from the animals. The SARS-CoV came from the civet cats, and MERS-CoV came from camels [1–5]. These diseases were born from the mutation process, which means they had transformed their properties before going into the human body from the animals.
In Table 1, some virus-based epidemic diseases have been shown [1–5]. This table consists of, disease name, year of its occurrence, total cases, and total death caused by the virus, totally recovered people, and the number of countries where these viruses were caught.
Table 1.
Virus based epidemic diseases till date
| Disease caused by virus | Year | Total cases | Total death | Total recovered | Target countries |
|---|---|---|---|---|---|
| SARS | 2002–2003 | 8096 | 774 | 7322 | 29 |
| SWINE FLU | 2009–2010 | 6,724,149 | 19,654 | 6,704,495 | 58 |
| EBOLA | 2013–2016 | 28,646 | 11,323 | 17,323 | 10 |
| MARS | 2014–2015 | 1360 | 527 | 833 | 26 |
| CORONA (COVID-19) | 2019–2020 | 8,525,042 | 456,973 | 4,355,602 | 213+ |
In the novel coronavirus or COVID-19, the patient initially feels usual flu-like symptoms i.e., shortness of breath, cough, fever, and breathing difficulties, which can become more severe in a couple of days. It targets the human respiratory system, or we can say that it is a respiratory system-based disease. In severe cases, it can cause acute respiratory syndrome, pneumonia, kidney failure, other severe respiratory-related diseases, and even death too. To protect ourselves from COVID-19 and to stop its spread, we have to take precautions such as cover nose and mouth when sneezing and coughing, regular and proper handwashing, and eating those eggs and meat that is adequately cooked. Use hand sanitizer and mask on public places, don’t spit on the road, avoid close contact with the ill person, avoid traveling with public transport and stay at home as much as possible [5, 8, 11].
In Fig. 1, the situation caused due to COVID-19 outbreak is represented with a bar graph. In the figure, the y-axis represents the number of people, and on the x-axis, the number of cases, the number of recovered cases, number of active cases, and deaths caused by COVID-19 have been presented [11].
Fig. 1.
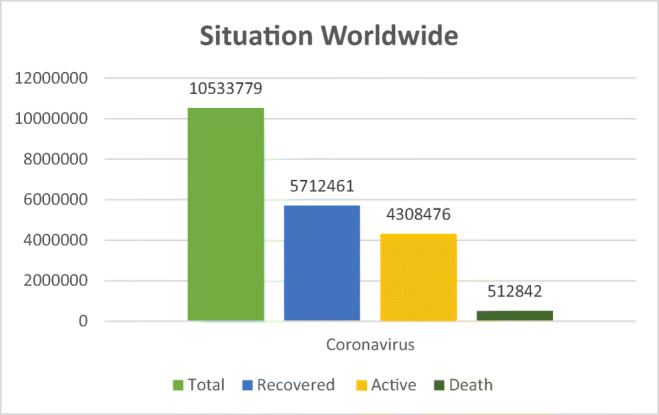
COVID-19 Situation Worldwide
In this epidemic situation, any small finding can help a lot. Therefore, in this challenging pandemic situation, the forecasting of coronavirus outbreak plays a vital role and gives an idea about its widespread in upcoming days, which will help the government to take preventive measures for minimizing its spread [12, 13]. In this case, we need such a model that can be accurate, efficient, and widely applicable. It is a challenging task, and it becomes more challenging because we don’t have sufficient real-time data. Considering these limitations in our mind, we start testing with the basic forecasting models, which are not as accurate as we are looking for [14]. After several trials, we found that our proposed Enhanced Multi-Task Gaussian Process Regression (MTGP) model on the COVID-19 outbreak forecasting is better than the traditional forecasting model.
The primary aim of this study is:
To develop such a model that can be capable of dealing with this epidemic situation and give the best forecasting results.
To provide information on possible conditions in the upcoming days due to the outbreak of COVID-19, which will help in planning the preventive measures accordingly.
Along with that, the significance of IoT in COVID-19 detection and IoT based possible solutions for minimizing the impact of the COVID-19.
The rest structure of this research paper is as follows. The related work has been presented in Section 2. Section 3 deliberate about the data sets and proposed methodology along with the four traditional forecasting models. The experiment results are based on performance evaluation of the COVID-19 dataset and which has been presented in Section 4. In Section 5, the detailed discussion about the results, and the significance of IoT in the detection of COVID-19 with IoT based possible solutions are shown. In Section 6, concluding remarks with the future scope is drawn.
Related work
Complexity in developing epidemiological models encourages the researchers to find out the machine learning-based model to deal with the epidemic situation. The primary aim of the machine learning models is to develop models with better prediction reliability and better generalization ability [15–19]. Various machine learning models were used to predict multiple pandemics such as Ebola, SARS, Swine flu, Cholera, H1N1 influenza, Zika, Dengue fever, Oyster norovirus, and MARS [20–30]. These machine learning methods are limited to some basic models such as Neural Networks, Random Forest Regression, Bayesian Networks, Genetic Programming, Naïve Bayes, Classification and Regression Tree, Linear Regression, and Support Vector Regression. However, over a long time, machine learning models are being used to serve in natural disasters and weather predictions [31, 32].
For dealing with this COVID-19 epidemic, various researchers and research groups have given the mathematical and algorithmic approaches. The sub-epidemic model, the Richards model, and the logistic model had been used by Roosa et al. [33] for the prediction of confirmed cases in upcoming days (in the next 5 and 10 days) of Zhejiang province and Guangdong province. The mathematical model for the propagation status simulation due to COVID-19 in China was used by Liu et al. [34]. This mathematical model will further help the government in minimizing the impact of the pandemic. The transmission dynamics’ time-dependent compartmental model was adopted by Boldog et al. [35] for estimating the confirmed cases outside china’s Hubei province. The improved version of the salp swarm algorithm and the flower pollination algorithm based on ANFIS (Adaptive Neuro-fuzzy Inference System) had been proposed by Al-Qaness et al. [36], for the prediction of confirmed cases in the next ten days. For evaluating the performance of the proposed algorithm, GA (Genetic Algorithm), PSO (Particle Swarm Optimization), ABC (Artificial Bee Colony), and FPA (Flower Pollination Algorithm), had been taken. The statistical induction and delayed distribution estimation based mathematical model was proposed by Jung et al. [37] for predicting COVID-19 cases. An analytical method based mathematical model was proposed by Fan et al. [38] for predicting the floating population of Wuhan city. In this paper, the authors had established the correlation between the floating population and daily confirmed cases.
The deep learning algorithms are being widely used in the genome-based prediction of COVID-19 propagation. The SEIR (Susceptible Exposed Infectious Removed) model with LSTM (Long Short-Term Memory) model had been proposed by Yang et al. [39] for the integration of the epidemic curve. Hu et al. [40] had suggested the improved version of the stacked autoencoder and clustering algorithm for the grouping of promptly confirmed cases in each province. In this paper, the authors had also found that the AI-based methods achieve higher accuracy for the prediction of COVID-19 trajectory. The deep learning algorithm for the gene sequence-based virus prediction had been used by Guo et al. [41]. In this paper, the authors had compared the gene sequence of SARS-CoV (Severe Acute Respiratory Syndrome), bat SARS coronavirus, and MERS-COV (Middle East Respiratory Syndrome) with the COVID-19 to find out the similarity among the viruses.
The early outbreak trajectories were predicted by Riou et al. [42] to determine the reproduction rate of COVID-19. Besides that, the authors had also told the possibility of frequent infections among people due to COVID-19. The improved version of the SIR (Susceptible Infectious Recovered) model for the prediction of infection cases due to COVID-2019, was proposed by Ming et al. [43]. The authors also predicted the actual load on the ICU (Intensive Care Units) under the various public health intervention efficacies and diagnosis rates. Zhao et al. [44] had proposed a probability model for the accurate prediction of the infection nodes by the snapshots of spreading. The machine learning-based pathogen-risk models were introduced by Fountain-Jones et al. [45] for predicting the COVID-19 outbreak over the various machine learning models. The ARIMA (Autoregressive Integrated Moving Average) model had been used by Benvenuto et al. [46] for the prediction of the trend and morbidity of the COVID-19 outbreak. In this paper, the authors also cited that, if the virus does not mutate, then the number of cases will reach a plateau.
Materials and methods
In this section, we are going to discuss the materials and methods which have been used for result finding. This section is divided into four subsections, i.e., dataset description, proposed methodology, model comparison, and statistical analysis. In the first subsection, the detailed discussion about the COVID-19 dataset has been presented. In the second subsection, the proposed MTGP model has been discussed in detail. In the third subsection, a brief discussion with the mathematical foundation of the four-prediction algorithm has been presented. In the last subsection, the performance evaluation metrics have been discussed.
Data
For this research work, we had gone through the health bulletin of the WHO. Based on the WHO’s situation reports, the dataset has been earned, and all the experimental evaluation task has been performed on that. Due to COVID-19, approximately 213 countries have been affected. The data we took for making the forecasting model was from 31/12/2019 to 25/06/2020 time stamp. This COVID-19 dataset is consisting of the nine columns which are: country/territory/area name, date, the total number of confirmed cases, the total number of deaths, the total number of new confirmed cases, total number new deaths, the total number of recovered patients, the total number of active patients, and transmission classification [11]. Based on these nine columns, the data of all the affected countries has been recorded.
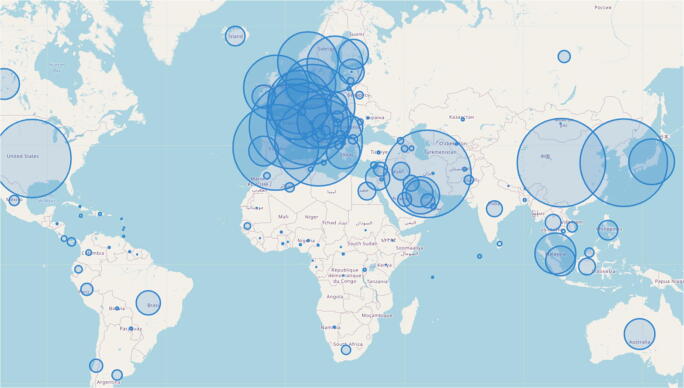
The visualization of the dataset is shown in Fig. 2. The total number of confirmed cases in the period of 31/12/2019 to 25/06/2020 has been drawn on the map. The radius of the circle is depended on the exposer in the respective country. For the visualization on the map, we had taken the country’s geographical location, which is mapped with the number of confirmed cases.
Fig. 2.
COVID-19 Outbreak Worldwide
Proposed methodology
Gaussian Process Regression (GBR) is the non-parametric based regression model that is most commonly used in the predictive analysis [14, 47]. It can also be used for a complex system like an arbitrary system. Multi-Task Gaussian Process Regression (MTGP) is the extensive model of the basic GPR model. It is also known as the advance or special case of a typical GPR model [48]. It is applicable when we want multiple outputs using a standard GPR model. This MTGP model was proposed by Bonilla et al. in 2008 [49], and its advanced version was introduced by Dürichen et al. in time series analysis of multivariate psychological application [50]. More recently, this method was utilized by Richardson et al. to predict battery capacity with improved results [51]. In respect to the prediction of the COVID-19 outbreak using the proposed MTGP model, the COVID-19 time series data has been given at the input side, and in the output side, the historical and reference series has been received. In the MTGP model for the prediction of time series, we follow the same testing and training mechanism as we were using in the traditional GPR model, excluding the kernel matrix. For a better understanding of the kernel matrix in the MTGP model, the two cases of output tasks are considered as an example.
The standard GPR model is described in Eq. (1)
| 1 |
Where the output and input have been denoted by a and b, the mean function has been defined as m(b), f(b) denotes the latent variable, and i(b, b′) denotes the covariance function.
The squared exponential kernel (SEK) function is defined as,
| 2 |
Where d denotes the Euclidian distance, and θ1, θ2 denotes the hyper-parameter, which needs to be optimized.
Thus, the hyper-parameter of the kernel matrix I have been estimated by minimizing the NLML (Negative Log Marginalized Likelihood) has been shown in Eq. (3)
| 3 |
The mathematical implementation of the MTGP regression model has been delivered in Eq. (4).
| 4 |
| 5 |
Where, ar, ap and br, bp = two input and two output having with the same dimensionality (In the case of 1D the br and bp are sever as time indicators for two time series).
θrr, θrp, θpr and θpp = correlation coefficients of output series
| 6 |
Where,
The algorithm for the proposed MTGP for COVID-19 outbreak forecasting has been deliberated below in Algorithm 1.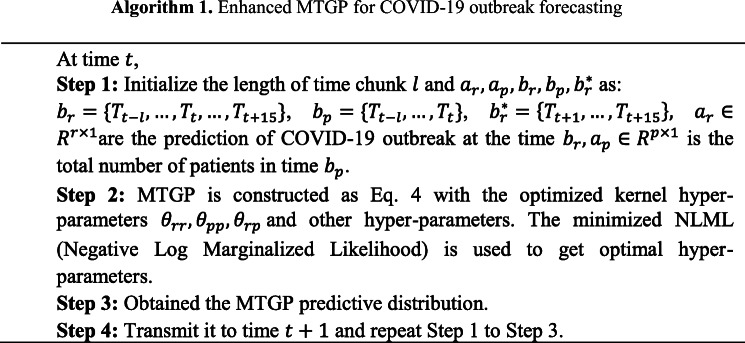
Model comparison
In this section, a brief discussion with the mathematical foundation of the prediction algorithm used in the experimental evaluation has been presented.
Linear regression (LR)
Linear Regression (LR) is one of the most commonly used regression models for predictive analysis. The LR model uses two-variables, where the first one is dependent or reliant, and the second one is explanatory or descriptive variable. It is being used for the establishment of the relationship between the two variables. It is denoted by the slope formulary [52].
The LR model has been represented in Eq. 7, where slope in the line has been denoted by b, y-intercept has been indicated by a, the reliant or dependent variable has been denoted by y, and the descriptive or explanatory variable has been denoted by x.
The LR (Linear Regression) model with the mathematical formulation is defined in the below equation:
| 7 |
For calculation of a and b the following formulas have been used:
| 8 |
| 9 |
Support vector regression (SVR)
Support Vector Regression (SVR) is one of the most commonly used regression models for predictive analysis.
For the prediction using the SVR model, Eq. 10 is used [53].
| 10 |
Where, high dimensional feature space has been denoted by ∅ and coefficient of ∅(x) are ω and b.
| 11 |
Where empirical risk has been denoted by Remp, Euclidian norms have been denoted by , the empirical error has been denoted by and empirical risk cost has been denoted by c.
| 12 |
In Eq. (12) the loss function has been shown, and it is obtained from Eq. (11).
Minimize,
| 13 |
Subjected to,
The testing error minimization has been shown in the Eq. (13), where slack variable for ups and downsides have been denoted by ξ∗and .
Random Forest regression (RF)
Random Forest Regression (RF) comes from the family of ensemble learning. It is an ensemble learning-based regression model that has been used for predictive analysis. It was formulated in 1995 by TinKam Ho [54].
In Eq. (14) mathematical RF model has been shown
| 14 |
Where a large number of predictions have been ensured by k → ∞.
| 15 |
The random forest prediction error has been defined in the Eq. 16, and the selection of has been defined in the Eq. 15 to protect the model from overfitting. The average error of an individual tree h(X; θ) has been shown in Eq. (16)
| 16 |
Here we adopt that all θ are unbiased for each tree, i.e.,
Then,
| 17 |
Where weighted correlation has been defined by with independent of θ and θ′, lies between residuals y − h(x; θ) and y − h(x; θ′).
Long short-term memory (LSTM)
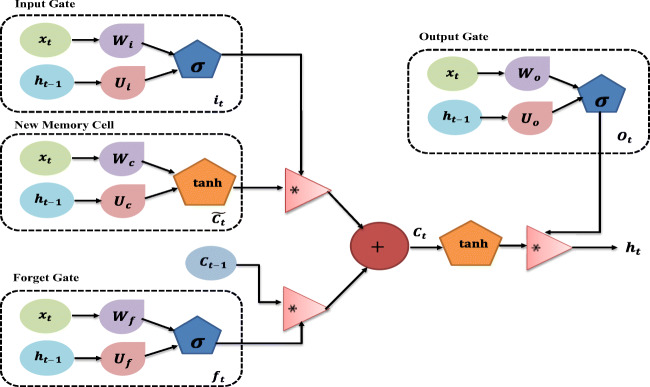
The Long Short-Term Memory (LSTM), which is an evolutionary model of Recurrent Neural Network (RNN), was proposed by Hökreiter and Schmiduber [55]. It had been developed to deal with the deficiencies of RNN’s anterior with the help of additional interactions cell or module. In other words, we can say that the LSTM is a special type of RNN capable of remembering past information and learning long-term dependencies. Olah [56], quoted that the LSTM model can be organized as a series structure. It consists of four interaction layers instead of a single layer, such as in standard RNN. It also follows the unique communication method for interaction between the four segments. The basic structure of the LSTM model has been shown in Fig. 3.
Fig. 3.
LSTM Model Structure
The LSTM model with the mathematical formulation has been defined in the below equations:
The Input gate is calculated by Eq. 18:
| 18 |
Where sigmoid function has been denoted by σ, the output of the previous unit has been denoted by ht − 1, and Wi indicates the weight matrix.
The Forget gate is calculated by Eq. 19:
| 19 |
Where the output of the previous unit has been indicated by ht − 1, the sigmoid function has been denoted by σ, and Wf denotes the weight matrix.
The Output /Exposure gate is calculated by Eq. 20:
| 20 |
Where the sigmoid function has been denoted by σ, the output of the previous unit has been indicated by ht − 1, and Wo denotes the weight matrix.
The New memory cell is calculated by Eq. 21:
| 21 |
Where the output of the previous unit has been indicated by ht − 1, and Wc denotes the weight matrix.
The Final memory cell is calculated by Eq. 22:
| 22 |
Forget gate has been denoted by ft, , and indicates cell states at time t − 1 and t respectively.
Thus, the final output is opted by,
| 23 |
Where,
ot and ct denotes output /exposure gate and final memory cell, respectively.
Statistical analysis
For the statistical analysis, two performance evaluation metrics have been taken: Mean Absolute Percentage Error (MAPE) and Root Mean Squared Error (RMSE). Based on these results, we can justify the performance, accuracy, and suitability of forecasting models. In this section, we have discussed the mathematical foundation of the evaluation metrics [57].
Root mean square error (RMSE)
The RMSE (Root Mean Absolute Error) is one of the critical statistical measures which is based on the concept of standard derivation for residuals. It is used for the validation of the predicted result. The measurement of distances between the regression line and data points is known as residuals mean error prediction. In the Eq. 24, the number of errors has been indicated by, the squares of errors have been denoted by , & yi denotes the observed values and forecasted values, respectively.
| 24 |
Mean absolute percentage error (MAPE)
The RMSE (Root Mean Absolute Error) is one of the significant statistical measures used to calculate the accuracy of the forecasted system. In the Eq. 25, the number of predicted values have been denoted by N, Xi & Yi indicates the predicted value and actual value, respectively.
| 25 |
Results
In this section, we are going to discuss the prediction result of the COVID-19 outbreak based on the five prediction models, i.e., Linear Regression (LR), Random Forest Regression (RFR), Support Vector Regression (SVR), Long Short-Term Memory (LSTM), and our proposed Enhanced Multi-Task Gaussian Process Regression (MTGP).
Model identification and hyperparameter selection
Finding out the accurate forecasting model, which will be very useful for predicting the COVID-19 outbreak worldwide, is a very complex task. This study’s fundamental purpose is to build such a forecasting model that can correctly forecast the epidemic caused by COVID-19 across the world. The correct forecasting is an essential need because all the preventive measures depend upon the forecasting results. With the help of an accurate forecasting model, we can reduce the COVID-19 outbreak’s exposure by making the plan accordingly.
In Fig. 4, four traditional regression models and one proposed model i.e., Linear Regression (LR), Random Forest Regression (RFR), Support Vector Regression (SVR), Long Short-Term Memory (LSTM), and Enhanced Multi-Task Gaussian Process Regression (MTGP) has been shown. These models have been used in the forecasting of the COVID-19 outbreak. This study aims to determine the suitability and accuracy of the proposed model among the traditional models.
Fig. 4.
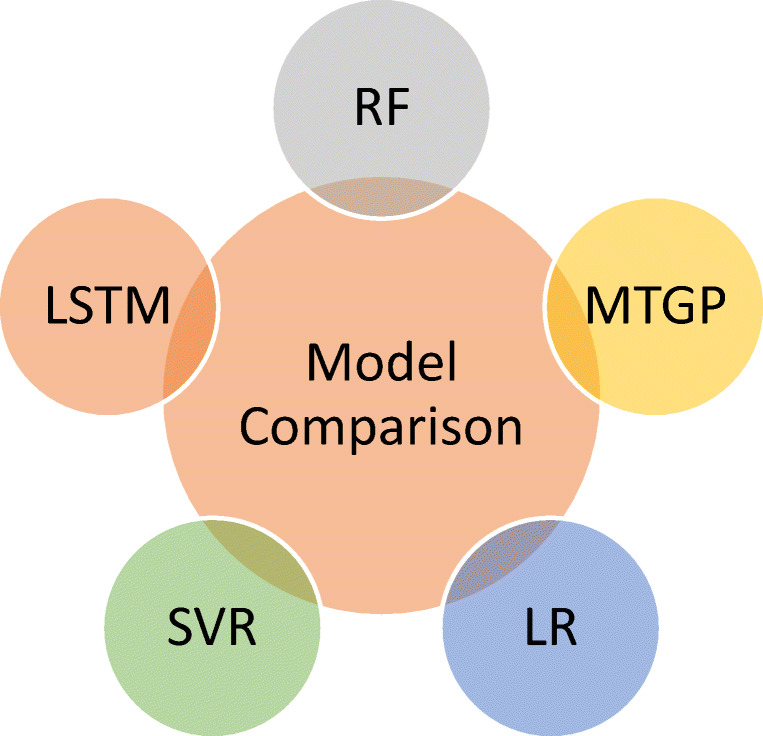
Prediction Models a Quick Lookup
In Table 2, the hyperparameter setting, which has been used in the experimental evaluation, has been shown. This table consists of the information such as Prediction Model, Hyperparameter, Parameter Selection, and Best Hyperparameter Used. Before performing the experimental evaluation, we have hyper-tuned each model under the various selection criteria to determine the best parameter for the model. That best hyper-tuned parameter has been used in this experimental evaluation.
Table 2.
Hyperparameter selection
| Prediction model | Hyperparameter | Parameter selection | Best hyperparameter used |
|---|---|---|---|
| LR | dual | [True, False] | False |
| max_iter | [100,110,120,130,140] | 100 | |
| C | [1,1.5,2,2.5] | 2 | |
| SVR | kernel | rbf | rbf |
| C | [0.1, 1, 100, 1000] | 100 | |
| Gamma | [0.0001, 0.001,0.01 0.005, 0.1, 1, 3, 5] | 0.1 | |
| Epsilon | [0.0001, 0.001, 0.01, 0.05, 0.1, 0.5, 1, 5, 10] | 0.0001 | |
| RFR | bootstrap | [True, False] | True |
| max_depth | [10, 20, 30, 40, 50, 60, 70, 80, 90, 100, None] | 70 | |
| max_features | [‘auto’, ‘sqrt’] | auto | |
| min_samples_leaf | [1, 2, 4] | 4 | |
| min_samples_split | [2, 5, 10] | 10 | |
| n_estimators | [100, 200, 400, 600, 800, 1000, 1200, 1400, 1600, 1800, 2000] | 400 | |
| LSTM | neurons | [1–5] | 1 |
| batches | [1, 2, 4] | 4 | |
| epochs | [500, 1000, 2000, 4000, 6000] | 1000 |
Model performance evaluation on COVID-19 outbreak worldwide
Table 3 shows the result of four regression models based on the performance evaluation to forecast the COVID-19 outbreak worldwide. The forecasting result has been divided into five parts. In the first part, the forecasting of COVID-19 confirmed cases worldwide has evaluated. In the remaining part, the country-specific (China, India, Italy, and the USA) forecasting has been performed. China, India, Italy, and the USA has been taken for the prediction of COVID-19 confirmed cases. The forecasted result has been evaluated using two performance measures: MAPE (should be low) and RMSE (should be low). The performance of each model has been calculated using performance measures to find out the best suitable forecasting model among them. All the experiment has been performed using five selection or prediction criteria which are 1-day ahead, 3-day ahead, 5-day ahead, 10-day ahead, and 15-day ahead. The proposed MTGP model wins the battle with the lowest MAPE and RMSE throughout the experiment under different selection criteria (various countries).
Table 3.
Performance evaluation of the prediction algorithms (confirmed cases)
| Country | Methods | Predict days | |||||||||
|---|---|---|---|---|---|---|---|---|---|---|---|
| 1-day ahead | 3-day ahead | 5-day ahead | 10-day ahead | 15-day ahead | |||||||
| MAPE | RMSE | MAPE | RMSE | MAPE | RMSE | MAPE | RMSE | MAPE | RMSE | ||
| Worldwide | LR | 7.22 | 2092.62 | 6.56 | 2102.11 | 6.01 | 2162.48 | 6.86 | 2189.33 | 7.08 | 2199.49 |
| SVR | 3.65 | 465.50 | 6.63 | 483.35 | 3.18 | 528.18 | 3.56 | 546.71 | 3.93 | 596.33 | |
| RFR | 6.80 | 1762.12 | 6.43 | 1792.36 | 5.39 | 1820.11 | 6.44 | 1840.24 | 5.40 | 1863.75 | |
| LSTM | 2.06 | 293.96 | 2.86 | 324.73 | 2.18 | 366.16 | 2.66 | 411.32 | 2.91 | 460.18 | |
| MTGP (Proposed) | 1.16 | 122.97 | 1.27 | 166.18 | 1.15 | 206.23 | 1.45 | 286.36 | 1.48 | 331.27 | |
| China | LR | 3.5 | 688.21 | 3.57 | 713.79 | 3.81 | 723.53 | 3.63 | 774.18 | 3.51 | 798.90 |
| SVR | 1.50 | 220.92 | 1.56 | 241.42 | 1.78 | 285.16 | 1.75 | 334.94 | 1.83 | 359.89 | |
| RFR | 2.60 | 457.70 | 2.59 | 461.93 | 2.69 | 512.35 | 2.80 | 551.37 | 2.90 | 595.40 | |
| LSTM | 1.10 | 178.93 | 1.19 | 198.24 | 1.28 | 212.75 | 1.31 | 241.13 | 1.37 | 256.5 | |
| MTGP (Proposed) | 0.70 | 119.84 | 0.82 | 129.81 | 0.85 | 139.10 | 0.88 | 148.86 | 0.92 | 154.74 | |
| India | LR | 6.40 | 2125.89 | 6.77 | 2151.64 | 6.98 | 2175.23 | 7.32 | 2267.69 | 7.50 | 2297.94 |
| SVR | 3.72 | 537.20 | 3.80 | 557.08 | 4.27 | 582.32 | 4.38 | 608.1 | 4.54 | 619.73 | |
| RFR | 5.29 | 1837.49 | 5.54 | 1873.55 | 5.97 | 1908.22 | 6.07 | 1958.13 | 6.39 | 2060.97 | |
| LSTM | 2.91 | 367.36 | 3.09 | 389.50 | 3.45 | 407.83 | 3.59 | 435.97 | 3.65 | 440.86 | |
| MTGP (Proposed) | 2.10 | 197.35 | 2.38 | 222.13 | 2.54 | 232.85 | 2.74 | 262.92 | 2.77 | 280.19 | |
| Italy | LR | 7.25 | 1706.76 | 7.43 | 1754.17 | 7.59 | 1782.82 | 7.65 | 1805.70 | 7.97 | 1822.05 |
| SVR | 2.93 | 393.16 | 3.14 | 405.75 | 3.50 | 425.67 | 3.68 | 449.53 | 3.83 | 486.87 | |
| RFR | 5.46 | 1542.48 | 5.49 | 1584.83 | 5.7 | 1604.12 | 5.95 | 1659.67 | 6.03 | 1665.71 | |
| LSTM | 2.11 | 287.50 | 2.20 | 297.13 | 2.53 | 318.87 | 2.75 | 337.5 | 2.92 | 376.14 | |
| MTGP (Proposed) | 1.27 | 182.38 | 1.42 | 190.13 | 1.65 | 215.73 | 1.74 | 225.51 | 1.88 | 257.24 | |
| USA | LR | 7.21 | 2033.71 | 7.69 | 2070.22 | 7.87 | 2190.84 | 8.18 | 2250.66 | 8.36 | 2183.56 |
| SVR | 3.48 | 408.4 | 3.84 | 467.32 | 3.97 | 483.36 | 4.08 | 497.20 | 4.21 | 513.02 | |
| RFR | 6.05 | 1679.66 | 6.32 | 1772.70 | 6.57 | 1785.79 | 6.71 | 1862.87 | 6.95 | 1894.36 | |
| LSTM | 2.80 | 302.64 | 3.05 | 336.47 | 3.19 | 360.12 | 3.31 | 378.43 | 3.45 | 395.50 | |
| MTGP (Proposed) | 1.89 | 196.85 | 2.07 | 203.79 | 2.35 | 235.01 | 2.59 | 258.50 | 2.65 | 274.12 | |
Discussion
In the process of result finding, we have made the dataset with the help of the WHO health bulletin. Day to day bulletin report has been taken into consideration from the timestamp of 31/12/2019 to 25/06/2020. The data is consisting of approximately 213 affected countries with the country/territory/area name, date, the total number of confirmed cases, the total number of deaths, the total number of new confirmed cases, total number new deaths, the total number of recovered patients, the total number of active patients, and transmission classification. The default settings have been used in four machine learning models i.e., Linear Regression (LR), Random Forest Regression (RFR), Support Vector Regression (SVR), and Long Short-Term Memory (LSTM). But in the MTGP model, the improved kernel matrix has been used. We followed the same testing and training mechanism for the prediction of time series as we were using in the traditional GPR model, excluding the kernel matrix. In the proposed MTGP forecasting model, the dataset is given at the input side, and in the output side, the historical and reference series is received.
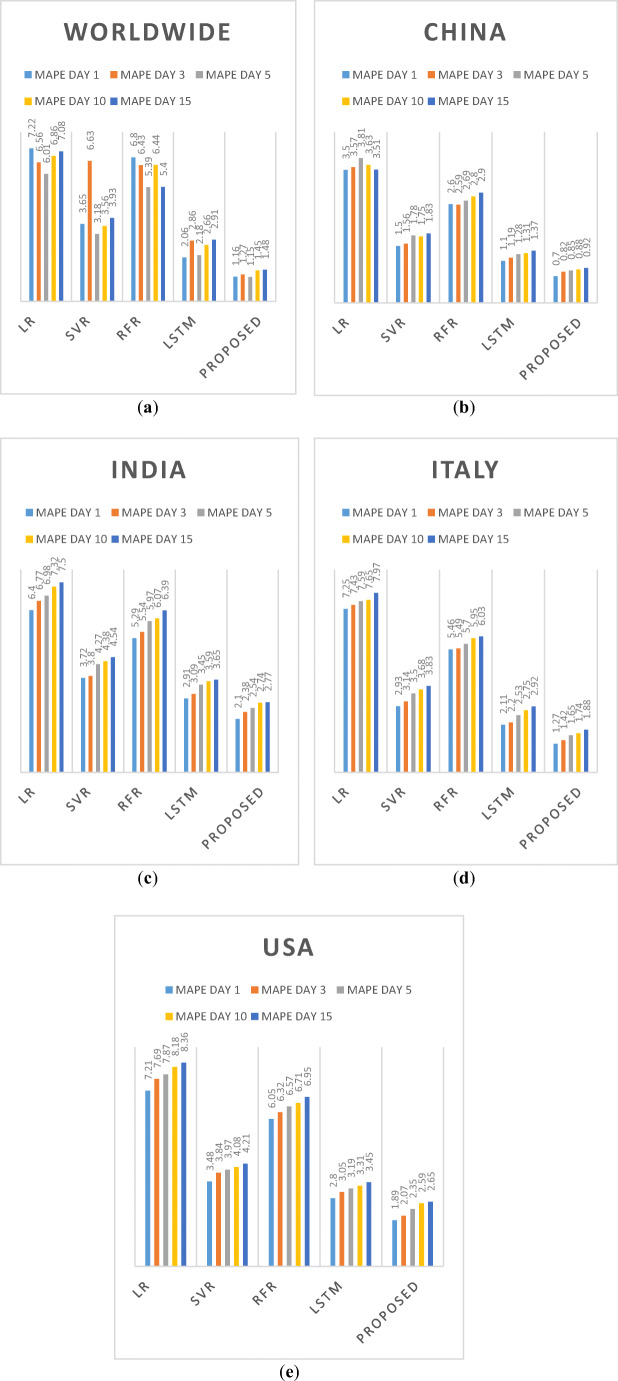
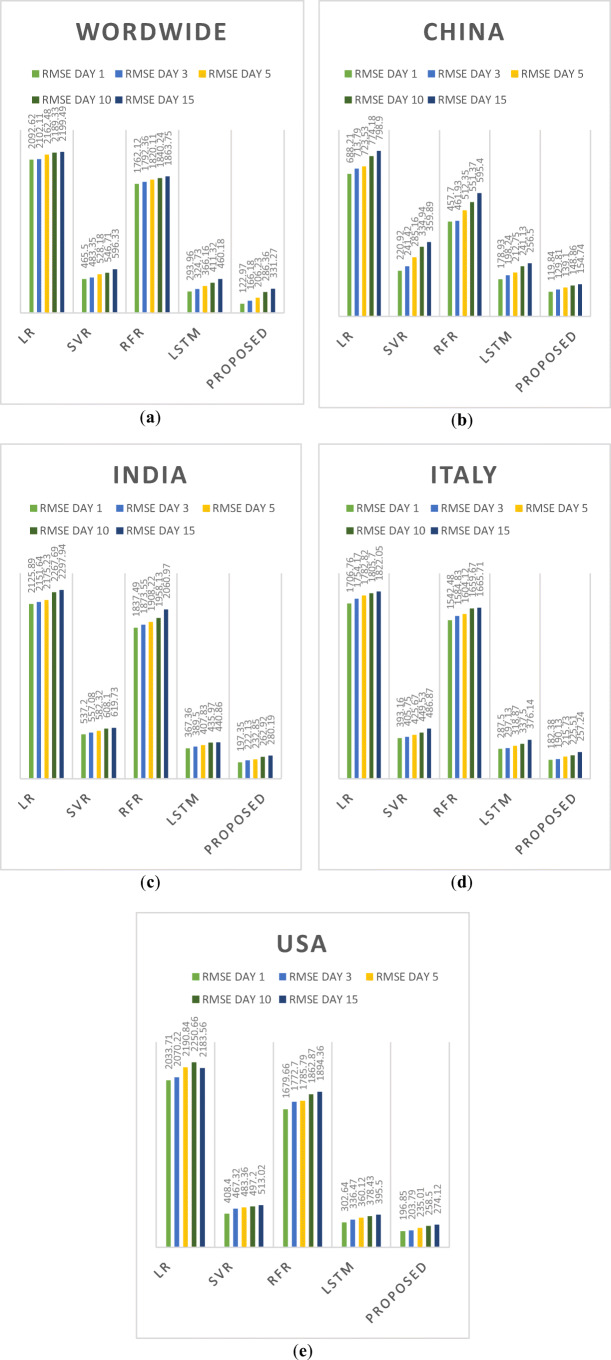
In Figs. 5 and 6, the performance measures-based prediction outcomes of China, India, Italy, USA, and worldwide using various forecasting model has been shown. Mean Absolute Percentage Error (MAPE) and Root Mean Square Error (RMSE) have been used as performance measures. The performance of each model has been calculated using these performance measures to determine the best suitable forecasting model among them. All the experiment has been performed using five selection or prediction criteria: 1-day ahead, 3-day ahead, 5-day ahead, 10-day ahead, and 15-day ahead. With the help of these measures results, we have found that our proposed model’s performance is better than all other models. The proposed model achieves the lowest MAPE and RMSE throughout the experiment under various selection criteria (multiple countries).
Fig. 5.
Bar Graph of the Results based on Mean Absolute Percentage Error (MAPE) of Confirmed Cases: a Worldwide b China c India d Italy e USA
Fig. 6.
Bar Graph of the Results based on Root Mean Square Error (RMSE) of Confirmed Cases: a Worldwide b China c India d Italy e USA
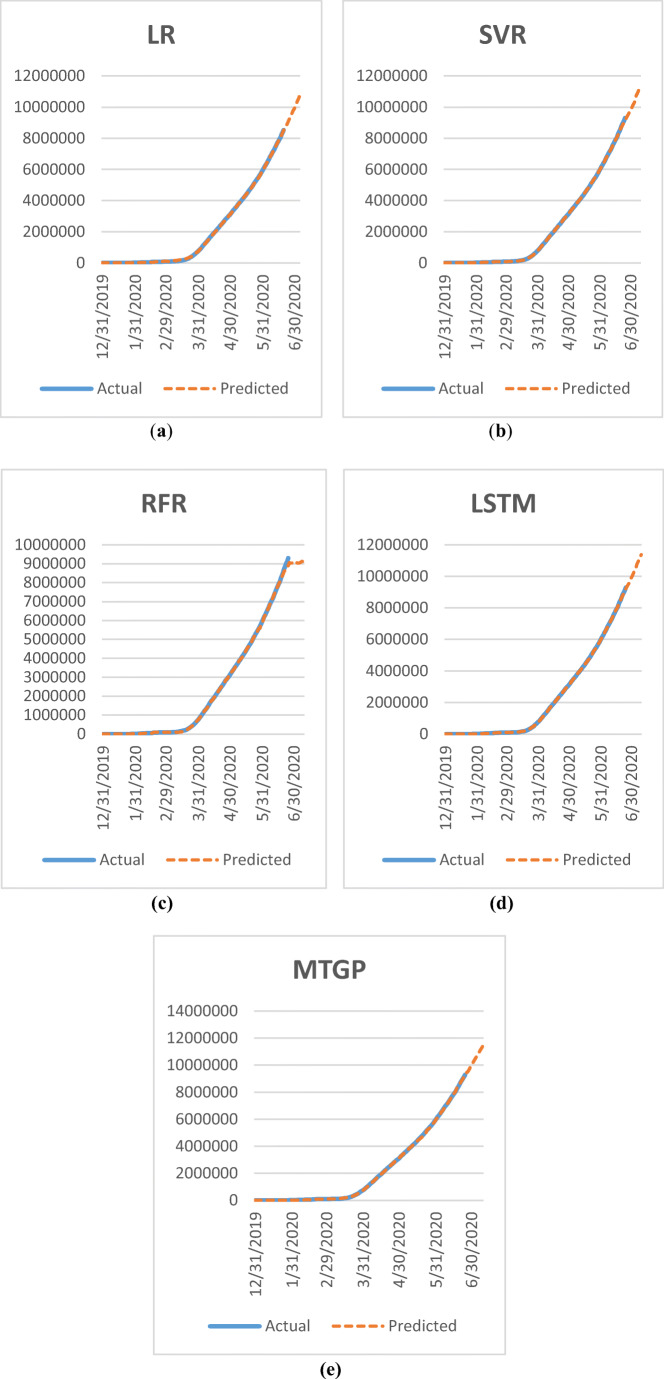
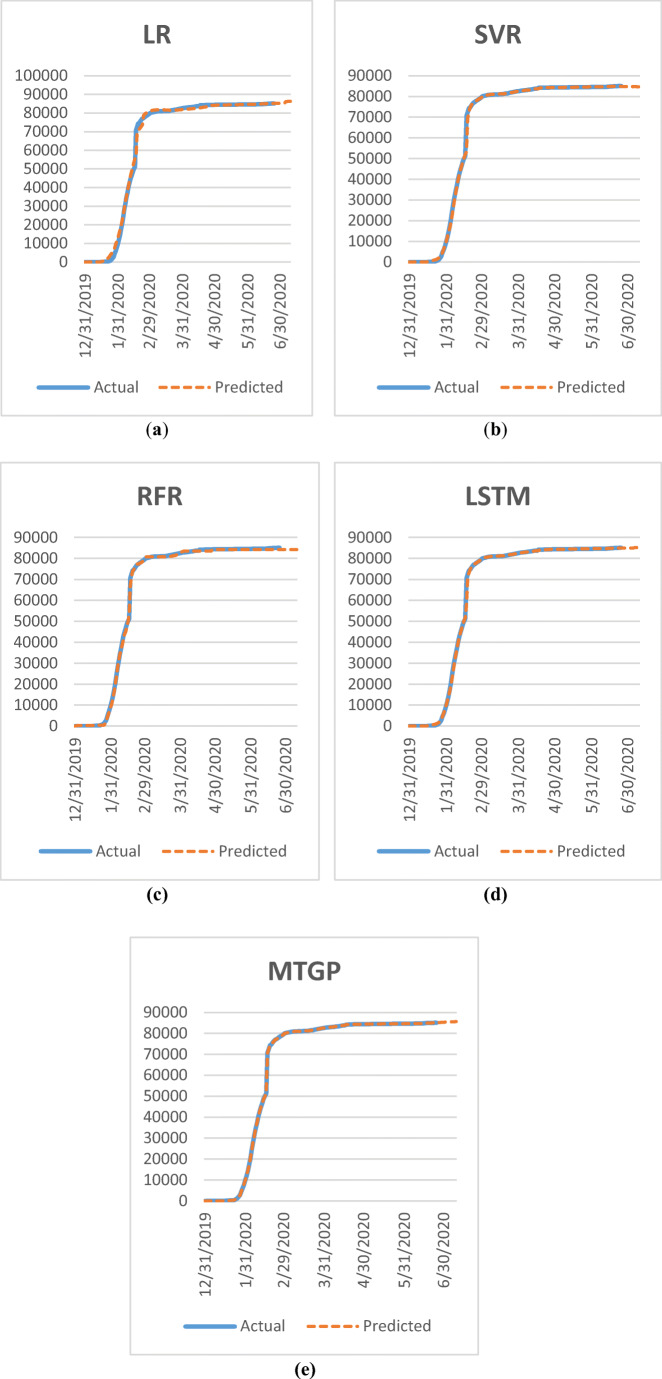
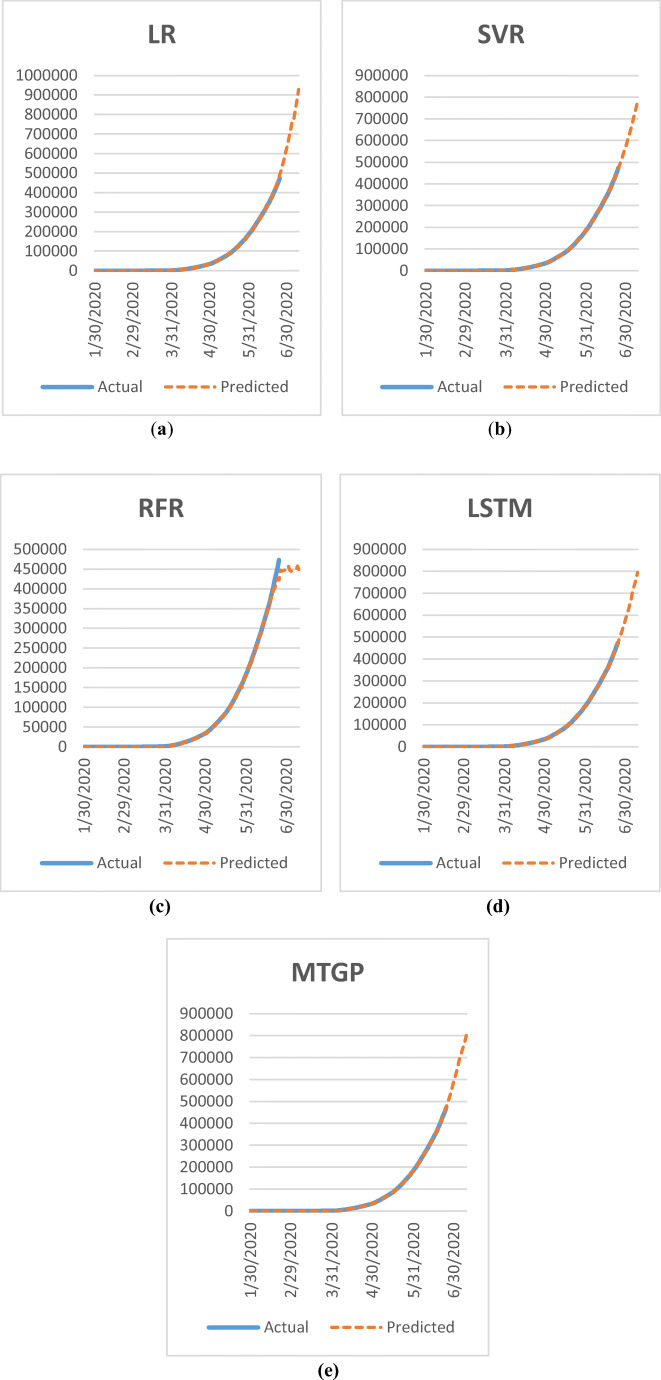
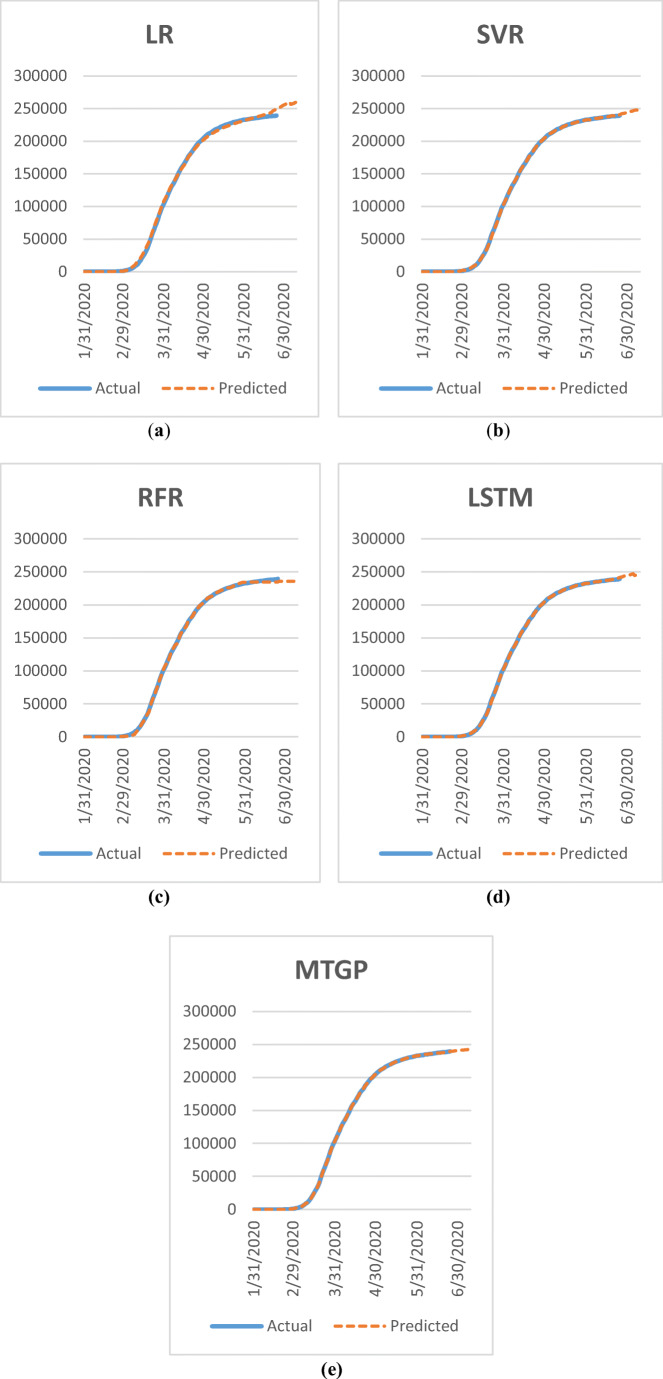
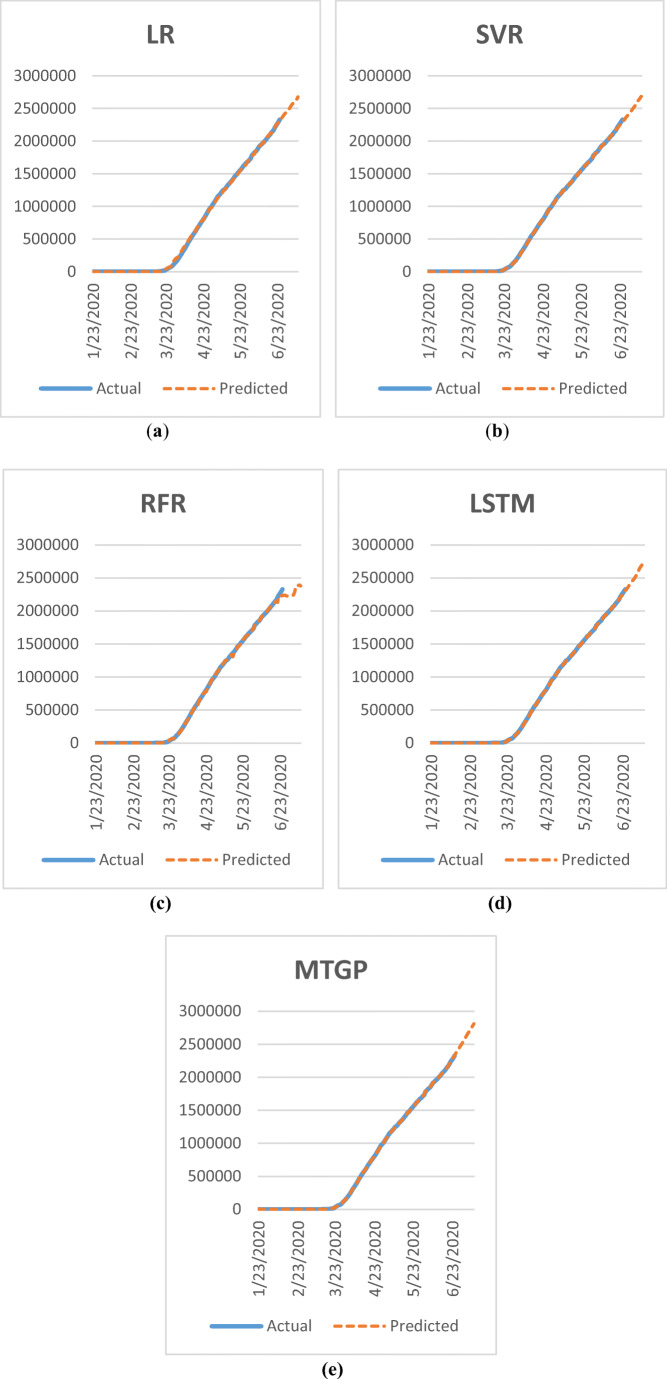
In Figs. 7, 8, 9, 10 and 11, on the y-axis, the number of infected patients has been taken, and, on the x-axis, the date has been represented. In this experiment, the 15-days advance forecasting of confirmed cases Worldwide, China, India, Italy, and the USA, have been performed, and their results have been plotted in Figs. 7, 8, 9 and 10, respectively. Four forecasting models have been used to perform the experiments. The models we have taken are LR, SVR, RF, LSTM, and proposed MTGP model, and based on these models’ results; the graph has been plotted. The prediction results for Worldwide has been presented in Fig. 7a to e. The prediction results for China, India, Italy, and the USA has been shown in the graph 8(a) to 8(e), 9(a) to 9(e), 10(a) to 10(e), and 11(a) to 11(e) respectively. All the models simulate the prediction of the COVID-19 outbreak relatively well. In the context of performance, the proposed enhanced MTGP model performs better among all other forecasting models.
Fig. 7.
Graph of 15-Days Advance Forecasting of Confirmed Cases in COVID-19 Outbreak for Worldwide: a LR Model b SVR Model c RFR Model d LSTM Model e Proposed MTGP Model
Fig. 8.
Graph of 15-Days Advance Forecasting of Confirmed Cases in COVID-19 Outbreak for China: a LR Model b SVR Model c RFR Model d LSTM Model e Proposed MTGP Model
Fig. 9.
Graph of 15-Days Advance Forecasting of Confirmed Cases in COVID-19 Outbreak for India: a LR Model b SVR Model c RFR Model d LSTM Model e Proposed MTGP Model
Fig. 10.
Graph of 15-Days Advance Forecasting of Confirmed Cases in COVID-19 Outbreak for Italy: a LR Model b SVR Model c RFR Model d LSTM Model e Proposed MTGP Model
Fig. 11.
Graph of 15-Days Advance Forecasting of Confirmed Cases in COVID-19 Outbreak for the USA: a LR Model b SVR Model c RFR Model d LSTM Model e Proposed MTGP Model
Significance of IoT in the detection of COVID-19
The bitter truth about the technologies is that we cannot replace humans with the technology because the human is enriched with decision-making authority and technologies have limited power. However, it is also a truth that humans can opt for the latest technology for making their life simple and smooth. The keywords which will define IoT for everything are efficiency, convenience, and automation. Emerging of IoT technology is a game-changer not only in the industrial perspective but also in the healthcare domain because it connects to various heterogeneous devices using wired or wireless connections and sends or receives the data to cloud base stations. The beginning of IoT in healthcare has been seen, such as the use of smart sensors, remote monitoring of patients, and the integration of various medical devices. Apart from this, the use of applications like wearable biometric sensors, activity recognition via sensors, medication dispensers, glucose monitors, and smart beds gives the wing to IoT technology and emergence to the IoHT (Internet of Healthcare Things). The significance of the IoT devices in disease detection has been discussed below.
In directly turning data into action
Data should always ready into action, and if we are using the IoT device for health monitoring, so we don’t have to worry about the data at an epidemic stage. In the case of the COVID-19 outbreak, we face data-related issues because we don’t have the correct numbers about infected patients across the world. We have some data where such smart healthcare infrastructure has been developed, but it is very lesser. We are only dependent on the WHO, which is somehow managing informative data of all countries with respect to current scenarios. That is one of the most significant issues to date. Thus, neither can we control the virus spread rate nor make an efficient prevention plan. If we have such infrastructure in the future, we will never suffer like this, because we will have enough data and could make plans accordingly.
In improving the health of patients
With the help of wearable IoT devices, humans can track their health and take precautions to improve their health. If we talk about the significance of IoT devices in detecting the COVID-19 outbreak, we can follow each ill person and take appropriate action to minimize its spread. Suppose we have collected data that are coming from various tracking devices. In that case, we can identify the maximum exposed area in terms of disease spread as well as the people who are escaping from the hospitals or isolation wards can also be tracked. We can also keep on eyes at the suspects. So overall, with the help of IoT devices, we can efficiently control the exposure rate as well as improve the health of patients.
In the promotion of preventative measures
With the help of IoT infrastructure, we can circulate the prevention method for the public and aware of them with its consequences and effects on human health. As we know that IoT devices may generate the data in real-time thus, we can share this information or data among the mobs so they can keep track of the epidemic situation. Apart from it, we can warn people not to go in such areas where the maximum exposure has been being taken place. Thus, with the help of a real-time system like IoT for healthcare, we can promote and spread awareness among people. We can also guide them on how to deal with epidemic situations.
In the advancements of management strategies for healthcare
Due to the COVID-19, the people who are suffering from respiratory diseases need extensive care. Thus, with the help of a health dataset, we can identify and track the persons who are having such problems. The prevention strategies can be made using the real-time data of disease spread and applying efficient management strategies to deal with it. It was earlier not possible because we didn’t have real data. So, advanced management strategies need real-time data to deal with any epidemic diseases like COVID-19. That is possible only if, when we are using IoT infrastructure for the healthcare system.
Person who needs extensive care from COVID-19
As we know, the COVID-19 is a virus-based contagious disease that has been widely spread nowadays. It can affect all the age group person but deadliest for the persons who are suffering from the below-mentioned diseases. Such a person needs extensive care from COVID-19. In Table 4, the persons who need extensive care has been discussed [11, 58, 59].
Table 4.
The person who needs extensive care
| Diseases | Severe health problems for |
|---|---|
| COVID-19 |
✓ The person suffering from heart disease ✓ The person suffering from congestive heart failure ✓ The person suffering from coronary artery syndrome ✓ The person suffering from asthma, ✓ The person suffering from Emphysema ✓ The person suffering from COPD (Chronic Obstructive Pulmonary Disease) ✓ Women with pregnancy ✓ Outdoor labors ✓ Old age peoples ✓ Sportsperson who exercise strongly in outdoors |
Possible solution
For the detection of novel infectious diseases by existing resources and definition is the step by step process. The real-time data and their analytics are needed for taking preventive measures. With the help of accurate information and quick action, we can reduce the overall impact of the novel diseases worldwide, which can also reduce the social and economic factors of countries. The real-time tracking and detecting of the novel diseases are an arduous task, but by using the IoT, it is possible too. IoT can play a vital role in detecting and controlling the outbreak of virus-based infectious diseases in real-time.
Real-time tracking of disease spread
The emergence of technologies such as big data and IoT in healthcare gives researchers an area to work on. With the help of IoT, we can get the data from the various places in real-time where earlier, it was either possible thru manually or not possible at all. The device like a smart thermometer and smart thermal cameras plays a vital role in the people’s initial screening so that we can detect the people suffering from COVID-19. Intelligent devices such as thermal cameras can be installed at every place like airports, railways, roadways, and home doors. Thus, we can easily identify the healthy person and ill person. All systems should be integrated with the base stations (not in a case of home automation), where we can monitor the data and plan the desired action accordingly. These things are real, which means the data has been collected and analyzed in real-time. Thus, with the help of IoT based systems, the real-time tracking of the disease spread rate and spread density can be achieved. As we know, the IoT is an interconnection of heterogeneous devices or systems, and with the help of this, we can also collect the data from remote areas. Integrating these data globally for participating in the global health system will not only help in the real-time tracking of the diseases but also in the prediction mechanism for the prevention of disease spread.
IoT based responding and monitoring for public health
The use of IoT can change individuals’ lives by integrating smart clinics. Smart clinics mean the clinics which are using the various IoT devices and collecting the data in real-time. It can also communicate among the other smart clinics and also share information for medical studies in real-time. These smart clinics are connected to the central server, where all the data is being collected and monitored in real-time. All the records about the patient should be available at the primary database so, it will easy for the government to take the preventive measure when the epidemic situation comes into the picture. The primary aim of such infrastructure is to enable IoT devices and enable the associated health clinics to manage public health crises. It will also be helpful in detecting suspicion outbreaks as well as in the detection of a confirmed outbreak caused by virus-based diseases. In the situation of growing suspicion of an explosion, it can use the IoT devices to obtain focused data by locating the epidemic source. Similarly, the same network can be used for providing medication and health services in the affected areas.
Employing efficient mechanisms for prevention of infection
The lack of data availability and relevant data is a big hurdle toward making prevention policies. Data is one of the essential requirements for making appropriate approaches and test the hypothesis. It also plays a vital role in controlling infectious diseases. With the help of IoT and advanced technology in the proficient healthcare system, we can overcome these limitations or challenges. With the help of IoT based systems, we can collect the data from various locations and resources. After that, these data are sent into the central health server, which will serve as an input to the researcher for the analysis. Based on the analysis result, we can find the impact of the outbreak and make the preventive roadmap accordingly to minimize the overall effect. As we know, the whole world is suffering from the COVID-19, where preventive measures are significant to minimize the overall impact. With the help of IoT based smart system, we can easily find highly infected areas. Based on IoT-based intelligent systems, we can make effective solutions such as where to place the sanitizing points, which area should be a lockdown, and where we need massive health support.
Conclusions
In an epidemic situation, any small finding can help a lot. In this challenging pandemic situation, the forecasting of the COVID-19 outbreak plays an important role. It gives an idea about its widespread in upcoming days, which will help the government to take preventive measures for minimizing its spread. Correct and efficient forecasting of outbreaks in any epidemic situation is a very complex but novel task. It becomes more complicated when preventive measures depend upon the prediction, and we don’t have real-time data. In this paper, a COVID-19 outbreak forecasting method has been proposed to deal with all limitations compared to other traditional models. For the experimental evaluation, we have compared the performance of four traditional forecasting models, i.e., Linear Regression (LR), Random Forest Regression (RFR), Support Vector Regression (SVR), and Long Short-Term Memory (LSTM) with our proposed MTGP forecasting model to find out its suitability and correctness. Mean Absolute Percentage Error (MAPE) and Root Mean Square Error (RMSE) have been used as performance measures. The performance of each model has been calculated using these performance measures to determine the best suitable forecasting model among them. All the experiment has been performed using five selection or prediction criteria: 1-day ahead, 3-day ahead, 5-day ahead, 10-day ahead, and 15-day ahead. With the help of these measures results, we have found that our proposed model’s performance is better than all other models. The proposed model achieves the lowest MAPE and RMSE throughout the experiment under various selection criteria. Apart from that, we have found the significance of IoT in healthcare as well as the importance of IoT for COVID-19 detection and IoT based possible solutions for minimizing the impact of the COVID-19.
In the future, we again analyze the proposed model with different datasets and find out the further boosting techniques which can boost the model efficiency. The Sparse Gaussian Process method is one of the probable solutions.
Acknowledgments
We would like to thank Prof. Moonis Ali and Prof. Hamido, Editor-in-Chief of Applied Intelligence for their critical reviews and suggestions. We are also very thankful for giving us the opportunity to revise our manuscript. We show our sincere gratitude to the anonymous reviewer(s) whose valuable comments helped us greatly to improve the presentation.
Biographies
Shwet Ketu
received the B.Tech. degree in Computer Science and Engineering from B.B.S. College of Engineering and Technology, India, in 2012, and M.Tech. degree in Information Technology from Indian Institute of Information Technology, India, in 2015. Currently, he is pursuing Ph.D. in Computer Science at Department of Computer Science, Institute of Science, Banaras Hindu University, Varanasi, India. His research interests include Internet of Things (IoT), Big Data Analytics, Machine learning, and Data Science.

Pramod Kumar Mishra
is Professor at Department of Computer Science, Institute of Science, Banaras Hindu University, India. He is a Fellow of Institute of Mathematical Analysis (UK) and a senior member of IEEE (USA). His research interests include Computational Complexity, Data Mining, IoT, High Performance Computing and VLSI Algorithms.
Footnotes
Publisher’s note
Springer Nature remains neutral with regard to jurisdictional claims in published maps and institutional affiliations.
Contributor Information
Shwet Ketu, Email: shwetiiita@gmail.com.
Pramod Kumar Mishra, Email: mishra@bhu.ac.in.
References
- 1.Severe Acute Respiratory Syndrome (SARS). Available online: https://en.wikipedia.org/wiki/Severe_acute_respiratory_syndrome. Accessed on 10 Mar 2020
- 2.SWINE FLU. Available online: https://en.wikipedia.org/wiki/2009_flu_pandemic_by_country. Accessed on 10 Mar 2020
- 3.Ebola. Available online: https://en.wikipedia.org/wiki/Western_African_Ebola_virus_epidemic. Accessed on 10 Mar 2020
- 4.Middle East respiratory syndrome (MARS). Available online: https://en.wikipedia.org/wiki/Middle_East_respiratory_syndrome. Accessed on 10 Mar 2020
- 5.Novel Coronavirus(COVID-19). Available online: https://www.who.int/emergencies/diseases/novel-coronavirus-2019. Accessed on 10 Mar 2020 to 24 Mar 2020
- 6.“WHO | Novel Coronavirus – China”. WHO. Archived from the original on 23 January 2020. Accessed on 5 Mar 2020
- 7.Cohen J (2020) Wuhan seafood market may not be source of novel virus spreading globally. Science 10
- 8.Coronavirus(COVID-19). Available online: https://www.who.int/health-topics/coronavirus#tab=tab_1. Accessed on 5 Mar 2020
- 9.WHO Emergency Committee . Statement on the second meeting of the international health regulations (2005) Emergency Committee regarding the outbreak of novel coronavirus (COVID-19) Geneva: WHO; 2005. p. 2020. [Google Scholar]
- 10.Sparrow A (2020) How China’s coronavirus is spreading—and how to stop it. Foreign Policy. Archived from the original on, 31
- 11.Coronavirus disease (COVID-2019) situation reports. Available online https://www.who.int/emergencies/diseases/novel-coronavirus-2019/situation-reports/. Accessed on 23 Jan to 21 June 2020
- 12.Croda RMC, Romero DEG, Morales SOC. Sales prediction through neural networks for a small dataset. IJIMAI. 2019;5(4):35–41. doi: 10.9781/ijimai.2018.04.003. [DOI] [Google Scholar]
- 13.Hyndman RJ, Kostenko AV. Minimum sample size requirements for seasonal forecasting models. foresight. 2007;6(Spring):12–15. [Google Scholar]
- 14.Liu H, Ong YS, Shen X, Cai J (2020) When Gaussian process meets big data: a review of scalable GPs. IEEE Transactions on Neural Networks and Learning Systems [DOI] [PubMed]
- 15.Burke RM, Shah MP, Wikswo ME, Barclay L, Kambhampati A, Marsh Z, Cannon JL, Parashar UD, Vinjé J, Hall AJ. The norovirus epidemiologic triad: predictors of severe outcomes in US norovirus outbreaks, 2009–2016. J Infect Dis. 2019;219(9):1364–1372. doi: 10.1093/infdis/jiy569. [DOI] [PMC free article] [PubMed] [Google Scholar]
- 16.Carlson CJ, Dougherty E, Boots M, Getz W, Ryan SJ. Consensus and conflict among ecological forecasts of Zika virus outbreaks in the United States. Sci Rep. 2018;8(1):1–15. doi: 10.1038/s41598-018-22989-0. [DOI] [PMC free article] [PubMed] [Google Scholar]
- 17.Kleiven EF, Henden JA, Ims RA, Yoccoz NG. Seasonal difference in temporal transferability of an ecological model: near-term predictions of lemming outbreak abundances. Sci Rep. 2018;8(1):1–6. doi: 10.1038/s41598-018-33443-6. [DOI] [PMC free article] [PubMed] [Google Scholar]
- 18.Rivers-Moore NA, Hill TR. A predictive management tool for blackfly outbreaks on the Orange River, South Africa. River Res Appl. 2018;34(9):1197–1207. doi: 10.1002/rra.3357. [DOI] [Google Scholar]
- 19.Yin R, Tran VH, Zhou X, Zheng J, Kwoh CK. Predicting antigenic variants of H1N1 influenza virus based on epidemics and pandemics using a stacking model. PLoS One. 2018;13(12):e0207777. doi: 10.1371/journal.pone.0207777. [DOI] [PMC free article] [PubMed] [Google Scholar]
- 20.Koike F, Morimoto N. Supervised forecasting of the range expansion of novel non-indigenous organisms: alien pest organisms and the 2009 H1N1 flu pandemic. Glob Ecol Biogeogr. 2018;27(8):991–1000. doi: 10.1111/geb.12754. [DOI] [Google Scholar]
- 21.Agarwal N, Koti SR, Saran S, Senthil Kumar A. Data mining techniques for predicting dengue outbreak in geospatial domain using weather parameters for New Delhi, India. Curr Sci. 2018;114(11):2281–2291. doi: 10.18520/cs/v114/i11/2281-2291. [DOI] [Google Scholar]
- 22.Anno S, Hara T, Kai H, Lee MA, Chang Y, Oyoshi K, Mizukami Y, Tadono T (2019) Spatiotemporal dengue fever hotspots associated with climatic factors in Taiwan including outbreak predictions based on machine-learning. Geospat Health 14(2) [DOI] [PubMed]
- 23.Chenar SS, Deng Z. Development of artificial intelligence approach to forecasting oyster norovirus outbreaks along Gulf of Mexico coast. Environ Int. 2018;111:212–223. doi: 10.1016/j.envint.2017.11.032. [DOI] [PubMed] [Google Scholar]
- 24.Chenar SS, Deng Z. Development of genetic programming-based model for predicting oyster norovirus outbreak risks. Water Res. 2018;128:20–37. doi: 10.1016/j.watres.2017.10.032. [DOI] [PubMed] [Google Scholar]
- 25.Iqbal N, Islam M (2019) Machine learning for dengue outbreak prediction: a performance evaluation of different prominent classifiers. Informatica 43(3)
- 26.Liang R, Lu Y, Qu X, Su Q, Li C, Xia S, Liu Y, Zhang Q, Cao X, Chen Q, Niu B. Prediction for global African swine fever outbreaks based on a combination of random forest algorithms and meteorological data. Transbound Emerg Dis. 2020;67(2):935–946. doi: 10.1111/tbed.13424. [DOI] [PubMed] [Google Scholar]
- 27.Mezzatesta S, Torino C, De Meo P, Fiumara G, Vilasi A. A machine learning-based approach for predicting the outbreak of cardiovascular diseases in patients on dialysis. Comput Methods Prog Biomed. 2019;177:9–15. doi: 10.1016/j.cmpb.2019.05.005. [DOI] [PubMed] [Google Scholar]
- 28.Raja DB, Mallol R, Ting CY, Kamaludin F, Ahmad R, Ismail S, et al. Artificial intelligence model as predictor for dengue outbreaks. Malaysian Journal of Public Health Medicine. 2019;19(2):103–108. doi: 10.37268/mjphm/vol.19/no.2/art.176. [DOI] [Google Scholar]
- 29.Tapak L, Hamidi O, Fathian M, Karami M. Comparative evaluation of time series models for predicting influenza outbreaks: application of influenza-like illness data from sentinel sites of healthcare centers in Iran. BMC research notes. 2019;12(1):353. doi: 10.1186/s13104-019-4393-y. [DOI] [PMC free article] [PubMed] [Google Scholar]
- 30.Muurlink OT, Stephenson P, Islam MZ, Taylor-Robinson AW. Long-term predictors of dengue outbreaks in Bangladesh: a data mining approach. Infectious Disease Modelling. 2018;3:322–330. doi: 10.1016/j.idm.2018.11.004. [DOI] [PMC free article] [PubMed] [Google Scholar]
- 31.Mosavi A, Ghamisi P, Faghan Y, Duan P (2020) Comprehensive review of deep reinforcement learning methods and applications in economics. arXiv preprint arXiv:2004.01509
- 32.Nádai L, Imre F, Ardabili S, Gundoshmian TM, Gergo P, Mosavi A (2020) Performance analysis of combine harvester using hybrid model of artificial neural networks particle swarm optimization. arXiv preprint arXiv:2002.11041
- 33.Roosa K, Lee Y, Luo R, Kirpich A, Rothenberg R, Hyman JM, Yan P, Chowell G. Short-term forecasts of the COVID-19 epidemic in Guangdong and Zhejiang, China: February 13–23, 2020. J Clin Med. 2020;9(2):596. doi: 10.3390/jcm9020596. [DOI] [PMC free article] [PubMed] [Google Scholar]
- 34.Liu Z, Magal P, Seydi O, Webb G (2020) Predicting the cumulative number of cases for the COVID-19 epidemic in China from early data. arXiv preprint arXiv:2002.12298 [DOI] [PubMed]
- 35.Boldog P, Tekeli T, Vizi Z, Dénes A, Bartha FA, Röst G. Risk assessment of novel coronavirus COVID-19 outbreaks outside China. J Clin Med. 2020;9(2):571. doi: 10.3390/jcm9020571. [DOI] [PMC free article] [PubMed] [Google Scholar]
- 36.Al-Qaness MA, Ewees AA, Fan H, Abd El Aziz M. Optimization method for forecasting confirmed cases of COVID-19 in China. J Clin Med. 2020;9(3):674. doi: 10.3390/jcm9030674. [DOI] [PMC free article] [PubMed] [Google Scholar]
- 37.Jung SM, Akhmetzhanov AR, Hayashi K, Linton NM, Yang Y, Yuan B, Kobayashi T, Kinoshita R, Nishiura H. Real-time estimation of the risk of death from novel coronavirus (COVID-19) infection: inference using exported cases. J Clin Med. 2020;9(2):523. doi: 10.3390/jcm9020523. [DOI] [PMC free article] [PubMed] [Google Scholar]
- 38.Fan C, Liu L, Guo W, Yang A, Ye C, Jilili M, Ren M, Xu P, Long H, Wang Y. Prediction of epidemic spread of the 2019 novel coronavirus driven by spring festival transportation in China: a population-based study. Int J Environ Res Public Health. 2020;17(5):1679. doi: 10.3390/ijerph17051679. [DOI] [PMC free article] [PubMed] [Google Scholar]
- 39.Yang W, Cao Q, Qin L, Wang X, Cheng Z, Pan A et al (2020) Clinical characteristics and imaging manifestations of the 2019 novel coronavirus disease (COVID-19): a multi-center study in Wenzhou city, Zhejiang, China. Journal of Infection [DOI] [PMC free article] [PubMed]
- 40.Huang CJ, Chen YH, Ma Y, Kuo PH (2020) Multiple-input deep convolutional neural network model for covid-19 forecasting in China. medRxiv
- 41.Zhu H, Guo Q, Li M, Wang C, Fang Z, Wang P, ... Xiao Y (2020) Host and infectivity prediction of Wuhan 2019 novel coronavirus using deep learning algorithm. BioRxiv
- 42.Riou J, Althaus CL. Pattern of early human-to-human transmission of Wuhan 2019 novel coronavirus (2019-nCoV), December 2019 to January 2020. Eurosurveillance. 2020;25(4):2000058. doi: 10.2807/1560-7917.ES.2020.25.4.2000058. [DOI] [PMC free article] [PubMed] [Google Scholar]
- 43.Ming WK, Huang J, Zhang CJ (2020) Breaking down of healthcare system: mathematical modelling for controlling the novel coronavirus (2019-nCoV) outbreak in Wuhan, China. bioRxiv
- 44.Chen DB, Zhao N, Wang J, Yu Y, Zhao J (2020) Spreading predictability in complex networks. bioRxiv [DOI] [PMC free article] [PubMed]
- 45.Fountain-Jones NM, Machado G, Carver S, Packer C, Recamonde-Mendoza M, Craft ME. How to make more from exposure data? An integrated machine learning pipeline to predict pathogen exposure. J Anim Ecol. 2019;88(10):1447–1461. doi: 10.1111/1365-2656.13076. [DOI] [PubMed] [Google Scholar]
- 46.Benvenuto D, Giovanetti M, Vassallo L, Angeletti S, Ciccozzi M (2020) Application of the ARIMA model on the COVID-2019 epidemic dataset. Data in brief, 105340 [DOI] [PMC free article] [PubMed]
- 47.Rasmussen CE (2003) Gaussian processes in machine learning. In: Summer school on machine learning. Springer, Berlin, pp 63–71
- 48.Liu H, Cai J, Ong YS. Remarks on multi-output Gaussian process regression. Knowl-Based Syst. 2018;144:102–121. doi: 10.1016/j.knosys.2017.12.034. [DOI] [Google Scholar]
- 49.Bonilla EV, Chai KM, Williams C (2008) Multi-task Gaussian process prediction. In: Advances in neural information processing systems, pp 153–160
- 50.Dürichen R, Pimentel MA, Clifton L, Schweikard A, Clifton DA. Multitask Gaussian processes for multivariate physiological time-series analysis. IEEE Trans Biomed Eng. 2014;62(1):314–322. doi: 10.1109/TBME.2014.2351376. [DOI] [PubMed] [Google Scholar]
- 51.Richardson RR, Osborne MA, Howey DA. Gaussian process regression for forecasting battery state of health. J Power Sources. 2017;357:209–219. doi: 10.1016/j.jpowsour.2017.05.004. [DOI] [Google Scholar]
- 52.Weisberg S (2005) Applied linear regression, vol 528. Wiley
- 53.Drucker H, Burges CJ, Kaufman L, Smola AJ, Vapnik V (1997) Support vector regression machines. In: Advances in neural information processing systems, pp 155–161
- 54.Liaw A, Wiener M. Classification and regression by randomForest. R news. 2002;2(3):18–22. [Google Scholar]
- 55.Hochreiter S, Schmidhuber J. Long short-term memory. Neural Comput. 1997;9(8):1735–1780. doi: 10.1162/neco.1997.9.8.1735. [DOI] [PubMed] [Google Scholar]
- 56.Olah C (2018) Understanding lstm networks, August 2015. URL https://colah.github.io/posts/2015-08-Understanding-LSTMs. Accessed on 10 June 2020
- 57.Coe_cient of Determination. Available online: https://en.wikipedia.org/wiki/Coe_cient_of_determination. Accessed on 9 Sept 2019
- 58.Jin YH, Cai L, Cheng ZS, Cheng H, Deng T, Fan YP, et al. A rapid advice guideline for the diagnosis and treatment of 2019 novel coronavirus (2019-nCoV) infected pneumonia (standard version) Military Medical Research. 2020;7(1):4. doi: 10.1186/s40779-020-0233-6. [DOI] [PMC free article] [PubMed] [Google Scholar]
- 59.Schwartz DA, Graham AL. Potential maternal and infant outcomes from (Wuhan) coronavirus 2019-nCoV infecting pregnant women: lessons from SARS, MERS, and other human coronavirus infections. Viruses. 2020;12(2):194. doi: 10.3390/v12020194. [DOI] [PMC free article] [PubMed] [Google Scholar]


