Abstract
Prostate cancer (PCa) is a highly malignant tumor, with increasing incidence and mortality rates worldwide. The aim of this study was to identify the prognostic lncRNAs and construct an lncRNA signature for PCa diagnosis by the interaction network between lncRNAs and protein-coding genes (PCGs). The differentially expressed lncRNAs (DElncRNAs) and PCGs (DEPCGs) between PCa and normal prostate tissues were screened from The Cancer Genome Atlas (TCGA) database. The DEPCGs were functionally annotated in terms of the enriched pathways. Weighted gene co-expression network analysis (WGCNA) of 104 PCa samples identified 15 co-expression modules, of which the Turquoise module was negatively correlated with cancer and included 5 key lncRNAs and 47 PCGs. KEGG pathway analyses of the core 47 PCGs showed significant enrichment in classic PCa-related pathways, and overlapped with the enriched pathways of the DEPCGs. LINC00857, LINC00900, LINC00908, LINC00900, SNHG3 and FENDRR were significantly associated with the survival of PCa and have not been reported previously. Finally, Multivariable Cox regression analysis was used to establish a prognostic risk formula, and the patients were accordingly stratified into the low- and high-risk groups. The latter had significantly worse OS compared to the low-risk group (P < 0.01), and the area under the receiver operating characteristic curve (ROC) of 14-year OS was 0.829. The accuracy of our prediction model was determined by calculating the corresponding concordance index (C-index) and risk curves. In conclusion, we established a 5-lncRNA prognostic signature that provides insights into the biological and clinical relevance of lncRNAs in PCa.
Keywords: lncRNA, prostate cancer, biomarker, WGCNA
Introduction
Prostate cancer (PCa) is the second most common cancer in males, and associated with high mortality rates.1 While prostate-specific antigen (PSA) screening in combination with prostate biopsy has greatly improved the early diagnosis of PCa, the sensitivity of the biopsy is low in patients with serum PSA levels in the range of 4∼10ng/ml. Furthermore, prostate biopsy is highly invasive, and can lead to complications such as infection and bleeding due to puncture.2 In addition, metastatic PCa often progresses to castration resistant prostate cancer (CRPC) after 18-24 months of endocrine therapy.3 Therefore, there is an urgent need to identify novel diagnostic biomarkers and therapeutic options for PCa.
The Human Genome Project revealed that 98.5% of the genes do not encode for proteins,4 and the subsequent ENCODE project showed that while 75% of the gene sequences are transcribed to RNA, the vast majority are not further translated to proteins. LncRNAs are non-coding transcripts longer than 200 nucleotides, and lack specific open reading frame.5 Recent studies show that lncRNAs regulate gene expression at the epigenetic, transcriptional and post-transcriptional levels, and affect cell growth, proliferation, differentiation, metabolism and apoptosis.6 In addition, aberrant lncRNA levels are closely associated with cancer initiation, development, invasion, metastasis and prognosis.7 Several lncRNAs have been identified in PCa and other urological malignancies that are aberrantly expressed and function as oncogenes or tumor suppressors, and are potential markers of early diagnosis and prognosis, as well as therapeutic targets. For instance, Merola et al. reported greater diagnostic accuracy of the lncRNA PCA3 compared to the conventional tPSA and f/tPSA markers, and was approved by the U.S. Food and Drug Administration in 2012.8 Chung et al. reported that PRNCR1 is highly expressed in PCa cells and prostatic intraepithelial neoplasia, and inhibits apoptosis and promotes the proliferation of PCa cells. Prensner et al. demonstrated that PCAT-1 is specifically expressed in the prostate, and increases markedly in PCa tissues wherein it promotes the proliferation and metastasis of the cancer cells.9 Furthermore, Xie X et al identified a tumor suppressive and anti-apoptotic role of lncRNA-GAS5 in PCa, and its aberrantly low expression levels in the tumors was associated with chemoresistance.10 However, the genesis and development of PCa is a complex biological process, and the role of lncRNA is not completely understood.
Weighted correlation network analysis (WGCNA) is a data mining technique used to study biological networks from genomic datasets. It clusters the genes into distinct modules, and analyzes the relationships between the co-expressing modules to construct a network.11 We identified 5 potential prognostic lncRNAs through differentially expressed transcripts, KEGG pathway analysis, WGCNA, and univariate and multivariable Cox regression analysis. The predictive performance of the 5-lncRNA prognostic signature was further validated. The study flowchart is shown in Figure 1.
Figure 1.
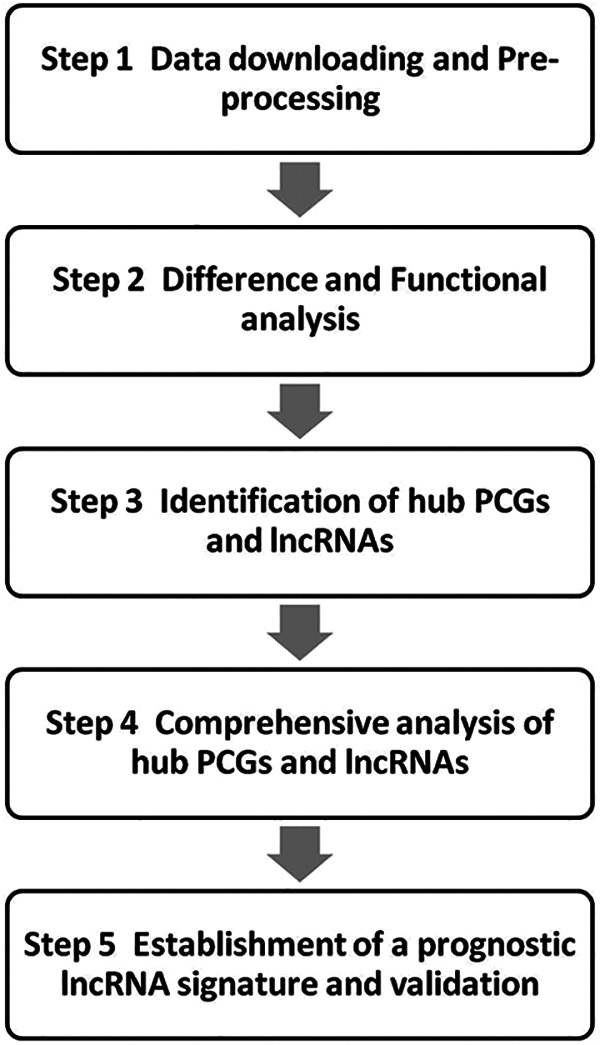
The analysis scheme.
Materials and Methods
Data Extraction
The gene expression profiles of PCa and normal prostate tissues, and the corresponding clinical information, were downloaded from The Cancer Genome Atlas (TCGA; https://portal.gdc.cancer.gov/). Paired, non-repetitive data with complete follow-up information were included for the subsequent analysis.
Screening for Differential Transcripts
The differentially expressed lncRNAs (DElncRNAs) and protein coding genes (DEPCGs) between the PCa and normal tissues were screened using the R package “edger” using |log 2 fold change| >1 and P-value <0.05 as the thresholds. Hierarchical clustering analysis was performed with the R package “pheatmap.” The lncRNAs with average expression greater than 0.5 were considered valid.
Functional Annotation of DEPCGs
The KEGG pathways enriched in the DEPCGs were identified using the R package “clusterProfiler” with P < 0.01 as the threshold to determine the biological functions of these mRNAs.
WGCNA of DEPCGs and DElncRNAs
The co-expression network of DElncRNAs and DEPCGs was constructed by WGCNA. A similarity matrix of gene expression data was first constructed using the Pearson correlation coefficient. Based on the optimal β value of 5, the similarity matrix was transformed into the adjacency matrix by R software package WGCNA, which was then used to calculate the topological matrix. The highly overlapping genes were clustered by the average linkage hierarchy, and the distance between the modules was determined by the degree of topological dissimilarity. The constant height cutoff value was set to 25 and the size of the smallest module was 30 genes. The clusters with interconnected lncRNAs and PCGs were identified using the dynamic tree cutting method.
Analysis of Core Modules and Identification of Prognostically Relevant lncRNAs
To determine the correlation between the gene modules and clinical traits, we constructed a heat map of the different expressed genes and phenotypes. In a follow-up analysis, Turquoise module was selected for the closest association with cancer according to the module–trait relationships. Then a more in-depth analysis of the Turquoise module was conducted. The GS vs MM of the genes in the module were calculated and visualized on a scatter plot, and the candidate PCGs and lncRNAs with a higher correlation were obtained. KEGG pathways analysis was performed for the DEPCGs using the R package “clusterProfiler,” with P < 0.05 as the threshold. To make sure the conclusion more meaningful, the lncRNAs associated with statistical Overall survival (OS) were identified by Univariate Cox analysis using the R package “survival,” with P-value < 0.05 as the threshold. The expression of the 5 core lncRNAs were obtained from TCGA and visualized by R package “ggplot2.”
Construction of Core lncRNA-PCG Network
After excluding the non-annotated lncRNAs, the lncRNAs significantly associated with OS were identified by the K-M survival curve using R package “survival” with P-value < 0.05 as the threshold. In addition, the RFS curves and expression levels of the key lncRNAs in tumor and normal tissues were determined by Gene Expression Profiling Interactive Analysis (GEPIA; http://gepia.cancer-pku.cn/index.html). A regulatory network of core lncRNA-PCG interactions was developed using CytoScape (http://cytoscape.org/, ver. 3.6.0).
Establishment and Validation of Prognostic Risk Score Formula
Multivariable Cox regression analysis was performed to construct the prognostic risk model with the key DElncRNAs, and their clinical significance was established with the ROC curve using the R package “survivslROC.” The prognostic risk assessment model was constructed by the random forest analysis using the R package “survminer,” and the C-index was calculated by the R package “survcomp.” Based on the risk scores, the patients were stratified into the low- and high-risk groups using the median value as the cutoff. The “pheatmap” package was used to visualize the expression heatmaps of each key lncRNA and the risk score distribution and survival of patients. The prognoses of the high- and low-risk groups were determined with the K-M survival curve. Finally, the ROC curve for 14-year OS was plotted using the “survivalROC” package to estimate the prognostic accuracy of the risk score, with P-value <0.05 as the threshold.
Statistical Analysis
TCGA gene expression and clinical data were analyzed using the Perl (version 5.30.1) and R software. All statistical analyses were performed by SPSS23.0 (SPSS, Chicago, IL, United States) or R software. P-value < 0.05 was considered statistically significant with a 95% confidence level.
Results
Data Gathering
A total of 551 transcriptomes, including 499 from cancer and 52 from para-cancerous samples, were downloaded from TCGA. Fifty-two paired PCa and adjacent normal prostate tissue samples (total 104) with clinical follow-up information were screened for WGCNA analysis. And a total of 493 samples were enrolled for the clinical prognosis analysis and validation.
Data Preprocessing and Differential Expression Analysis
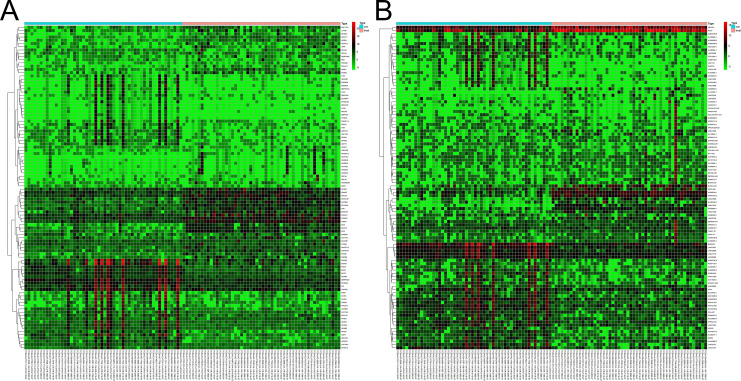
Following quantile normalization, 2593 DEPCGs were screened from the paired samples, of which 785 were upregulated and 1808 were downregulated. In addition, 1034 DElncRNAs were identified, including 617 upregulated and 417 downregulated lncRNAs (Table 1). The heatmaps of the top 100 DEPCGs and DElncRNAs are shown in Figure 2A and B.
Table 1.
Overview of Differentially Expressed PCGs and lncRNAs.
| No. of PCG | No. of lncRNA | |
|---|---|---|
| Upregulated in PCa | 785 | 617 |
| Downregulated in PCa | 1808 | 417 |
| Total | 2593 | 1034 |
Figure 2.
Heatmap of the top 100 differentially expressed genes and lncRNAs.
Functional Analysis of DEPCGs
As shown in Figure 3A and B, the KEGG pathway analyses of upregulated mRNAs indicated significant enrichment of cancer-related pathways such as Cell cycle, Metabolic pathways, Viral carcinogenesis and Cell Cycle. The top 20 enriched KEGG pathways of downregulated PCGs (Figure 3B) included the Ras signaling pathway, PI3K-Akt signaling pathway, MAPK signaling pathway and Pathways in cancer. The KEGG analysis of upregulated and downregulated PCGs both play key roles in PCa genesis, proliferation, invasion and metastasis.
Figure 3.
KEGG enrichment analysis of significantly upregulated (A) and downregulated (B) PCGs.
Identification of Co-Expression Modules
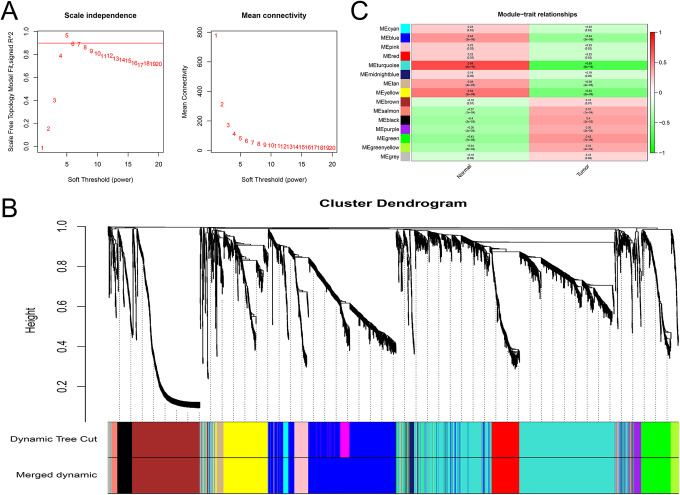
WGCNA was performed for all 2593 DEPCGs and 1034 DElncRNAs. Combining the fit index, the regression slope and the connectivity, the β value of 5 was used to construct the scale-free network (Figure 4A). The genes were clustered based on the degree of topological heterogeneity, and the modules with >0.75 similarity were merged to obtain 15 final modules (Figure 4B). To further determine the association between the these modules and the traits, we combined the traits of the corresponding samples. We detected the closest statistical association between the Turquoise modules and the cancer trait (Figure 4C), and the module showed a negative correlation with cancer trait whose corresponding data was 0.69.
Figure 4.
Co-expression modules identified from the PCa RNA-seq data sets by WGCNA. A, Scale independence and mean network connectivity for soft thresholding powers (β). β =5 was selected to achieve model fit maximization. B, Module–trait relationships between the identified modules and clinical status (normal and tumor): weighted correlations and corresponding p values (in parenthesis). C, Dendrogram produced by average linkage hierarchical clustering of the identified lncRNA-PEG co-expression modules. Genes are linked with each other according to their TOM similarity, resulting in 15 modules. The gray leaves indicate unassigned lncRNAs and PCGs.
Analysis of Hub Modules and Identification of Hub lncRNAs
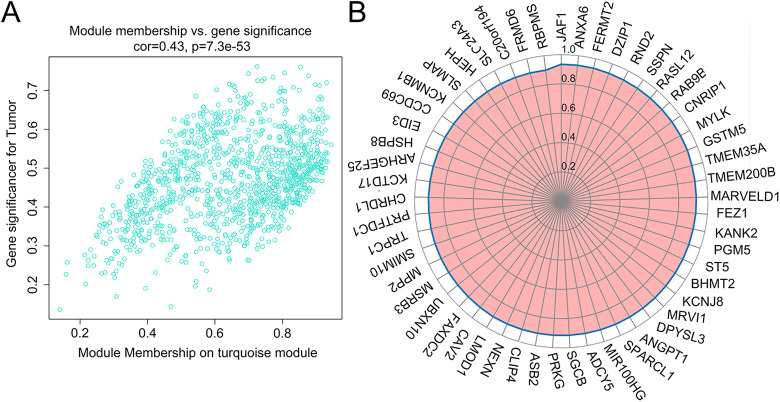
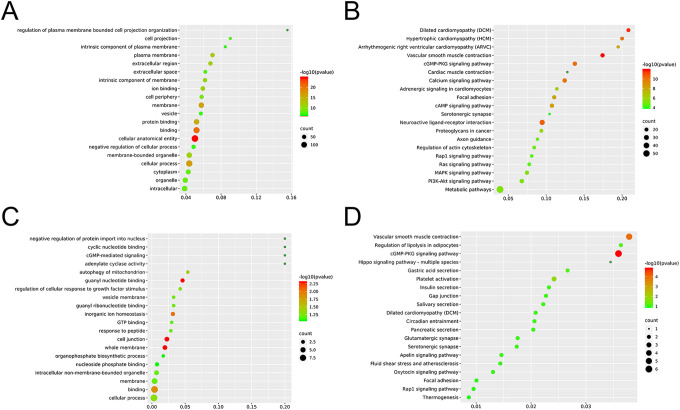
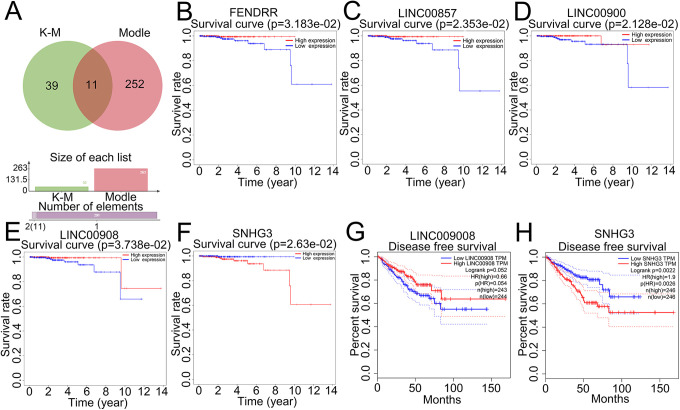
To further determine the relationship between cancer clinical traits and modular genes, we calculated the gene significance (GS) of individual genes with cancer trait, and the correlation between the gene and the trait module membership (MM). The Turquoise module contained 885 PCGs and 263 lncRNAs (Supplemental Table 1), and the GS vs MM was 0.43 with an extremely low p-value (Figure 5A). The KEGG pathway analyses of the PCGs in this module are shown in Figure 6A. According to the value of MM, 47 core genes with MM >0.9 can be screened. Arranging these PCGs according to the MM resulted in a ring, and the distance from the circle to the center was the measure of their correlation (Figure 5B). The main pathways and functions of the core PCGs are shown in Figure 6B and C. There was considerable overlap with the functions of the Turquoise module genes. The K-M survival analysis further identified 50 DElncRNAs that were significantly correlated to the OS (Supplemental Table 2). Eleven key lncRNAs were obtained by crossing the module lncRNAs with the clinically significant lncRNAs (Figure 7A). Six of the 11 key lncRNAs are newly discovered and not well characterized. In order to eliminate the genes with high correlation and overlapping information in the results, we carried out robustness analysis according to AIC value, and finally screened out 5 lncRNAs for subsequent analysis.
Figure 5.
A, GS vs MM in Turquoise Module. B, 47 core PCGs identified in Turquoise module.
Figure 6.
A, GO enrichment analysis of all PCGs in Turquoise module. B, KEGG enrichment analysis of all PCGs in Turquoise module. C, GO enrichment analysis of the 47 core PCGs. D, KEGG enrichment analysis of the 47 core PCGs.
Figure 7.
The Venn diagram of module lncRNAs and lncRNAs with statistical significance in K-M analysis (A). Kaplan–Meier analysis of 5 lncRNAs (B-F).
Construction of a Core lncRNA-PCG Network
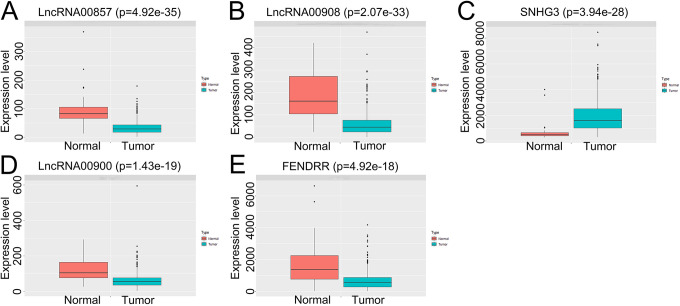
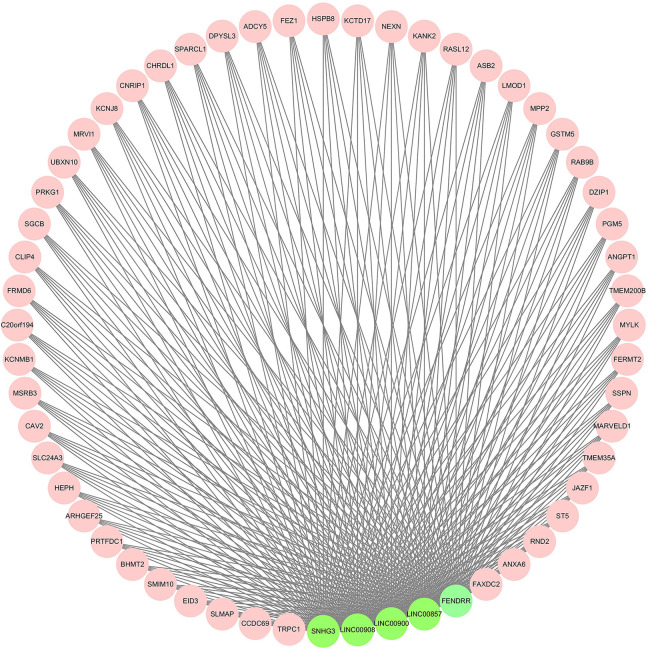
The association between the lncRNA expression levels and patient survival is shown Figure 7B-F. SNHG3 and lncRNA00908 levels were significantly associated with the RFS (Figure 7G and H). The expression of 5 key lncRNAs were validated on TCGA datasets with statistical significance (Figure 8A-E). The network of 47 PCGs and 5 lncRNAs (Figure 9) consists of 52 nodes and 255 edges, and the hub nodes indicated a major regulatory role of the corresponding lncRNAs and PCGs in PCa.
Figure 8.
The expression level of 5 lncRNAs in tumor and normal specimens from GEPIA.
Figure 9.
Network of 5 lncRNAs (green) and 47 core PCGs (MM > 0.9) (pink) in the Turquoise module.
Establishment of a Prognostic lncRNA Signature
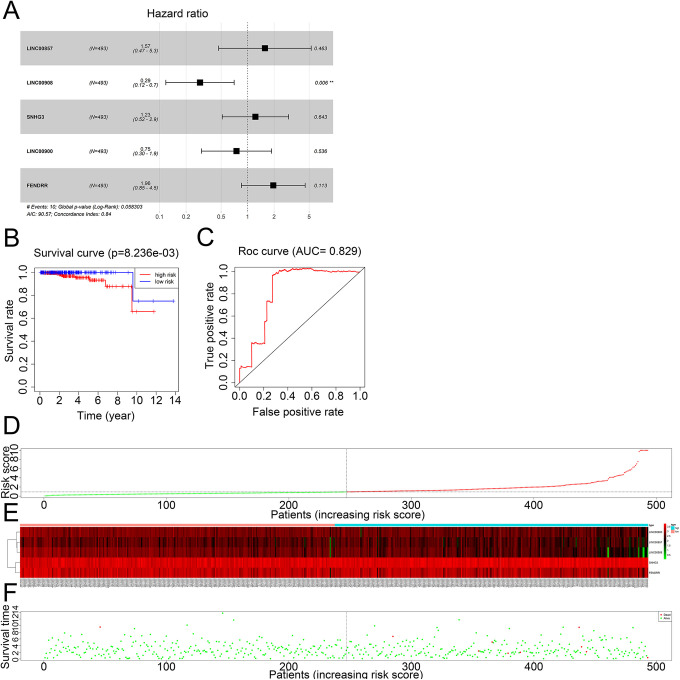
Multivariable Cox regression analysis identified LINC00857, LINC00900, LINC00908, LINC00900, SNHG3 and FENDRR as prognostically relevant in PCa. While LINC00857, FENDRR and SNHG3 were positively correlated, the remaining 4 showed negative correlation with prognosis. Based on the expression levels and regression coefficients, the prognostic risk score formula was calculated as follows: (0.453738256 ∗ expression level of LINC00857) − (1.24500487 ∗ expression level of LINC00908) − (0.289510446 ∗ expression level of LINC00900) + (0.204942803 ∗ expression level of FENDRR) + (0.672549074 ∗ expression level of SNHG3). The risk scores were calculated for all patients that were then stratified into the high-risk group (n = 246) and low-risk group (n = 247) according to the median risk score (Figure 10A). The distribution of risk scores and survival status of the patients are shown, which indicate a significant association of high-risk score with worse OS (Figure 10D-F). Indeed, Kaplan Meir analysis confirmed that the high-risk group had a worse OS compared to the low-risk group (P < 0.01; Figure 10B). Furthermore, the area under the curve (AUC) of the ROC for 14-year OS was 0.829, indicating high prognosis accuracy of the integrated 6-lncRNA signature in PCa (Figure 10C). The C-index was 0.84 (95% CI: 0.89–0.99), which pointed to a high predictive value as well.
Figure 10.
Identification of key survival-related lncRNAs. A, Hazard ratio and risk score distribution of the 5 lncRNAs. B, Kaplan–Meier curve of the overall survival (OS) between the low-risk and high-risk groups. C, Time-dependent receiver operating characteristic (ROC) analysis for the 14-year OS. D, The risk score distribution of 5 lncRNAs. E, Expression heatmap of 5 lncRNAs in the low-risk and high-risk groups. F, The overall survival status of 493 PCa patients. The prognostic value of the 5-lncRNA signature.
Discussion
LncRNAs control various aspects of PCa progression, such as tumor cell proliferation, cell cycle, apoptosis, local infiltration and distant metastasis. Since lncRNAs are less conserved than mRNAs and susceptible to evolutionary pressures, there is considerable variation in terms of their tissue-specific expression, splicing and expression levels, which greatly influence their biological function.12 Nevertheless, lncRNAs have several inherent advantages as tumor markers: (1) they can be easily detected in body fluids like serum, gastric juices and urine, such as the FDA-approved urine PCA3 marker for diagnosing PCa, (2) the changes in lncRNA expression levels reflect tumor dynamics, and (3) the tissue-specificity of lncRNAs makes it possible to distinguish different tumors. Multiple biomarkers have greater predictive accuracy compared to single biomarkers. Accordingly, we constructed a prognostic risk signature of PCa using FENDRR, LINC00900, LINC00908, SNHG3 and LINC00857 and the predictive value of this novel signature was validated in TCGA patient cohort, wherein higher risk scores correlated to worse OS. Furthermore, time-dependent ROC analysis confirmed high predictive accuracy of the 5lncRNA biomarker in PCa. Some of these lncRNAs have been previously associated with PCa progression.
SNHG3 is a member of the SNHGs family and highly expressed in liver, breast,13,14 lung,15 colorectal,16 and glioma tumors.17 Studies show that SNHG3 overexpression correlates positively with HCC malignancy, and promotes lipid accumulation in the HCC cells.18 It also regulates metabolism-related miRNAs and eif4a in ovarian cancer.19 Xuan and Wang showed that SNHG3 deficiency in gastric cancer cells significantly inhibited their proliferation in vitro, and xenograft growth in vivo.20 Peng-Fei Z et al. found that SNHG3 sponged mir-128 and up-regulated its target gene CD151, which promotes HCC progression.18 High expression of SNHG3 predicts poor prognosis and is positively correlated with clinic pathologic parameter in HCC. In this study, we found that SNHG3 was negatively correlated with the RFS and OS of PCa patients, indicating that it is a risk factor for PCa. LncRNA00908 was also identified as a risk factor for both OS and RFS. A previous study showed that Linc00908 interacts with and stabilizes sox-4, which promotes the migration and survival of HCC cells. It is also related to the tumor stage, tumor size and metastasis of HCC.21
FENDRR was first discovered in mouse post-mesoderm as the regulator of cardiac development and body wall structure.22 It is also expressed in several cancers, and regulates tumor invasion and metastasis. He et al found that FENDRR was significantly downregulated in gastric cancer tissues and cell lines compared to the normal tissues/cells, and associated with higher stage, deeper invasion and greater metastasis.23 Mechanistically, FENDRR enhanced the migration and invasion of gastric cancer cells by downregulating fibronectin 1 and MMP2 / MMP9, indicating its potential as a prognostic marker and therapeutic target.24 Gene chip analysis of non-small cell lung cancer (NSCLC) and paired normal tissues showed that FENDRR expression was significantly lower in the tumors, and ectopic expression of FENDRR reduced the migration and invasion of NSCLC cells and induced apoptosis.25
LINC00857 is significantly overexpressed in bladder carcinoma,26 lung adenocarcinoma27 and gastric carcinoma,28 and downregulated in prostate carcinoma and renal carcinoma. Dudek AM et al. found that high expression of LINC00857 correlated to shorter recurrence-free and overall survival, and recalcitrance to platinum-based chemotherapy in MIBC patients.26 Compared to the other key lncRNAs, only one study has reported lncRNA00900, where in it was identified as an oncogene in primary glioblastoma.29
To summarize, we established a 5-lncRNA prognostic biomarker in PCa to identify the high or low risk patients. The accuracy and reliability of this integrated biomarker was also confirmed by the risk score, survival status, and risk heatmap. Functionally, the key lncRNAs as well as their co-expressed PCGs in the same module were associated with multiple PCa-related pathways. Nevertheless, this predictive model is based on bioinformatics analysis, and will have to be validated by further experimental studies in order to establish its clinical utility.
Supplemental Material
Supplemental Material, Supplementary_2 for Five lncRNAs Associated With Prostate Cancer Prognosis Identified by Coexpression Network Analysis by Xiaoyong Gong and Bobin Ning in Technology in Cancer Research & Treatment
Supplemental Material, Supplementary_TABLE_1_2 for Five lncRNAs Associated With Prostate Cancer Prognosis Identified by Coexpression Network Analysis by Xiaoyong Gong and Bobin Ning in Technology in Cancer Research & Treatment
Footnotes
Declaration of Conflicting Interests: The author(s) declared no potential conflicts of interest with respect to the research, authorship, and/or publication of this article.
Funding: The author(s) disclosed receipt of the following financial support for the research, authorship, and/or publication of this article: Subject Innovation Team of the Second Affiliated Hospital of Shaanxi University of Chinese Medicine (2020XKTD-B01).
ORCID iD: Bobin Ning  https://orcid.org/0000-0001-7692-5833
Supplemental Material: Supplemental material for this article is available online.
References
- 1. Center MM, Jemal A, Lortet-Tieulent J, et al. International variation in prostate cancer incidence and mortality rates. Eur Urol. 2012;61(6):1079–1092. [DOI] [PubMed] [Google Scholar]
- 2. Hori T, Nguyen JH, Ogura Y, et al. Comprehensive and innovative techniques for liver transplantation in rats: a surgical guide. World J Gastroenterol. 2010;16(25):3120–3132. [DOI] [PMC free article] [PubMed] [Google Scholar]
- 3. Wong MC, Goggins WB, Wang HH, et al. Global incidence and mortality for prostate cancer: analysis of temporal patterns and trends in 36 countries. Eur Urol. 2016;70(5):862–874. [DOI] [PubMed] [Google Scholar]
- 4. Caley DP, Pink RC, Trujillano D, Carter DR. Long noncoding RNAs, chromatin, and development. Scientific World J. 2010;10:90–102. [DOI] [PMC free article] [PubMed] [Google Scholar]
- 5. Moran VA, Perera RJ, Khalil AM. Emerging functional and mechanistic paradigms of mammalian long non-coding RNAs. Nucleic Acids Res. 2012;40(14):6391–6400. [DOI] [PMC free article] [PubMed] [Google Scholar]
- 6. Wang KC, Chang HY. Molecular mechanisms of long noncoding RNAs. Mol Cell. 2011;43(6):904–914. [DOI] [PMC free article] [PubMed] [Google Scholar]
- 7. Li C, Yang L, Lin C. Long noncoding RNAs in prostate cancer: mechanisms and applications. Mol Cell Oncol. 2014;1(3):e963469. [DOI] [PMC free article] [PubMed] [Google Scholar]
- 8. Merola R, Tomao L, Antenucci A, et al. PCA3 in prostate cancer and tumor aggressiveness detection on 407 high-risk patients: a national cancer institute experience. J Exp Clin Cancer Res. 2015;34(1):15. [DOI] [PMC free article] [PubMed] [Google Scholar]
- 9. Prensner JR, Chen W, Han S, et al. The Long Non-Coding RNA PCAT-1 promotes Prostate Cancer Cell Proliferation through cMyc. Neoplasia. 2014;16(11):900–908. [DOI] [PMC free article] [PubMed] [Google Scholar]
- 10. Xie X, Dai J, Huang X, Fang C, He W. MicroRNA-145 inhibits proliferation and induces apoptosis in human prostate carcinoma by upregulating long non-coding RNA GAS5. Oncol Lett. 2019;18(2):1043–1048. [DOI] [PMC free article] [PubMed] [Google Scholar]
- 11. Langfelder P, Horvath S. WGCNA: an R package for weighted correlation network analysis. BMC Bioinformatics. 2008;9:559. [DOI] [PMC free article] [PubMed] [Google Scholar]
- 12. Lipovich L, Johnson R, Lin CY. MacroRNA underdogs in a microRNA world: evolutionary, regulatory, and biomedical significance of mammalian long non-protein-coding RNA. Biochim Biophys Acta. 2010;1799(9):597–615. [DOI] [PubMed] [Google Scholar]
- 13. Li Y, Zhao Z, Liu W, Li X. SNHG3 functions as miRNA sponge to promote breast cancer cells growth through the metabolic reprogramming. Appl Biochem Biotechnol. 2020;191(3):1084–1099. [DOI] [PMC free article] [PubMed] [Google Scholar]
- 14. Taherian-Esfahani Z, Taheri M, Dashti S, Kholghi-Oskooei V, Geranpayeh L, Ghafouri-Fard S. Assessment of the expression pattern of mTOR-associated lncRNAs and their genomic variants in the patients with breast cancer. J Cell Physiol. 2019;234(12):22044–22056. [DOI] [PubMed] [Google Scholar]
- 15. Shi J, Li J, Yang S, et al. LncRNA SNHG3 is activated by E2F1 and promotes proliferation and migration of non-small–cell lung cancer cells through activating TGF-β pathway and IL/JAK2/STAT3 pathway. J Cell Physiol. 2020;235(3):2891–2900. [DOI] [PubMed] [Google Scholar]
- 16. Huang W, Tian Y, Dong S, Cha Y, Yuan X. The long non-coding RNA SNHG3 functions as a competing endogenous RNA to promote malignant development of colorectal cancer. Oncol Rep. 2017;38(3):1402–1410. [DOI] [PMC free article] [PubMed] [Google Scholar]
- 17. Fan F, Yongsheng H, Sen H, et al. LncRNA SNHG3 enhances the malignant progress of glioma through silencing KLF2 and p21. Biosci Rep. 2018;38(5):BSR20180420. [DOI] [PMC free article] [PubMed] [Google Scholar] [Retracted]
- 18. Peng-Fei Z, Fei W, Jing W, et al. LncRNA SNHG3 induces EMT and sorafenib resistance by modulating the miR-128/CD151 pathway in hepatocellular carcinoma. J Cell Physiol. 2019;234(3):2788–2794. [DOI] [PubMed] [Google Scholar]
- 19. Na L, Xiaohan Z, Xianquan Z. The lncRNA SNHG3 regulates energy metabolism of ovarian cancer by an analysis of mitochondrial proteomes. Gynecol Oncol. 2018;150(2):343–354. [DOI] [PubMed] [Google Scholar]
- 20. Xuan Y, Wang Y. Long non-coding RNA SNHG3 promotes progression of gastric cancer by regulating neighboring MED18 gene methylation. Cell Death Dis. 2019;10(10):694. [DOI] [PMC free article] [PubMed] [Google Scholar]
- 21. Hu X, Li Q, Zhang J. The long noncoding RNA LINC00908 facilitates hepatocellular carcinoma progression via interaction with Sox-4. Cancer Manag Res. 2019;11:8789–8797. [DOI] [PMC free article] [PubMed] [Google Scholar] [Retracted]
- 22. Grote P, Herrmann BG. The long non-coding RNA Fendrr links epigenetic control mechanisms to gene regulatory networks in mammalian embryogenesis. RNA Biol. 2013;10(10):1579–1585. [DOI] [PMC free article] [PubMed] [Google Scholar]
- 23. He Z, Wang X, Huang C, et al. The FENDRR/miR-214-3P/TET2 axis affects cell malignant activity via RASSF1A methylation in gastric cancer. Am J Transl Res. 2018;10(10):3211–3223. [PMC free article] [PubMed] [Google Scholar]
- 24. Xu T, Huang MD, Xia R, Liu X, Shu Y. Decreased expression of the long non-coding RNA. J Hematol Oncol. 2014;7(1):63. [DOI] [PMC free article] [PubMed] [Google Scholar]
- 25. Zhang MY, Zhang ZL, Cui HX, Wang RK, Fu L. Long non-coding RNA FENDRR inhibits NSCLC cell growth and aggressiveness by sponging miR-761. Eur Rev Med Pharmacol Sci. 2018;22(23):8324-8332. [DOI] [PubMed] [Google Scholar]
- 26. Dudek AM, Van JK, Witjes JA, Kiemeney L, Verhaegh GW. LINC00857 expression predicts and mediates the response to platinum-based chemotherapy in muscle-invasive bladder cancer. Cancer Med. 2018;7(7):3342–3350. [DOI] [PMC free article] [PubMed] [Google Scholar]
- 27. Wang L, Cao L, Wen C, Li J, Yu G, Liu C. LncRNA LINC00857 regulates lung adenocarcinoma progression, apoptosis and glycolysis by targeting miR-1179/SPAG5 axis. Hum Cell. 2020;33(1):195–204. [DOI] [PubMed] [Google Scholar]
- 28. Zhang K, Shi H, Xi H, et al. Genome-wide lncRNA microarray profiling identifies novel circulating lncRNAs for detection of gastric cancer. Theranostics. 2017;7(1):213–227. [DOI] [PMC free article] [PubMed] [Google Scholar]
- 29. Wang W, Li J, Lin F, Guo J, Zhao J. Identification of N6-methyladenosine-related lncRNAs for patients with primary glioblastoma [published online January 14, 2020]. Neurosurg Rev. 2020. [DOI] [PubMed] [Google Scholar]
Associated Data
This section collects any data citations, data availability statements, or supplementary materials included in this article.
Supplementary Materials
Supplemental Material, Supplementary_2 for Five lncRNAs Associated With Prostate Cancer Prognosis Identified by Coexpression Network Analysis by Xiaoyong Gong and Bobin Ning in Technology in Cancer Research & Treatment
Supplemental Material, Supplementary_TABLE_1_2 for Five lncRNAs Associated With Prostate Cancer Prognosis Identified by Coexpression Network Analysis by Xiaoyong Gong and Bobin Ning in Technology in Cancer Research & Treatment


