Abstract
Background/Aims
The gut microbiota regulates intestinal immune homeostasis through host-microbiota interactions. Multiple factors affect the gut microbiota, including age, sex, diet, and use of drugs. In addition, information on gut microbiota differs depending on the samples. The aim of this study is to investigate whether changes in cecal microbiota depend on aging.
Methods
Gut microbiota in cecal contents of 6-, 31-, and 74-week-old and 2-year-old male Fischer-344 rats (corresponding to 5-, 30-, 60-, and 80-year-old humans in terms of age) were analyzed using 16S ribosomal RNA metagenome sequencing and phylogenetic investigation of communities by reconstruction of unobserved states (PICRUSt) based on the Kyoto Encyclopedia of Genes and Genomes orthology. Moreover, short-chain fatty acid (SCFA) level in cecum and inflammation related factors were measured using real-time quantitative polymerase chain reaction and enzyme linked immunosorbent assay.
Results
Alpha and beta diversity did not change significantly with age. At the family level, Lachnospiraceae and Ruminococcaceae, which produce SCFAs, showed significant change in 31-week-old rats Lachnospiraceae significantly increased at 31 weeks of age, compared to other age groups, while Ruminococcaceae decreased. Butyrate levels in cecum were significantly increased in 31-week-old rats, and the expression of inflammation related genes was increased followed aging. Especially, EU622775_s and EU622773_s, which were highly abundance species in 31-week-old rats, showed significant relationship with butyrate concentration. Enzymes required for producing butyrate—acetyl-CoA transferase, butyryl-CoA dehydrogenase, and butyrate kinase—were not predicted by PICRUSt.
Conclusions
Major bacterial taxa in the cecal lumen, such as Lachnospiraceae, well-known SCFAs-producing family, changed in 31-week-old rats. Moreover, unknown species EU622775_s and EU622773_s showed strong association with cecal butyrate level at 31 weeks of age.
Keywords: Aging, Butyrate, Cecum, Microbiota, Rats
Introduction
The gut microbiota plays an important role in maintaining homeostasis of host gastrointestinal (GI) health. The microbial community helps maintain epithelial barrier function, assists in nutrient metabolism by fermenting non-digestible carbohydrates, protects against pathogens, and promotes the host immune system through immunomodulation.1,2 Most human microbiota research has been performed using fecal samples because of the difficulties in obtaining samples in humans. Thus, animal models have been used to study microbiota depending on anatomical regions of the gut, variable diets of the host, and different genetic backgrounds of the host,3 and the profiles of microbiota in the GI tracts of young healthy rats have been well established.4,5
Aging affects physiologic, genetic, immunologic, and metabolic changes. Over time, accumulation of mutations disrupts homeostasis, resulting in various chronic diseases, including cancer and inflammatory diseases. Various microorganisms colonize the GI tract starting at birth; its composition changes by puberty and with aging, and regulates host health,6,7 causing changes in gut permeability, motility, digestive ability, and immune strength.8
Nowadays, the production of various metabolites of the gut microbiota has been known to be very important in addition to the microbiota itself.9 The most famous metabolites are short-chain fatty acids (SCFAs; acetate [C2], propionate [C3], and butyrate [C4]) which are mainly produced in the cecum,10 and exhibit anti-inflammatory properties.11 Among SCFAs, butyrate is known to be an energy supplement and a modulator of the immune system, which is involved in maintaining intestinal epithelial integrity.12 Families belonging to Firmicutes are the primary representative taxa as a butyrate-producing taxon.13
Previously, we found major regional distinctions of microbiota between ileum and cecum of old rats,14 and a high-fat diet influenced the rat fecal microbiota depending on age (6 weeks and 2 years, corresponding to 5- and 80-year-old humans, respectively) and sex.15 Furthermore, long-term administration of proton pump inhibitors altered the gut microbiota and butyrate levels in old rats.16 As SCFAs are mainly produced in the cecum,10 we hypothesized that the microbiota in the cecal content could clearly show the aging-dependent change in terms of SCFA instead of stool. The aim of this study is to compare the gut microbiota in rat cecum, pertaining to differences in SCFAs from young to old aged rats.
Materials and Methods
Animals and Sample Collection
Fischer-344 (F344) male rats, aged 6-, 31-, and 74-week-old and 2-year-old, were used (n = 7-9 in each group) (OrientBio, Seongnam, Korea). Animals were housed in a specific-pathogen-free room at 23°C with a 12-hour light-dark cycle and given unlimited access to food and water. Cecum samples were collected and stored at –80°C. Luminal contents of the cecum were collected by washing out the luminal part of each sample with phosphate-buffered saline. The study was performed following the procedures in the Guide for the Care and Use of Laboratory Animals in Korea, and all protocols used were approved by the Animal Management Committee of Seoul National University Bundang Hospital (Permission No. BA1304-127/033-01).
DNA Extraction, Polymerase Chain Reaction Amplification, Quantification, and Metagenome Sequencing of 16S Ribosomal RNA
Bacterial DNA was extracted from the cecum using a G-spin genomic DNA extraction kit (iNtRON Biotechnology, Seongnam, Korea). DNA quantity and quality were measured using the NanoDrop 1000 spectrophotometer (Thermo Fisher Scientific, Wilmington, DE, USA) and electrophoresed using 2% agarose gel. Firstly, the target gene, 16S ribosomal RNA V3-V4 region (preparation of MiSeq library amplicons), was amplified using the 341-F (5’-TCG TCG GCA GCG TCA GAT GTG TAT AAG AGA CAG CCT ACG GGN GGC WGC AG-3’) and 805-R (5’-GTC TCG TGG GCT CGG AGA TGT GTA TAA GAG ACA GGA CTA CHV GGG TAT CTA ATC C-3’) primers. Secondly, the V3-V4 polymerase chain reaction (PCR) amplicons were linked to Illumina indices and adapters from Nextera XT Index Kit (Illumina, San Diego, CA, USA). The PCR consisted of initial denaturation at 95°C for 3 minutes; denaturation at 94°C for 30 seconds, annealing at 63°C for 45 seconds, and extension at 72°C for 1 minute (35 cycles); and final extension at 72°C for 5 minutes. The second procedure of PCR amplification was as follows: 72°C for 3 minutes; 95°C for 30 seconds, 55°C for 30 seconds, and 72°C for 30 seconds (12 cycles); and 72°C for 5 minutes. Short DNA fragments were eliminated using the FavorPrep DNA purification kit (Favorgen, Pintung, Taiwan). To quantify the PCR amplicons, we used the Quant-iT PicoGreen dsDNA Assay Kit (Thermo Fisher Scientific). Lastly, pooling of 300 ng per sample was done, and the PCR products were purified with the FavorPrep DNA gel extraction kit (Favorgen). Sequencing was performed at Chunlab Inc (Seoul, Korea) using the MiSeq system (Illumina).
Metagenome Sequencing Data Analysis
Non-specific, non-target, and chimeric amplicons were removed in the quality control process to exclude reads with short lengths and low Q-values from the pre-filter. Using the operational taxonomic unit (OTU) information (number of OTUs and sequences in each OTU), alpha-diversity indices, such as abundance-based coverage estimator, Chao1, Jackknife, Shannon indices, Simpson indices, phylogenetic diversity, and Good’s library coverage, were analyzed using EzBioCloud (Chunlab, Inc). To visualize sample differences, principal coordinates analysis (PCoA) was performed with unweighted UniFrac. Averaged taxonomic compositions (at phylum and family level), bar charts, and selected taxa were created using GraphPad Prism (version 8.01; GraphPad Software, Inc, San Diego, CA, USA).
Phylogenetic Investigation of Communities by Reconstruction of Unobserved States
To predict the functional capabilities of the microbial community, we performed a phylogenetic investigation of the communities by reconstruction of unobserved states (PICRUSt). This analysis enabled us to infer alterations in functional markers of microbiota based on the Kyoto Encyclopedia of Genes and Genomes (KEGG) database.17 Enterotype stratification was identified in the ileum content samples using the ClusterSim function in R.18 The optimal number of clusters was determined by maximizing the value of the Calinski-Harabasz index.19
Linear Discriminant Analysis Effect Size (LEfSe) Analysis
Based on the relative taxonomic abundances, the taxonomic biomarker discovery and related statistical significance were assessed by the linear discriminant analysis effect size (LEfSe) method. The criteria for conducting the LEfSe analysis were as follows: (1) an alpha value for the factorial Kruskal-Wallis H test between assigned taxa compared to that of the groups with less than 0.05, (2) an alpha value for the pairwise Wilcoxon test among the taxonomic compositions of less than 0.05, (3) a threshold of the logarithmic Linear discriminant analysis score for discriminative features less than 2.0, and (4) a multi-class analysis set as all-against-all. After this process, we went further to simplify the LEfSe plot: (5) overlapped bacteria selection, (6) search and classify the bacterial characteristics with reference to reported papers: commensal bacteria, opportunistic pathogens, not characterized, and (7) elimination of non-overlapped bacteria only at “not characterized” bacteria. In LEfSe plot, all of commensal bacteria and opportunistic pathogens and only overlapped “not characterized” bacteria are included.
Measurements of Acetate and Butyrate Concentration
Contents of cecum were extracted as described previously and the concentration of acetate and butyrate in each extract was measured via high-performance liquid chromatography. Briefly, distilled water was added to 20-50 mg of cecal content to a final weight of 200 mg. Following incubation at 80°C for 15 minutes, each sample was centrifuged at 13 000 rpm for 10 minutes, after which the supernatant was filtered through a membrane filter (pore size 0.45 μm). Acetate and butyrate in each sample was then separated and measured using an Agilent 1100 series instrument (Agilent Technologies, Inc, Santa Clara, CA, USA) equipped with a C18 column (ZORBAX Eclipse XDB-C18, analytical 4.6 × 150 mm, 5-Micron; Agilent) and a UV detector (210 nm). The mobile phase consisted of 90% 10 mM KH2PO4 and 10% acetonitrile.
Enzyme-linked Immunosorbent Assay
The collected cecum tissue samples were homogenized in lysis buffer and centrifuged. The lysis buffer was composed of radioimmunoprecipitation assay buffer, proteinase inhibitor, and phosphatase inhibitor. The supernatant was used for analysis.
IL-6 concentration in the cecum tissue was detected through spectrophotometry using an IL-6 enzyme-linked immunosorbent assay (ELISA) kit (R&D Systems, Minneapolis, MN, USA) according to the manufacturer’s instructions.
Real-time Quantitative Polymerase Chain Reaction
Total RNAs were extracted from the cecal tissue using TRIzol reagent (Invitrogen, Carlsbad, CA, USA) as recommended by the manufacturer, and the collected RNA was purified using RNeasy mini kits (Qiagen, Valencia, CA, USA). Synthesis of cDNA was performed using 1 µg of total RNA with the High Capacity cDNA kit (Applied Biosystems, Foster City, CA, USA), according to the manufacturer’s instructions. The thermal cycling parameters for the reverse transcription were: 10 minutes at 25°C, 120 minutes at 37°C, and 5 minutes at 85°C. Real-time quantitative PCR (RT-qPCR) was performed in triplicates by using a StepOnePlus Real-time PCR (Applied Biosystems, Foster City, CA, USA) with SYBR Premix Ex Taq (Takara Bio, Shiga, Japan) according to manufacturers’ instructions and protocols. The gene expression of cyclooxygenase-2 (COX-2), inducible nitric oxide synthase (iNOS), TNF-α, and claudin-2 were measured by RT-qPCR using properly designed primer (Supplementary Table). Then, thermal cycling was performed as follows: initial denaturation at 95°C for 10 seconds, followed by 40 cycles of 95°C for 5 seconds and 60-65°C for 33 seconds. Expression levels of mRNA from the target genes were compared with endogenous control β-actin using the 2–ΔΔCt method.
Searching for Butyrate-producing Bacteria and Enzymes
The enzymes involved in butyric acid production were searched using KEGG (Kanehisa Laboratories). We searched for bacterial species that produce butyrate and enzymes that catalyze the reactions in the KEGG GENES database. For Sequence Similarity DataBase (SSDB) orthology search, results with an SW-score of up to 1200 and identity of up to 0.5 were used. From the results of KEGG (with defined criteria), amino acid sequences of enzymes involved in butyrate production were searched using NCBI protein-protein Basic Local Alignment Search Tool (BLASTp), to identify species producing these enzymes.20 Bacteria, such as Clostridium butyricum21 and Faecalibacterium prausnitzii,22 known to produce butyrate and enzymes, such as butyryl-CoA dehydrogenase and butyrate kinase, involved in the production of butyrate, were searched through KEGG and NCBI BLASTp.
Statistical Methods
Statistical calculations were performed using Predictive Analytics SoftWare Statistics version 18.0 (IBM Corp, Armonk, NY, USA). Groups were compared using the Kruskal-Wallis H test (an extension of the Mann-Whitney U test) and post hoc analysis using Mann-Whitney U test with Holm-Bonferroni correction. Correlation and regression analysis of the microbiome and SCFA data were conducted using Spearman’s rank correlation coefficient (also known as Spearman’s rho) and linear regression. Results with a P-value < 0.05 were considered statistically significant.
Results
Microbiota Diversity Associated With Rat Aging
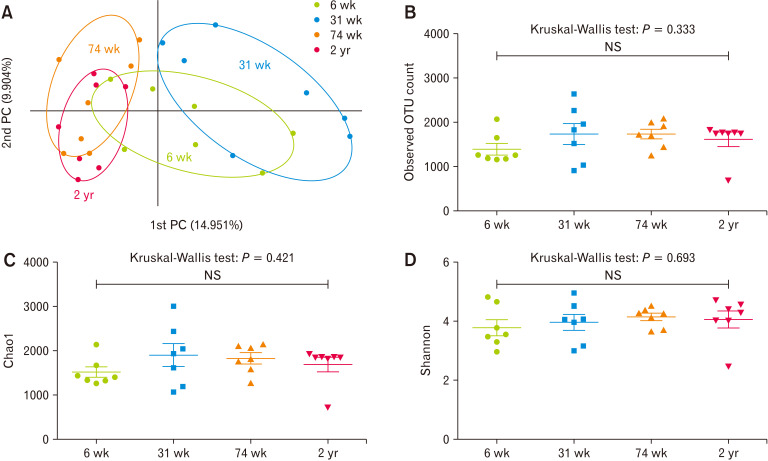
In PCoA analysis at the species level, the 31-week-old group was clearly distinct from the 74-week-old and 2-years-old groups; the 6-week-old group overlapped with the other 3 age groups (Fig. 1A). In contrast, the observed OTUs counts (Fig. 1B, P = 0.333) and the alpha-diversity indices, such as Chao1 (Fig. 1C, P = 0.421) and Shannon (Fig. 1D, P = 0.693), did not show statistical differences among the different age groups.
Figure 1.
Beta and alpha diversity of cecal microbiota of 6-week-old (6 wk), 31-week-old (31 wk), 74-week-old (74 wk), and 2-year-old (2 yr) rats. (A) Principal coordinates analysis (PCoA) of cecal microbiota depending on the age of the rats. x-axis: 1st PC, percent variation explained 14.951%; y-axis: 2nd PC, percent variation explained 9.904%. (B-D) Comparison of the alpha diversity index of the cecal microbiota at different ages; (B) the observed operational taxonomic unit (OTU) count, (C) Chao 1, and (D) Shannon index. NS, not significant.
Taxonomic Composition of Cecal Microbiota
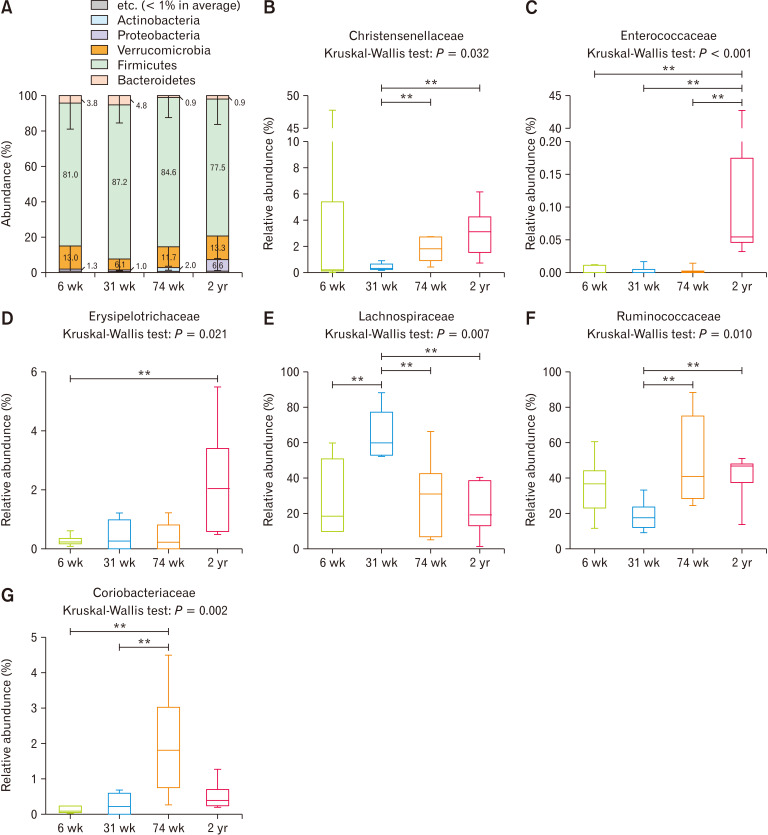
Firmicutes was the most predominant phylum in the cecum in all age groups; its abundance was the highest at 31 weeks of age and the lowest at 2 years of age, but there was no statistical difference (Fig. 2A, P = 0.544). The proportion of Bacteroidetes was slightly higher at 6 and 31 weeks of age than at 74 weeks and 2 years of age, albeit without statistical difference (Fig. 2A, P = 0.400). At the family level, Christensenellaceae (Fig. 2B, P = 0.032 to Kruskal-Wallis test; 31-week-old vs 74-week-old: P = 0.004; 31-week-old vs. 2-year-old: P = 0.003), Enterococcaceae (Fig. 2C, P < 0.001 to Kruskal-Wallis test; 6-week-old vs 2-year-old: P = 0.002; 31-week-old vs 2-year-old: P = 0.002; 74-week-old vs 2-year-old: P = 0.001), and Erysipelotrichaceae (Fig. 2D, P = 0.021 to Kruskal-Wallis test; 6-week-old vs 2-year-old: P = 0.003) were enriched significantly with aging, and all of them belonged to the Firmicutes phylum. On the other hand, Lachnospiraceae (Fig. 2E, P = 0.007 to Kruskal-Wallis test; 6-week-old vs 31-week-old: P = 0.009; 31-week-old vs 74-week-old: P = 0.009; 31-week-old vs 2-year-old: P = 0.002) and Ruminococcaceae (Fig. 2F, P = 0.010 to Kruskal-Wallis test; 31-week-old vs 74-week-old: P = 0.004; 31-week-old vs 2-year-old: P = 0.009 increased and decreased significantly compared to the other age groups, respectively, at 31 weeks of age. Coriobacteriaceae, which belongs to the phylum Actinobacteria, increased significantly at the 74-week-old (Fig. 2G, P = 0.002 to Kruskal-Wallis test; 6-week-old vs 74-week-old: P = 0.002; 31-week-old vs 74-week-old: P = 0.006).
Figure 2.
The compositional characteristics of cecal microbiota vary with age at the (A) phylum level, and at the (B-G) family level. **P < 0.01 from Mann-Whitney U test with Holm-Bonferroni correction as post hoc analysis followed by Kruskal-Wallis test. 6 wk, 6-week-old; 31 wk, 31-week-old; 74 wk, 74-week-old; 2 yr, 2-year-old.
Influence of Aging on Gut Microbiome Composition
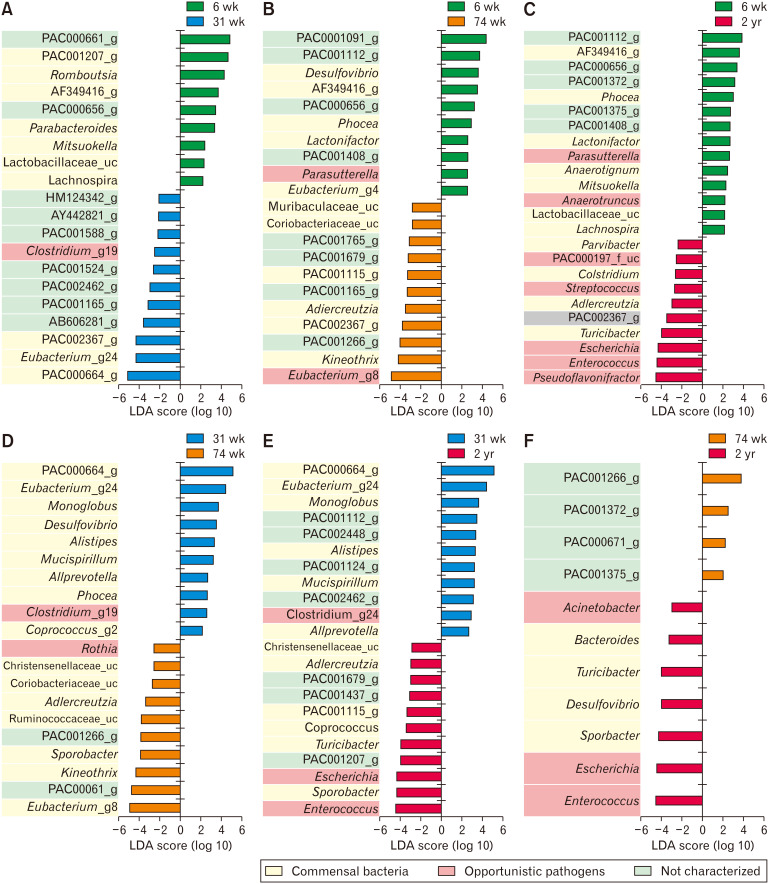
In the LEfSe analysis (Fig. 3), 6-week-old rats, the abundance of PAC000661_g (Oscillospiraceae), PAC001207_g (Christensenellaceae), and Romboutsia (Peptostreptococcaceae) increased in comparison to that in 31-week-old rats (Fig. 3A). In contrast, the abundance of PAC000664_g, Eubacterium_g24, and PAC002367_g (Lachnospiraceae) decreased in comparison to that in 31-week-old rats (Fig. 3A). The abundance of PAC001112_g (Muribaculaceae), AF349416_g (Lachnospiraceae), and Phocea (Ruminococcaceae) of the 6-week-old increased in comparison to that of the 74-week-old (Fig. 3B) and 2-year-old rats (Fig. 3C). In contrast, Eubacterium_g8, Kineothrix, and PAC001266_g, in 6-week-old rats, decreased in comparison to that of 74-week-old rats (Fig. 3B) and Pseudoflavonifractor (Ruminococcaceae), Enterococcus (Enterococcaceae), and Escherichia (Enterobacteriaceae) decreased in comparison to that of 2-year-old rats (Fig. 3C).
Figure 3.
Linear discriminant analysis effect size (LEfSe) analysis results comparing 2 age groups (A-F). (G) The ratio of commensal to opportunistic pathogens calculated from LEfSe results. The 6- and 31-week-old groups showed a higher ratio steadily than the other age groups. 6 wk, 6-week-old; 31 wk, 31-week-old; 74 wk, 74-week-old; 2 yr, 2-year-old. LDA, linear discriminant analysis; NC, not characterized.
In the 31-week-old group, the abundance of PAC000664_g, Eubacterium_g24 (Lachnospiraceae), and Monoglobus (Ruminococcaceae) increased in comparison to that in 74-week-old (Fig. 3D) and 2-year-old rats (Fig. 3E). Eubacterium_g8, PAC000661_g, and Kineothrix decreased in comparison to that in 74-week-old (Fig. 3D), and Enterococcus, Sporobacter (Ruminococcaceae), and Escherichia coli decreased in comparison to that in 2-year-old rats (Fig. 3E).
In the 74-week-old group, the abundance of PAC001266_g (Coriobacteriaceae) increased and the abundance of Enterococcus, Escherichia, and Sporobacter decreased in comparison to that in the 2-year-old group (Fig. 3F). The ratio of commensal to opportunistic pathogens was calculated from LEfSe results; the 6- and 31-week-old groups showed higher ratio than the older groups (Fig. 3G).
Enterotypes of the Microbiomes
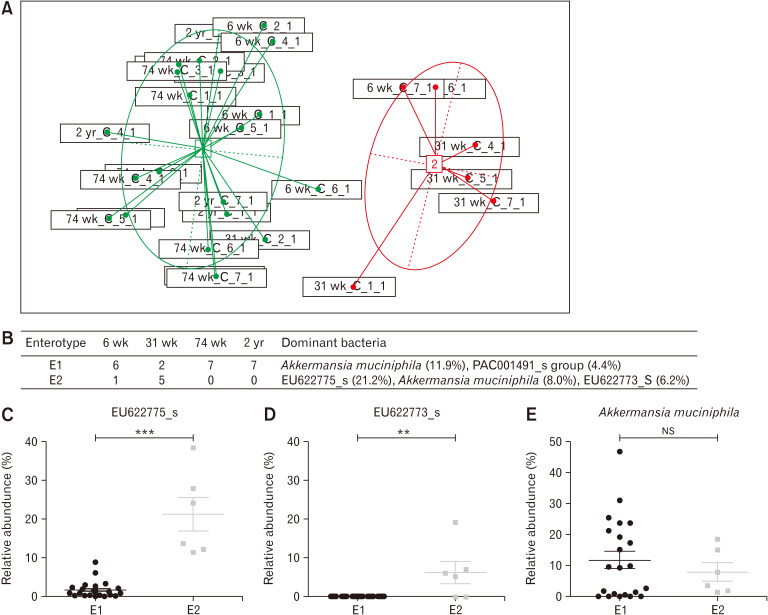
As the Calinski-Harabasz index was maximized when cluster number was 2 (Supplementary Figure), 4 groups of samples were clustered into 2 enterotypes (Fig. 4A). Enterotype 1 (E1) was composed of six 6-week-old samples, two 31-week-old samples, seven 74-week-old samples, and seven 2-year-old samples , whereas enterotype 2 (E2) comprised one 6-week-old sample and five 31-week-old samples (Fig. 4B). At the species level, E1 comprised Akkermansia muciniphila (11.9%) and PAC001491_s group (4.4%), while E2 comprised EU622775_s (21.2%), A. muciniphila (8.0%), and EU622773_s (6.2%) (Fig. 4B). In E2, EU622775_s (Fig. 4C, P < 0.001) and EU622773_s (Fig. 4D, P = 0.003) showed a significant difference compared to E1, but there was no difference in the case of A. muciniphila (Fig. 4E, P = 0.933).
Figure 4.
Enterotypes in the cecal microbiota. (A) Principal coordinates analysis (PCoA) separated the 2 enterotypes. (B) Dominant bacteria and their abundance in each enterotype at family level. In enterotype 2 (E2), EU622775_s (C), and EU622773_s (D) showed a significant difference compared to enterotype 1 (E1) but there was no difference in the case of Akkermansia muciniphila (E). **P < 0.01, ***P < 0.001 from Mann-Whitney U test. 6 wk, 6-week-old; 31 wk, 31-week-old; 74 wk, 74-week-old; 2 yr, 2-year-old. NS, not significant.
Short-chain Fatty Acid Levels and Related Factors in Cecum
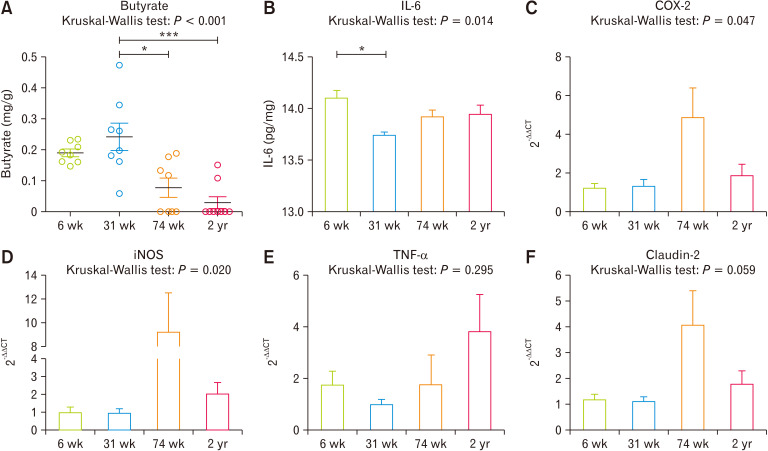
When we measured SCFAs levels from cecal contents ((Table and Fig. 5A), 31-week-old rats showed significantly high concentration compared with 74 weeks (P = 0.008) and 2 years (P < 0.001) of age. We also measured interleukin-6 (IL-6) (Fig. 5B), showed a significant decrease at the 31-week-old rats compared to 6-week-old rats (P = 0.007). Moreover, gene expressions of COX-2, iNOS, TNF-α, and claudin-2 showed increasing tendency followed by aging (Fig. 5C-F).
Table.
Short-chain Fatty Acids Levels in Cecal Contents
| Age | n | Acetate (mg/g) | Butyrate (mg/g) |
|---|---|---|---|
| 6 wk | 9 | 7.06 ± 0.48 | 0.23 ± 0.04 |
| 31 wk | 8 | 5.00 ± 0.84 | 0.24 ± 0.04 |
| 74 wk | 8 | 3.02 ± 0.70 | 0.08 ± 0.03 |
| 2 yr | 9 | 6.08 ± 2.28 | 0.03 ± 0.02 |
Short-chain fatty acids concentration expressed as mean ± SEM.
Figure 5.
Cecum luminal butyrate concentration (A), IL-6 (B), and gene related with inflammation transcriptional expression such as cyclooxygenase-2 (COX-2) (C), inducible nitric oxide synthase (iNOS) (D), TNF-α (E), and claudin-2 (F) were compared. *P < 0.05, ***P < 0.001 from Mann-Whitney U test with Holm-Bonferroni correction as post hoc analysis followed by Kruskal-Wallis test. 6 wk, 6-week-old; 31 wk, 31-week-old; 74 wk, 74-week-old; 2 yr, 2-year-old.
Correlation Between Butyrate Concentration and Cecum Microbiota
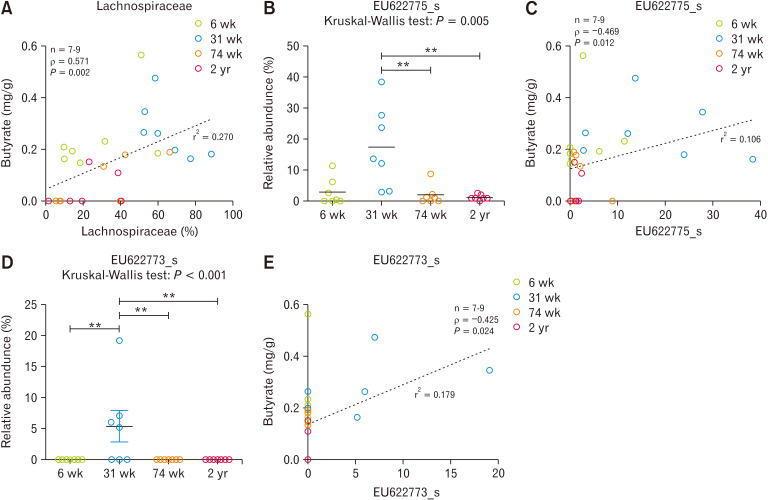
Lachnospiraceae showed positive correlation with butyrate concentration in cecum (Spearman’s rho = 0.571, P = 0.002) (Fig. 6A). The abundance ratios of EU622775_s and EU622773_s species which were significantly high in E2 where most of 31-week-old rats were included also showed significantly positive correlation with butyrate concentration (EU622775_s, Spearman’s rho = 0.469, P = 0.012; EU622773_s, Spearman’s rho = 0.425, P = 0.024) (Fig. 6B-E).
Figure 6.
The correlation analysis between luminal butyrate concentration and compositional change of microbiota in cecum. (A) Lachnospiraceae, (B-C) EU622775_s, and (D-E) EU622773_s. **P < 0.01 from Mann-Whitney U test with Holm-Bonferroni correction as post hoc analysis followed by Kruskal-Wallis test. Dotted line indicates linear regression. 6 wk, 6-week-old; 31 wk, 31-week-old; 74 wk, 74-week-old; 2 yr, 2-year-old.
Short-chain Fatty Acid–producing Bacteria in Microbiomes
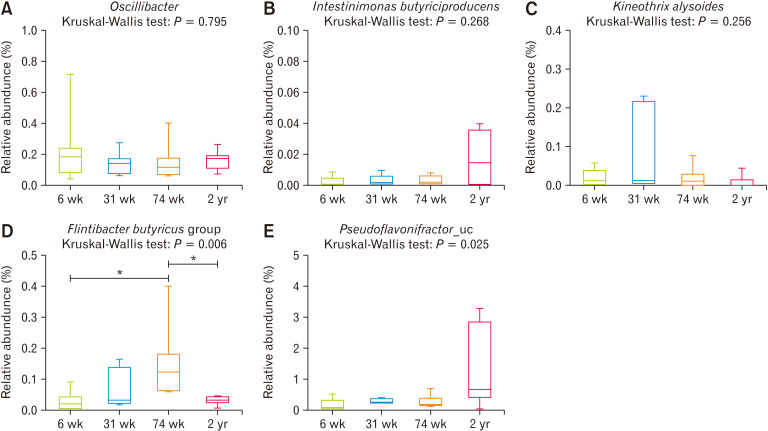
Oscillibacter species was matched with F. prausnitzii (butyryl-CoA dehydrogenase), with a score of 1447 and 73% identity, and C. butyricum (butyryl-CoA dehydrogenase) with a score of 1392 and 69% identity (Fig. 7A). Intestinimonas butyriciproducens was matched with C. butyricum with a score of 1263 and 64% identity, F. prausnitzii with a score of 1245 and 62% identity (Fig. 7B). Kineothrix alysoides was matched with C. butyricum (butyrate kinase enzyme) with a score of 1229 and 64% identity (Fig. 7C). The Flintibacter butyricus group was matched with F. prausnitzii with a score of 1403 and 70% identity (Fig. 7D). Pseudoflavonifractor_uc was matched with C. butyricum with a score of 1338 and 66% identity, and F. prausnitzii with a score of 1552 and 75% identity (Fig. 7E). Thus, most of the strains were found to have a relative abundance of 0 (data not shown) or represented a very small part of the microbiome.
Figure 7.
Relative abundance of known butyrate-producing bacteria based on the Kyoto Encyclopedia of Genes and Genomes (KEGG) and NCBI BLASTp, above a score of 1200 and 50% identity. (A) Oscillibacter species, (B) Intestinimonas butyriciproducens, (C) Kineothrix alysoides, (D) Flintibacter butyricus group, and (E) Pseudoflavonifractor_uc. *P < 0.05 from Mann-Whitney U test with Holm-Bonferroni correction as post hoc analysis followed by Kruskal-Wallis test. 6 wk, 6-week-old; 31 wk, 31-week-old; 74 wk, 74-week-old; 2 yr, 2-year-old.
Discussion
Host-aging changes the diversity and taxonomic composition of commensal bacteria in the gut. In this study, a compositional difference was noticeable in the cecal microbiota of 31-week-old rats: the separated shape of microbiota in PCoA plots, the high abundance of Firmicutes, and higher abundance of Lachnospiraceae. When we measured the concentration of butyrate which is known to have anti-inflammatory and anti-cancer effects in cecal contents, the 31-week-old group showed significantly high concentrations.12,23,24 Moreover, the level of IL-6, known as decreasing by the administration of butyrate,25 showed similar tendency with cecal butyrate levels. Furthermore, expression of other inflammation-related genes, COX-2, iNOS, TNF-α, and Claudin-2, tight junction protein related to epithelial integrity, also showed decreasing tendency in the 31-week-old group which maybe the result of increased butyrate concentration.
As we observed the relationship between butyrate concentration and inflammatory gene expression, we tried to find actual bacterial strains that were related with butyrate concentrations. At the family level, Lachnospiraceae showed positive correlation with butyrate concentrations in the cecum, which is in accordance with results of other studies investigated butyrate producer.13,26,27 Interestingly, at the species level, EU622775_s and EU622773_s unknown species which belong to Lachnospiraceae family and which appeared at significantly higher levels in 31-week of age compared to other age groups, showed positive correlation with butyrate concentrations. In addition, these unknown strains also account for considerable proportion of microbiota in E2, which includes the majority of 31-week-old group in enterotyping analysis. From the above results, we suggest that the unknown species EU655775_s and EU622773_s may directly relate with cecal luminal butyrate production and inflammatory gene expression status.
Such a remarkable difference between the cecal microbiota of the 31-week-old and other age groups suggests a role of microbial maturation in youth. It is known that after birth, the gut microbiome in mammals mature and increase diversity during nursing and weaning.28 This maturation period of gut microbiome is important for young individuals to acquire and optimize immune system,29 and this period may influence the health status across their whole life span.30 Our results suggest that microbial maturation occurs between 6 and 31 weeks of age and gradually become senescent from 31 weeks to 2 years age in rat.
From microbial compositional analysis at the family level, each family at the 4 age groups support previous reports. That is, the Christensenellaceae family, which increased significantly in 2-year-old rats compared to 31- and 74-week-old ones, is known to be increased in human with a long life of 99 years or more.31 On the other hands, the Enterococcaceae32,33 and Erysipelotrichaceae34 family, which also increased at 2 years of age compared to other ages, are known as opportunistic pathogens. These results suggest that the gut microbiome actively interacts with the host in contributing to host health or looking for an opportunity to survive.
Another interesting finding from LEfSe plots showing the ratio of commensal to opportunistic pathogens is that younger age groups (6- and 31-week old groups) showed higher ratio of commensal bacteria, except when comparing the ratios of the 6- and 74-week-old groups. If many genera had been characterized, opportunistic pathogens would seem to increase in older rats compared to younger rats. Notably, Escherichia35 and Enterococcus36 increased in 2-year-olds compared to all other ages, which may represent the vulnerability of the elderly gut microbiome. Adlercreutzia equolifaciens, the only species belonging to Adlercreutzia, an equol-producing bacterium in the gut, increased in 74-week- and 2-year-olds compared to 6- and 31-week-olds. Increasing equol-producers decreases the risk of coronary heart disease and lipid levels by reducing inflammation and blood pressure variables.37
One of limitations of this study is that female rats were not included in the analysis. There have been some reports of sex differences in the gut microbial compositions.15 However, the experimental condition of this study was focused on aging itself without changing diet or other housing conditions. Therefore, we presumed there would not be so many differences depending on sex. However, there may be influence of sex hormones, so we are planning to perform similar experiments in both sexes in the future. Another limitation was that a low abundance of butyrate-producing bacteria was seen in spite of our endeavor to find butyrate-producing bacteria directly from the abundance ratio analysis. We speculated that the reason we could not find any known bacterial species directly related to butyrate production due to the presence of enormous unknown and uncharacterized strains in the gut microbiota.38
In conclusion, the major luminal bacterial taxa in the cecum changed in 31-week-old rats. Lachnospiraceae, a well-known SCFA-producing family, increased at this age. Moreover, the unknown species EU622775_s and EU622773_s showed strong association with cecal butyrate level at 31 weeks of age.
Supplementary Materials
Note: To access the supplementary table and figure mentioned in this article, visit the online version of Journal of Neurogastroenterology and Motility at http://www.jnmjournal.org/, and at https://doi.org/10.5056/jnm20148.
Footnotes
Financial support: This work was supported by a grant from the National Research Foundation of Korea (NRF) funded by the government of the Republic of Korea (2019R1A2C2085149).
Conflicts of interest: None.
Author contributions: Soo In Choi and Joo Hee Son equally contributed to this manuscript and analyzed the results and drafted the manuscript; Nayoung Kim designed and supervised this study and edited this manuscript; Ryoung Hee Nam, Ji Hyun Park, and Jeong Eun Yu carried out the animal experiments; Huitae Min, Yeon-Ran Kim, and Yeong-Jae Seok measured short-chain fatty acids; and Chin Hee Song, Dong Ho Lee, Yong Sung Kim, and Kichul Yoon provided critical feedback and helped to edit this manuscript.
References
- 1.Canny GO, McCormick BA. Bacteria in the intestine, helpful residents or enemies from within? Infect Immun. 2008;76:3360–3373. doi: 10.1128/IAI.00187-08. [DOI] [PMC free article] [PubMed] [Google Scholar]
- 2.Quigley EM. Gut bacteria in health and disease. Gastroenterol Hepatol. 2013;9:560–569. [PMC free article] [PubMed] [Google Scholar]
- 3.Nguyen TL, Vieira-Silva S, Liston A, Raes J. How informative is the mouse for human gut microbiota research? Dis Model Mech. 2015;8:1–16. doi: 10.1242/dmm.017400. [DOI] [PMC free article] [PubMed] [Google Scholar]
- 4.Flemer B, Gaci N, Borrel G, et al. Fecal microbiota variation across the lifespan of the healthy laboratory rat. Gut Microbes. 2017;8:428–439. doi: 10.1080/19490976.2017.1334033. [DOI] [PMC free article] [PubMed] [Google Scholar]
- 5.Li D, Chen H, Mao B, et al. Microbial biogeography and core microbiota of the rat digestive tract. Sci Rep. 2017;8:45840. doi: 10.1038/srep45840. [DOI] [PMC free article] [PubMed] [Google Scholar]
- 6.Aleman FDD, Valenzano DR. Microbiome evolution during host aging. PLoS Pathog. 2019;15:e1007727. doi: 10.1371/journal.ppat.1007727. [DOI] [PMC free article] [PubMed] [Google Scholar]
- 7.Nuriel-Ohayon M, Neuman H, Koren O. Microbial changes during pregnancy, birth, and infancy. Front Microbiol. 2016;7:1031. doi: 10.3389/fmicb.2016.01031. [DOI] [PMC free article] [PubMed] [Google Scholar]
- 8.Gorbach SL. Microbiology of the gastrointestinal tract. In: Baron S, editor. Medical Microbiology. 4th ed. University of Texas Medical Branch at Galveston; Galveston: 1996. Chapter 95. [PubMed] [Google Scholar]
- 9.Yoon K, Kim N. The effect of microbiota on colon carcinogenesis. J Cancer Prev. 2018;23:117–125. doi: 10.15430/JCP.2018.23.3.117. [DOI] [PMC free article] [PubMed] [Google Scholar]
- 10.Rechkemmer G, Rönnau K, von Engelhardt W. Fermentation of polysaccharides and absorption of short chain fatty acids in the mammalian hindgut. Comp Biochem Physiol A Comp Physiol. 1988;90:563–568. doi: 10.1016/0300-9629(88)90668-8. [DOI] [PubMed] [Google Scholar]
- 11.Ratajczak W, Rył A, Mizerski A, Walczakiewicz K, Sipak O, Laszczyńska M. Immunomodulatory potential of gut microbiome-derived short-chain fatty acids (SCFAs) Acta Biochim Pol. 2019;66:1–12. doi: 10.18388/abp.2018_2648. [DOI] [PubMed] [Google Scholar]
- 12.Ríos-Covián D, Ruas-Madiedo P, Margolles A, Gueimonde M, de Los Reyes-Gavilán CG, Salazar N. Intestinal short chain fatty acids and their link with diet and human health. Front Microbiol. 2016;7:185. doi: 10.3389/fmicb.2016.00185. [DOI] [PMC free article] [PubMed] [Google Scholar]
- 13.Vital M, Karch A, Pieper DH. Colonic butyrate-producing communities in humans: an overview using omics data. mSystems. 2017;2:e00130–17. doi: 10.1128/mSystems.00130-17. [DOI] [PMC free article] [PubMed] [Google Scholar]
- 14.Lee SM, Kim N, Park JH, Nam RH, Yoon K, Lee DH. Comparative analysis of ileal and cecal microbiota in aged rats. J Cancer Prev. 2018;23:70–76. doi: 10.15430/JCP.2018.23.2.70. [DOI] [PMC free article] [PubMed] [Google Scholar]
- 15.Lee SM, Kim N, Yoon H, Nam RH, Lee DH. Microbial changes and host response in F344 rat colon depending on sex and age following a high-fat diet. Fronti Microbiol. 2018;9:2236. doi: 10.3389/fmicb.2018.02236. [DOI] [PMC free article] [PubMed] [Google Scholar]
- 16.Lee SM, Kim N, Nam RH, et al. Gut microbiota and butyrate level changes associated with the long-term administration of proton pump inhibitors to old rats. Sci Rep. 2019;9:6626. doi: 10.1038/s41598-019-43112-x. [DOI] [PMC free article] [PubMed] [Google Scholar]
- 17.Kanehisa M, Goto S. KEGG: kyoto encyclopedia of genes and genomes. Nucleic Acids Res. 2000;28:27–30. doi: 10.1093/nar/28.1.27. [DOI] [PMC free article] [PubMed] [Google Scholar]
- 18.Arumugam M, Raes J, Pelletier E, et al. Enterotypes of the human gut microbiome. Nature. 2011;473:174–180. doi: 10.1038/nature09944. [DOI] [PMC free article] [PubMed] [Google Scholar]
- 19.Liu Y, Li Z, Xiong H, Gao X, Wu J. Understanding of internal clustering validation measures. In: 2010 IEEE International Conference on Data Mining. Sydney: IEE. 2019:911–916. doi: 10.1109/ICDM.2010.35. [DOI] [Google Scholar]
- 20.Altschul SF, Gish W, Miller W, Myers EW, Lipman DJ. Basic local alignment search tool. J Mol Biol. 1990;215:403–410. doi: 10.1016/S0022-2836(05)80360-2. [DOI] [PubMed] [Google Scholar]
- 21.Chen D, Jin D, Huang S, et al. Clostridium butyricum, a butyrate-producing probiotic, inhibits intestinal tumor development through modulating Wnt signaling and gut microbiota. Cancer Lett. 2020;469:456–467. doi: 10.1016/j.canlet.2019.11.019. [DOI] [PubMed] [Google Scholar]
- 22.Miquel S, Martín R, Bridonneau C, et al. Ecology and metabolism of the beneficial intestinal commensal bacterium Faecalibacterium prausnitzii. Gut Microbes. 2014;5:146–151. doi: 10.4161/gmic.27651. [DOI] [PMC free article] [PubMed] [Google Scholar]
- 23.Chen J, Zhao KN, Vitetta L. Effects of intestinal microbial-elaborated butyrate on oncogenic signaling pathways. Nutrients. 2019;11:1026. doi: 10.3390/nu11051026. [DOI] [PMC free article] [PubMed] [Google Scholar]
- 24.Zeng H, Umar S, Rust B, Lazarova D, Bordonaro M. Secondary bile acids and short chain fatty acids in the colon: a focus on colonic microbiome, cell proliferation, inflammation, and cancer. Int J Mol Sci. 2019;20:1214. doi: 10.3390/ijms20051214. [DOI] [PMC free article] [PubMed] [Google Scholar]
- 25.Chang PV, Hao L, Offermanns S, Medzhitov R. The microbial metabolite butyrate regulates intestinal macrophage function via histone deacetylase inhibition. Proc Natl Acad Sci USA. 2014;111:2247–2252. doi: 10.1073/pnas.1322269111. [DOI] [PMC free article] [PubMed] [Google Scholar]
- 26.Vital M, Howe AC, Tiedje JM. Revealing the bacterial butyrate synthesis pathways by analyzing (meta)genomic data. mBio. 2014;5:e00889. doi: 10.1128/mBio.00889-14. [DOI] [PMC free article] [PubMed] [Google Scholar]
- 27.Zhang J, Song L, Wang Y, et al. Beneficial effect of butyrate-producing Lachnospiraceae on stress-induced visceral hypersensitivity in rats. J Gastroenterol Hepatol. 2019;34:1368–1376. doi: 10.1111/jgh.14536. [DOI] [PMC free article] [PubMed] [Google Scholar]
- 28.Sommer MO. Advancing gut microbiome research using cultivation. Curr Opin Microbiol. 2015;27:127–132. doi: 10.1016/j.mib.2015.08.004. [DOI] [PubMed] [Google Scholar]
- 29.Lathrop SK, Bloom SM, Rao SM, et al. Peripheral education of the immune system by colonic commensal microbiota. Nature. 2011;478:250–254. doi: 10.1038/nature10434. [DOI] [PMC free article] [PubMed] [Google Scholar]
- 30.Cox LM, Yamanishi S, Sohn J, et al. Altering the intestinal microbiota during a critical developmental window has lasting metabolic consequences. Cell. 2014;158:705–721. doi: 10.1016/j.cell.2014.05.052. [DOI] [PMC free article] [PubMed] [Google Scholar]
- 31.Biagi E, Franceschi C, Rampelli S, et al. Gut microbiota and extreme longevity. Curr Biol. 2016;26:1480–1485. doi: 10.1016/j.cub.2016.04.016. [DOI] [PubMed] [Google Scholar]
- 32.Stępień-Pyśniak D, Hauschild T, Kosikowska U, Dec M, Urban-Chmiel R. Biofilm formation capacity and presence of virulence factors among commensal Enterococcus spp. from wild birds. Sci Rep. 2019;9:11204. doi: 10.1038/s41598-019-47602-w. [DOI] [PMC free article] [PubMed] [Google Scholar]
- 33.Zou J, Shankar N. The opportunistic pathogen Enterococcus faecalis resists phagosome acidification and autophagy to promote intracellular survival in macrophages. Cell Microbiol. 2016;18:831–843. doi: 10.1111/cmi.12556. [DOI] [PubMed] [Google Scholar]
- 34.Kaakoush NO. Insights into the role of Erysipelotrichaceae in the human host. Front Cell Infect Microbiol. 2015;5:84. doi: 10.3389/fcimb.2015.00084. [DOI] [PMC free article] [PubMed] [Google Scholar]
- 35.Berg RD. Escherichia coli, infection and immunity. In: Delves PJ, ed. Encyclopedia of Immunology. 2nd ed. Oxford: Elsevier. 1998:842–845. doi: 10.1006/rwei.1999.0222. [DOI] [Google Scholar]
- 36.Heikens E, Singh KV, Jacques-Palaz KD, et al. Contribution of the enterococcal surface protein Esp to pathogenesis of Enterococcus faecium endocarditis. Microbes Infect. 2011;13:1185–1190. doi: 10.1016/j.micinf.2011.08.006. [DOI] [PMC free article] [PubMed] [Google Scholar]
- 37.Birru RL, Ahuja V, Vishnu A, et al. The impact of equol-producing status in modifying the effect of soya isoflavones on risk factors for CHD: a systematic review of randomised controlled trials. J Nutr Sci. 2016;5:e30. doi: 10.1017/jns.2016.18. [DOI] [PMC free article] [PubMed] [Google Scholar]
- 38.Kho ZY, Lal SK. The human gut microbiome - a potential controller of wellness and disease. Front Microbiol. 2018;9:1835. doi: 10.3389/fmicb.2018.01835. [DOI] [PMC free article] [PubMed] [Google Scholar]
Associated Data
This section collects any data citations, data availability statements, or supplementary materials included in this article.


