Abstract
Background
The growth- and plasticity-associated protein-43 (GAP43) is biasedly expressed in indigestive system and nervous system. Recent study has shown that GAP43 is responsible for the development of neuronal growth and axonal regeneration in normal nervous tissue, while serves as a specific biomarker of relapsed or refractory neuroblastoma. However, its expression pattern and function in digestive system cancer remains to be clarified.
Methods
In this study, we examined the GAP43 status with qRT-PCR and bisulfite genomic sequencing in colorectal cancer (CRC). We investigated the effect of overexpressed GAP43 in CRC cells with RNA-seq. The RNA-seq data was analyzed with DAVID and IPA.
Results
GAP43 was downregulated in CRC compared to the adjacent tissues. DNA methylase inhibitor 5-Aza-CdR treatment could significantly induce GAP43, indicated that the silencing of GAP43 gene in CRC is closely related to DNA methylation. Bisulfite genomic sequencing confirmed the promoter methylation of GAP43 in CRC. To explore the transcriptional alterations by overexpressed GAP43 in CRC, we performed RNA-seq and found that upregulated genes were significantly enriched in the signaling pathways of ABC transporters and ECM-receptor interaction, while downregulated genes were significantly enriched in Ribosome signaling pathway. Further Ingenuity Pathway Analysis (IPA) showed that EIF2 signaling pathway was significantly repressed by overexpression of GAP43.
Conclusion
Our findings provide a novel mechanistic insight of GAP43 in CRC. Transcriptome profiling of overexpressed GAP43 in CRC uncovered the functional roles of GAP43 in the development of human CRC.
Supplementary Information
The online version contains supplementary material available at 10.1186/s12885-020-07728-x.
Keywords: GAP43, Colorectal cancer, RNA-seq, DNA methylation, Transcriptome profiling
Background
Colorectal cancer (CRC) is one of the most common type of the digestive tract cancers and it ranks the third in the world’s cancer incidence [1]. CRC is mainly caused by genetic factors, chronic inflammation, unhealthy living habits, etc.; the geographical distribution of the disease is quite different, and the incidence of CRC is higher in developed areas [2]. China is a low-incidence area for CRC, but the incidence rate is increasing [3]. As of 2016, the number of new cases of CRC in China has exceeded 270,000 and more than 130,000 deaths [4]. As the third malignancy in China, previous researches showed that CRCs are caused by various genetic and epigenetic changes, including WNT, PI3K-Akt, GPCR, FGFR, MAPK, TGFB, and TP53 signaling pathways [5–7]. To date, the exact cellular and molecular mechanisms leading to CRC have not been systematically evaluated. Further investigation of functional genes in CRC is critical for identifying novel potential targets for CRC detection and precision treatment.
GAP43 was reported as a ‘growth’ or ‘plasticity’ protein, which was responsible for the development of neuronal growth and axonal regeneration [8–10]. Previous studies of GAP43 thus far were focused on the neuron biology. However, the role of GAP43 in human cancers, especially CRC, has not been explored to date. Previously, with the GEPIA database (http://gepia.cancer-pku.cn/), we found that the expression level of GAP43 was significantly downregulated in colorectal cancer tissues (normal versus cancer tissues), including the colon adenocarcinoma (COAD) and rectal adenocarcinoma (READ) (Supplementary Fig. S1a).
Here, we investigated the expression level of GAP43 in CRC cell lines. The mechanism of the silenced GAP43 gene expression in CRC tissues was further studied with the analysis of its promoter methylation. Furthermore, the transcriptome alteration of GAP43-overexpressed versus control CRC cell line was analyzed with RNA-seq. Taken together, we disclosed the potential functions of GAP43 in the development of human CRC.
Methods
Cell culture and transfection
The CRC cell lines HCT116 (Resource number: 3131C0001000700099), SW620 (Resource number: 3131C0001000700101), SW480 (Resource number: 3131C0001000700086), HT-29 (Resource number: 3131C0001000700103), DLD-1 (Resource number: 3131C0001000700134) were cultured in RPM1640 medium supplemented with 10% fetal calf serum and 2 mM L-glutamine. All CRC cell lines used in this study were originally purchased from the Type Culture Collection of the Chinese Academy of Sciences, Shanghai, China. Normal colorectal epithelial cell line NCM460 (Resource number: CVCL_0460, INCELL) was kindly provided by Dr. Ming Liu, Harbin Medical University, China. NCM460 was cultured in DMEM medium supplemented with 10% fetal calf serum and 2 mM L-glutamine. All cell lines were authenticated by short tandem repeats (STR) analysis. All cell lines have been tested for mycoplasma contamination, and no contamination was found. SW620/GAP43 cell (SW620 cell overexpressing GAP43 protein) was generated by stabilizing a GAP43-expression plasmid that confers neomycin resistance in SW620 cell.
Patient samples
The collection of three paired CRC samples used for quantitative Real-Time PCR, patient consent, and patient recruitment followed Institutional Review Board protocols from Hangzhou Cancer Hospital. The clinical information of these colorectal cancer tissues was listed in Supplementary Table S6. The study has been approved by the Research Ethics Committee of Hangzhou Cancer Hospital (Hangzhou, P. R. China; approval number HZCH-2018-02). All written informed consents have been provided by the patients, and to be conducted in accordance with the Declaration of Helsinki.
Quantitative real-time PCR (qRT-PCR)
Quantification of mRNA expression was performed with SYBR Green PCR Master Mix on an ABI 7500 real-time PCR system (Foster City, CA, USA). GAPDH was considered as an internal control. The qRT-PCR procedure was recommended according to the protocol. Primers for qRT-PCR are described in Supplementary Table S7.
Bisulfite DNA sequencing
Bisulfite DNA sequencing was performed as previously described [11]. Briefly, the bisulfite modification of DNA was performed according to the protocol of the methylSEQr™ Bisulfite Conversion Kit (Applied Biosystems, Shanghai, CN). The bisulfite-treated DNA was amplified using nested PCR using the primers described in Table S1. The amplified bisulfite-treated DNA was sequenced and compared to the original sequence of the GAP43 gene.
RNA-seq library preparation and sequencing
Total RNA was isolated from 4X10⁶ GAP43 overexpressed and control SW620 cells using RNeasy Mini Kit (Qiagen, Valencia, CA). Total RNA integrity was checked using an Agilent 2100 Bioanalyzer (Agilent Technologies, Inc., CA, USA) with an RNA integrity number (RIN) value greater than 8. The mRNA was purified and fragmented from total RNA (2 μg) using poly-T oligo attached magnetic beads with two rounds of purification. Then the cleaved RNA fragments were primed with random hexamers and were reverse transcribed into first-strand cDNA using reverse transcriptase and random primers. The RNA template was removed and synthesized a replacement strand to generate double-strand cDNA. End repair, A-tailing, adaptor ligation, cDNA template purification and enrichment were then performed. Constructed libraries were sequenced with 150 bp paired-end by an Illumina X10 sequencer, following manufacturer’s instructions.
Database for annotation, visualization and integrated discovery (DAVID) and ingenuity pathway analysis (IPA)
DAVID (http://david.abcc.ncifcrf.gov), Functional Annotation Bioinformatics Microarray Analysis was used to identify significantly enriched gene ontology (GO) and Kyoto Encyclopedia of Genes and Genomes (KEGG) terms among the given list of genes that are differentially expressed in GAP43 overexpressed and control HCT116 cells. Statistically overrepresented GO and KEGG categories with p-value≤0.05 were considered significant. For IPA, different expressional genes (DEGs) were submitted to IPA software (Qiagen bioinformatics, Ingenuity Pathway Analysis), the canonical pathways were considered significant with p-value≤0.05 and z-score ≥ 1 or z-score ≤ − 1.
Statistical analysis
Statistical data were represented as mean ± standard deviation from at least three independent experiments. Genes expression were statistically analyzed by two-way repeated measures ANOVA. All graphs were plotted and analyzed with GraphPad Prism 7 software.
Results
GAP43 is expressed in human colon tissues, but not in colorectal cancer cells
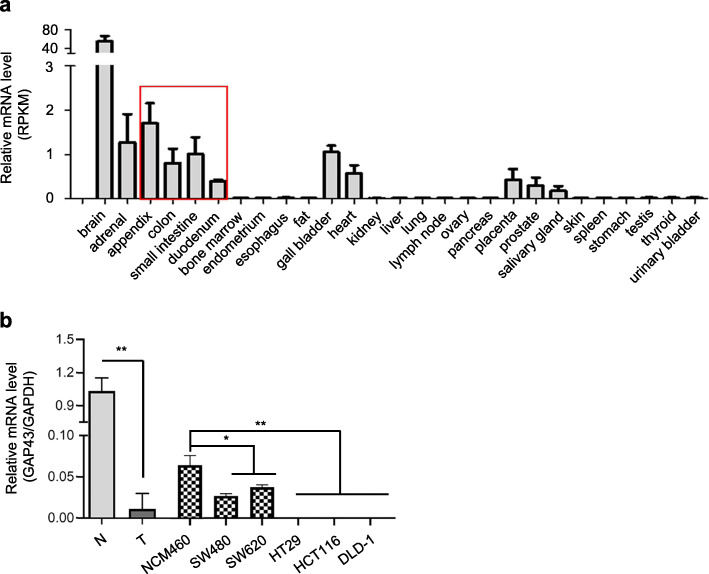
According to the RNA-seq data from normal tissues of 95 human individuals [12], GAP43 gene is biasedly expressed in brain, adrenal, gall bladder, heart, placenta, prostate, salivary gland and a series of indigestive tissues, including duodenum, small intestine, colon and appendix (Fig. 1a). As previous observation of the downregulated GAP43 in CRC, we hypothesize that GAP43 may play role on the development of CRC. To investigate the expression level and mutations of GAP43 in CRC tissues, we analyzed the publicly available databases (cBioPortal, Oncomine). In cBioPortal database, we found that GAP43 was mutated in CRC cancer tissues with the 1–3% frequency (Supplementary Fig. S1b), and in Oncomine, compared with normal colorectal tissues, we found that the expression of GAP43 was significantly repressed in CRC tissues (Supplementary Fig. S1c). Further validations were performed with Quantitative real-time PCR (qRT-PCR) in 3 paired CRC tissues and the corresponding adjacent non-tumor tissues, 1 normal colorectal epithelial cell line NCM460 and 5 CRC cell lines HCT116, SW620, SW480, HT29, DLD-1 (Fig. 1b). The results showed that GAP43 was significantly down-regulated in these 3 CRC tissues and 5 CRC cell lines, compared to normal tissues and normal colon cell, respectively. Thus, these data indicated that GAP43 gene was expressed in human normal colon tissues, but significantly down-regulated in CRC.
Fig. 1.
GAP43 expression levels are detected in normal human tissues and colorectal cancer cell lines. a Relative mRNA levels are analyzed, according to the RNA-seq data from normal tissues of 95 human individuals. b qRT-PCR was performed in five CRC cell lines HCT116, SW620, SW480, HT29, DLD-1and 2 human adjacent non-cancer tissues. The relative mRNA levels are analyzed. The results represent at least three independent experiments and are reported as mean ± SEM. *p < 0.05
GAP43 level is repressed in CRC due to aberrant promoter methylation
To investigate the mechanisms involved in the silencing of GAP43 gene in CRC, we investigated the DNA methylation and mRNA expression data of GAP43 from CRC tissue of the TCGA database. The results showed that the downregulated expression of GAP43 may due to the hyper DNA methylation of its promoter regions in CRC tissues (Supplementary Fig. S2).
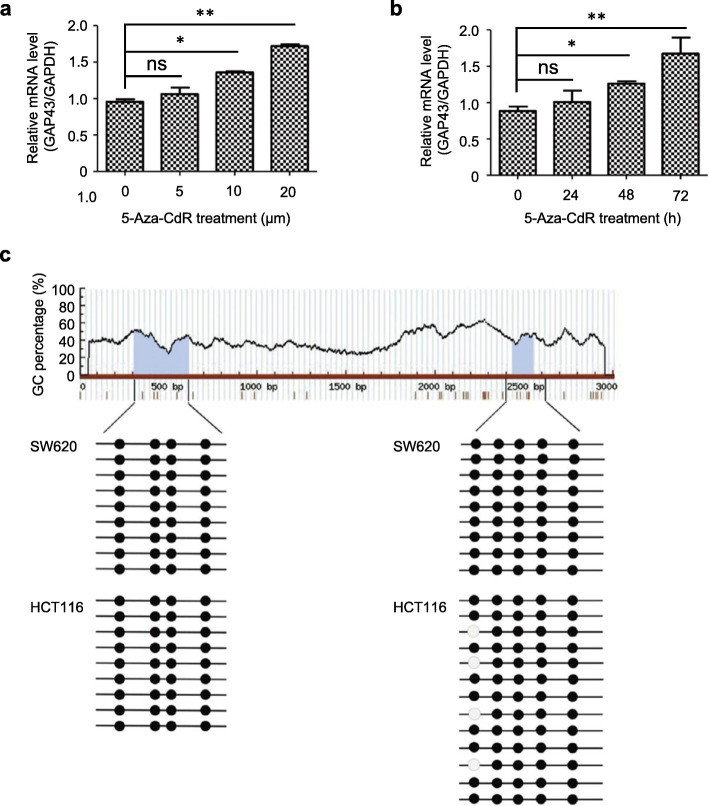
To demonstrate that silencing of GAP43 expression in CRC cells is caused by the methylation of its promoter, we treated SW620 cells with the DNA demethylating agent 5-Aza-CdR. As shown in Fig. 2a, mRNA level of GAP43 was significantly increased after the treatment of SW620 cells with high concentrations of 5-Aza-CdR for 72 h. When SW620 cells were treated with 10 μM 5-Aza-CdR, the mRNA level of GAP43 was significantly increased with the increasing treatment time (Fig. 2b). To further confirm the DNA methylation in the GAP43 promoter of CRC cells, we performed bisulfite genomic sequencing to analyze the methylation status of the GAP43 promoter in CRC cell lines SW620 and HCT116. The promoters of HAND1 M1 and HAND1 M2 have been known to be highly methylated [13], and the promoters of ABCC1 and ABCG2 are rarely methylated [14]. Thereby, we take them as positive or negative controls in bisulfite genomic sequencing analysis, respectively (Fig. S3). The results showed that in the CRC, multiple CpG islands in the promoter region of the GAP43 gene were methylated (Fig. 2c). These results show that the downregulation or silencing of GAP43 in CRC is associated with its promoter methylation.
Fig. 2.
Silencing of GAP43 gene is due to aberrant promoter methylation. a SW620 cells were treated with the indicated concentration of DNA demethylating agent 5-Aza-CdRfor 72 h, or b SW620 cells were treated with 10 μM 5-Aza-CdR for indicated treatment time (0, 24, 48, 72 h), and then mRNA levels of GAP43 were analyzed by qRT-PCR. c Bisulfite genomic sequencing was performed to analyze the methylation status of the GAP43 promoter in CRC cell lines SW620 and HCT116. Multiple CpG islands in the promoter region of the GAP43 gene were analyzed. The results represent at least three independent experiments and are reported as mean ± SEM. *p < 0.05, **p < 0.001
Identification of transcriptome alterations in GAP43 overexpressed CRC cells through RNA-seq
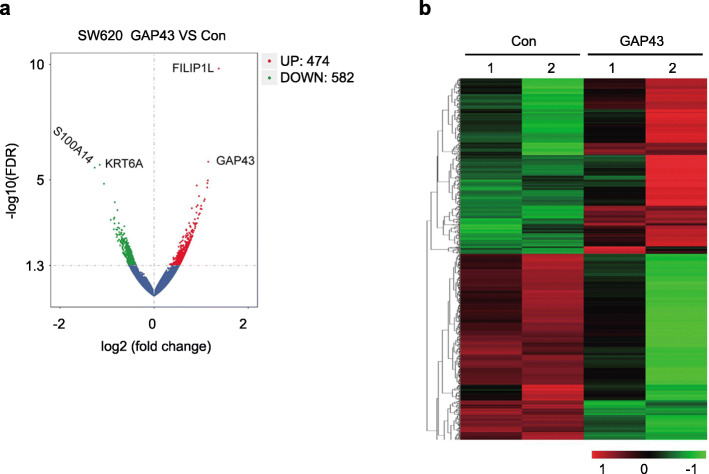
As GAP43 expression is silenced in CRC cells, in order to investigate the transcriptome alterations, we performed RNA-seq on GAP43-overexpressed SW620 cells and control SW620 cells. For transcriptome analysis, we acquired valid RNA-seq data from stable transfected GAP43 (29,592,934 bp and 25,180,042 bp) and control (28,506,301 bp and 27,436,701 bp) SW620 cells with Q30 > 90%, respectively (Supplementary Table S1). For more accurate results, the RNA-seq data was filtered with estimated FPKM values less than 1.0. Ultimately, with statistical analysis (Volcano plot), we found that the transcriptome of stable transfected GAP43 were significantly different from control SW620 cells (Fig. 3a). Totally 1056 differentially expressed genes (DEGs) were identified in stable transfected GAP43 compared with control SW620 cells. Among these genes, 474 genes were upregulated and 582 genes were downregulated, including upregulated FILP1L (WNT suppressor) [15], downregulated KRT6A (wound healing and epithelial migration) [16] and S100A14 (cell proliferation and cell migration) [17–20], et al. (Supplementary Table S2) (p-value< 0.05). The heatmap for some significantly altered genes by overexpressed GAP43 was shown in Fig. 3b. According to cellular functional categorization, significantly upregulated genes were classified as follows: transport (p-value = 2.60*E-04); glucose homeostasis (p-value = 5.51*E-04); retinoid metabolic process (p-value = 8.78*E-04); peripheral nervous system development (p-value = 8.93*E-04); extracellular matrix organization (p-value = 1.05*E-03). The significantly downregulated genes were classified as follows: translation (p-value = 8.02*E-56); SRP-dependent cotranslational protein, targeting to membrane (p-value = 2.98*E-54); nuclear-transcribed mRNA catabolic process, nonsense-mediated decay (p-value = 3.62*E-50); rRNA processing (p-value = 1.92*E-49); translational initiation (p-value = 7.24*E-49) (Supplementary Table S3).
Fig. 3.
Heatmap and volcano plot. a The volcano plot was constructed by plotting the negative log of the log10 FDR value on the y-axis. These results in data points with low log10 FDR values (highly significant) appearing toward the top of the plot. The x-axis is the log (fold change) between GAP43-overexpressed and control SW620 cells. b The heatmap of up- and down-regulated genes in red and green, respectively
Transcriptome analyses of GAP43-overexpressed CRC cells through DAVID and IPA
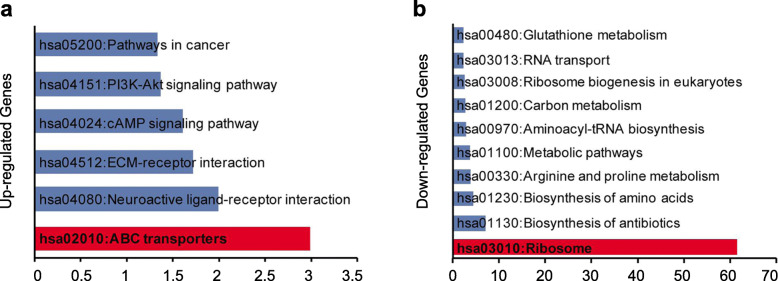
After bioinformatics analysis of RNA-seq data, the upregulated or downregulated genes in GAP43 stable transfected SW620 cells were summarized. We submitted these genes to DAVID (a web-based high-throughput functional genomics analysis tool) for systematically clustering these genes. In GOTERM_BP_FAT category, we identified significantly enriched GO terms that characterized GAP43 stable transfected SW620 cells. In total, 24 subcategories (p-value< 0.01) were found among upregulated genes and 38 subcategories (p-value< 0.01) among downregulated genes (Supplementary Table S3). Among the up-regulated genes, we found that cell membrane proteins were significantly enriched, such as transport (p-value = 2.60*E-04) and extracellular matrix organization (p-value = 0.001); while among down-regulated genes, protein translation related genes were significantly enriched. In KEGG_PATHWAY category, we found that the upregulated genes were clustered into 6 subcategories (p-value< 0.05, 1 subcategories with p-value< 0.01), including ABC transporters (p-value = 0.001) and ECM-receptor interaction (p-value = 0.019) (Fig. 4a). While the down-regulated genes were clustered into 12 subcategories (p-value< 0.05, 10 subcategories with p-value< 0.01) (Fig. 4b), including ribosome (p-value = 2.98*E-62); biosynthesis of antibiotics (p-value = 6.87*E-08); biosynthesis of amino acids (p-value = 3.11*E-05); arginine and proline metabolism (p-value = 1.35*E-04); metabolic pathways (p-value = 1.61*E-04) (Supplementary Table S4). These results showed that overexpressed GAP43 may influence the membrane transporters, and then repress the cancer cells’ metabolism and cause the repression of proliferation, invasion and migration effects in CRC cells.
Fig. 4.
Functional pathway enrichment analysis. a The upregulated DEGs or b down-regulated DEGs are involved in various KEGG biological pathways
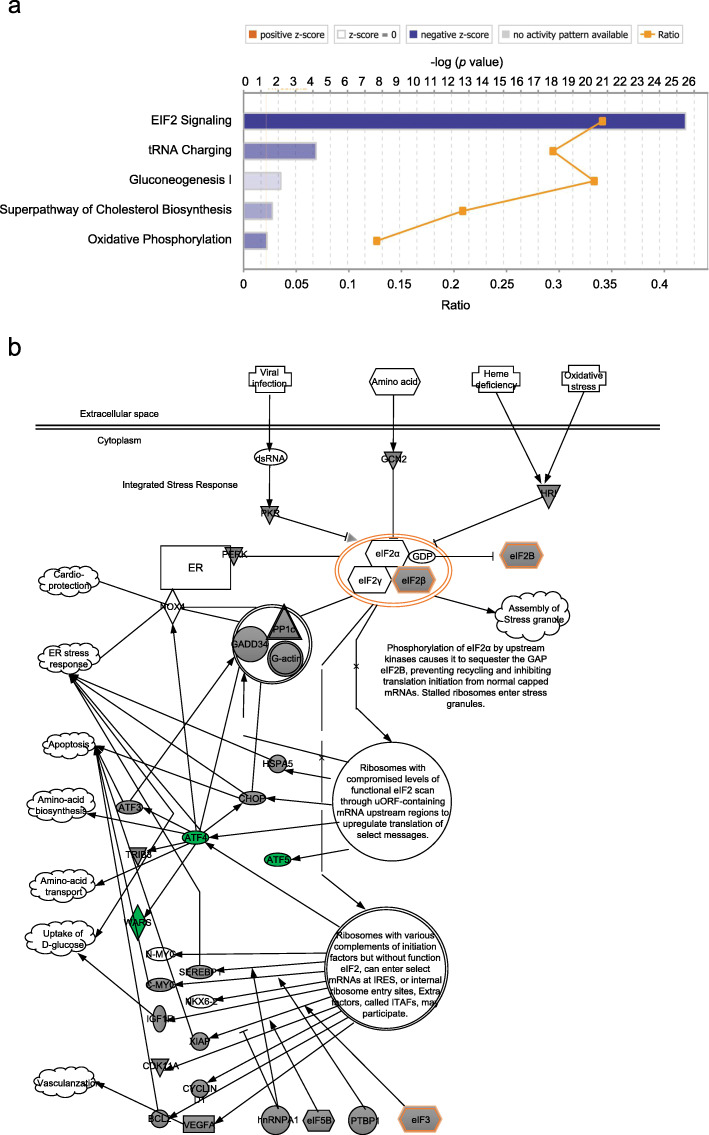
The expression levels of the most significant DEGs in RNA-seq data were confirmed by qRT-PCR in GAP43-overexpressed and control SW620 cells (Fig. 5). Furthermore, we applied these DEGs into IPA analysis, and we found that the most significant is the EIF2 signaling pathway (−log(p-value) = 25.5 and z-score = − 4.802) (Fig. 6a) [21, 22]. In EIF2 signaling pathway, the translation initiation factor (eIF1) and transcriptional factor (ATF4 and ATF5) were significantly downregulated (Fig. 6b). These results suggested that except the function on membrane, GAP43 may also involve in the regulation of cellular translation through the EIF2 signaling pathway.
Fig. 5.
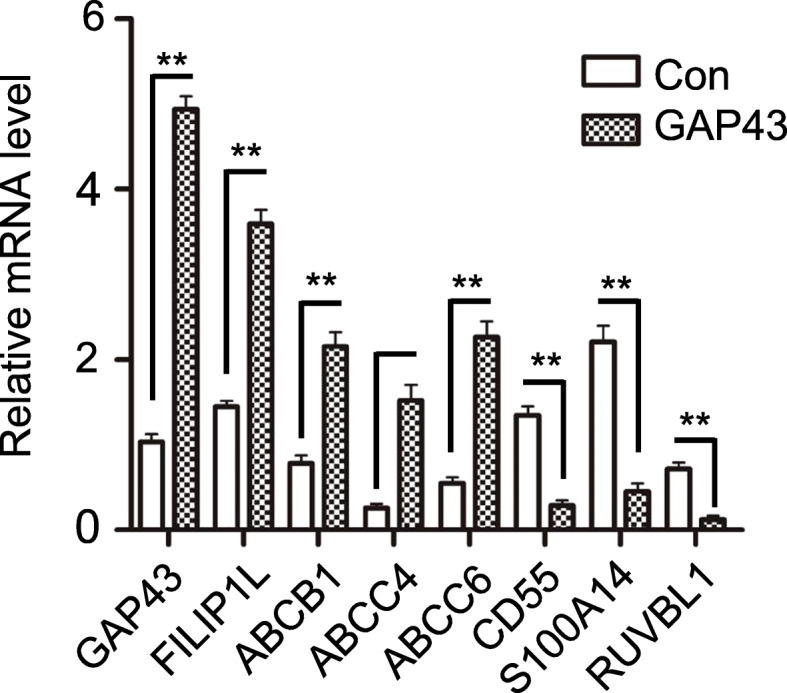
The expression levels of the most significant DEGs in RNA-seq data were confirmed by qRT-PCR in GAP43-overexpressed and control SW620 cells
Fig. 6.
IPA analysis and EIF2 signaling pathway. a IPA analysis. b EIF2 signaling pathway
Discussion
In previous studies, the functional studies of GAP43 were focused on the neuronal development, and the protein was considered to play crucial roles in effective regenerative responses, and learning and memory processes of the nervous system [23–25]. GAP43 is highly expressed in nervous system, and also biasedly expressed in indigestive tissues, including duodenum, small intestine, colon and appendix. Recent study has shown that GAP43 serves as a specific biomarker of relapsed or refractory neuroblastoma [26, 27]. However, the relationship between GAP43 and CRC development has been uncovered. In this study, we confirmed that GAP43 is expressed in human colon tissues, but is downregulated in CRC cells and tissues due to the methylation of its promoter region.
Aberrant epigenetic changes frequently occur in human colorectal cancer. The accumulation of numerous epigenetic alterations may drive the initiation and progression through the adenoma-carcinoma sequence [28, 29]. We found the expression pattern of GAP43 in colorectal cancer cells was closely associated with cancer-linked DNA hypermethylation, and the methylation status of GAP43 promoter did not change in different colorectal cancer cell lines (Fig. 2c). Additionally, we found that the expression level of GAP43 in immortalized colorectal epithelial cell line NCM460 was significantly higher than those in CRC cell lines, but it was dramatically reduced compared to normal colorectal tissues (Fig. 1b). Thus, when comparing the GAP43 gene expression patterns in a series of CRC cell lines, immortalized colorectal epithelial cell line, tumor cells and normal cells, we deduced that the accumulation of aberrant methylation of GAP43 gene might drive the initiation of CRC.
Further transcriptome analysis indicated multiple potential biological functions of GAP43 in CRC. The most significant different expression gene is upregulated FILIP1L, downregulated KRT6A and S100A14. While FILIP1L is a WNT pathway inhibitor [15], and the reduction of FILIP1L in ovarian cancer is associated with poor survival, progression and chemoresistance [30]. Previous studies showed that KRT6A and S100A14 were involved in cell migration and cell proliferation [16, 17, 20]. These results remind us that the reduced level of GAP43 in CRC due to its transcriptional alterations might regulate some potential signaling pathways associated with tumorigenesis, such as WNT signaling.
In KEGG_PATHWAY category, we found that the upregulated genes were clustered into 6 subcategories including ATP-binding cassette (ABC) transporters (p = 0.001). ABC transporters constitute a superfamily of membrane proteins that couple the hydrolysis of adenosine triphosphate (ATP) to vectorial transport of substrates across biological membranes [31]. Previous studies have showed that ABC superfamily utilizes the free-energy from ATP hydrolysis to shuttle many different substrates across various biological membranes, and consequently, are involved in both normal and abnormal physiology [32]. In this study, we found that with the overexpression of GAP43 in CRC cells, the expression of ABC transporters is also upregulated. However, the expression of bothGAP43 and ABC transporters is down-regulated in CRC tissues and cell lines, which indicates that ABC transporters might be related with the development of CRC.
In addition, we analyzed the transcriptome of GAP43 overexpressed CRC cells through DAVID and IPA. The IPA analysis showed that EIF2 signaling pathway is the most significant psychological phenomena (−log(p-value) =25.5 and z-score = − 4.802) (Fig. 6a, Supplementary Table S5), and three important members (eIF1, ATF4, ATF5) of EIF2 signaling pathway were significantly downregulated (Fig. 6b). Incidentally, we also found that GAP43 is differentially expressed, elevated or decreased in gastric cancer. Survival analysis showed that there was no significant change in survival of gastric cancer patients with low or high expression of GAP43 (Fig. S4). However, we found that patients with gastric cancer who were treated with the 5-FU anticancer drug had higher survival rates in patients with high GAP43 expression than those with low expression (Fig. S4). This suggests that GAP43 is likely to be associated with drug resistance to cancer chemotherapy drugs. Considering that the tolerance of chemotherapy drugs is related with ABC transporters, and GAP43 level is associated with the expression of ABC transporters. Therefore, GAP43 might affect the chemotherapy drug resistance in cancer patients through ABC transporter-mediated signaling pathway.
Conclusions
GAP43 is expressed in human indigestive tissues, including colon tissues, but is downregulated in CRC due to the methylation of its promoter region. The RNA-Seq transcriptome data analysis showed the gene expression profile between GAP43-overexpressed and control CRC cells. The analysis of GAP43-overexpressed versus control CRC cell line data gives insight into potential genes and pathways that may uncover the functional roles of GAP43 in the development of human CRC and expand the knowledge of the CRC progression.
Supplementary Information
Additional file 1: Supplementary Figure S1. Mutation and expression level analysis of GAP43 in CRC tissues with online database. a Expression of GAP43 in CRC (COAD and READ). b Mutation level of GAP43 in CRC tissues with cBioPortal database. c Expression level of GAP43 in CRC tissues with Oncomine database.
Additional file 2: Supplementary Figure S2. Correlation analysis of GAP43 expression level and its promoter methylation level in colon adenocarcinoma (a) and rectal adenocarcinoma (b).
Additional file 3: Supplementary Figure S3. Bisulfite genomic sequencing was performed to analyze the methylation status of the ABCC1 (a), ABCG2 (b), HAND1 M1 (c) and HAND1 M2 (d) promoters in CRC cell line HCT116. Multiple CpG islands in the promoter regions were analyzed.
Additional file 4: Supplementary Figure S4. Kaplan-Meier Plotter survival analysis of GAP43 in gastric cancer with or without different treatments. a gastric cancer. b gastric cancer with surgery only. c gastric cancer with 5-FU based adjuvant.
Additional file 5: Supplementary Table S1. Quality Control (QC) of our RNA-seq data.
Additional file 6: Supplementary Table S2. GAP43 overexpression related genes revealed by RNA-seq. (p-value< 0.05).
Additional file 7: Supplementary Table S3. DAVID analysis (GO_BP) of GAP43 overexpression related genes (p-value < 0.05).
Additional file 8: Supplementary Table S4. DAVID analysis (KEGG) of GAP43 overexpression related genes (p-value < 0.05).
Additional file 9: Supplementary Table S5. IPA Canonical Pathways of GAP43 overexpression related genes.
Additional file 10: Supplementary Table S6. Clinical Information of three CRC samples used in expression analysis of GAP43.
Additional file 11: Supplementary Table S7. Primers for qRT-PCR.
Acknowledgements
This manuscript has been released as a pre-print at Research Square, (https://www.researchsquare.com/article/rs-74222/v1).
Abbreviations
- GAP43
Growth associated protein 43
- ABC
ATP-binding cassette transporter
- EIF2
Eukaryotic initiation factor 2
- CRC
Colorectal cancer
- COAD
Colon adenocarcinoma
- IPA
Ingenuity pathway analysis
- ECM
Extracellular matrix
- 5-AZA-CdR
5-AZA-2′-deoxycytidine
- PI3K
Phosphoinositide 3-kinases
- GPCR
G protein-coupled receptor
- FGFR
Fibroblast growth factor receptor
- MAPK
Mitogen-activated protein kinase
- TGFB
Transforming growth factor beta
- FILIP1L
Filamin A Interacting Protein 1 Like
- KRT6A
Keratin 6A
- ATF
Activating Transcription Factor
- S100A14
S100 Calcium Binding Protein A14
- ATP
Adenosine triphosphate
- DEGs
Differentially expressed genes
- GO
Gene Ontology
- KEGG
Kyoto Encyclopedia of Genes and Genomes
- FPKM
Fragments per kilobase of exon model per million reads mapped
- GEPIA
Gene Expression Profiling Interactive Analysis
- DAVID
Database for Annotation, Visualization and Integrated Discovery
Authors’ contributions
MS, HW and MJ designed the experiments. XC, HW and JF performed all the experimental work. MS, HW and MJ analyzed results, made the figures, and wrote the manuscript. YL, JL, WS, WF, LX and DS contributed with experimental work and assisted with analyses of the data. All authors have read and approved the manuscript.
Funding
This work was supported by National Natural Science Foundation of China (31870891, 81502781 and 81903046), China Scholarship Council (CSC 201806125051), China’s Manned space pre-research project (17420205), China Postdoctoral Science Foundation (2020M673596XB), Hangzhou Social Development Self-declaration Project (20180533B63) and Zhejiang Health Science and Technology Project (2018KY595). These funding bodies played no role in the design of the study and collection, analysis, and interpretation of data and in writing the manuscript.
Availability of data and materials
All data generated or analyzed during this study are included in this published article. The RNA-seq datasets analyzed in the present study are available from the GEO repository, GSE145180 (http://www.ncbi.nlm.nih.gov/geo/query/acc.cgi?acc=GSE145 180).
Ethics approval and consent to participate
All sample collections, patient consent, and patient documented review and approval followed institutional review board protocols from Hangzhou cancer hospital (Hangzhou, P. R. China; approval number HZCH-2018-02). All written informed consents have been provided by the patients, and to be conducted in accordance with the Declaration of Helsinki.
Consent for publication
Not applicable.
Competing interests
The authors declare that they have no conflicts of interest.
Footnotes
Publisher’s Note
Springer Nature remains neutral with regard to jurisdictional claims in published maps and institutional affiliations.
Xi Chen, Hongjin Wu and Jia Feng contributed equally to this work.
Contributor Information
Mingfeng Jiang, Email: wounding110@126.com.
Ming Shi, Email: shiming@hit.edu.cn.
References
- 1.Marks KM, West NP, Morris E, Quirke P. Clinicopathological, genomic and immunological factors in colorectal cancer prognosis. Br J Surg. 2018;105(2):e99–e109. doi: 10.1002/bjs.10756. [DOI] [PMC free article] [PubMed] [Google Scholar]
- 2.Pham TT, Talukder AM, Walsh NJ, Lawson AG, Jones AJ, Bishop JL, Kruse EJ. Clinical and epidemiological factors associated with suicide in colorectal cancer. Supportive Care Cancer. 2019;27(2):617–621. doi: 10.1007/s00520-018-4354-3. [DOI] [PubMed] [Google Scholar]
- 3.Chen W, Sun K, Zheng R, Zeng H, Zhang S, Xia C, Yang Z, Li H, Zou X, He J. Cancer incidence and mortality in China. Chinese J Cancer Res = Chung-kuo yen cheng yen chiu 2018. 2014;30(1):1–12. doi: 10.21147/j.issn.1000-9604.2018.01.01. [DOI] [PMC free article] [PubMed] [Google Scholar]
- 4.Zhang L, Cao F, Zhang G, Shi L, Chen S, Zhang Z, Zhi W, Ma T. Trends in and predictions of colorectal Cancer incidence and mortality in China from 1990 to 2025. Front Oncol. 2019;9:98. doi: 10.3389/fonc.2019.00098. [DOI] [PMC free article] [PubMed] [Google Scholar]
- 5.Wu H, Zhang XY, Hu Z, Hou Q, Zhang H, Li Y, Li S, Yue J, Jiang Z, Weissman SM, et al. Evolution and heterogeneity of non-hereditary colorectal cancer revealed by single-cell exome sequencing. Oncogene. 2017;36(20):2857–2867. doi: 10.1038/onc.2016.438. [DOI] [PubMed] [Google Scholar]
- 6.Peters U, Bien S, Zubair N. Genetic architecture of colorectal cancer. Gut. 2015;64(10):1623–1636. doi: 10.1136/gutjnl-2013-306705. [DOI] [PMC free article] [PubMed] [Google Scholar]
- 7.Dickinson BT, Kisiel J, Ahlquist DA, Grady WM. Molecular markers for colorectal cancer screening. Gut. 2015;64(9):1485–1494. doi: 10.1136/gutjnl-2014-308075. [DOI] [PMC free article] [PubMed] [Google Scholar]
- 8.Zhao JC, Zhang LX, Zhang Y, Shen YF. The differential regulation of Gap43 gene in the neuronal differentiation of P19 cells. J Cell Physiol. 2012;227(6):2645–2653. doi: 10.1002/jcp.23006. [DOI] [PubMed] [Google Scholar]
- 9.Hocquemiller M, Vitry S, Bigou S, Bruyere J, Ausseil J, Heard JM. GAP43 overexpression and enhanced neurite outgrowth in mucopolysaccharidosis type IIIB cortical neuron cultures. J Neurosci Res. 2010;88(1):202–213. doi: 10.1002/jnr.22190. [DOI] [PubMed] [Google Scholar]
- 10.Piontek J, Regnier-Vigouroux A, Brandt R. Contact with astroglial membranes induces axonal and dendritic growth of human CNS model neurons and affects the distribution of the growth-associated proteins MAP 1B and GAP43. J Neurosci Res. 2002;67(4):471–483. doi: 10.1002/jnr.10094. [DOI] [PubMed] [Google Scholar]
- 11.Yang Z, Feng J, Xiao L, Chen X, Yao Y, Li Y, Tang Y, Zhang S, Lu M, Qian Y, et al. Tumor-derived PGLYRP2 predicts survival and antitumor immune responses in hepatocellular carcinoma. Hepatology. 2020;71(5):1626–42. [DOI] [PMC free article] [PubMed]
- 12.Fagerberg L, Hallstrom BM, Oksvold P, Kampf C, Djureinovic D, Odeberg J, Habuka M, Tahmasebpoor S, Danielsson A, Edlund K, et al. Analysis of the human tissue-specific expression by genome-wide integration of transcriptomics and antibody-based proteomics. Mol Cell Proteomics : MCP. 2014;13(2):397–406. doi: 10.1074/mcp.M113.035600. [DOI] [PMC free article] [PubMed] [Google Scholar]
- 13.Tan J, Yang X, Jiang X, Zhou J, Li Z, Lee PL, Li B, Robson P, Yu Q. Integrative epigenome analysis identifies a Polycomb-targeted differentiation program as a tumor-suppressor event epigenetically inactivated in colorectal cancer. Cell Death Dis. 2014;5:e1324. doi: 10.1038/cddis.2014.283. [DOI] [PMC free article] [PubMed] [Google Scholar]
- 14.Spitzwieser M, Pirker C, Koblmuller B, Pfeiler G, Hacker S, Berger W, Heffeter P, Cichna-Markl M. Promoter methylation patterns of ABCB1, ABCC1 and ABCG2 in human cancer cell lines, multidrug-resistant cell models and tumor, tumor-adjacent and tumor-distant tissues from breast cancer patients. Oncotarget. 2016;7(45):73347–73369. doi: 10.18632/oncotarget.12332. [DOI] [PMC free article] [PubMed] [Google Scholar]
- 15.Kwon M, Lee SJ, Wang Y, Rybak Y, Luna A, Reddy S, Adem A, Beaty BT, Condeelis JS, Libutti SK. Filamin a interacting protein 1-like inhibits WNT signaling and MMP expression to suppress cancer cell invasion and metastasis. Int J Cancer. 2014;135(1):48–60. doi: 10.1002/ijc.28662. [DOI] [PMC free article] [PubMed] [Google Scholar]
- 16.Smyth I, Ellis T, Hetherington R, Riley E, Narang M, Mahony D, Wicking C, Rothnagel JA, Wainwright BJ. Krt6a-Cre transgenic mice direct LoxP-mediated recombination to the companion cell layer of the hair follicle and following induction by retinoic acid to the interfollicular epidermis. J Investigative Dermatol. 2004;122(1):232–234. doi: 10.1046/j.0022-202X.2003.22122.x. [DOI] [PubMed] [Google Scholar]
- 17.Chen H, Yuan Y, Zhang C, Luo A, Ding F, Ma J, Yang S, Tian Y, Tong T, Zhan Q, et al. Involvement of S100A14 protein in cell invasion by affecting expression and function of matrix metalloproteinase (MMP)-2 via p53-dependent transcriptional regulation. J Biol Chem. 2012;287(21):17109–17119. doi: 10.1074/jbc.M111.326975. [DOI] [PMC free article] [PubMed] [Google Scholar]
- 18.Jin Q, Chen H, Luo A, Ding F, Liu Z. S100A14 stimulates cell proliferation and induces cell apoptosis at different concentrations via receptor for advanced glycation end products (RAGE) PLoS One. 2011;6(4):e19375. doi: 10.1371/journal.pone.0019375. [DOI] [PMC free article] [PubMed] [Google Scholar]
- 19.Kim G, Chung JY, Jun SY, Eom DW, Bae YK, Jang KT, Kim J, Yu E, Hong SM. Loss of S100A14 expression is associated with the progression of adenocarcinomas of the small intestine. Pathobiology. 2013;80(2):95–101. doi: 10.1159/000342394. [DOI] [PubMed] [Google Scholar]
- 20.Sapkota D, Bruland O, Costea DE, Haugen H, Vasstrand EN, Ibrahim SO. S100A14 regulates the invasive potential of oral squamous cell carcinoma derived cell-lines in vitro by modulating expression of matrix metalloproteinases, MMP1 and MMP9. Eur J Cancer. 2011;47(4):600–610. doi: 10.1016/j.ejca.2010.10.012. [DOI] [PubMed] [Google Scholar]
- 21.Falletta P, Sanchez-Del-Campo L, Chauhan J, Effern M, Kenyon A, Kershaw CJ, Siddaway R, Lisle R, Freter R, Daniels MJ, et al. Translation reprogramming is an evolutionarily conserved driver of phenotypic plasticity and therapeutic resistance in melanoma. Genes Dev. 2017;31(1):18–33. doi: 10.1101/gad.290940.116. [DOI] [PMC free article] [PubMed] [Google Scholar]
- 22.Wu H, Chen S, Yu J, Li Y, Zhang XY, Yang L, Zhang H, Hou Q, Jiang M, Brunicardi FC, et al. Single-cell Transcriptome analyses reveal molecular signals to intrinsic and acquired paclitaxel resistance in esophageal squamous Cancer cells. Cancer Lett. 2018;420:156–167. doi: 10.1016/j.canlet.2018.01.059. [DOI] [PubMed] [Google Scholar]
- 23.Kanazir S, Ruzdijic S, Vukosavic S, Ivkovic S, Milosevic A, Zecevic N, Rakic L. GAP-43 mRNA expression in early development of human nervous system. Brain Res Mol Brain Res. 1996;38(1):145–155. doi: 10.1016/0169-328x(96)00008-3. [DOI] [PubMed] [Google Scholar]
- 24.Allegra Mascaro AL, Cesare P, Sacconi L, Grasselli G, Mandolesi G, Maco B, Knott GW, Huang L, De Paola V, Strata P, et al. In vivo single branch axotomy induces GAP-43-dependent sprouting and synaptic remodeling in cerebellar cortex. Proc Natl Acad Sci U S A. 2013;110(26):10824–10829. doi: 10.1073/pnas.1219256110. [DOI] [PMC free article] [PubMed] [Google Scholar]
- 25.Benowitz LI, Routtenberg A. GAP-43: an intrinsic determinant of neuronal development and plasticity. Trends Neurosci. 1997;20(2):84–91. doi: 10.1016/s0166-2236(96)10072-2. [DOI] [PubMed] [Google Scholar]
- 26.Viprey VF, Gregory WM, Corrias MV, Tchirkov A, Swerts K, Vicha A, Dallorso S, Brock P, Luksch R, Valteau-Couanet D, et al. Neuroblastoma mRNAs predict outcome in children with stage 4 neuroblastoma: a European HR-NBL1/SIOPEN study. J Clin Oncol. 2014;32(10):1074–1083. doi: 10.1200/JCO.2013.53.3604. [DOI] [PubMed] [Google Scholar]
- 27.Stutterheim J, Zappeij-Kannegieter L, Versteeg R, Caron HN, van der Schoot CE, Tytgat GA. The prognostic value of fast molecular response of marrow disease in patients aged over 1 year with stage 4 neuroblastoma. Eur J Cancer. 2011;47(8):1193–1202. doi: 10.1016/j.ejca.2011.02.003. [DOI] [PubMed] [Google Scholar]
- 28.Markowitz SD, Bertagnolli MM. Molecular origins of cancer: molecular basis of colorectal cancer. N Engl J Med. 2009;361(25):2449–2460. doi: 10.1056/NEJMra0804588. [DOI] [PMC free article] [PubMed] [Google Scholar]
- 29.Jia Y, Guo M. Epigenetic changes in colorectal cancer. Chin J Cancer. 2013;32(1):21–30. doi: 10.5732/cjc.011.10245. [DOI] [PMC free article] [PubMed] [Google Scholar]
- 30.Kwon M, Kim JH, Rybak Y, Luna A, Choi CH, Chung JY, Hewitt SM, Adem A, Tubridy E, Lin J, et al. Reduced expression of FILIP1L, a novel WNT pathway inhibitor, is associated with poor survival, progression and chemoresistance in ovarian cancer. Oncotarget. 2016;7(47):77052–77070. doi: 10.18632/oncotarget.12784. [DOI] [PMC free article] [PubMed] [Google Scholar]
- 31.Locher KP. Mechanistic diversity in ATP-binding cassette (ABC) transporters. Nat Struct Mol Biol. 2016;23(6):487–493. doi: 10.1038/nsmb.3216. [DOI] [PubMed] [Google Scholar]
- 32.Wright J, Muench SP, Goldman A, Baker A. Substrate polyspecificity and conformational relevance in ABC transporters: new insights from structural studies. Biochem Soc Trans. 2018;46(6):1475–1484. doi: 10.1042/BST20180146. [DOI] [PubMed] [Google Scholar]
Associated Data
This section collects any data citations, data availability statements, or supplementary materials included in this article.
Supplementary Materials
Additional file 1: Supplementary Figure S1. Mutation and expression level analysis of GAP43 in CRC tissues with online database. a Expression of GAP43 in CRC (COAD and READ). b Mutation level of GAP43 in CRC tissues with cBioPortal database. c Expression level of GAP43 in CRC tissues with Oncomine database.
Additional file 2: Supplementary Figure S2. Correlation analysis of GAP43 expression level and its promoter methylation level in colon adenocarcinoma (a) and rectal adenocarcinoma (b).
Additional file 3: Supplementary Figure S3. Bisulfite genomic sequencing was performed to analyze the methylation status of the ABCC1 (a), ABCG2 (b), HAND1 M1 (c) and HAND1 M2 (d) promoters in CRC cell line HCT116. Multiple CpG islands in the promoter regions were analyzed.
Additional file 4: Supplementary Figure S4. Kaplan-Meier Plotter survival analysis of GAP43 in gastric cancer with or without different treatments. a gastric cancer. b gastric cancer with surgery only. c gastric cancer with 5-FU based adjuvant.
Additional file 5: Supplementary Table S1. Quality Control (QC) of our RNA-seq data.
Additional file 6: Supplementary Table S2. GAP43 overexpression related genes revealed by RNA-seq. (p-value< 0.05).
Additional file 7: Supplementary Table S3. DAVID analysis (GO_BP) of GAP43 overexpression related genes (p-value < 0.05).
Additional file 8: Supplementary Table S4. DAVID analysis (KEGG) of GAP43 overexpression related genes (p-value < 0.05).
Additional file 9: Supplementary Table S5. IPA Canonical Pathways of GAP43 overexpression related genes.
Additional file 10: Supplementary Table S6. Clinical Information of three CRC samples used in expression analysis of GAP43.
Additional file 11: Supplementary Table S7. Primers for qRT-PCR.
Data Availability Statement
All data generated or analyzed during this study are included in this published article. The RNA-seq datasets analyzed in the present study are available from the GEO repository, GSE145180 (http://www.ncbi.nlm.nih.gov/geo/query/acc.cgi?acc=GSE145 180).


