

Graphical abstract

Keywords: Hydrodynamic cavitation reactor, Cavitation generation mechanism and development process, Numerical simulation, Experimental flow visualization, Water treatment
Highlights
-
•
Cavitation flow in an ARHCR is studied combining flow visualization and CFD.
-
•
Cavitation is characterized by the periodic motion of CGUs.
-
•
Cavitation development process shows high periodicity from flow visualization.
-
•
Vortex cavitation is generated at the vortex center of CGUs.
-
•
Sheet cavitation is induced in the flow separation region of downstream CGUs.
Abstract
Hydrodynamic cavitation (HC) has emerged as one of the most potential technologies for industrial-scale water treatment. The advanced rotational hydrodynamic cavitation reactors (ARHCRs) that appeared recently have shown their high effectiveness and economical efficiency compared with conventional devices. For the interaction-type ARHCRs where cavitation is generated from the interaction between the cavitation generation units (CGUs) located on the rotor and the stator, their flow field, cavitation generation mechanism, and interaction process are still not well defined. The present study experimentally and numerically investigated the cavitation flow characteristics in a representative interaction-type ARHCR which has been proposed in the past. The cavitation generation mechanism and development process, which was categorized into “coinciding”, “leaving”, and “approaching” stages, were analyzed explicitly with experimental flow visualization and computational fluid dynamics (CFD) simulations. The changes in the cavitation pattern, area ratio, and sheet cavitation length showed high periodicity with a period of 0.5 ms/cycle at a rotational speed of 3,600 rpm in the flow visualization. The experimental and CFD results indicated that sheet cavitation can be generated on the downstream sides of both the moving and the static CGUs. The sheet cavitation was induced and continuously enlarged in the “leaving” and “approaching” stages and was crushed after the moving CGUs coincided with the static CGUs. In addition, vortex cavitation was formed in the vortex center of each CGU due to high-speed rotating fluid motion. The shape and size of the vortex cavitation were determined by the compression effect produced by the interaction. The findings of this work are important for the fundamental understanding, design, and application of the ARHCRs in water treatment.
1. Introduction
Due to the growth of human population and rapid development of chemical industry, treating wastewater in an effective and clean way has been recently a significant problem worldwide [1], [2]. Hydrodynamic cavitation (HC), as a new advanced oxidation process, has been found to be highly effective for the degradation of bio-refractory wastewaters, including dye [3], pesticide [4], pharmaceutical [5], organic sulfide [6], phenol [7], cyanide [8], landfill leachate [9], bitumen [10], oil and grease [11], fuel [12], and chlorocarbon [13]. In recent years, HC has emerged and holds great potential for industrial-scale applications, because of its good scalability [14] and its synergistic effect with other methods (e.g., ultrasound [15], electrochemical [16], biological [17], oxidation [18], photocatalyst [19], or photolysis treatments [20]).
HC is a rapid phase-change phenomenon in liquid mediums in an extremely short period with huge energy releases [21]. The combination of the mechanical, thermal, and chemical effects generated during a cavitation bubble collapse is widely considered to be responsible for the removal of pollutants [22]. Because HC is artificially generated by hydrodynamic cavitation reactors (HCRs), therefore, the design of high-performance HCRs is extremely vital for the effectiveness and economical efficiency of HC technology [23]. Unlike conventional HCRs (e.g., Venturi tubes or orifice plates) which have been widely utilized on a laboratory scale [24], advanced rotational HCRs (ARHCRs) are found to yield significant effects in large numbers of scaled-up applications, such as water disinfection [25], [26], [27], [28], [29], [30], decomposition of waste-activated sludge (WAS) [31], [32], [33], [34], degradation of organic matter [35], [36], [37], biofuel synthesis [38], [39], [40], fibrillation [41], intensification of biogas production [42], and delignification [43].
Though numerous application-based work has been published on ARHCRs, the amount and depth of the fundamental research on ARHCRs are still considerably limited [44]. Even though a number of researchers have investigated the cavitation flow in ARHCRs by experimental flow visualization [27], [28], [33], [37], [41], [44], [45], [46] and computational fluid dynamics (CFD) [47], their corresponding mechanisms, especially for interaction-type reactors (i.e., cavitation is generated by the interaction motion between the rotor and stator) [33], [35], [37], [41], [44], [45], are still not well understood. Specifically, no researcher has quantitatively analyzed the cavitation development process in accordance with the visualization results. The change rule of cavitation needs to be demonstrated. From the aspect of numerical simulation, Badve, et al. [47] were the only ones to numerically investigate the internal flow field of the ARHCRs without employing any turbulence model or cavitation model. Therefore, according to our best knowledge, the cavitation generation mechanism and development process have not been clearly revealed in previous experimental or numerical studies [48]. The aforementioned deficiencies have been significantly influencing further investigations on the geometrical optimization and design of ARHCRs, as well as the development of HC technology.
In order to solve the problems above, we present here combined experimental and numerical investigations of the cavitation flow characteristics of a typical interaction-type ARHCR which has been proposed in previous studies [34], [44]. The changes in the cavitation pattern, area ratio, and sheet cavitation (SC) length resulting from the interaction of cavitation generation units (CGUs) were analyzed in accordance with the experimental flow visualization results. The cavitation generation mechanism and development process were revealed combining the flow visualization and CFD. The corresponding findings will provide strong support on the fundamental understanding, design, and application of ARHCRs to water treatment and other process intensifications.
2. Materials and methodology
2.1. Experimental methods
As shown in Fig. 1, the ARHCR is composed of a front cover, rotor, side cover, and rear cover. To artificially induce HC, a number of cone-cylinder-shaped CGUs were manufactured on the surfaces of the rotor, front cover, and rear cover in a single equally spaced radial row. Fig. 2 demonstrates a schematic representation of an open-loop experiment setup for the experimental flow visualization. The ARHCR was driven by an electrical motor with standard efficiency at 90%. The rotational speed was controlled by a frequency transformer. The water in the tank was driven by a jet pump. To visualize the internal flow field, the front cover was made of transparent acrylic with high transmittance. Cavitation phenomenon generated in the clearance flow field between the front cover and rotor was captured by a high-speed camera (IDT Vision Co., Y4-S1, a pixel size of 8.68 μm, 2,000–80,000 fps). The flow field was illuminated by two high-power white LEDs. The rotational speed and flow rate were specified to 3,600 rpm and 1.4 m3/h, respectively. To represent the complete interaction process, 500 images were continuously captured at 16,000 fps with a time interval of 0.0625 ms (i.e., from 0 to 31.25 ms). Specifics of the ARHCR and experimental setup have been published and discussed comprehensively elsewhere [44] and thus are not described in detail here. To obtain the cavitation area ratio (i.e., the ratio of cavitation area to the total area in the images) and SC length from the visualization results, the images were processed by the maximum between-class variance of pixel (Otsu) algorithm in MATLAB 2018a.
Fig. 1.

Schematic diagram of the ARHCR.
Fig. 2.

Schematic diagram of the experimental setup of the ARHCR. (PID represents proportional-integral–differential, ARHCR represents advanced rotational hydrodynamic cavitation reactor, and IPC represents industrial personal computer). 1, 15-ball valves; 2-jet pump; 3-PID control valve; 4, 13-electromagnetic flowmeters; 5, 12-temperature sensors; 6, 11-pressure sensors; 7-ARHCR and electrical motor; 8-control cabinet and frequency transformer; 9-power meter; 10-IPC and 485 hub; 14-T-port valve; 16-high speed camera.
2.2. Numerical methods
2.2.1. Governing equations
Euler-Euler approach, which mathematically treats different phases as interpenetrating continua, derives a set of equations characterized by volume fractions of each phase from conservation equations. In the mixture model, fluid and gas phases can be modeled by solving the continuity and momentum equation for the mixture, and the volume fraction equations for the secondary phases. The continuity and momentum equations for the mixture are as follows [49].
| (1) |
| (2) |
where is the mass-averaged velocity, is the mixture density, is the viscosity of the mixture, is the number of phases, is the volume fraction of phase, and is the drift velocity for secondary phase.
2.2.2. Solver setup
To reveal the cavitation flow characteristics, the commercial CFD code ANSYS Fluent 18.2 was utilized for the three-dimensional transient numerical simulation. The incompressible Navier-Stokes equations were discretized by finite volume method with double precision. The liquid–gas multiphase flow behavior was modeled by the mixture model. The flow with strong separation feature was modeled by shear stress transfer (SST) k-ω turbulence model [50] as its reasonable performance for simulating flow with strong adverse pressure gradient and separation [51]. Schnerr-Sauer model [52], which derives the exact expression for the net mass transfer from liquid to vapor, was chosen to simulate cavitating flow. Coupled scheme was utilized to couple the pressure and velocity. The momentum and volume fraction equations were discretized by QUICK scheme. The second-order upwind scheme was employed for both turbulence kinetic energy and turbulence dissipation rate equations, together with PRESTO! interpolation scheme for pressure.
To resolve the cavitation development process, five interaction cycles (0.5 ms/cycle) were conducted with a time step of 0.0625 ms which was identical to the frame rate in the experimental flow visualization (i.e., 16, 000 fps). To achieve a convergent result, a sufficient number of iterations for each time step are required. The residuals of flow and turbulent properties were used as convergence criterions. In addition, as the cavity volume varies (normally increases) as the iteration progresses, the cavity volume has been used as the convergence criterion to ensure the cavitation phenomenon is well predicted. It was found that this criterion can be achieved after 500 iterations for each time step, meanwhile, all the residuals can be reduced to less than 10-6. Therefore, the numbers of the total time step and iteration per time step were specified as 40 and 500, respectively.
2.2.3. Computational domain and boundary conditions
To accurately capture the highly unstable cavitation phenomenon in both time and space in the ARHCR, a sufficient mesh resolution of the computational domain has to be assured [53]. Because of the cyclicities in both the geometry and flow field, the interaction flow region of the CGUs between stator and rotor can be simplified to 1/32 of the full flow path (as the number of the CGUs on the rotor and each cover was 32), as demonstrated in Fig. 3. The geometry was identical to that of the real device in the experiment. To prevent the interference effect from the side walls on the flow, the length of the computational domain in the radial direction was specified as 40 mm which is four times the diameter of the CGUs. The upper part (marked in grey) was specified as the static part, while the bottom part (marked in blue) was specified as the moving part rotating clockwise at Z-axis with a rotational speed of −3,600 rpm. The distance between the rotor and cover was set to 2 mm. The surfaces of the left and right ends of each part were mutually specified as one pair of periodic conditions, respectively. All of other faces were set to walls with no-slip condition and the roughness height was assumed to be zero. The saturated vapor pressure was specified as 2064 Pa corresponding to the experiment temperature (i.e., 18 ℃). The bubble number density was specified as 109.
Fig. 3.
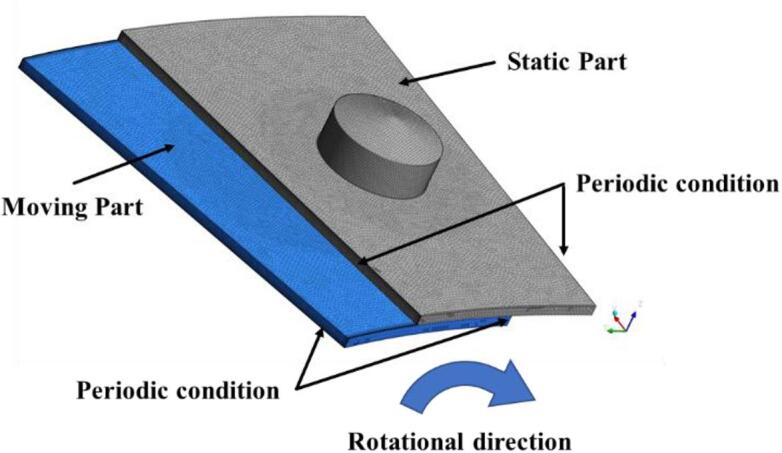
Computational domain and boundary conditions of the simplified model of the ARHCR.
Considering the advantages in the accuracy and CPU time of polyhedral grids compared with those of hexahedral and tetrahedral grids [54], the polyhedral grid with a minimum orthogonal quality of 0.2428, which was generated by ANSYS Meshing 18.2 and ANSYS Fluent 18.2, was utilized for the simplified ARHCR model. To apply the appropriate low-Reynolds number boundary condition for SST k-ω model, ten inflation layers were generated near the walls with for the first layer. Table 1 presents the results of the grid-independence test for three resolutions of mesh size at 15.875 ms. As the negligible difference in the total vapor volumes between the medium and the fine grids, the medium grid resolution was employed to predict the grid-independent simulation results with the consideration of computational efficiency and grid sensitivity.
Table 1.
Results of the grid-independence test for the simplified ARHCR model.
| Resolution | Cells | Total vapor volume (m3) |
|---|---|---|
| Coarse | 319,818 | 2.157 × 10⁻⁸ |
| Medium | 479,773 | 2.398 × 10⁻⁸ |
| Fine | 719,549 | 2.412 × 10⁻⁸ |
3. Results and discussions
3.1. Experimental flow visualization
To understand the characteristics of cavitation flows resulting from the interaction motions of the CGUs, Fig. 4 demonstrates the representative visualization results of a portion of the clearance flow field between the front cover and rotor in two interaction cycles (from 15.5625 to 16.5625 ms) with a time interval of 0.0625 ms. CGUs A and C (respectively marked in red and green) are the static CGUs located on the front cover (i.e., the stator). CGUs B and D (marked in yellow and grey, respectively) are the moving CGUs located on the rotor. The yellow and gray dash lines represent the locations of the front ends of the CGUs B and D, respectively. Because the numbers of the CGUs on the stator and rotor are identical, the relative position of each pair of the CGUs are same at any moment, therefore, the two dash lines are parallel. Due to the periodic repetition, only the flow field between the CGUs A and C was analyzed and discussed.
Fig. 4.

Experimental flow visualization of the cavitation development process from 15.5625 to 16.5625 ms. (CGU represents cavitation generation unit, CGUs A and C are located on the front cover (stator), CGUs B and D are located on the rotor, the rotational direction is clockwise).
In accordance with previous studies, the interaction process can be divided into three stages [44]: the “coinciding (Fig. 4 (h) and (p))”, “leaving (Fig. 4 (b)–(d) and (j)–(l))”, and “approaching (Fig. 4 (e)–(g) and (m)–(o)).” At 15.5625 ms (Fig. 4 (a)), the rotating CGU B started to move away from the static position of the CGU A and at 15.75 ms it reached the middle position between the CGUs A and C (Fig. 4 (d)). Then, the CGU B began to approach the CGU C and finally coincided with the CGU C at 16 ms (Fig. 4 (h)). In the whole process, the SC regions were continuously generated and enlarged in the rotational direction by the interaction between the static and moving CGUs (Fig. 4 (b)–(f)). After that, the recovery of static pressure started to destroy the existing bubbles in the clearance flow field (Fig. 4 (g)–(h)) and then, a new interaction cycle started at 16.0625 ms (Fig. 4 (i)). At 16.125 ms (Fig. 4 (j)), the SC regions generated in the previous cycle completely disappeared. In addition, vortex cavitation (VC) regions can be also observed inside the static CGUs, which are driven by the rotation of the rotor in clockwise direction. Similar experimental observations can be found in previous studies [27], [33], [45], [46]. For instance, Petkovšek, et al. [33] studied the interaction process of an interaction-type ARHCR using experimental flow visualization which was captured at 8,000 fps. The amount of the cavitation bubbles reached the maximum value when the edge of the rotor teeth just passed that of the stator teeth. It then rapidly reduced due to the pressure recovery by the rotor motion, which is identical to the current findings.
To quantitatively analyze the interaction process, Fig. 5 presents the change in the cavitation area ratio of the flow region between the CGUs A and C from 15.4375 to 17.5625 ms, which includes four complete cycles. The red points at 15.5, 16, 16.5, 17, and 17.5 ms represent the area ratios at the “coinciding” stage. It can be clearly demonstrated that the interaction process was highly periodic with an interaction cycle of 0.5 ms which is in highly accordance with the visualization results presented in Fig. 4. In each interaction cycle, area ratio rapidly increased from the “coinciding” stage to the “leaving” stage ((a)–(d)) and reached the maximum value when the moving CGUs completely left the static CGUs (d) or when it started to approach them (e). After that, it decreased considerably in the “approaching” stage ((e)–(g)) and reached the minimum value just before the “coinciding” stage. Even though the change rules of the area ratio in each cycle were highly identical, the average ratios for each cycle were different. This indicates that the generation and collapse of cavitation bubbles in the ARHCR were largely random and unpredictable.
Fig. 5.

Change in the cavitation area ratio of the flow region between CGUs A and C in visualization images from 15.4375 to 17.5625 ms.
Fig. 6 shows the change in the SC length (generated by the CGU A) in the flow region between the CGUs A and C from 15.5 to 16.125 ms. At first, the SC length decreased from 3.9 to 3.01 mm when the CGU B started to leave the CGU A (from 15.5 to 15.5625 ms (a)) and then, continuously increased to the maximum value (10.5 mm) at 15.9375 ms (g). It reduced to 6.63 mm at 16 ms (h) when the CGU B coincided with the CGU C. The change rule of the SC length in the “approaching” stage was clearly different from that of the area ratio. This is because the SC region area rapidly decreased when the CGU B started to approach the CGU C, while the front end of the SC still moved with the rotor, as shown in Fig. 4 (e)–(g) and Fig. 5. Although the cavitation development process was revealed to a certain extent using flow visualization, the details of flow mechanism are not clear, which needs to be further revealed by CFD.
Fig. 6.

Change in the sheet cavitation length (generated by CGU A) in the flow region between CGUs A and C in visualization images from 15.5 to 16.125 ms. (CFD results represent the length at the volume fraction of gas phase at 0.1).
3.2. Cavitation generation mechanism
To further study the cavitation flow characteristics of the ARHCR, five interaction cycles of the simplified flow field were numerically simulated with a time interval of 0.0625 ms. To validate the soundness of the numerical simulation, the predicted changes in the SC length (generated by the CGU A) in the flow region between the CGUs A and C are compared with experimental data, as shown in Fig. 6. The numerical simulation well predicted the change rule of the SC length in the visualization. In addition, the numerically predicted SC length well matched the experiment in the “coinciding” and “leaving” stages. The underpredicted SC length in the “approaching” stage may because that the simplified model is a closed flow field without inlet or outlet. The static pressure of the clearance flow field can be prematurely recovered, which limited the further development of the SC. Nevertheless, the good correlation between the numerical and experimental results indicated that the present numerical method is able to accurately capture the nature of the cavitation phenomenon in the ARHCR. Before analyzing the whole interaction process, which is described in section 3.3, the flow field and cavitation generation mechanism have to be first demonstrated.
Fig. 7 presents the velocity and pressure distributions on the middle plane of the CGUs A and B at 15.5625 ms. Because of the periodic condition, the flow field of the static part can stand for either the CGU A or C. Due to viscosity, the fluid in both the static and moving parts was driven by the rotor wall and the flow direction was identical to the rotational direction, as shown in the velocity and vector distributions in the stationary (absolute) reference frame (Fig. 7 (a)). To better understand the flow field, Fig. 7 (b) illustrates the velocity and vector distributions on the middle plane in the relative reference frame. Compared with Fig. 7 (a), the distributions in the static part remained the same, while the absolute velocity vectors in the moving part were converted into the relative velocity vectors regarding the moving reference frame (with a rotational speed of −3600 rpm). The fluid in the static part was split into two parts. Specifically, one portion with an incoming velocity of over 30 m/s, which is far lower than the local linear velocity of the rotor (i.e., 46 m/s), went into the CGU A and formed a vortex inside the CGU (Vortex 1) and the other passed through the Vortex 1 and punched the downstream edge of the CGU A. The impact flow was suddenly veered and accelerated from approximately 20 (i.e., impact velocity) to 30 m/s and then formed the Separation region 1 on the downstream side. In addition, the Vortex 1 almost took up the whole space of the CGU A and largely influenced the flow passing through the vortex.
Fig. 7.

Velocity and pressure distributions on the middle plane of CGUs A and B at 15.5625 ms: (a) velocity distribution in stationary (absolute) reference frame, (b) velocity distribution in relative reference frame, and (c) static pressure distribution (The iso-surfaces in grey color represent cavitation patterns with the volume fraction of gas phase at 0.1).
As for the moving part, because the absolute flow velocity was much lower than that of the rotor motion, a reverse flow (i.e., anti-clockwise direction) with an incoming velocity of approximately 35 m/s (referred to the rotor in the relative reference frame) was formed. Similar to the flow field in the static part, the Vortex 2 and Separation region 2 were induced both inside the CGU B and on its downstream side. Compared with the Vortex 1, the Vortex 2 was highly twisted with a lower height and a higher vortex velocity, as a result of the combination of the push effect generated by the downstream wall of the CGU B with a high rotating speed and the compression effect from the Vortex 1. These effects largely interrupted the flow passing through the Vortex 2, that is, the flow velocity was reduced approximately from 35 to 12 m/s during the process. In addition, the compression effect between the two vortexes can influence the impact intensity. With increasing compression effect, the impact velocity and separation region can be enlarged. Therefore, the flow field and the separation intensity may vary due to the location variation of the two CGUs.
According to Bernoulli’s principle, an increasing flow velocity causes a lower static pressure. When the pressure becomes lower than the local saturated vapor pressure, cavitation bubbles can grow from cavitation nuclei as their internal pressure overcomes surface tension. Fig. 7 (c) presents the static pressure distribution on the middle plane at 15.5625 ms. Each low-pressure region with the static pressure as low as 10-5 Pa was formed on the downstream CGUs A and B (i.e., Separation regions 1 and 2 in Fig. 7 (b)). As a result, each separating flow induced a crescent-shaped SC region, which generally appears on a solid surface in liquids where a wall-flow reversal or boundary layer separation is located. The appearance of the crescent-shaped SC region was caused by adverse pressure gradients. Moreover, each VC region appeared at each vortex center where the local static pressure was lower than the statured vapor pressure due to the high-speed rotating of the fluid (the two VC regions located near the rotational centers in the CGUs A and B). In addition, each high-pressure region (marked in red) appeared at the bottom of the downstream wall of the CGU B and on the top of the downstream wall of the CGU A, respectively, resulting from the impact of the incoming flow driven by the rotor.
The numerical results overturned our previous conjecture (Sun, et al. [27]) which claimed that the relative flow direction in the moving part is identical to the rotational direction. Moreover, the results explained why the distance between rotor and stator can largely affect ARHCR performance. The effect of the distance was demonstrated by Petkovšek, et al. [33] who found that the soluble chemical oxidation demand increased from 450.7 to 601.3 mg/L by reducing the distance from 3.5 to 0.8 mm at the same rotational speed and pass during WAS treatment. In addition, the pressure amplitudes were measured as 0.7 bar at a distance of 3.5 mm, while in the case with the distance at 0.8 mm the pressure amplitudes rose to 1.7 bar. According to the numerical results, reducing the distance can lead to a more violent compression interaction between the two dominant vortexes, and consequently, higher impact and vortex intensities can be achieved. Furthermore, the results also elucidated why the rotational speed can dominant the performance of ARHCRs, as confirmed in many previous studies [27], [34], [36], [40], [41], [42], [43], [44], [46]. Increasing rotational speeds can lead to higher impact and vortex velocities, and consequently, higher separation and vortex intensities. The detailed explanation of influence mechanisms of rotational speed on cavitation can be found in our previous review [48].
Because cavitation is generated by the dominating vortexes and flow separations during the interaction process, the shape (e.g., cylindrical, spherical, or even some irregular shapes), geometrical factor (e.g., depth, diameter, or inclination angle), and arrangement mode (e.g., arranging density, number of columns, or column space) of the CGUs are vital for the cavitation generation. Further studies are needed to evaluate the impacts of the CGU geometrical structure on the overall performance of ARHCRs.
3.3. Cavitation development process
To reveal the cavitation development process, Fig. 8 demonstrates the numerical and experimental results of a portion of the flow field from 15.5625 to 16.0625 ms. Fig. 8 I shows the top view of the numerical results, where the rotor and front cover were marked respectively in blue and grey colors, for the flow field corresponding to the visualization experiment. The numerical results were compared with the visualization results (Fig. 8 II). To clearly demonstrate the whole process, a bird’s-eye view of the cavitation pattern with the static pressure distribution of the rotor wall was presented on the right side (Fig. 8 III). Cavitation patterns in each time step were represented by the iso-surfaces in grey color with the volume fraction of gas phase at 0.1. In the whole process, the cavitation patterns predicted by numerical simulation agreed reasonably well with the experimental observations in both time and space, which validated the numerical method utilized in this study. Due to the periodic repetition, only the flow field between the CGUs A and C was analyzed and discussed. In addition, to better describe the generation mechanism, Fig. 9 presents the change in the static pressure of the middle plane from 15.5625 to 16.0625 ms.
Fig. 8.

Cavitation phenomenon generated by the CGUs during one interaction cycle from 15.5625 to 16.0625 ms (a-i). (I): numerical top view (rotor: blue, stator: grey), (II): experimental flow visualization, (III): numerical bird’s-eye view with a static pressure distribution of the rotor surface (stator: grey). The iso-surfaces in grey color in (I) and (III) represent cavitation patterns with the volume fraction of gas phase at 0.1.
Fig. 9.

Change in the static pressure distribution on the mid-plane of the CGUs during one interaction cycle from 15.5625 to 16.0625 ms (a-i). The iso-surfaces in grey color represent cavitation patterns with the volume fraction of gas phase at 0.1.
At 15.5625 ms (Fig. 8 (a) II), a large number of cavitation bubbles generated in or above the CGU B. The bubbles corresponded to the superimposition of the VC generated in the CGU B (VCB, lower) and the SC of the CGU A (SCA, upper) on the top view. This can be confirmed by the numerical results as illustrated in Fig. 8 (a) I and III. In addition, due to the refraction and reflection of water, the cavitation pattern inside the CGU A (Fig. 8 (a) II) was not clearly identified. However, the shape of the VC generated in the CGU C (VCC) can be both clearly observed in Fig. 8 (a) II and (b) II. According to the numerical results (Fig. 8 (a) I and (a) II), the VC and SC regions inside the CGUs A and C also overlapped as seen from the top view. After 15.5625 ms, the SCA and SC of the CGU B (SCB) continuously elongated in the tangential direction without any interaction, their shapes changed from crescent to slender triangle accompanied by the clockwise rotation of the rotor (Fig. 8 (b) and (c)). This is because when the CGU B left the CGU A, the compression effect between the fluids driven by the downstream walls of each CGU was continuously enhanced. As a result, separation regions formed on each downstream side and their areas grew larger and larger, as shown in Fig. 9 (b) and (c). The interaction location and intensity of the two CGUs can be identified by the location and legend of the high-pressure regions (marked in red) in Fig. 8 III and Fig. 9, respectively. For the whole interaction process we can conclude that the cavitation intensity was enhanced with a higher pressure in the interaction region. This led to a longer length of SC. On the other hand, the sizes of the VC generated in the CGU A (VCA) and VCB increased during 15.625 to 15.6875 ms, because the compression effect between the two vortexes became weaker and consequently, resulted in lower static pressures in each vortex center (Fig. 9 (c)). In addition, a gap between the VCB and SCA can be observed in Fig. 8 (c) II, demonstrating that these two cavitation regions were physically separated as predicted by numerical simulation.
At 15.75 ms (Fig. 8 (d)), the CGU B started to approach the CGU C. In this stage, the interaction effect in the “leaving” stage was replaced by the interaction effect between the two downstream walls of the CGUs B and C. The flow visualization results show that the SCA and SCB continuously extended (Fig. 8 (d) II and (e) II) and an “hourglass”-shaped cavitation region was formed at 15.875 ms (Fig. 8 (f) II). This process was accurately modeled by numerical simulation. From 15.75 to 15.8125 ms, the impact velocity became larger accompanied by the approach motion, therefore, two larger low-pressure regions formed on each downstream side (Fig. 9 (d) and (e)). From 15.875 ms, the static pressure of the clearance flow field between the rotor and stator started to recover (Fig. 9 (f)), and hence, both the lengths and thicknesses of the SCA and SCB began to reduce. In addition, the VCA and VCC continuously shrank from 15.75 ms (Fig. 8 (d)) to 15.875 ms (Fig. 8 (f)). This is because that the increase in the compression effect between the two vortexes led to the pressure recovery in each vortex core, which can squeeze the existing cavitation bubbles.
At 15.9375 ms, the CGU B coincided with the CGU C. The “hourglass” was further stretched and the dimensions of the SCA and SCB were reduced. A gap in the middle of the “hourglass” can be observed (Fig. 8 (g) II), because of the further pressure recovery in the clearance area (Fig. 9 (g)). At 16 ms, the CGU B started to leave the CGU C, the lengths of the SCA and SCB significantly decreased and the lower part of the “hourglass” totally disappeared (Fig. 8 (h) II). At this moment, the static pressure of the clearance reached its maximum value (Fig. 9 (h)) and most of the formed cavitation bubbles in the clearance area were suddenly crushed. Meanwhile, a number of new bubbles were generated on each downstream side of the CGUs C and B by the rotor–stator interaction, which represents a new start of an interaction cycle.
4. Conclusions
In this study, the cavitation flow characteristics in the interaction-type ARHCR were investigated by combining experimental flow visualization and computational fluid dynamics. Our findings are as follows.
-
•
Cavitation phenomenon was periodically induced and destroyed in the clearance flow field in the ARHCR by the periodic motion of the CGUs located on the stator and rotor (i.e., the “coinciding”, “leaving”, and “approaching” stages).
-
•
The cavitation development process showed strong periodicity with a period of 0.5 ms/cycle at a rotational speed of 3,600 rpm.
-
•
VC was generated at the vortex centers of the moving and static CGUs. Its intensity increased in the “leaving” stage and decreased in the “approaching” stage.
-
•
SC was induced in the flow separation regions of the downstream moving and static CGUs. It was continuously extending from the beginning of the “leaving” stage and completely disappeared after the “coinciding” stage.
The above findings provide a sound basis for fundamental understanding, design, and application of ARHCRs in water treatment as well as in other applications. Detailed flow visualizations, structural optimizations, and CFD method developments for full-scale model are needed in future.
CRediT authorship contribution statement
Xun Sun: Investigation, Methodology, Writing - original draft. Xiaoxu Xuan: Investigation. Yongxing Song: Formal analysis. Xiaoqi Jia: Software. Li Ji: Writing - review & editing. Shan Zhao: Writing - review & editing. Joon Yong Yoon: Writing - review & editing. Songying Chen: Supervision. Jingting Liu: Writing - review & editing. Guichao Wang: Conceptualization, Writing - review & editing.
Declaration of Competing Interest
The authors declare that they have no known competing financial interests or personal relationships that could have appeared to influence the work reported in this paper.
Acknowledgments
This work was supported by the National Natural Science Foundation of China (grant no. 51906125); China Postdoctoral Science Foundation (grant nos. 2020T130364, 2019M650162); Youth Interdisciplinary Science and Innovative Research Groups of Shandong University (grant no. 2020QNQT014); Young Scholars Program of Shandong University; Fundamental Research Funds of Shandong University (grant nos. 2019HW027, 2019HW041, 2018GN033); Key Laboratory of High-efficiency and Clean Mechanical Manufacture at Shandong University, Ministry of Education; and Ocean industry leading talent team of Yantai’s Double Hundred Plan.
Footnotes
Supplementary data to this article can be found online at https://doi.org/10.1016/j.ultsonch.2020.105311.
Contributor Information
Xun Sun, Email: xunsun@sdu.edu.cn.
Xiaoxu Xuan, Email: xiaoxuxuan@sdu.edu.cn.
Yongxing Song, Email: songyongxing19@sdjzu.edu.cn.
Xiaoqi Jia, Email: jiaxq@zstu.edu.cn.
Li Ji, Email: liji@sdu.edu.cn.
Shan Zhao, Email: szhao@sdu.edu.cn.
Joon Yong Yoon, Email: joyoon@hanyang.ac.kr.
Songying Chen, Email: chensy66@sdu.edu.cn.
Jingting Liu, Email: liujingting@sdu.edu.cn.
Guichao Wang, Email: wanggc@sdu.edu.cn.
Appendix A. Supplementary data
The following are the Supplementary data to this article:
References
- 1.Xu X., Yang T., Zhang Q., Xia W., Ding Z., Eid K., Abdullah A.M., Shahriar M., Hossain A., Zhang S., Tang J., Pan L., Yamauchi Y. Ultrahigh capacitive deionization performance by 3D interconnected MOF-derived nitrogen-doped carbon tubes. Chem. Eng. J. 2020;124493 doi: 10.1016/j.cej.2020.124493. [DOI] [Google Scholar]
- 2.Xu X., Tang J., Kaneti Y.V., Tan H., Chen T., Pan L., Yang T., Bando Y., Yamauchi Y. Unprecedented capacitive deionization performance of interconnected iron–nitrogen-doped carbon tubes in oxygenated saline water. Mater. Horiz. 2020 doi: 10.1039/C9MH01829H. [DOI] [Google Scholar]
- 3.Li G., Yi L., Wang J., Song Y. Hydrodynamic cavitation degradation of Rhodamine B assisted by Fe3+-doped TiO2: Mechanisms, geometric and operation parameters. Ultrason. Sonochem. 2020;60 doi: 10.1016/j.ultsonch.2019.104806. [DOI] [PubMed] [Google Scholar]
- 4.Panda D., Manickam S. Hydrodynamic cavitation assisted degradation of persistent endocrine-disrupting organochlorine pesticide Dicofol: Optimization of operating parameters and investigations on the mechanism of intensification. Ultrason. Sonochem. 2019;51:526–532. doi: 10.1016/j.ultsonch.2018.04.003. [DOI] [PubMed] [Google Scholar]
- 5.Rajoriya S., Bargole S., George S., Saharan V.K., Gogate P.R., Pandit A.B. Synthesis and characterization of samarium and nitrogen doped TiO2 photocatalysts for photo-degradation of 4-acetamidophenol in combination with hydrodynamic and acoustic cavitation. Sep. Purif. Technol. 2019;209:254–269. doi: 10.1016/j.seppur.2018.07.036. [DOI] [Google Scholar]
- 6.Gągol M., Soltani R.D.C., Przyjazny A., Boczkaj G. Effective degradation of sulfide ions and organic sulfides in cavitation-based advanced oxidation processes (AOPs) Ultrason. Sonochem. 2019;58 doi: 10.1016/j.ultsonch.2019.05.027. [DOI] [PubMed] [Google Scholar]
- 7.Choi J., Cui M., Lee Y., Kim J., Son Y., Khim J. Hydrodynamic cavitation and activated persulfate oxidation for degradation of bisphenol A: Kinetics and mechanism. Chem. Eng. J. 2018;338:323–332. doi: 10.1016/j.cej.2018.01.018. [DOI] [Google Scholar]
- 8.Jawale R.H., Gogate P.R. Novel approaches based on hydrodynamic cavitation for treatment of wastewater containing potassium thiocyanate. Ultrason. Sonochem. 2019;52:214–223. doi: 10.1016/j.ultsonch.2018.11.019. [DOI] [PubMed] [Google Scholar]
- 9.Bis M., Montusiewicz A., Ozonek J., Pasieczna-Patkowska S. Application of hydrodynamic cavitation to improve the biodegradability of mature landfill leachate. Ultrason. Sonochem. 2015;26:378–387. doi: 10.1016/j.ultsonch.2015.03.003. [DOI] [PubMed] [Google Scholar]
- 10.Boczkaj G., Gągol M., Klein M., Przyjazny A. Effective method of treatment of effluents from production of bitumens under basic pH conditions using hydrodynamic cavitation aided by external oxidants. Ultrason. Sonochem. 2018;40:969–979. doi: 10.1016/j.ultsonch.2017.08.032. [DOI] [PubMed] [Google Scholar]
- 11.Doltade S.B., Dastane G.G., Jadhav N.L., Pandit A.B., Pinjari D.V., Somkuwar N., Paswan R. Hydrodynamic cavitation as an imperative technology for the treatment of petroleum refinery effluent. J. Water Process Eng. 2019;29 doi: 10.1016/j.jwpe.2019.02.008. [DOI] [Google Scholar]
- 12.Torabi Angaji M., Ghiaee R. Decontamination of unsymmetrical dimethylhydrazine waste water by hydrodynamic cavitation-induced advanced Fenton process. Ultrason. Sonochem. 2015;23:257–265. doi: 10.1016/j.ultsonch.2014.09.007. [DOI] [PubMed] [Google Scholar]
- 13.Wu Z., Cravotto G., Ondruschka B., Stolle A., Li W. Decomposition of chloroform and succinic acid by ozonation in a suction-cavitation system: effects of gas flow. Sep. Purif. Technol. 2016;161:25–31. doi: 10.1016/j.seppur.2016.01.031. [DOI] [Google Scholar]
- 14.Dular M., Griessler-Bulc T., Gutierrez-Aguirre I., Heath E., Kosjek T., Krivograd Klemenčič A., Oder M., Petkovšek M., Rački N., Ravnikar M., Šarc A., Širok B., Zupanc M., Žitnik M., Kompare B. Use of hydrodynamic cavitation in (waste)water treatment. Ultrason. Sonochem. 2016;29:577–588. doi: 10.1016/j.ultsonch.2015.10.010. [DOI] [PubMed] [Google Scholar]
- 15.Bagal M.V., Gogate P.R. Degradation of diclofenac sodium using combined processes based on hydrodynamic cavitation and heterogeneous photocatalysis. Ultrason. Sonochem. 2014;21:1035–1043. doi: 10.1016/j.ultsonch.2013.10.020. [DOI] [PubMed] [Google Scholar]
- 16.Jung K.-W., Park D.-S., Hwang M.-J., Ahn K.-H. Decolorization of Acid Orange 7 by an electric field-assisted modified orifice plate hydrodynamic cavitation system: Optimization of operational parameters. Ultrason. Sonochem. 2015;26:22–29. doi: 10.1016/j.ultsonch.2015.02.010. [DOI] [PubMed] [Google Scholar]
- 17.Thanekar P., Murugesan P., Gogate P.R. Improvement in biological oxidation process for the removal of dichlorvos from aqueous solutions using pretreatment based on Hydrodynamic Cavitation. J. Water Process Eng. 2018;23:20–26. doi: 10.1016/j.jwpe.2018.03.004. [DOI] [Google Scholar]
- 18.Cai M., Su J., Zhu Y., Wei X., Jin M., Zhang H., Dong C., Wei Z. Decolorization of azo dyes Orange G using hydrodynamic cavitation coupled with heterogeneous Fenton process. Ultrason. Sonochem. 2016;28:302–310. doi: 10.1016/j.ultsonch.2015.08.001. [DOI] [PubMed] [Google Scholar]
- 19.Tao Y., Cai J., Huai X., Liu B. A novel antibiotic wastewater degradation technique combining cavitating jets impingement with multiple synergetic methods. Ultrason. Sonochem. 2018;44:36–44. doi: 10.1016/j.ultsonch.2018.02.008. [DOI] [PubMed] [Google Scholar]
- 20.Thanekar P., Panda M., Gogate P.R. Degradation of carbamazepine using hydrodynamic cavitation combined with advanced oxidation processes. Ultrason. Sonochem. 2018;40:567–576. doi: 10.1016/j.ultsonch.2017.08.001. [DOI] [PubMed] [Google Scholar]
- 21.Zhang Y., Tian Y., Zhang Z., Lin S. Experimental and numerical study of cavitating flow with suction in a mixing reactor for water treatment. Chem. Eng. J. 2018;353:796–804. doi: 10.1016/j.cej.2018.07.183. [DOI] [Google Scholar]
- 22.Rajoriya S., Carpenter J., Saharan Virendra K., Pandit Aniruddha B. Hydrodynamic cavitation: an advanced oxidation process for the degradation of bio-refractory pollutants. Rev. Chem. Eng. 2016;32:379–411. doi: 10.1515/revce-2015-0075. [DOI] [Google Scholar]
- 23.Sun X., Chen S., Liu J., Zhao S., Yoon J.Y. Hydrodynamic Cavitation: A Promising Technology for Industrial-Scale Synthesis of Nanomaterials. Front. Chem. 2020;8 doi: 10.3389/fchem.2020.00259. [DOI] [PMC free article] [PubMed] [Google Scholar]
- 24.Zezulka Š., Maršálková E., Pochylý F., Rudolf P., Hudec M., Maršálek B. High-pressure jet-induced hydrodynamic cavitation as a pre-treatment step for avoiding cyanobacterial contamination during water purification. J. Environ. Manage. 2020;255 doi: 10.1016/j.jenvman.2019.109862. [DOI] [PubMed] [Google Scholar]
- 25.Milly P.J., Toledo R.T., Harrison M.A., Armstead D. Inactivation of Food Spoilage Microorganisms by Hydrodynamic Cavitation to Achieve Pasteurization and Sterilization of Fluid Foods. J. Food Sci. 2007;72:M414–M422. doi: 10.1111/j.1750-3841.2007.00543.x. [DOI] [PubMed] [Google Scholar]
- 26.Milly P.J., Toledo R.T., Kerr W.L., Armstead D. Hydrodynamic Cavitation: Characterization of a Novel Design with Energy Considerations for the Inactivation of Saccharomyces cerevisiae in Apple Juice. J. Food Sci. 2008;73:M298–M303. doi: 10.1111/j.1750-3841.2008.00827.x. [DOI] [PubMed] [Google Scholar]
- 27.Sun X., Park J.J., Kim H.S., Lee S.H., Seong S.J., Om A.S., Yoon J.Y. Experimental investigation of the thermal and disinfection performances of a novel hydrodynamic cavitation reactor. Ultrason. Sonochem. 2018;49:13–23. doi: 10.1016/j.ultsonch.2018.02.039. [DOI] [PubMed] [Google Scholar]
- 28.Šarc A., Kosel J., Stopar D., Oder M., Dular M. Removal of bacteria Legionella pneumophila, Escherichia coli, and Bacillus subtilis by (super)cavitation. Ultrason. Sonochem. 2018;42:228–236. doi: 10.1016/j.ultsonch.2017.11.004. [DOI] [PubMed] [Google Scholar]
- 29.Maršálek B., Zezulka Š., Maršálková E., Pochylý F., Rudolf P. Synergistic effects of trace concentrations of hydrogen peroxide used in a novel hydrodynamic cavitation device allows for selective removal of cyanobacteria. Chem. Eng. J. 2020;382 doi: 10.1016/j.cej.2019.122383. [DOI] [Google Scholar]
- 30.Kosel J., Gutiérrez-Aguirre I., Rački N., Dreo T., Ravnikar M., Dular M. Efficient inactivation of MS-2 virus in water by hydrodynamic cavitation. Water Res. 2017;124:465–471. doi: 10.1016/j.watres.2017.07.077. [DOI] [PubMed] [Google Scholar]
- 31.Kim H., Sun X., Koo B., Yoon J.Y. Experimental Investigation of Sludge Treatment Using a Rotor-Stator Type Hydrodynamic Cavitation Reactor and an Ultrasonic Bath. Processes. 2019;7 doi: 10.3390/pr7110790. [DOI] [Google Scholar]
- 32.Sežun M., Kosel J., Zupanc M., Hočevar M., Vrtovšek J., Petkovšek M., Dular M. Cavitation as a Potential Technology for Wastewater Management – An Example of Enhanced Nutrient Release from Secondary Pulp and Paper Mill Sludge. Strojniški vestnik – J. Mechan. Eng. 2019;65:9. doi: 10.5545/sv-jme.2019.6328. [DOI] [Google Scholar]
- 33.Petkovšek M., Mlakar M., Levstek M., Stražar M., Širok B., Dular M. A novel rotation generator of hydrodynamic cavitation for waste-activated sludge disintegration. Ultrason. Sonochem. 2015;26:408–414. doi: 10.1016/j.ultsonch.2015.01.006. [DOI] [PubMed] [Google Scholar]
- 34.Kim H., Koo B., Sun X., Yoon J.Y. Investigation of sludge disintegration using rotor-stator type hydrodynamic cavitation reactor. Sep. Purif. Technol. 2020;240 doi: 10.1016/j.seppur.2020.116636. [DOI] [Google Scholar]
- 35.Zupanc M., Kosjek T., Petkovšek M., Dular M., Kompare B., Širok B., Stražar M., Heath E. Shear-induced hydrodynamic cavitation as a tool for pharmaceutical micropollutants removal from urban wastewater. Ultrason. Sonochem. 2014;21:1213–1221. doi: 10.1016/j.ultsonch.2013.10.025. [DOI] [PubMed] [Google Scholar]
- 36.Badve M., Gogate P., Pandit A., Csoka L. Hydrodynamic cavitation as a novel approach for wastewater treatment in wood finishing industry. Sep. Purif. Technol. 2013;106:15–21. doi: 10.1016/j.seppur.2012.12.029. [DOI] [Google Scholar]
- 37.Kosel J., Šuštaršič M., Petkovšek M., Zupanc M., Sežun M., Dular M. Application of (super)cavitation for the recycling of process waters in paper producing industry. Ultrason. Sonochem. 2020;64 doi: 10.1016/j.ultsonch.2020.105002. [DOI] [PubMed] [Google Scholar]
- 38.Chipurici P., Vlaicu A., Calinescu I., Vinatoru M., Vasilescu M., Ignat N.D., Mason T.J. Ultrasonic, hydrodynamic and microwave biodiesel synthesis – A comparative study for continuous process. Ultrason. Sonochem. 2019;57:38–47. doi: 10.1016/j.ultsonch.2019.05.011. [DOI] [PubMed] [Google Scholar]
- 39.Mohod A.V., Gogate P.R., Viel G., Firmino P., Giudici R. Intensification of biodiesel production using hydrodynamic cavitation based on high speed homogenizer. Chem. Eng. J. 2017;316:751–757. doi: 10.1016/j.cej.2017.02.011. [DOI] [Google Scholar]
- 40.Kovačič A., Škufca D., Zupanc M., Gostiša J., Bizjan B., Krištofelc N., Dolenc M.S., Heath E. The removal of bisphenols and other contaminants of emerging concern by hydrodynamic cavitation: From lab-scale to pilot-scale. Sci. Total Environ. 2020;743 doi: 10.1016/j.scitotenv.2020.140724. [DOI] [PubMed] [Google Scholar]
- 41.Kosel J., Šinkovec A., Dular M. A novel rotation generator of hydrodynamic cavitation for the fibrillation of long conifer fibers in paper production. Ultrason. Sonochem. 2019;59 doi: 10.1016/j.ultsonch.2019.104721. [DOI] [PubMed] [Google Scholar]
- 42.Patil P.N., Gogate P.R., Csoka L., Dregelyi-Kiss A., Horvath M. Intensification of biogas production using pretreatment based on hydrodynamic cavitation. Ultrason. Sonochem. 2016;30:79–86. doi: 10.1016/j.ultsonch.2015.11.009. [DOI] [PubMed] [Google Scholar]
- 43.Badve M.P., Gogate P.R., Pandit A.B., Csoka L. Hydrodynamic cavitation as a novel approach for delignification of wheat straw for paper manufacturing. Ultrason. Sonochem. 2014;21:162–168. doi: 10.1016/j.ultsonch.2013.07.006. [DOI] [PubMed] [Google Scholar]
- 44.Sun X., Jia X., Liu J., Wang G., Zhao S., Ji L., Yong Yoon J., Chen S. Investigation on the Characteristics of an Advanced Rotational Hydrodynamic Cavitation Reactor for Water Treatment. Sep. Purif. Technol. 2020 doi: 10.1016/j.seppur.2020.117252. [DOI] [Google Scholar]
- 45.Kwon W.C., Yoon J.Y. Experimental study of a cavitation heat generator. Proc. Inst. Mech. Eng, Part E. 2013;227:67–73. doi: 10.1177/0954408912451535. [DOI] [Google Scholar]
- 46.Sun X., Kang C.H., Park J.J., Kim H.S., Om A.S., Yoon J.Y. An experimental study on the thermal performance of a novel hydrodynamic cavitation reactor. Exp. Therm Fluid Sci. 2018;99:200–210. doi: 10.1016/j.expthermflusci.2018.02.034. [DOI] [Google Scholar]
- 47.Badve M.P., Alpar T., Pandit A.B., Gogate P.R., Csoka L. Modeling the shear rate and pressure drop in a hydrodynamic cavitation reactor with experimental validation based on KI decomposition studies. Ultrason. Sonochem. 2015;22:272–277. doi: 10.1016/j.ultsonch.2014.05.017. [DOI] [PubMed] [Google Scholar]
- 48.Sun X., Liu J., Ji L., Wang G., Zhao S., Yoon J.Y., Chen S. A review on hydrodynamic cavitation disinfection: The current state of knowledge. Sci. Total Environ. 2020;139606 doi: 10.1016/j.scitotenv.2020.139606. [DOI] [PubMed] [Google Scholar]
- 49.ANSYS, ANSYS Fluent 18.2 theory guide, 2017.
- 50.Menter F.R. Two-Equation Eddy-Viscosity Turbulence Models for Engineering Applications. AIAA J. 1994;8:8. doi: 10.2514/3.12149. [DOI] [Google Scholar]
- 51.Menter F., Kuntz M., Langtry R.B. Ten years of industrial experience with the SST turbulence model. Turbulence, Heat Mass Transfer. 2003;4:8. [Google Scholar]
- 52.G. Schnerr Professor Dr.-Ing.habil, Physical and Numerical Modeling of Unsteady Cavitation Dynamics, in: 4th International Conference on Multiphase Flow, New Orleans, La, USA, 2001.
- 53.Wang G., Ge L., Mitra S., Evans G.M., Joshi J.B., Chen S. A review of CFD modelling studies on the flotation process. Miner. Eng. 2018;127:153–177. doi: 10.1016/j.mineng.2018.08.019. [DOI] [Google Scholar]
- 54.Sun X., Kim S., Yang S.D., Kim H.S., Yoon J.Y. Multi-objective optimization of a Stairmand cyclone separator using response surface methodology and computational fluid dynamics. Powder Technol. 2017;320:51–65. doi: 10.1016/j.powtec.2017.06.065. [DOI] [Google Scholar]
Associated Data
This section collects any data citations, data availability statements, or supplementary materials included in this article.