

Abstract
Diffuse correlation spectroscopy (DCS) can non-invasively and continuously asses regional cerebral blood flow (rCBF) at the cot-side by measuring a blood flow index (BFI) in non-traditional units of cm2/s. We have validated DCS against positron emission tomography using 15O-labeled water (15O-water PET) in a piglet model allowing us to derive a conversion formula for BFI to rCBF in conventional units (ml/100g/min). Neonatal piglets were continuously monitored by the BabyLux device integrating DCS and time resolved near infrared spectroscopy (TRS) while acquiring 15O-water PET scans at baseline, after injection of acetazolamide and during induced hypoxic episodes. BFI by DCS was highly correlated with rCBF (R = 0.94, p < 0.001) by PET. A scaling factor of 0.89 (limits of agreement for individual measurement: 0.56, 1.39)×109× (ml/100g/min)/(cm2/s) was used to derive baseline rCBF from baseline BFI measurements of another group of piglets and of healthy newborn infants showing an agreement with expected values. These results pave the way towards non-invasive, cot-side absolute CBF measurements by DCS on neonates.
Keywords: Cerebral blood flow, PET, diffuse correlation spectroscopy, near-infrared spectroscopy, continuous neuro-monitoring
Introduction
Cerebral tissue requires an appropriate amount of oxygen in order to sustain its metabolic activities. In many pathological conditions, this is compromised leading rapidly to permanent damage. Therefore, the continuous monitoring of local oxygen delivery and consumption is considered relevant for the clinical management of different conditions.1 One important patient group is that of the preterm newborns who tend to suffer episodes of cerebral haemodynamic instability during the first hours and days of life.2 These episodes may cause brain injury to affect neurodevelopment and lead to disabilities. It is hypothesized that the intensive care of these babies should be brain oriented and adapted to the infant cerebral well-being, in particular, targeting optimal levels of the cerebral perfusion.3 This is currently done based on surrogate measures because a non-invasive, continuous cerebral perfusion monitor is not available.4
Despite its relative unavailability, the most accurate and accepted measurement of regional cerebral blood flow (rCBF) is obtained with positron emission tomography (PET) using 15O-labeled water (H215O) as a free diffusible tracer.5,6 This technique delivers robust rCBF distribution measurements and may be repeated multiple times in the same scan session because of the short 2 min half-life of the tracer. Unfortunately, the same short half-life of the tracer implies that on-site tracer production is required. This means that availability is limited to few specialized centers around the world and that the technique is costly for experimental and routine clinical use. Despite recent improvements allowing quantitative neonatal PET rCBF measurement with a relatively small injected H215O dose,7 exposure to ionizing radiation to developing infants is an additional source of concern. In clinical practice, patient management is challenging due to the transport out of intensive care unit and the need for monitoring and stabilization for a prolonged period of time. Collectively, these limitations in the newborn infant makes this modality better suited as a gold-standard for validation and scientific studies rather than for routine clinical use.
A potential candidate for continuous, cot-side monitoring of the perfusion to the brain is diffuse correlation spectroscopy (DCS).8–11 DCS is a relatively recent technique which employs near-infrared light (NIR) to measure the local blood flow in the microvasculature of the tissue. Due to the relatively low absorption rate of the NIR light in most tissues as compared to its rate of scattering, NIR light can travel few centimeters down into the tissue and be eventually re-emitted at the tissue surface.11 In particular, DCS measures the intensity fluctuations of a diffuse laser speckle which is altered due to the movement of the moving scatterers, mainly red blood cells.8,9 DCS is non-invasive, relatively in-expensive and provides continuous measurements. Furthermore, it has been validated towards several technologies and in different target populations.10 It is especially well suited for cot-side monitoring of the infant brain,12–21 thanks to the thin scalp and skull of this population. The physical models utilized to analyze DCS data use an effective Brownian diffusion coefficient of red blood cells, referred to as blood flow index (BFI), which has units of cm2/s and is proportional to the blood flow in the tissue microvasculature. DCS measured BFI is yet to be thoroughly calibrated for conversion to traditional, absolute CBF units (ml/100g/min) while indirect calibrations have demonstrated its potential.16,19,22
The goal of this study was to validate DCS against 15O-water PET on a neonatal piglet model. Regional CBF (rCBF) was concurrently measured on neonatal piglets by DCS and 15O-water PET during a protocol with acetazolamide injection and hypoxic challenges in order to explore a range of CBF values. The study was undertaken in parallel to the BabyLux project (http://www.babylux-project.eu/)23 which has developed the so-called ‘BabyLux device’ employing DCS and time-resolved near-infrared spectroscopy (TRS, microvascular blood oxygen saturation and optical properties). By analyzing the concurrent DCS and PET measurements, we have investigated whether the BFI by DCS was correlated with rCBF by 15O-water PET. A conversion formula to translate individual, as opposed to a group based conversion, BFI measurements (cm2/s) into flow units (ml/100g/min) was derived from this group of piglets. This formula was then used to convert individual BFI measurements from another group of piglets of the same age and breed. It was, in addition, applied to baseline haemodynamic measurements of healthy term newborns, also measured by the BabyLux device.
Materials and methods
All animal procedures were approved by the Danish Animal Experiments Inspectorate (license no. 2016-15-0201-01021), conducted in accordance with the University of Copenhagen Animal Ethics Policy and reported in accordance with the ARRIVE (Animal Research: Reporting In Vivo Experiments) guidelines. Precautions were taken to reduce any animal suffering to a minimum. Anesthesia was induced shortly after arrival to our facility and was sustained throughout preparation and experimentation until the termination of the animal.
Animal model and preparation
Seventeen newborn piglets (Sus scrofa domesticus, Danish landrace, all females) were included in this study. Two different protocols were applied in two groups of piglets; Group 1 involved six piglets with a median age of 11 days (range 10–12 days) and median weight 3.2 kg (range 3.1–3.3 kg). On the other hand, Group 2, primarily prepared for another study and here used for baseline values, included eleven piglets with median age 11 days (range 9–12 days) and median weight 3.2 kg (range 3–3.4 kg).
The piglet was delivered on the day of the experiment and anesthetized by intramuscular injection of Zoletil (xylazine 2 mg/kg, ketamine 10 mg/kg, methadone 1 mg/kg and butorphanol 1 mg/kg; Virbac, Denmark), intubated and put on a ventilator (Dameca, Denmark).
During the protocol, electrocardiography, pulse oximetry, continuous monitoring of rectal temperature (IntelliVue MP70, Philips, The Netherlands) and of end-tidal carbon dioxide (EtCO2, Secma, Skævinge, Denmark) were utilized. Analgesia and anesthesia were sustained with intravenous fentanyl 10 μg/kg/h and propofol 20 mg/kg/h in an ear vein using an infusion pump (B. Braun, Melsungen, Germany). Intravenous catheters were placed in the femoral arteries and veins bilaterally. An arteriovenous shunt was established to continuously monitor the tracer activity in the blood (left femoral artery to left femoral vein), while the others were for monitoring arterial blood pressure (right femoral artery) and for fast administration of the tracer (right femoral vein). For Group 2, only the catheter for arterial blood pressure was used. Additionally, an intravenous catheter was placed in the superior sagittal sinus of both group of piglets through a minimal 3 mm craniotomy anterior to the bregma for cortical venous blood. All these monitors and measurements allowed for acquiring a more complete picture of the physiology of the animal. The presentation of these data, however, is beyond the scope of the present manuscript. All catheters were flushed with heparinized saline every hour during preparation and subsequent stabilization. Intravenous antibiotics (ampicillin (Bristol-Myers Squibb, NY, USA) 200 mg/kg and gentamicin (MerckSerono, Darmstadt, Germany) 4 mg/kg) were administered as sepsis prophylaxis, and intravenous heparin (100 IE/kg; LEO Pharma, Ballerup, Denmark) to prevent blood clotting. A continuous infusion of isotonic glucose (55 mg/mL, 15–20 mL/kg/h) compensated for fluid losses and maintained blood glucose levels.
The procedure explained in this section represents the standards of our animal facility for prolonged experimentation, emphasizing animal safety and convenience.24 We did not take special precautions to account for the effects of the anaesthetics on CBF for this specific study since the main purpose of the manuscript is the comparison between the quantification of CBF by PET and DCS, regardless of the source of CBF variations.
PET measurements
The PET scans were performed in a high resolution research tomograph (HRRT, Siemens, Erlangen, Germany) with the piglet in prone position supported by a vacuum pillow. Only the head and neck were inserted in the scanner which had a 25 cm of axial field of view. First, a transmission scan using a Cesium-137 (137Cs) point source was performed for attenuation correction. Afterwards, for each measurement, dynamic scans were started approximately 30 s before injecting a bolus of 100 MBq 15O-water in the right femoral vein which was subsequently flushed by heparinized saline. After the injection, data was collected for 7 min in list mode. During this time, tracer activity in the blood was continuously measured every half second using the shunt between the left femoral artery and vein driven by a peristaltic pump (Allogg ABSS, Mariefred, Sweden) with a flow of 4 ml/min.
Transmission list mode data were histogrammed with emission contamination correction, and the transmission scan was reconstructed using the HRRT maximum a posteriori for transmission (MAP-TR) method.25 The data were reconstructed into 40 frames as 1 × 25 s, 15 × 2 s, 11 × 5 s, 4 × 10 s, 9 × 30 s with a fast implementation26 of the software OP-OSEM 3D (10 iterations, 16 subsets) including point spread function modeling,27 attenuation, random scatter and decay correction. The image size was 256 × 256 × 207 voxels with a 1.22 mm × 1.22 mm × 1.22 mm voxel size. Image frames were preprocessed using a 5 mm three-dimensional Gaussian filter. A minimum time of 10 min (five half-lives) between the scans was kept to allow for decay of the tracer.
PET image analysis
All quantitative PET image analyses were performed in PMOD v3.3 (PMOD Technologies, Zürich, Switzerland). Results from three volumes of interest (VOIs) were calculated. One contained the cortex of both hemispheres and we will refer at this result as regional CBF (rCBF). Furthermore, global CBF (gCBF) was calculated by a whole brain VOI. The last VOI consisted of a 8 mm sphere placed under the optical probe. Figure S1, in the Supplementary materials, illustrates the three VOIs delineated. Time activity curves were generated for the VOI for kinetic modeling using a single tissue compartment model with correction for the arterial blood volume adapted for 15O-water tracer studies by applying the equation
where CPET(t) is brain tissue activity at the time t (count/s/ml), τ is dispersion of the tracer (s), K1 is the unidirectional blood to brain clearance of the tracer (CBF; ml/min/100ml tissue), k2 is the efflux rate constant (1/min), Ca(t) is the arterial input function (counts/s/ml) and vB is the arterial blood volume fraction. Parameters K1, k2 and the tracer arrival time delay were fitted simultaneously by the Meyers method.28 Dispersion, τ, was set to 3 s based on prior experience.29 The arterial input function was derived from the automated sampling from the femoral shunt. The measured activity was corrected for decay and was aligned with the start time of the scan. Only the first 3 min of the dynamic scan was used for kinetic modeling. rCBF and gCBF in ml/min/100 ml as derived from the kinetic model was converted to the usual units of ml/100 g/min by dividing for the brain tissue density 1.05 g/ml.30
Optical measurement
The BabyLux device, a hybrid device integrating DCS and TRS, was used to continuously monitor the cerebral haemodynamics. The device is described in detail elsewhere.31 Briefly, DCS uses long coherence length laser light at 785 nm and measures the intensity of fluctuations of a single speckle after photon propagation into the tissue.11 From this, the intensity autocorrelation function is calculated. On the other hand, TRS injects short (∼100 ps) pulses of light at three wavelengths (685 nm, 760 nm, 820 nm) and measures the same pulses after having propagated into the tissue by building the distribution of time of flight of photons (DTOF).32 Fibers are encased in a small and light probe31 and distance between the source and the detector fibers is 15 mm for both DCS and TRS. The shape and size of the probed region depend not only on the source detector separation but also on the optical and geometrical properties of the tissue. As a rule-of-thumb the probed volume covers approximately a cubic centimeter carrying information primarily from a depth of about half of the source detector separation.33,34 In the young piglet, the scalp and skull thickness measures less than 5 mm, therefore DCS retrieves information from the cerebral cortex under the probe and, due to the limited thickness of the cortex, some subcortical white matter.
Optical data analysis
The experimental DTOF obtained by the TRS was fitted by the solution for time-resolved reflectance obtained from the photon diffusion equation for a semi-infinite homogeneous diffusive medium, after convolution with the instrument response function (IRF).31,35,36 Specifically, baseline DTOF were fitted with both the wavelength dependent absorption (μa) and reduced scattering (μ′s) coefficients as fitting parameters in order to retrieve the baseline optical properties. Subsequently, the whole measurement was fitted fixing the μ′s value at baseline and allowing for a free shift of the temporal position of the IRF as previously explained.37 This is motivated by the fact that scattering properties are expected not to change during haemodynamic changes and improve the stability of the estimated μa.
About DCS data analysis, the electric field autocorrelation curves were derived from the measured intensity autocorrelation curves and, then, fitted to the solution of the correlation diffuse equation for a semi-infinite homogeneous medium.11 In this procedure, BFI was derived as a fitting parameter while the measured optical properties were inserted as input parameters. To this purpose, the time series of μa concurrently measured by TRS was used in the DCS analysis, while μs′ was kept fixed during the protocol at the baseline value, as was done for TRS analysis. The group average of μs′ was used for this purpose since the piglets were all of the same breed, similar age and weight and were raised in a controlled manner.
Experimental protocol
After the preparation of the animal (described above), piglets of Group 1 were allowed to stabilize for at least 30 min before transport to the PET facility. Heating bags, blankets and manual ventilation were used to keep the animal stable for the duration of the transport.
Once in the PET facility, and after assuring that the piglet was still stable after transport, the BabyLux probe was placed over the left hemisphere of the piglet head using an auto-adherent bandage. Thirty seconds of measurements were acquired and, subsequently, the bandage was released and the probe was placed again in approximately the same spot. Another measurement was run for 30 s and this was repeated until six sets of measurement were acquired. This protocol element which allowed us to define the variability within replacement of the probe, was added at a later stage, therefore data is not available for all piglets. Afterwards, the probe was kept in place for the remaining protocol and acquisition run continuously. BabyLux device concurrently measured DCS and TRS with a sampling time of one second.
A series of ten sequential PET scans were planned for each piglet; three scans during baseline, three scans after an intravenous dose of acetazolamide (ACZ) and four scans during two levels of hypoxia. ACZ inhibits the carbonic anhydrase enzyme in red blood cells, in glial cells, in the choroid plexus and in the endothelial cells of the brain capillaries. It produces an extracellular and intracellular acidosis resulting in the relaxation of vascular smooth muscle. This causes an increase in CBF which is often associated with a corresponding increase in blood oxygenation.38 Likewise, hypoxia is matched by an increase in cerebral blood flow to try to meet the nutrient and oxygen demands of the metabolic processes but it is associated with a decrease in blood oxygenation.39,40 Once the baseline scans were run, 10 mg/kg of acetazolamide (ACZ, Mercury Pharmaceuticals, Croydon, Great Britain) was administered intravenously. After a resting period of 15–20 min to allow for the pharmaceutical rCBF increase, three new scans were acquired. Thereafter, hypoxia was induced by decreasing the inspired oxygen partial pressure by adding nitrogen gas targeting a peripheral arterial saturation (SpO2) of 85% (Hypoxia A) for the next two scans and a SpO2 of 50% (Hypoxia B) for the last two scans. Respiratory rate and tidal volume was adjusted to target an EtCO2 near 41.25 mmHg during baseline and below 63.75 mmHg after ACZ injection. Upon completion of the protocol, or if inhumane end-points were reached, piglets were euthanized by an overdose of 150 mg/kg of pentobarbital.
Piglets of Group 2 were not transported to the PET facility. After preparation and stabilization of the animal, the same replacement protocol of BabyLux probe was performed as in Group 1 above. A separate experimental protocol followed as the animals were being prepared for another study. This was not object of the present study, and therefore it is not reported here.
Statistical data analysis
Statistical data analysis was performed through R41 and threshold for significance for p-values was defined as 0.05 for all the statistical tests. Median weight and age of the piglets are reported.
First, we have calculated the variability of BFI over replacements of the optical probe. For each of the six replacements, BFI was averaged over the 30 s of continuous measurement. Afterwards, the coefficient of variation (CV) was calculated, defined as the ratio between the standard deviation and the mean over the six replacements. This CV was used to quantify the variability of the BFI measurements. As far as PET method is concerned, CV over the three baseline scans is calculated for its variability. Mean and standard deviation over the population of the CV for the two methods were considered as the error of the method itself.
In order to compare BFI obtained by the DCS measurement with rCBF results from the PET scans, the DCS measurements acquired during the 3 min after each 15O-water injection were averaged and considered as corresponding to the concurrent PET scan.
For each scan, a paired Wilcoxon signed rank test was performed to check whether the haemodynamic (BFI and rCBF), mean arterial pressure and arterial blood gas parameters (partial pressure of carbon dioxide (PaCO2), partial pressure of oxygen (PaO2), saturation (SaO2), haemoglobin concentration (Hb) and acidity/alkalinity scale for an aqueous solution (pH)) changed with respect to baseline in Group 1. Mean and standard deviation over the population of those parameters are reported.
The first hypothesis to be tested was whether BFI was correlated with rCBF. For this purpose, the Pearson correlation coefficient was calculated. In addition, Deming regression was used to estimate the slope and the intercept between the two methods.42 This kind of regression is preferable when the reference method cannot be considered as without error. The Deming regression was performed with the R package mcr.43
Subsequently, we have derived a calibration formula to convert individual BFI measurement into flow units. First of all, we have converted the measurement by the two methods into a unitless measure of normalized rCBF (nrCBF) by dividing each value calculated by one method by the average value of all the measurements performed by the method itself. Then, a Bland-Altman plot was generated by plotting the difference of the two methods versus the average. In case of heteroscedasticity, i.e. a different variance for different values of nrCBF, a logarithmic transformation was performed.
In order to calculate the limits of agreement, the fact that measurements were repeated in each animal had to be taken into account through the procedure explained in Carstensen.44 In case of repeated (replicated) measurements, an error due to the interaction between animal and replicate, independent from the method, must be considered, together with the error due to the interaction between animal and method, independent from the replicate. Ultimately, a measurement variation is also due to the interaction between animal, method and replicate. To estimate the variance corresponding to these effects and their interaction, a linear mixed effect model was built and those errors were considered as random effects. The model gave the estimates of the variance for each random effects, which were squared summed for calculating the limits of the agreement.44
This method allowed for retrieving a conversion formula (and its limits of agreement) from BFI to rCBF to be used for individual BFI measurements conversion. Therefore, it was employed to convert each BFI measurements of the Group 2 piglets into flow units. A Wilcoxon signed rank test was used to check whether the measured rCBF in Group 1 was different from the BFI-derived rCBF in Group 2.
Results
The optical properties of the piglet brain are first reported since they are used in the DCS analysis. The average μa and its standard deviation (SD) measured for 760 nm in the population of the two groups of piglets (N = 17) was 0.18 (SD 0.06) cm−1, while the average μs′ at 760 nm was 9.8 (SD 0.8) cm−1. Only this wavelength is reported, because it is the closest to the one used for DCS (785 nm).
Three VOIs were delineated for PET image analysis but we report results purely from the cerebral cortical VOI of both hemispheres (rCBF). The sub-probe VOI corresponding to the 8 mm sphere resulted in noisy and unreliable measurements that were discarded. Results from the whole brain VOI (gCBF) are presented in figure S4 of the Supplementary Materials.
Figure 1 shows an example of the recording of rCBF by PET and BFI by DCS during the whole protocol on a piglet of Group 1. Even though it was not used for further analysis, the continuous trace is shown in order to provide a flavor of the continuous, real-time nature of the DCS data. The abrupt decrease of BFI visible at the end of Hypoxia A is concurrent to an abrupt decrease in arterial blood pressure (from 60 mmHg to 40 mmHg). This suggests limited autoregulation, most probably due to the already maximally dilated cerebral artery system, after the ACZ injection and first part of the hypoxic challenge. We note that this does not affect the study findings since we are interested in comparing simultaneous measurements by the two modalities.
Figure 1.
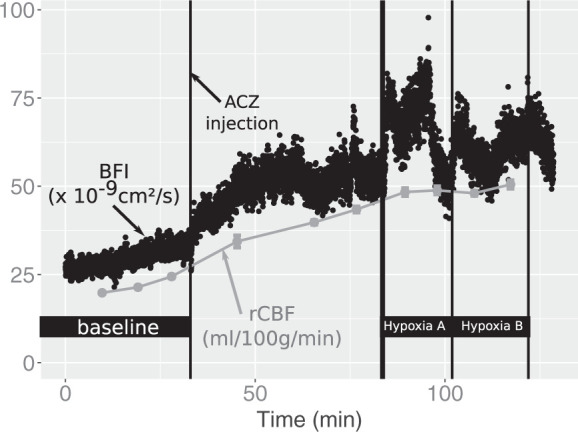
Time-locked recordings of cortical CBF (rCBF) by PET and blood flow index (BFI) by DCS during the whole scan session in a piglet of Group 1. Black dots represent the continuous time series of BFI with 1 s time resolution, while the grey points show rCBF values by PET. After baseline, where three PET scans were performed, acetazolamide (ACZ) was injected, followed by three PET scans. Hypoxia was subsequently induced aiming at a SpO2 level of 85% (Hypoxia A) and at a SpO2 level of 50% (Hypoxia B).
Among the six piglets of Group 1, one had an additional scan after ACZ injection and another during the first step of hypoxia. This resulted in a total of 62 PET scans with simultaneous DCS over all the piglets, whose distribution of results is depicted in Figure 2.
Figure 2.
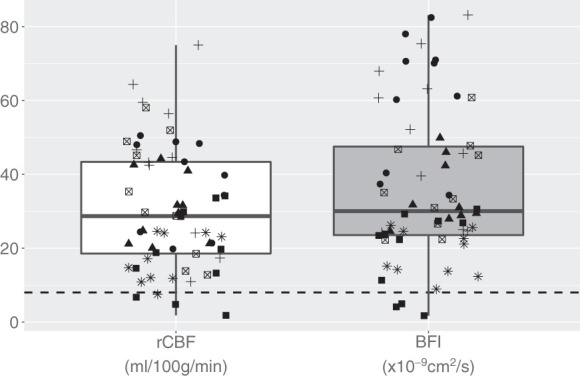
The white boxplot represents rCBF measurements from all the 62 PET scans performed on the six piglets. Grey boxplot represents the BFI measurements by DCS corresponding to the PET scans. Symbols code the different six piglets. The horizontal dashed line highlights the limit of 8 ml/100 g/min in PET (defined as the threshold for CBF ischemic values) and an arbitrary limit on DCS.
Focusing on the baseline CBF values measured in piglets, the average BFI measured in Group 1 was 23 (SD 5) ×10−9 cm2/s, while it was 24 (SD 5)×10−9 cm2/s in Group 2. In Group 1 CBF was also measured by PET, giving an average rCBF of 18 (SD 3) ml/100 g/min.
The optical probe replacement protocol was applied to the last 13 out of the 17 piglets (four of Group 1 and nine of Group 2). A CV of 7% (SD 3%) was obtained. The variability of the PET measurements was quantified as CV over the three baseline scans. This was found to be 18% (SD 12%) as averaged over the population for rCBF.
The blood gas results and the CBF values in Group 1 during the different challenges are reported in Tables 1 and 2, respectively. ACZ challenge provoked an increase in CBF and a small increase in PaCO2, while PaO2 and SaO2 stayed constant. Statistical tests confirmed a small decrease in pH after ACZ injection compared to baseline. Hypoxic state was demonstrated by the decrease in PaO2 and of SaO2. Surprisingly, this was not associated with a concurrent change in rCBF relative to baseline when considering the mean of all the piglets.
Table 1.
Blood gas parameters and mean arterial pressure during the protocol.
| Event | PaCO2 (mmHg) | PaO2 (mmHg) | SaO2 (%) | Hb (mmol/l) | pH | MAP (mmHg) |
|---|---|---|---|---|---|---|
| Baseline | 49 (6) | 160 (30) | 99.8 (0.9) | 4.4 (1.5) | 7.29 (0.08) | 57 (9) |
| ACZ1 | 55 (5) | 170 (20) | 100.0 (0.3) | 4.1 (1.2) | 7.23 (0.06)a | 48 (7) |
| ACZ2 | 58 (7)a | 170 (20) | 100.0 (0.2) | 4.0 (1.1) | 7.20 (0.06)a | 47 (6) |
| ACZ3 | 60 (6)a | 160 (20) | 100.0 (0.3) | 3.9 (1.1) | 7.19 (0.06)a | 49 (7) |
| Hypoxia1-A | 62 (6)a | 50 (10)a | 61.6 (17.8)a | 4.0 (1.1) | 7.17 (0.06)a | 50 (10) |
| Hypoxia2-A | 62 (6)a | 50 (10)a | 68.3 (10.9)a | 3.9 (1.0) | 7.15 (0.08)a | 50 (20) |
| Hypoxia3-B | 62 (7)a | 40 (10)a | 53.2 (15.4)a | 4.0 (1.0) | 7.1 (0.1)a | 50 (30) |
| Hypoxia4-B | 63 (9) | 40 (10)a | 47.1 (18.2)a | 4.1 (1.2) | 7.1 (0.1)a | 50 (30) |
Mean (standard deviation) of parameters estimated by blood gas analysis and of mean arterial blood pressure (MAP) at baseline, after acetazolamide (ACZ) injection and during the two hypoxic challenges (Hypoxia A and B). Each event corresponds to a PET scan. Arterial partial pressure of carbon dioxide (PaCO2) and of oxygen (PaO2), arterial saturation (SaO2), arterial haemoglobin concentration (Hb) and arterial pH are presented.
aHighlights statistically significant difference from baseline as confirmed by a paired Wilcoxon signed rank test (p < 0.05).
Table 2.
The regional cerebral blood flow and blood flow index.
| Event | BFI (×10−9 cm2/s) | rCBF (ml/100 g/min) |
|---|---|---|
| Baseline | 22.7 (5.1) | 17.5 (4.4) |
| ACZ1 | 31.9 (10.5)a | 30.6 (9.1)a |
| ACZ2 | 33.4 (10.9)a | 32.6 (8.0)a |
| ACZ3 | 37.0 (13.7)a | 35.0 (8.5)a |
| Hypoxia1-A | 41.3 (21.5) | 39.1 (16.6) |
| Hypoxia2-A | 37.0 (21.1) | 34.0 (17.7) |
| Hypoxia3-B | 38.7 (25.2) | 37.4 (22.9) |
| Hypoxia4-B | 42.7 (31.7) | 39.0 (28.9) |
Mean (standard deviation) of regional cerebral blood flow (rCBF) at baseline, after acetazolamide (ACZ) injection and during the two hypoxic challenges (Hypoxia A and B). Each event corresponds to a PET scan. Blood flow index (BFI) measured by DCS and rCBF as obtained from the PET scans are reported.
aHighlights statistically significant difference from baseline as confirmed by a paired Wilcoxon signed rank test (p < 0.05).
BFI is plotted versus rCBF in Figure 3, which also reports the line resulted from Deming regression and the Pearson correlation coefficient, with its p-value. The Deming regression resulted in a slope of 1.15 [confidence interval (CI) 1.05, 1.27] (cm2/s)/(ml/100 g/min) and an intercept of −1.54 (CI −4.88, 1.47) (cm2/s).
Figure 3.
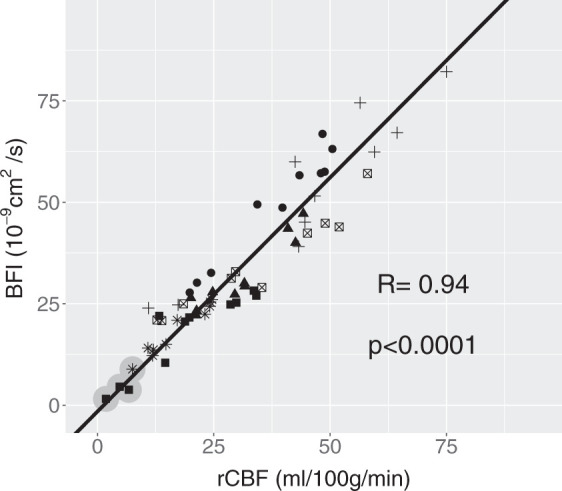
BFI by DCS plotted against rCBF as measured by PET. Pearson coefficient (R) with its p-value is shown while the regression line was obtained by the Deming regression. This has a slope and intercept of 1.15 (1.05, 1.27) (cm2/s)/(ml/100 g/min) and −1.54 (−4.88, 1.47) (cm2/s). Numbers in brackets represent the 95% confidence interval (CI). Symbols code individual piglets (N = 6). The grey circles highlight the scans which resulted in a rCBF < 8 ml/100 g/min.
In order to test the agreement between the two methods, we obtained a unitless normalized rCBF (nrCBF) by dividing each value obtained by the two methods by the average of all the 62 measurements, which was found to be 30 ml/100g/min for rCBF and 34 × 10−9 cm2/s for BFI. The Bland-Altman plot for the logarithmic transformation of nrCBF is shown in Figure 4. The transformation was performed to avoid heteroscedasticity. The variance component model estimated a bias of 0.004, practically zero, considering the range in the y axis, as expected from the normalized measurement. Its standard deviation was 0.224 which resulted in limits of agreement of (−0.445, 0.452). The bias in the logarithmic transformation result could be translated as nrCBFPET=1.004×nrCBFDCS. By re-introducing the units for the two, we have found rCBF = 0.89 (ml/100 g/min)/(cm2/s)×109×BFI, with (0.56, 1.39) (ml/100 g/min)/(cm2/s) as the corresponding limits of agreement for the conversion factor.
Figure 4.
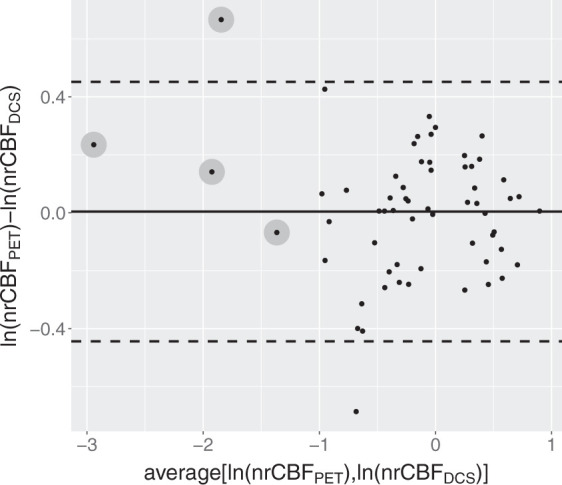
Bland-Altman plot for the logarithmic transformation of nrCBF. The calculated bias is 0.004 and is shown by the black thick line. The standard deviation estimated by the model is 0.224, which results in the limit of agreement highlighted by horizontal dashed lines (−0.445, 0.452). The bias in the logarithmic transformation could be translated as nrCBFPET=1.004×nrCBFDCS. By re-introducing the units for the two quantities, we have rCBF = 0.89(0.56, 1.39) (ml/100 g/min)/(cm2/s)×109×BFI as the conversion factor and the corresponding limits of agreement in brackets. The grey circles highlight the scans which resulted in a rCBF < 8 ml/100 g/min.
This formula could be used to convert individual BFI measurements to absolute flow units and was applied to baseline BFI measured in Group 2. No statistical significant difference was detected between the two groups by a Wilcoxon signed rank test (p = 0.06).
Discussion
The present work aimed at validating DCS, a diffuse optical technology which measures the blood flow in the microvasculature of the tissue, with the ‘gold standard’ 15O-water PET for measurement of rCBF in a neonatal piglet model. It provided, in addition, a calibration formula to convert the BFI measured in cm2/s in flow units (ml/100g/min) for this population. This is relevant since this model is commonly used as an animal model for the study of cerebrovascular pathophysiology in neonates.
A previous study in neonatal piglets used the same PET scanner and found a higher baseline gCBF (median 26 ml/100 g/min, in a range between 16 ml/100 g/min and 38 ml/100 g/min)45 compared to the present findings (median 17 ml/100 g/min). The anaesthesia was similar, but the age of the piglets in the previous group was 22 days rather than 11 days, which could possibly explain this divergence. On the other hand, BFI presented here was lower than what was measured in other studies using DCS on piglets.16,46 It may not be trivial to compare those numbers though, since in this case the anesthesia was different. In addition, they used a lower reduced scattering coefficient (μs′), as obtained by concurrent TRS measurements, and the absolute BFI value depends heavily on the value of the μs′ introduced in the analysis.
We have here decided to use a single value of μs′ for all the piglets. Since μs′ and BFI are coupled in the analytic equation that describes DCS measurements,8 an accurate estimation of μ′s is fundamental to accurately obtain absolute BFI values.47 Analogously, an increased variability in μ′s could increase the variability of BFI. Therefore, even when hybrid devices are used and optical properties measured concurrently to BFI, it is common to use a population average of μs′.21,48 Nonetheless, results obtained using an individual value of μs′ for each piglet would not have changed the results consistently, as shown in Figure S2 of the Supplementary materials.
Focusing on CBF evolution during the protocol, the ACZ challenge produced an increase in PaCO2 and an even more marked increase in CBF as expected.49 During the hypoxic challenge, PaO2 and SaO2 demonstrated the moderate-to-severe degree of hypoxia but the mean CBF did not increase further although there was a marked variability of responses among piglets. In some piglets, the mean arterial blood pressure dropped markedly, below 20 mmHg, where CBF is likely to become pressure-passive,50,51 and was concurrent to a bradycardia with a 50% reduction in heart rate from baseline. This resulted in very low CBF (<8 ml/100 g/min, defined as the threshold for CBF ischemic values). Those points are highlighted in Figures 3 and 4. Since the purpose of the analysis is solely to compare CBF obtained concurrently by the two methods regardless of the source of CBF variations, all these responses were considered to be useful. In fact, the observation that the technology is usable even during extreme conditions is of added value.
A strong correlation was observed between absolute values of BFI and rCBF with a high Pearson coefficient (R = 0.94). For completeness, we report, in the supplementary materials, the correlation between BFI obtained with individual estimates of μs′ and rCBF (figure S3) and the correlation between BFI and the global CBF (gCBF) (Figure S4). Both analyses gave very high, statistically significant correlation coefficients.
We wanted to derive a calibration formula to convert the BFI measurement into flow units. For this reason, we have normalized the CBF measurements by the two methods into unitless measurements. The bias in the Bland-Altman plot built with the logarithm of the normalized rCBF is practically zero (0.004), as expected, since we have normalized the two distributions. Therefore, the scaling factor is approximately the ratio of the normalization factors. Notably, it was comparable to the inverse of the slope found with the Deming regression. The method employed added the definition of limits of agreement for the scaling factor to be considered for individual BFI measurement conversion. It must be noted that the range defined by the limits of agreement was quite wide, being approximately equal to the 90% of the scaling factor. This is due to the small number of piglets but we have opted not to increase this number due to ethical and cost reasons. This limits the value of this calibration in clinical measurements as it is necessary to have confidence in single absolute values for clinical use. Another limitation is due to the fact that we have used the whole cerebral cortex as VOI to represent rCBF.
We have used the calibration formula to derive rCBF by individual DCS measurements on the second group (Group 2) of piglets. Results were satisfactory, as the obtained rCBF’s were not statistically significantly different between groups (p = 0.06). This test is different from comparing the BFI of the two groups since the conversion formula is derived from all the measurements of Group 1 while rCBF in Group 2 is obtained by individual BFI measurements. The predicted rCBF values lie within a quite wide range due to the limits of agreement of the conversion formula.
Only a few DCS validation studies have investigated a correlation and a calibration of the absolute values in different population, such as piglets, infants and adults.16,19,22 Furthermore, they have used different methods including phase contrast MRI and a combination of time-resolved dynamic contrast-enhanced near-infrared spectroscopy (DCE-NIRS) and DCS, whose estimation of absolute CBF may not be consistent. The conversion formula may thus be method dependent.
A previous study using a piglet model measuring rCBF with DCE-NIRS, i.e. a flow tracer, and DCS gave a slightly higher scaling factor (1.14 (ml/100 g/min)/(cm2/s)) than ours.16 A recent validation and calibration study with the same method on adults confirmed this scaling factor.22 On the other hand, the work measuring gCBF with phase contrast MRI on 4 days old neonates with congenital heart disease gave a smaller factor of 0.4 (ml/100 g/min)/(cm2/s).19 This may be expected since it has been repeatedly shown that phase contrast MRI measures larger gCBF values than PET.52,53
Generally speaking, a conversion formula for the BFI obtained in a specific population is not granted to be valid for other populations with different anatomies of the head. Ideally a conversion formula should be derived for each population of interest, infants in this case, independently. Since it is not straightforward to obtain baseline CBF measurements from healthy newborns as attempted in very few studies,7 it is of interest to explore the possibility of using our conversion formula on newborn infants. The brain of the 11-day-old piglet is anatomically and functionally more mature than is the brain of the human newborn infant, but resting CBF appear to be similar. DCS measures a mixture of extra- and intra-cerebral layer perfusion with different rCBF. The calibration factor is thus dependent on the dimension of the head and the thicknesses of the extra-cerebral material between the probe and the brain. Furthermore, there are multiple other factors that link the BFI with the blood flow in the microvasculature, for example, the distribution of the vessel dimensions and their location.54 Other confounding factors such as alterations in tissue structure due to brain maturation have possibly a smaller effect, but should still be considered. This can amplify the discrepancies within different populations. What is measured on piglets, however, with a head circumference of about 30 cm and an extra-cerebral layer of about 3 mm, not so dissimilar from the human newborn infant, may reasonably be used for infants but it is unlikely to work for the adult head. In spite of this, we have already mentioned that two others studies found the same conversion factor using the same method on piglets and adults.16,22 It must be noted that, in this case, both the reference and the “new” method were based on diffuse optics.
Considering all this, we have applied the conversion factor to data from a population of twenty-five healthy term newborns measured in a clinical study employing the BabyLux device.55 The median value of the baseline BFI was found to be 25 inter-quartile range (IQR): [19, 35] ×10−9 cm2/s, which can be converted to 22 IQR: [17, 31] ml/100 g/min. It is generally accepted that normal gCBF in healthy newborn infants is around 20 ml/100 g/min,56 not far from our estimation.
In conclusion, our study has validated rCBF measurement by DCS in a piglet model against rCBF in the cortex measured by 15O-water PET, considered the “gold” standard for cerebral perfusion measurement. DCS measurement was found to be highly correlated with rCBF (R = 0.94). A conversion formula for this population was derived for obtaining rCBF in flow units by individual BFI measurements. This was applied to the mean baseline BFI measurements of a population of healthy infants and gave a mean rCBF estimation comparable to the expected value.
Supplemental Material
Supplemental material, JCB883751 Supplemetal Material for Validation of diffuse correlation spectroscopy against 15O-water PET for regional cerebral blood flow measurement in neonatal piglets by Martina Giovannella, Bjørn Andresen, Julie B Andersen, Sahla El-Mahdaoui, Davide Contini, Lorenzo Spinelli, Alessandro Torricelli, Gorm Greisen, Turgut Durduran, Udo M Weigel and Ian Law in Journal of Cerebral Blood Flow & Metabolism
Funding
The author(s) disclosed receipt of the following financial support for the research, authorship and/or publication of this article: We acknowledge funding from the European Commission Competitiveness for Innovation Program (BabyLux, grant agreement no. 620996), Fundació CELLEX Barcelona, Ministerio de Economía y Competitividad/FEDER (PHOTODEMENTIA, DPI2015-64358-C2-1-R), Instituto de Salud CarlosIII/FEDER (MEDPHOTAGE, DTS16/00087), the “Severo Ochoa” Programme for Centres of Excellence in R&D (SEV-2015-0522, Martina Giovannella’s PhD funder), the Obra social “la Caixa” Foundation (LlumMedBcn), Institució CERCA, AGAUR-Generalitat (2017 SGR 1380), LASERLAB-EUROPE IV (654148) and the John and Birthe Meyer foundation for donating the HRRT scanner to Rigshospitalet.
Declaration of conflicting interests
The author(s) declared the following potential conflicts of interest with respect to the research, authorship, and/or publication of this article:
Turgut Durduran is an inventor on a relevant patent (Patent US8082015B2, “Optical measurement of tissue blood flow, hemodynamics and oxygenation”). ICFO has equity ownership in the spin-off company HemoPhotonics S.L. Potential financial conflicts of interest and objectivity of research have been monitored by ICFO’s Knowledge & Technology Transfer Department. No financial conflicts of interest were identified. Udo Weigel is the CEO, has equity ownership in HemoPhotonics S.L. and is an employee in the company. His role in the project has been defined by the project objectives, tasks and work-packages and was reviewed by the European Commission.
Authors’ contributions
MG contributed with design, acquisition, analysis and interpretation of data, drafting and revising the manuscript. BA, JBA and SE contributed with design, acquisition and analysis. DC, LS, AT, GG, TD, UMW, and IL have contributed with analysis of data, supervision and technology development. All authors have contributed to the writing, revising and the final approval of the manuscripts.
Supplemental material
Supplemental material for this article is available online.
References
- 1.Siesjo BK.Brain energy metabolism. New York: John Wiley & Sons, Ltd, 1978. DOI: 10.1002/ana.410050318. [Google Scholar]
- 2.du Plessis AJ.Cerebrovascular injury in premature infants: current understanding and challenges for future prevention. Clin Perinatol 2008; 35: 609–641. [DOI] [PubMed] [Google Scholar]
- 3.Brew N, Walker D, Wong FY.Cerebral vascular regulation and brain injury in preterm infants. Am J Physiol Regul Integr Comp Physiol 2014; 306: R773–R786. [DOI] [PubMed] [Google Scholar]
- 4.Liem KD, Greisen G.Monitoring of cerebral haemodynamics in newborn infants. Early Hum Dev 2010; 86: 155–158. [DOI] [PubMed] [Google Scholar]
- 5.Herscovitch P, Markham J, Raichle ME.Brain blood flow measured with intravenous H2(15)O. I. Theory and error analysis. J Nucl Med 1983; 24: 782–789. [PubMed] [Google Scholar]
- 6.Raichle ME, Martin WR, Herscovitch P, et al. Brain blood flow measured with intravenous H2(15)O. II. Implementation and validation. J Nucl Med 1983; 24: 790–798. [PubMed] [Google Scholar]
- 7.Andersen JB, Lindberg U, Olesen OV, et al. Hybrid PET/MRI imaging in healthy unsedated newborn infants with quantitative rCBF measurements using 15O-water PET. J Cereb Blood Flow Metab 2018; 271678X17751835. [DOI] [PMC free article] [PubMed] [Google Scholar]
- 8.Boas DA, Campbell LE, Yodh AG.Scattering and imaging with diffuse temporal field correlation. Phys Rev Lett 1995; 75: 1855–1858. [DOI] [PubMed] [Google Scholar]
- 9.Boas DA, Yodh AG.Spatially varying dynamical properties of turbid media probed with diffusing temporal light correlation. J Opt Soc Am A 1997; 14: 192. [Google Scholar]
- 10.Durduran T, Yodh AG.Diffuse correlation spectroscopy for non-invasive, micro-vascular cerebral blood flow measurement. Neuroimage 2014; 85: 51–63. [DOI] [PMC free article] [PubMed] [Google Scholar]
- 11.Durduran T, Choe R, Baker WB, et al. Diffuse optics for tissue monitoring and tomography. Reports Prog Phys 2010; 73: 076701. [DOI] [PMC free article] [PubMed] [Google Scholar]
- 12.Buckley EM, Cook NM, Durduran T, et al. Cerebral hemodynamics in preterm infants during positional intervention measured with diffuse correlation spectroscopy and transcranial Doppler ultrasound. Opt Express 2009; 17: 12571. [DOI] [PMC free article] [PubMed] [Google Scholar]
- 13.Durduran T, Zhou C, Buckley EM, et al. Optical measurement of cerebral hemodynamics and oxygen metabolism in neonates with congenital heart defects. J Biomed Opt 2010; 15: 037004. [DOI] [PMC free article] [PubMed] [Google Scholar]
- 14.Roche-Labarbe N, Carp Sa, Surova A, et al. Noninvasive optical measures of CBV, StO(2), CBF index, and rCMRO(2) in human premature neonates’ brains in the first six weeks of life. Hum Brain Mapp 2010; 31: 341–52. [DOI] [PMC free article] [PubMed] [Google Scholar]
- 15.Goff DA, Buckley EM, Durduran T, et al. Noninvasive cerebral perfusion imaging in high-risk neonates. Semin Perinatol 2010; 34: 46–56. [DOI] [PMC free article] [PubMed] [Google Scholar]
- 16.Diop M, Verdecchia K, Lee T-Y, et al. Calibration of diffuse correlation spectroscopy with a time-resolved near-infrared technique to yield absolute cerebral blood flow measurements. Biomed Opt Express 2012; 3: 1476. [DOI] [PMC free article] [PubMed] [Google Scholar]
- 17.Buckley EM, Lynch JM, Goff Da, et al. Early postoperative changes in cerebral oxygen metabolism following neonatal cardiac surgery: effects of surgical duration. J Thorac Cardiovasc Surg 2013; 145: 196–203, 205.e1; discussion 203–205. [DOI] [PMC free article] [PubMed] [Google Scholar]
- 18.Buckley EM, Naim MY, Lynch JM, et al. Sodium bicarbonate causes dose-dependent increases in cerebral blood flow in infants and children with single-ventricle physiology. Pediatr Res 2013; 73: 668–673. [DOI] [PMC free article] [PubMed] [Google Scholar]
- 19.Jain V, Buckley EM, Licht DJ, et al. Cerebral oxygen metabolism in neonates with congenital heart disease quantified by MRI and optics. J Cereb Blood Flow Metab 2014; 34: 380–388. [DOI] [PMC free article] [PubMed] [Google Scholar]
- 20.Lin PY, Hagan K, Fenoglio A, et al. Reduced cerebral blood flow and oxygen metabolism in extremely preterm neonates with low-grade germinal matrix- intraventricular hemorrhage. Sci Rep 2016; 6: 1–8. [DOI] [PMC free article] [PubMed] [Google Scholar]
- 21.Farzam P, Buckley E, Lin P, et al. Shedding light on the neonatal brain: probing cerebral hemodynamics by diffuse optical spectroscopic methods. Sci Rep 2017; 7: 1–10. [DOI] [PMC free article] [PubMed] [Google Scholar]
- 22.He L, Baker W, Milej D, et al. Noninvasive continuous optical monitoring of absolute cerebral blood flow in critically ill adults. Neurophotonics 2018; 5: 1. [DOI] [PMC free article] [PubMed] [Google Scholar]
- 23.BabyLux - An optical neuro-monitor of cerebral oxygen metabolism and blood flow for neonatology, http://www.babylux-project.eu/
- 24.Alstrup AKO, Smith DF.Anaesthesia for positron emission tomography scanning of animal brains. Lab Anim 2013; 47: 12–18. [DOI] [PubMed] [Google Scholar]
- 25.Keller SH, Svarer C, Sibomana M.Attenuation correction for the HRRT PET-scanner using transmission scatter correction and total variation regularization. IEEE Trans Med Imag 2013; 32: 1611–1621. [DOI] [PubMed] [Google Scholar]
- 26.Hong IK, Chung ST, Kim HK, et al. Ultra fast symmetry and SIMD-based projection-backprojection (SSP) algorithm for 3-D PET image reconstruction. IEEE Trans Med Imaging 2007; 26: 789–803. [DOI] [PubMed] [Google Scholar]
- 27.Sureau FC, Reader AJ, Comtat C, et al. Impact of image-space resolution modeling for studies with the high-resolution research tomograph. J Nucl Med 2008; 49: 1000–1008. [DOI] [PubMed] [Google Scholar]
- 28.Meyer E.Simultaneous correction for tracer arrival delay and dispersion in CBF measurements by the H215O autoradiographic method and dynamic PET. J Nucl Med 1989; 30: 1069–1078. [PubMed] [Google Scholar]
- 29.Andersen JB, Henning WS, Lindberg U, et al. Positron emission tomography/magnetic resonance hybrid scanner imaging of cerebral blood flow using 15O-water positron emission tomography and arterial spin labeling magnetic resonance imaging in newborn piglets. J Cereb Blood Flow Metab 2015; 35: 1703–1710. [DOI] [PMC free article] [PubMed] [Google Scholar]
- 30.Kretschmann HJ, Kammradt G, Krauthausen I, et al. Brain growth in man, http://www.ncbi.nlm.nih.gov/pubmed/3707509 (1986). [PubMed]
- 31.Giovannella M, Contini D, Pagliazzi M, et al. BabyLux device: a diffuse optical system integrating diffuse correlation spectroscopy (DCS) and time resolved near infra-red spectroscopy (TR-NIRS) for neuro-monitoring of the premature newborn brain. Neurophotonics 2019; 6: 025007. [DOI] [PMC free article] [PubMed] [Google Scholar]
- 32.Torricelli A, Contini D, Pifferi A, et al. Time domain functional NIRS imaging for human brain mapping. Neuroimage 2014; 85: 28–50. [DOI] [PubMed] [Google Scholar]
- 33.Feng SC, Zeng F-A, Chance B.Photon migration in the presence of a single defect: a perturbation analysis. Appl Opt 1995; 34: 3826–37. [DOI] [PubMed] [Google Scholar]
- 34.Martelli F, Binzoni T, Pifferi A, et al. There’s plenty of light at the bottom: statistics of photon penetration depth in random media. Sci Rep 2016; 6: 27057. [DOI] [PMC free article] [PubMed] [Google Scholar]
- 35.Contini D, Martelli F, Zaccanti G.Photon migration through a turbid slab described by a model based on diffusion approximation. I. Theory. Appl Opt 1997; 36: 4587–4599. [DOI] [PubMed] [Google Scholar]
- 36.Martelli F, Del Bianco S, Ismaelli A, et al. Light propagation through biological tissue. USA: SPIE press, 2010.
- 37.Cubeddu R, Pifferi A, Taroni P, et al. Experimental test of theoretical models for time-resolved reflectance. Med Phys 1996; 23: 1625–1633. [DOI] [PubMed] [Google Scholar]
- 38.Fierstra J, Sobczyk O, Battisti-Charbonney A, et al. Measuring cerebrovascular reactivity: what stimulus to use? J Physiol 2013; 591: 5809–5821. [DOI] [PMC free article] [PubMed] [Google Scholar]
- 39.Kety SS and, Schmidt CF.The effects of altered arterial tensions of carbon dioxide and oxygen on cerebral blood flow and oxygen consumption of normal young men. J Clin Invest 1948; 27: 484–492. [DOI] [PMC free article] [PubMed] [Google Scholar]
- 40.Vestergaard MB, Lindberg U, Aachmann-Andersen NJ, et al. Acute hypoxia increases the cerebral metabolic rate - a magnetic resonance imaging study. J Cereb Blood Flow Metab 2016; 36: 1046–1058. [DOI] [PMC free article] [PubMed] [Google Scholar]
- 41.Team R Core. R: A language and environment for statistical computing, https://www.r-project.org/ (2016).
- 42.Linnet K.Estimation of the linear relationship between the measurements of two methods with proportional errors. Stat Med 1990; 9: 1463–1473. [DOI] [PubMed] [Google Scholar]
- 43.Manuilova E, Schuetzenmeister A, Model F. mcr package.
- 44.Carstensen B. Replicate measurements. In: Comparing clinical measurement methods. Chichester, UK: John Wiley & Sons, Ltd, 2010.
- 45.Andersen JB.Neonatal imaging of cerebral blood flow with positron emission tomography and arterial spin labeling magnetic resonance. København, Denmark: University of Copenhagen, 2015. [Google Scholar]
- 46.Verdecchia K, Diop M, Lee T-Y, et al. Quantifying the cerebral metabolic rate of oxygen by combining diffuse correlation spectroscopy and time-resolved near-infrared spectroscopy. J Biomed Opt 2013; 18: 27007. [DOI] [PubMed] [Google Scholar]
- 47.Irwin D, Dong L, Shang Y, et al. Influences of tissue absorption and scattering on diffuse correlation spectroscopy blood flow measurements. Biomed Opt Express 2011; 2: 1969–1985. [DOI] [PMC free article] [PubMed] [Google Scholar]
- 48.Lin P-Y, Roche-Labarbe N, Dehaes M, et al. Regional and hemispheric asymmetries of cerebral hemodynamic and oxygen metabolism in newborns. Cereb Cortex 2013; 23: 339–48. [DOI] [PMC free article] [PubMed] [Google Scholar]
- 49.Vorstrup S, Henriksen L, Paulson OB.Effect of acetazolamide on cerebral blood flow and cerebral metabolic rate for oxygen. J Clin Invest 1984; 74: 1634–9. [DOI] [PMC free article] [PubMed] [Google Scholar]
- 50.Laptook A, Stonestreet BS, Oh W.Autoregulation of brain blood flow in the newborn piglet: Regional differences in flow reduction during hypotension. Early Hum Dev 1982; 6: 99–107. [DOI] [PubMed] [Google Scholar]
- 51.Zhou C.In-vivo optical imaging and spectroscopy of cerebral Hemodynamics. Philadelphia, PA: University of Pennsylvania, 2007. [Google Scholar]
- 52.Vestergaard MB, Lindberg U, Aachmann-Andersen NJ, et al. Comparison of global cerebral blood flow measured by phase-contrast mapping MRI with 15O-H2O positron emission tomography. J Magn Reson Imag 2017; 45: 692–699. [DOI] [PMC free article] [PubMed] [Google Scholar]
- 53.Puig O, Vestergaard MB, Lindberg U, et al. Phase contrast mapping MRI measurements of global cerebral blood flow across different perfusion states – a direct comparison with 15O-H2O positron emission tomography using a hybrid PET/MR system. J Cereb Blood Flow Metab 2018; 0271678X1879876. [DOI] [PMC free article] [PubMed] [Google Scholar]
- 54.Boas DA, Sakadžic S, Selb J, et al. Establishing the diffuse correlation spectroscopy signal relationship with blood flow. Neurophotonics 2016; 3: 031412. [DOI] [PMC free article] [PubMed] [Google Scholar]
- 55.De Carli A, Andresen B, Giovannella M, et al. Cerebral oxygenation and blood flow in term infants during postnatal transition: BabyLux project. Arch Dis Child - Fetal Neonatal Ed 2019; 0: f1–f6. [DOI] [PubMed] [Google Scholar]
- 56.Greisen G.Methods to assess systemic and organ blood flow in the neonate. In: Kleinman CS, Seri I. (eds) Hemodynamics and cardiology: neonatology questions and controversies. Elsevier, pp.81–94. [Google Scholar]
Associated Data
This section collects any data citations, data availability statements, or supplementary materials included in this article.
Supplementary Materials
Supplemental material, JCB883751 Supplemetal Material for Validation of diffuse correlation spectroscopy against 15O-water PET for regional cerebral blood flow measurement in neonatal piglets by Martina Giovannella, Bjørn Andresen, Julie B Andersen, Sahla El-Mahdaoui, Davide Contini, Lorenzo Spinelli, Alessandro Torricelli, Gorm Greisen, Turgut Durduran, Udo M Weigel and Ian Law in Journal of Cerebral Blood Flow & Metabolism