Abstract
Loss of normal tissue architecture is a hallmark of oncogenic transformation1. In developing organisms, tissues architectures are sculpted by mechanical forces during morphogenesis2. However, the origins and consequences of tissue architecture during tumorigenesis remain elusive. In skin, premalignant basal cell carcinomas form ‘buds’, while invasive squamous cell carcinomas initiate as ‘folds’. Here, using computational modelling, genetic manipulations and biophysical measurements, we identify the biophysical underpinnings and biological consequences of these tumour architectures. Cell proliferation and actomyosin contractility dominate tissue architectures in monolayer, but not multilayer, epithelia. In stratified epidermis, meanwhile, softening and enhanced remodelling of the basement membrane promote tumour budding, while stiffening of the basement membrane promotes folding. Additional key forces stem from the stratification and differentiation of progenitor cells. Tumour-specific suprabasal stiffness gradients are generated as oncogenic lesions progress towards malignancy, which we computationally predict will alter extensile tensions on the tumour basement membrane. The pathophysiologic ramifications of this prediction are profound. Genetically decreasing the stiffness of basement membranes increases membrane tensions in silico and potentiates the progression of invasive squamous cell carcinomas in vivo. Our findings suggest that mechanical forces–exerted from above and below progenitors of multilayered epithelia–function to shape premalignant tumour architectures and influence tumour progression.
Reporting summary
Further information on research design is available in the Nature Research Reporting Summary linked to this paper.
Physical forces often act within defined boundaries to generate tissue shapes2. Tumours are a primary example of tissue growth within spatial constraints, which include neighbouring cells and extracellular matrix (ECM)3. Mechanical properties and forces acting on solid tumours are likely to be particularly complex, as these tumours are heterogeneous in cellular composition, and they inhabit distinct ECMs4.
Solid tumours that initiate from stratified tissues present an opportunity to investigate the diverse physical constraints involved in tumorigenesis. In the epidermis, proliferative progenitors continually commit to terminal differentiation, exiting the inner (basal) layer and moving upward to replenish the skin’s barrier5. Here, we focus on two common skin cancers that originate from basal epidermal progenitors. Basal cell carcinomas (BCCs), driven by constitutive activators of Sonic hedgehog signalling (for example, SmoM2), bud inward into surrounding stroma but appear to retain their basement membrane and rarely spread to neighbouring tissues6,7. By contrast, squamous cell carcinomas (SCCs), driven by oncogenic activators of RAS/MAPK signalling (for example, HRasG12V; ref.8), initiate as bidirectional tissue folds before becoming invasive and aggressive. Our study unearths previously unappreciated forces from overlying suprabasal tumour cells and underlying ECM that profoundly affect tumour architecture and malignancy.
Tumour architectures of BCCs and SCCs
To explore early steps in BCC and SCC tumorigenesis, we used low-titre in utero lentiviral (LV) delivery9 to selectively transduce Cre recombinase (LV–Cre–H2B–RFP, where H2B is histone 2B and RFP is red fluorescent protein) into the single-layered skin epithelium of embryos at day 9.5 of development (E9.5) from either R26–SmoM2–YFPfl/fl (‘SmoM2’) or HRas-G12Vfl/fl;R26–YFPfl/+ (‘HRasG12V’) mice (Fig. 1a) (where YFP is yellow fluorescent protein). By E18.5, when normal epidermal maturation is complete, early hyperplastic lesions were evident that progressed to BCCs (SmoM2) and benign papillomas or SCCs (HRasG12V) in adulthood (Fig. 1b, c and Extended Data Fig. 1a)10. Even during these initial oncogenic stages, lesions expressing mutant SmoM2 or HRasG12V displayed distinct tissue architectures.
Fig. 1 |. Multilayer in vivo and in silico models of early tumour morphogenesis.
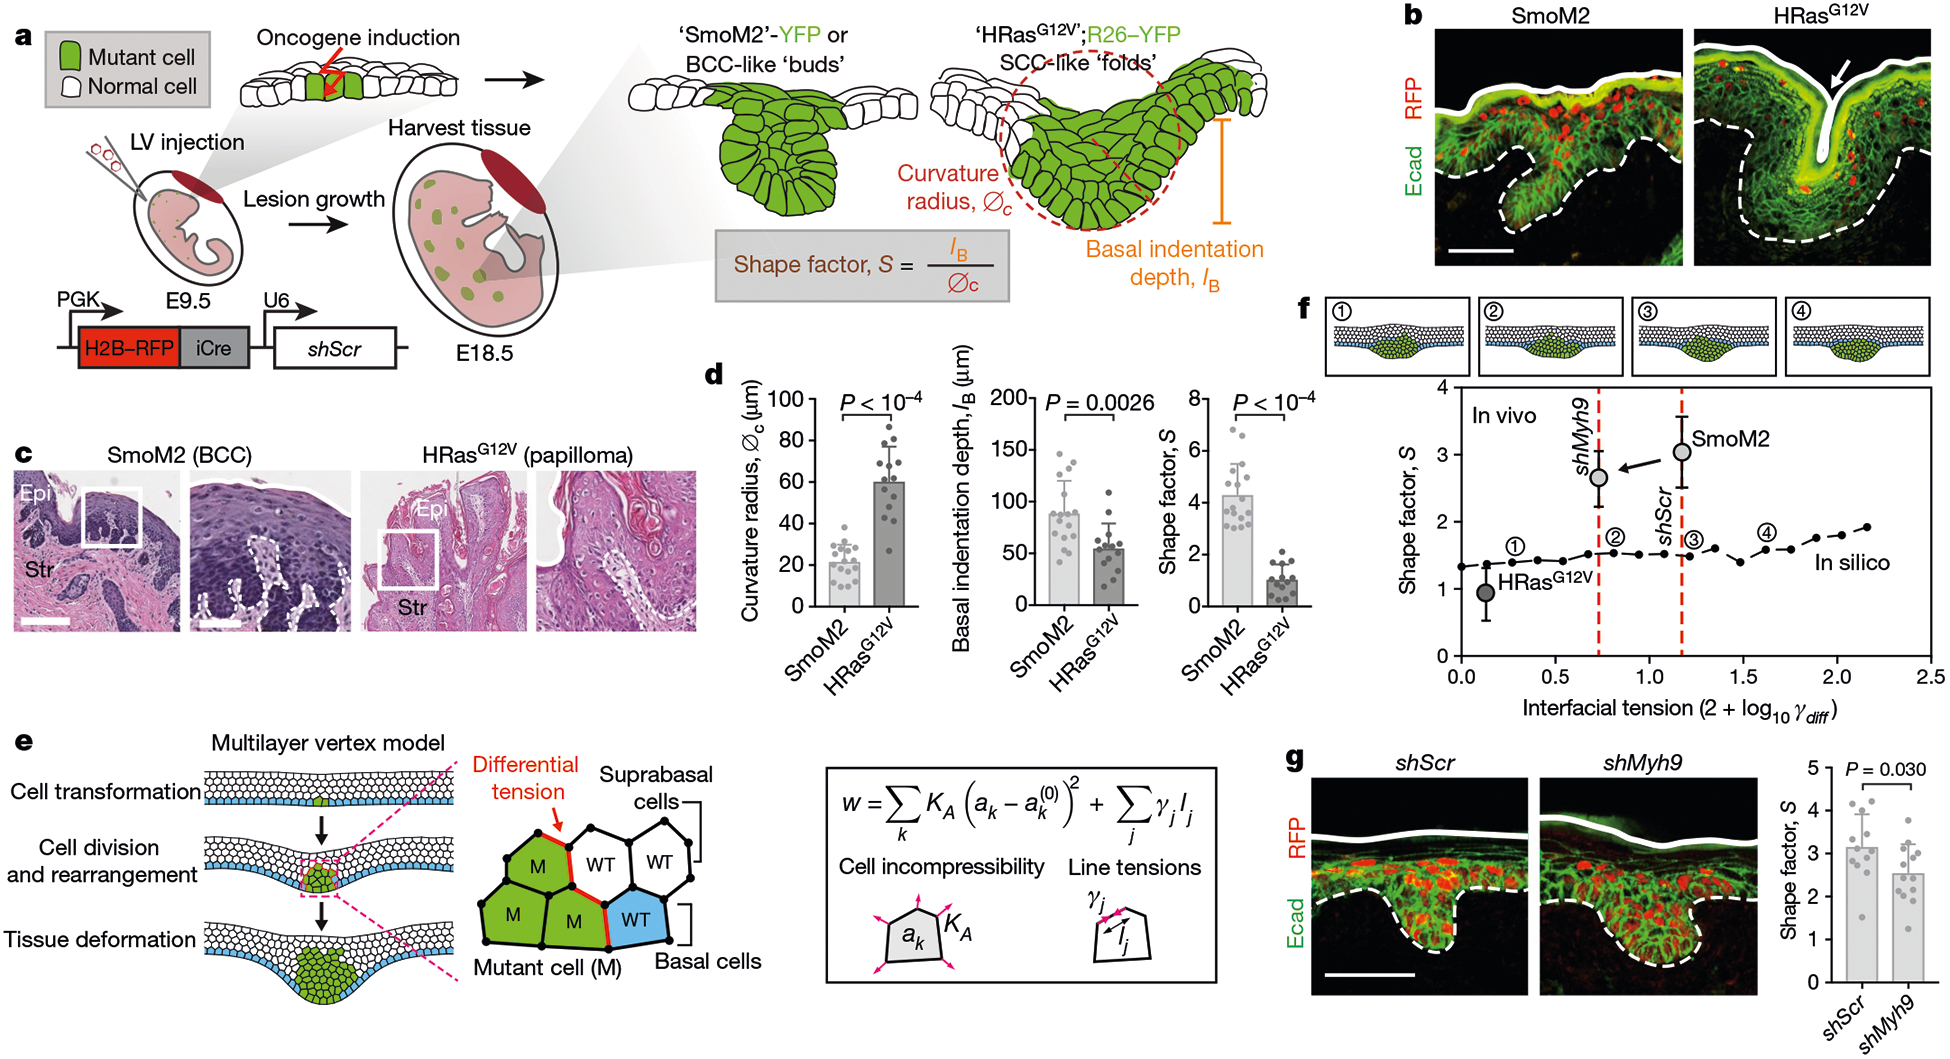
a, Mouse models of oncogenesis. SmoM2 or HRasG12V embryos at E9.5 were transduced in utero with LV–Cre; at E18.5, tissues were harvested and tumour architectures were analysed for the indicated parameters. The lentiviral vector is shown at the bottom left. iCre, improved Cre recombinase; PGK, phosphoglycerate kinase. b, Immunofluorescence images of oncogenic growths. Dotted lines, epithelial–stromal borders; solid lines, apical borders; arrow, apical fold; Ecad, E-cadherin. Scale bar, 50 μm. c, Histology of adult mouse tumours from these mice. Epi, epithelium; Str, stroma. Scale bars: left, 250 μm; right (zoom-in), 100 μm. d, Quantifications of lesions (SmoM2, n = 17; HRasG12V, n = 14) from four embryos (taken from two litters) per condition (means + s.d., two-tailed unpaired t-test). This experiment was independently repeated twice. e, Multilayer epithelium vertex model. A single basal cell is transformed (green) and then undergoes cycles of division. Differential line tensions at interfaces between mutant (M) and wild-type (WT) cells simulate interfacial tensions. Forces are contributed by cell area incompressibility (KA) and apical, basal and lateral line tensions (γj); effective energy (w) is minimized (k refers to an individual cell; j is the cell edge; and ak is the cross-sectional area). See Supplementary Note 1 for details. f, Bottom, effects of varying interfacial tensions (γdiff) on tumour architecture. S values (median, from n = 5 independent simulations) from in silico modelling are plotted as a black line. Example snapshots for the indicated values of γl are shown at the top. Experimental data from d, g (for shMyh9, SmoM2 and HRasG12V; mean ± s.d.) are overlaid. g, Left, immunofluorescence images of SmoM2 embryos transduced with LV–Cre containing either scrambled hairpin control (shScr) or Myh9-targeted shRNA (shMyh9). Scale bar, 50 μm. Right, lesion shape factors (shScr, n = 12; SmoM2, shMyh9, n = 13; mean + s.d., two-tailed unpaired t-test) from four embryos, two litters per condition.
Both SmoM2 and HRasG12V lesions were displaced vertically from the epidermal plane (measured as basal indentation depth, IB), but they had different curvature radii of the basal leading edge (denoted ∅c; Fig. 1a, d). We describe these distinct tissue architectures by a shape factor, S, defined as the ratio of IB to ∅c. High S values indicate deeply invaginating and small curvature radius growths (that is, BCC-like ‘buds’), while low S values indicate high curvature radii and shallow invaginations and/or evaginations (that is, SCC-like ‘folds’) (Fig. 1d).
HRasG12V folds were further distinguished by having an invaginated apical surface (apical indentation depth, IA). Although SmoM2 and HRasG12V lesions could be distinguished by additional morphological parameters, S differentiates these phenotypes over a large range of shape variations in two and three dimensions (Extended Data Fig. 1b–d), demonstrating its utility in quantifying oncogenic tissue architectures.
Role of proliferation in architecture
As expected, proliferation was increased in all oncogenic clones, and this was evident at E15.5, before vertical tissue displacements (Extended Data Fig. 2a). Indicative of cellular crowding, oncogenic basal cells also displayed a higher cell density and more columnar shape (denoted the basolateral aspect ratio, AB) than neighbouring wild-type cells (Extended Data Fig. 2b).
To investigate whether the increased proliferation of oncogenic basal cells within a confined epithelial space drives tissue deformations, we used LV transduction of the cell-cycle inhibitor p27Kip1 (LV–H2B–RFP–TRE–Cdkn1b, where Cdkn1b encodes p27Kip1) to controllably decrease proliferation in developing oncogenic skin (Extended Data Fig. 2c, d). In embryos containing a basal-cell-targeted, tetracycline-inducible trans-activator (Krt14–rtTA), p27Kip1 activation markedly reduced proliferation in transduced patches. This led to a dose-dependent decrease in lesion size and basal indentation in both SmoM2 and HRasG12V oncogenic skins (Extended Data Fig. 2e). Thus, although proliferation provides the driving force for growth expansion and out-of-plane tissue deformation, it does not explain these distinct tumour architectures.
Role of interfacial actomyosin tension
Because actomyosin is a major biophysical driver of architecture in simple epithelia and their associated tumours11,12, we next turned to whether differences in polarized actomyosin-driven tensions might drive differences in tumour architecture in stratified epithelia. We carried out laser ablation of cell junctions at interfaces between mutant basal cells and their neighbours in live embryos. Recoil velocities were substantially higher at interfaces between wild-type and SmoM2 cells than between wild-type and HRasG12V cells (Extended Data Fig. 3a). Staining for the actomyosin contractile machinery corroborated these findings (Extended Data Fig. 3b). These data are consistent with the anisotropic and circumferentially oriented elongation along SmoM2 and wild-type cell borders, and demonstrate differential cell–cell interfacial tension (Extended Data Fig. 3c). Consistent with the differential recoil velocities, changes in actomyosin localization were not seen in HRasG12V lesions.
To systematically explore the physical mechanisms underlying oncogenic tissue morphogenesis in skin, we developed a minimal mechanical model of a multilayered epithelium. We described the tissue in cross-section as a five-cell-layer-wide band with a vertex model13 to mimic stratified epithelial architectures. To model oncogenic transformation, we induced cell proliferation to match experimentally observed cell counts, which resulted in cell deformations, rearrangements and tissue-scale shape changes (Fig. 1e, Supplementary Video 1 and Supplementary Note 1).
To probe the role of measured cell–cell interfacial tensions, we adjusted surface tensions at mutant–wild-type interfaces (γM−WT). Surprisingly, differential cell–cell tension had a minimal effect on lesion architectures in this stratified model (Fig. 1f). Predicted shapes were exclusively bud-like, and the main effect of increasing γM−WT was to increase the compactness and reduce ∅c, thus slightly increasing S. By contrast, varying tension in a monolayer model generated both apically and basally oriented tissue folds (Extended Data Fig. 3d).
Moreover, when we knocked down the dominant myosin II gene Myh9 in SmoM2 mutants, or treated oncogenic skin explant cultures with an inhibitor of the actomyosin regulator ROCK, although actomyosin was markedly altered, only slight deviations in S were observed, and budding was still the dominant phenotype (Fig. 1g and Extended Data Fig. 3e). In line with our multilayered vertex modelling, these data suggest that the biophysical underpinnings of tumour architecture in stratified epidermis are distinct from those in previously studied simple epithelia12.
Biophysical properties of basement membrane
Seeking alternative mechanisms that might affect tumour architectures in stratified tissues, we carried out transcriptional profiling of E15.5 epidermal progenitors. ‘Extracellular matrix’ and ‘collagen IV trimer’ were among the top gene ontology (GO)-term categories that were differentially upregulated (by a factor of two or more; P < 0.05) in SmoM2 versus HRasG12V progenitors (Fig. 2a and Extended Data Fig. 4a–c). Intriguingly, many of these genes (for example, Lamb1, Col4a1/2, Nid1 and Sparc) encode components of the basement membrane–the specialized ECM that is directly underneath basal epidermal progenitors.
Fig. 2 |. The effect of basement-membrane stiffness and assembly on tumour architectures.
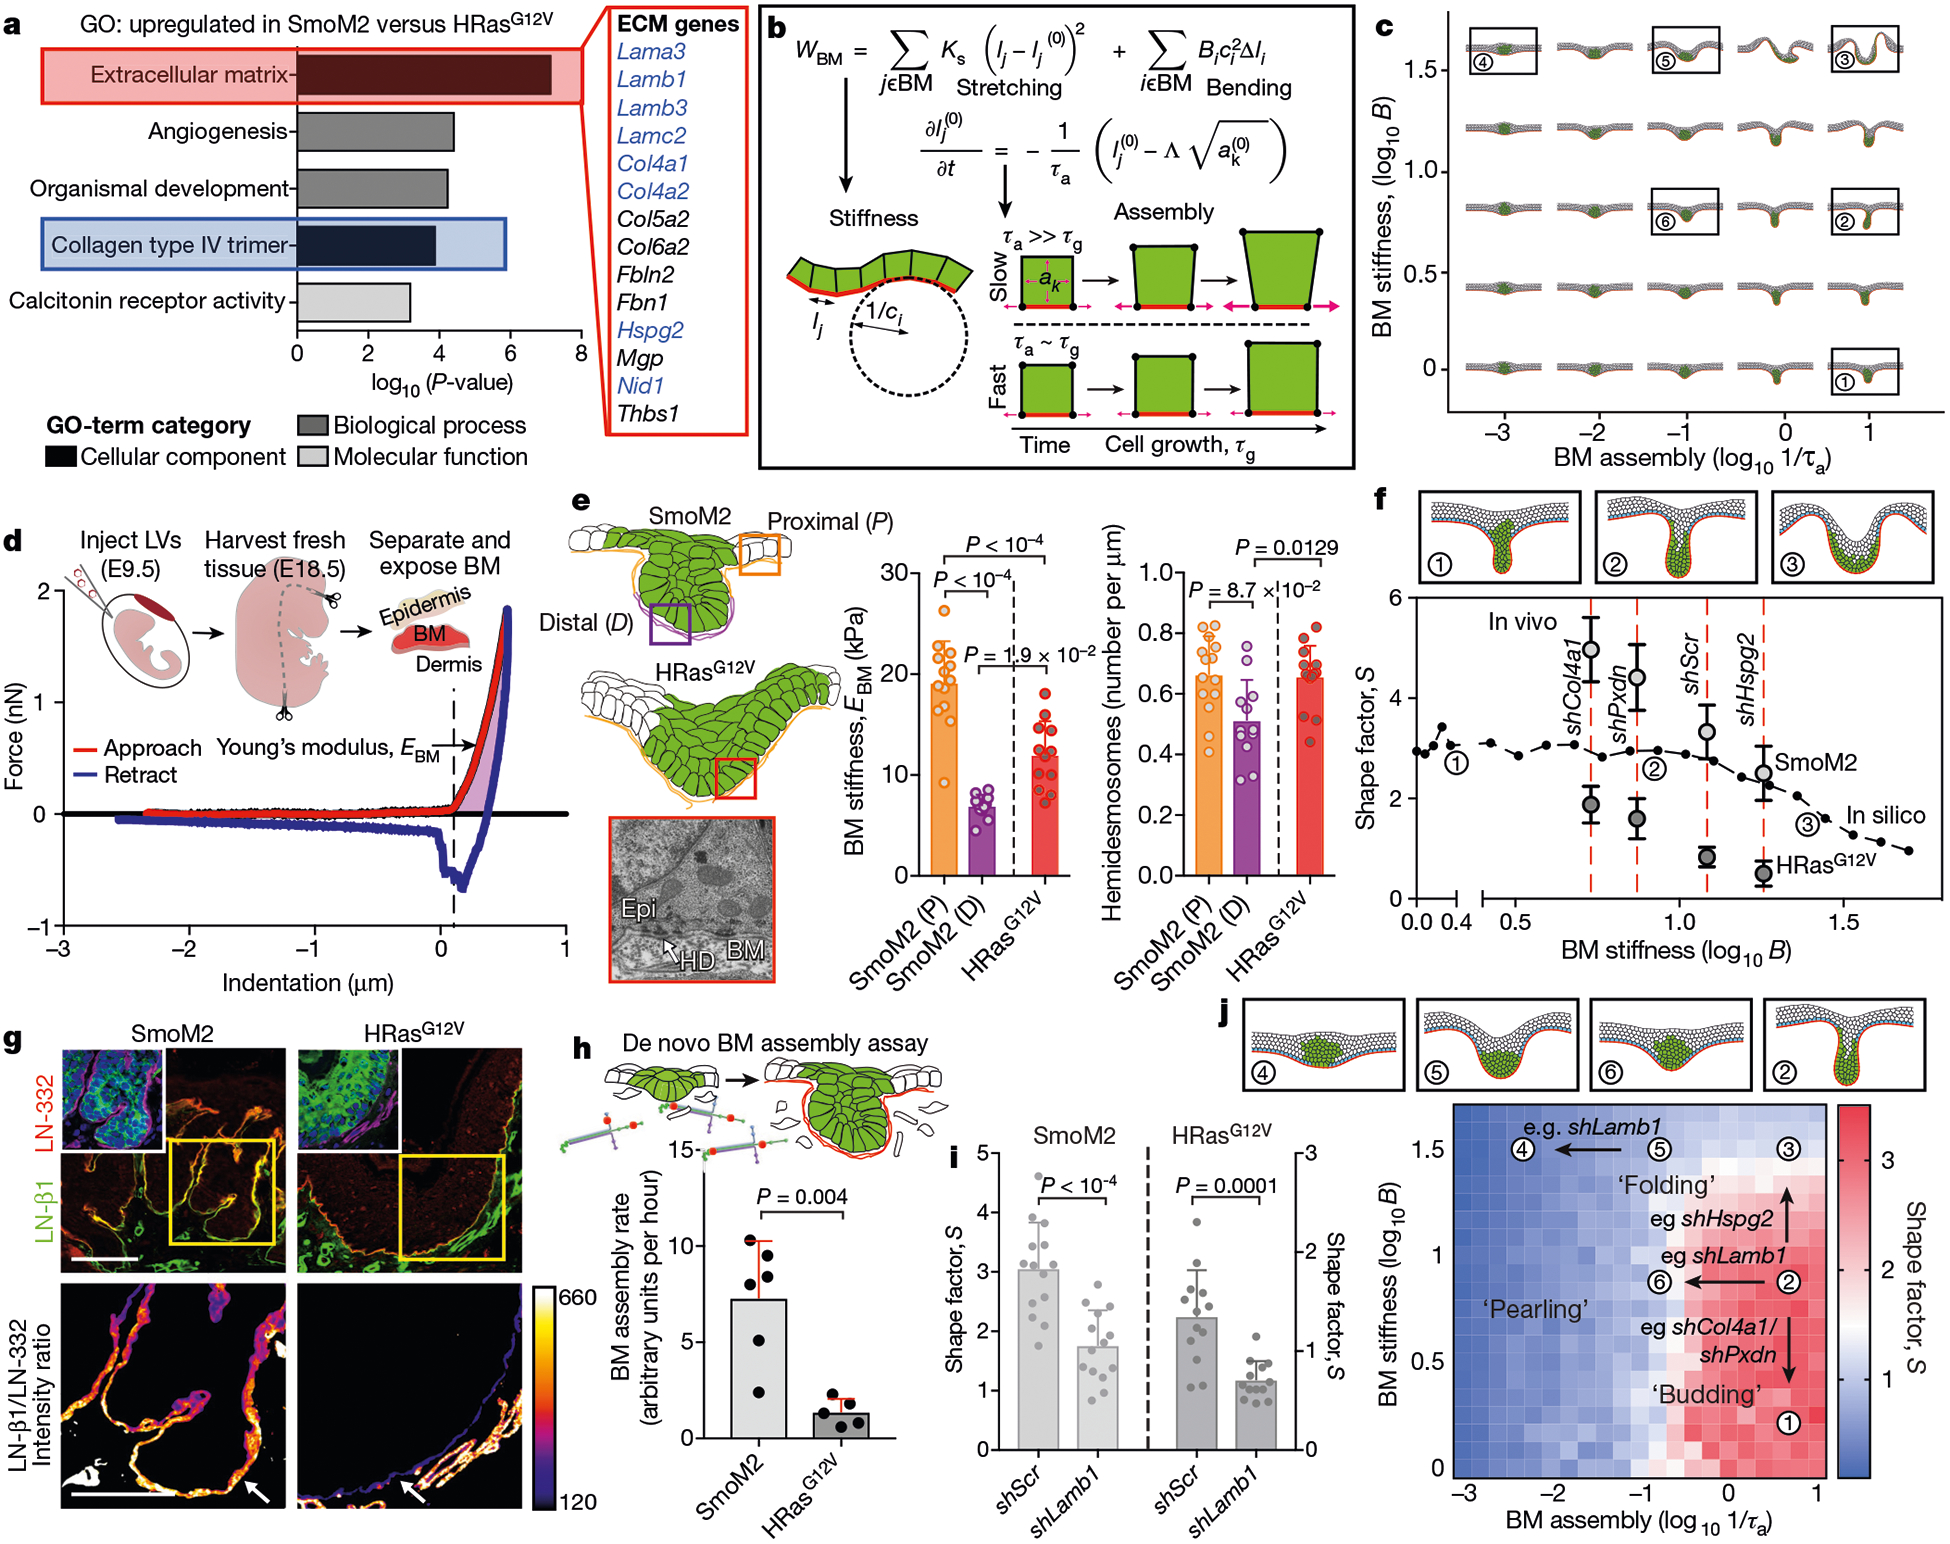
a, Top GO terms from E15.5 basal progenitor cell genes that are upregulated by a factor of two or more in SmoM2 versus HRasG12V embryos; n = 3 independent biological replicates. Statistical significance was determined by unpaired, two-tailed t-test and P values were corrected using the Benjamini–Hochberg method. ECM genes encoding known basement-membrane components are in blue. b, Modelling the biophysical properties of the basement membrane (BM). The membrane stretching modulus (KS), bending modulus (B) and assembly rate (1/τa) are incorporated into the effective energy term (wBM). Assembly of basement membranes is proportional to the rate constant τa, and cell growth is proportional to the rate constant τg (lj and li are the lengths corresponding to cell edge j and vertex i; B is the bending modulus; C refers to curvature; see Supplementary Notes 1, 2 for details). c, Tissue shapes simulated by varying BM stiffnesses (proportional to B) and BM assembly rates. d, AFM measurements made on the BM-exposed dermal surface of EDTA-separated skin. Force-indentation curves are generated, from which the Young’s modulus or stiffness of BM (EBM) is calculated (see Methods). e, Left, diagram showing BM locations for AFM and transmission electron microscopy (TEM). Bottom left, TEM image showing electron-dense hemidesmosomes (HD) at the epidermal–ermal interface. Right, EBM and ultrastructural measurements of oncogenic lesions. AFM: SmoM2 (P), n = 13; SmoM2 (D), n = 11; HRasG12V, n = 12. TEM: SmoM2 (P), n = 14; SmoM2 (D), n = 12; HRasG12V, n = 14. One-way analysis of variance (ANOVA) with Tukey’s multiple comparisons test. f, Effects of varying BM stiffness on tumour architecture. S values (median, n = 5 independent simulations) from in silico modelling are plotted as a black line and overlaid with genetic data from Extended Data Fig. 5g (mean ± s.d.). EBM values are indicated by red dotted lines. g, Immunofluorescence of laminin LN-β1, a component of nascent BMs, at the leading edge of SmoM2 and HRasG12V lesions, compared with LN-332, a component of mature BMs, as shown by the intensity heatmap. Arrows mark epidermal BM. Scale bars, 50 μm. g, BM assembly rates measured by incorporation of fluorescent laminin into native BMs over time (SmoM2,n = 6 explants; HRasG12V, n = 5 explants; two-tailed Mann–Whitney U-test). i, Quantifications of lesion S values following Lamb1 knockdown. SmoM2: shScr, n = 14; shLamb1, n = 14. HRasG12V: shScr, n = 13; shLamb1, n = 13. Two-tailed unpaired t-test; four embryos, two litters each. j, Comparison of experimental data and vertex model simulations for conditions in f, i. S values are plotted, and example simulation snapshots for the indicated values of B and 1/τa are shown. Qualitatively distinct shape regimes include ‘budding’, ‘folding’ and ‘pearling’. All bar graphs show means + s.d.
Owing to the importance of the ECM in shaping tissues during morphogenesis14, we decided to explore how biophysical properties of the basement membrane might affect tumour shapes. We described the basement membrane as a thin elastic film coinciding with the basal side of progenitors15. In thin elastic films, both stretching and bending moduli–Ks and B, respectively–are proportional to the effective Young’s modulus (of the basement membrane in this case, EBM), with stretching modulus Ks being dominant over bending modulus B (Ks ≫ B). We also incorporated a timescale for basement-membrane assembly and remodelling (τa), which describes the rate of local adaptation of basement-membrane length to changes in cell dimensions resulting from growth and proliferation (Fig. 2b and Supplementary Notes 1, 2).
Gratifyingly, computationally simulated tissues were similar in shape to those we observed in vivo. Lowering the stiffness of the basement membrane or increasing its assembly rate (1/τa) enhanced dermally oriented invaginations that are reminiscent of SmoM2 mutant buds, while sufficiently high stiffness values (roughly five times greater than basal cell stiffness) and/or moderate assembly rates resulted in basal and apical indentations, reminiscent of HRasG12V folds (Fig. 2c and Supplementary Video 2).
Importance of basement-membrane stiffness
To investigate the predictions of our model, we first characterized the mechanical properties of basement membranes ex vivo by atomic force microscopy (AFM; Fig. 2d and Extended Data Fig. 5a, b). In contrast to dermis, which displayed nonlinear and plastic deformations, basement membrane was much stiffer, with only slight nonlinear elasticity (Extended Data Fig. 5c). Providing experimental validation of our approximation of basement membrane as a Hookean elastic material over relevant timescales, these data point to the basement membrane as the dominant physical barrier underneath the epidermis.
SmoM2 basement membrane was softer than HRasG12V basement membrane at the distal leading edge of E18.5 buds (Fig. 2e), in agreement with our simulation prediction that softening of the basement membrane accentuates budding features. Moreover, the upper (proximal) SmoM2 basement membrane was stiffer than HRasG12V basement membrane, consistent with increased expression of genes encoding structural membrane components. Further reflecting an increased stiffness of the basement membrane, hemidesmosomal density was elevated in HRasG12V and proximal regions compared with distal tips of SmoM2 lesions. The stiffness of the basement membrane also increased from E15.5 to E18.5, indicative of membrane maturation–a change also accentuated in SmoM2 buds (Extended Data Fig. 5d, e).
To test the functional importance of basement-membrane stiffness in controlling tumour architectures, we began by transducing basal progenitors with short hairpin RNAs (shRNAs) targeting Col4a1, which encodes a key subunit of type IV collagen (colIV)–the predominant structural network that is responsible for the tensile load bearing properties of the basement membrane16,17. AFM measurements revealed that, relative to control scramble hairpins (shScr), shCol4a1 skins displayed a marked decrease (more than 50%) in basement-membrane stiffness (Extended Data Fig. 5f). Col4a1 knockdown in both oncogenic backgrounds accentuated downgrowth while reducing curvature radii, resulting in increased S values (Fig. 2f and Extended Data Fig. 5g).
Decreasing the levels of the colIV-crosslinking enzyme peroxidasin18 (shPxdn) also reduced basement-membrane-stiffness, while decreasing the membrane-associated proteoglycan perlecan (shHspg2) increased stiffness. Notably, irrespective of oncogenic background, S increased when basement-membrane stiffness was reduced, and decreased when membrane stiffness was increased, consistent with our simulations (Fig. 2f and Extended Data Fig. 5f, g). Thus, SmoM2-driven buds were accentuated by reducing membrane stiffness, while HRasG12V-driven folds were favoured by increasing stiffness.
Importance of basement-membrane assembly
Our model also predicted that differences in the dynamics of basement-membrane assembly would markedly affect tissue architecture. Interestingly, de novo assembly-promoting membrane components such as β1-subunit-containing laminin (LN-β1)19 and nidogen were selectively enriched at the distal tips of SmoM2 buds (Fig. 2g and Extended Data Fig. 6a). Moreover, when fluorescently labelled laminin was added to oncogenic skin explant cultures, laminin incorporation into the native basement membrane was more than sixfold higher in SmoM2 than in HRasG12V mutants (Fig. 2h and Extended Data Fig. 6b).
In vivo, Lamb1 shRNA knockdown markedly reduced basement-membrane assembly rates without altering stiffness (Extended Data Fig. 6c). In both oncogenic backgrounds, shLamb1 decreased S, accentuating a folding architecture (Fig. 2i). Conversely, recombinant human laminin-α5β1γ1–the major de novo assembling laminin in skin and BCCs19–21–caused oncogenic skin explants to increase their S values and promote budding architectures (Extended Data Fig. 6d). Simulations accurately predicted these results, providing compelling evidence that rates of assembly and stiffness of basement membranes drive architectural variations (Fig. 2j).
By including biophysical properties of the basement membrane, we also more accurately simulated earlier experimental results. In particular, although cell proliferation had been predicted to have little effect on tumour shapes in the absence of basement membrane, in its presence, increased lesion deformations now surfaced (Extended Data Fig. 7a). Moreover, adding differential cell–cell tensions to the membrane mechanics model accentuated budding and expanded the diversity of tissue shapes (Extended Data Fig. 7b). Finally, although monolayer simulations accurately predicted that decreasing basement-membrane stiffness would increase S, they erroneously predicted that decreasing basement-membrane assembly would increase mutant basal cell crowding. Our multilayer simulations predicted a near-constant density of oncogenic progenitors, which matched that observed upon knockdown of Lamb1 or Col4a1 (Extended Data Fig. 7b–d). Overall, our experiments and simulations best suit a multilayered model with the presence of basement membrane, in which basal cells can transition into suprabasal layers.
Tumour-specific suprabasal stiffness gradients
Thus far, our simulations had treated basal and suprabasal layers analogously, except in their proliferative status. However, our multilayered epithelial simulations led us to wonder whether suprabasal cell mechanics might be an additional biophysical player in sculpting tumour architecture. We therefore turned to addressing whether the changes in gene expression that occur as basal progenitors commit to terminal differentiation22 might affect the skin’s mechanical properties, and if so, how.
We performed AFM and coincident optical imaging to measure the cell-layer-specific moduli of skin (Fig. 3a). Interestingly, the basal layer was roughly five times stiffer than papillary dermis (3 kPa versus 0.6 kPa), while spinous and granular layers, marked by keratin K10, were four times stiffer than the basal layer. Harbouring flattened layers of dead, enucleated squames, the outermost stratum corneum showed the greatest stiffness.
Fig. 3 |. Tumour-specific subrabasal stiffness gradients.
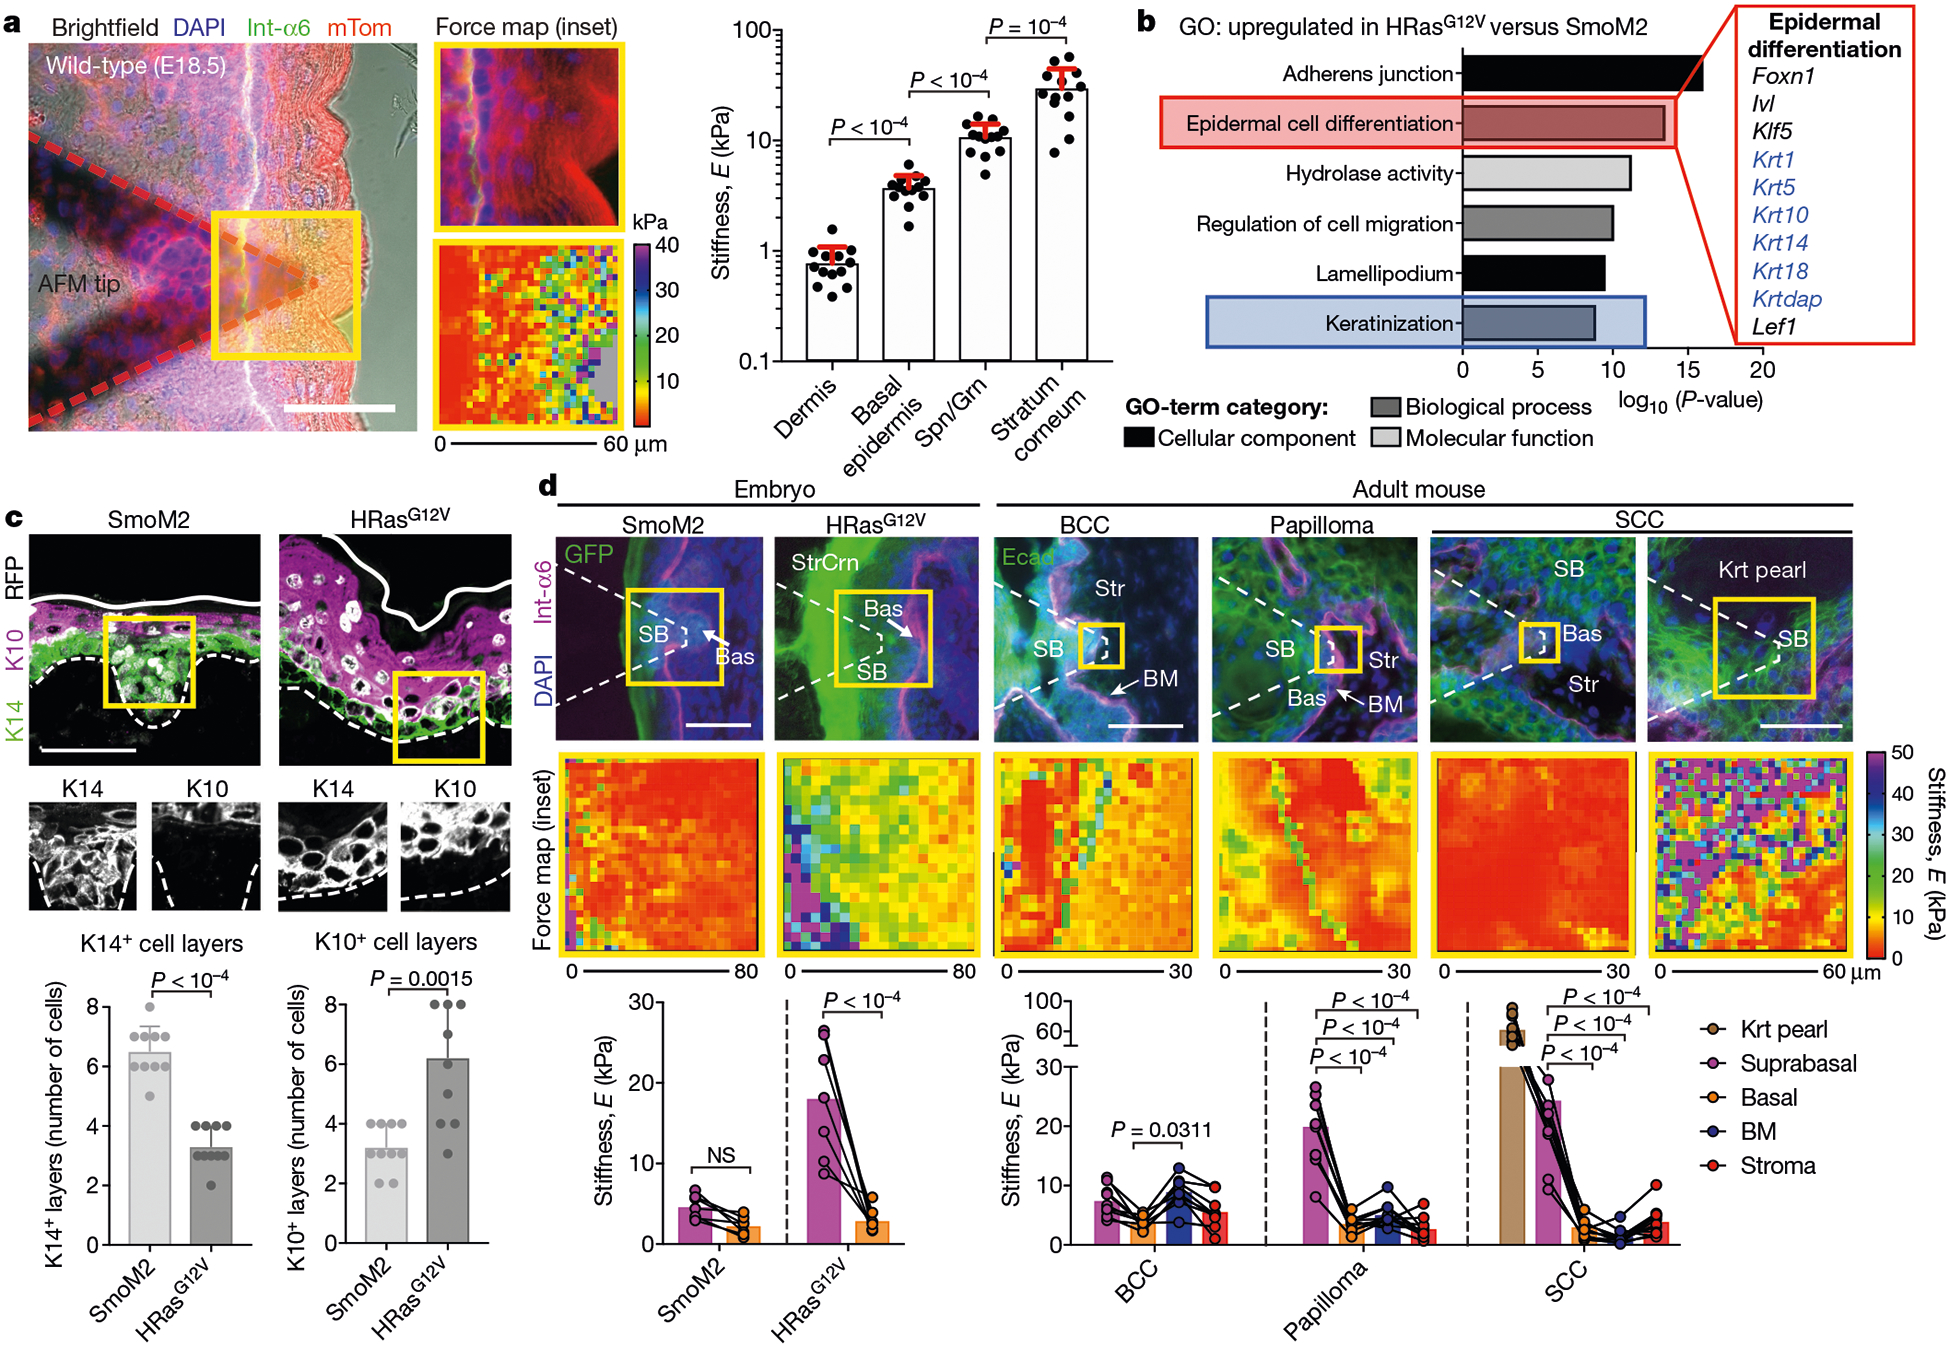
a, Left, fluorescence image of fresh E18.5 skin overlaid with an AFM tip, probed for spatially resolved stiffness measurements. DAPI stains nucleic acid; Int-a6 encodes integrin α6 and marks epithelial–stromal borders; mTom (mTomato) stains plasma membranes. Centre, force maps of the yellow-boxed region. Right, stiffness values for layers of stratified skin (dermis, basal epidermis, spinous and granular suprabasal layers (Spn/Grn), and stratum corneum; n = 13 regions from four embryos; mean + s.d.; Holm–Sidak’s multiple comparisons test). b, Top GO terms for mRNAs upregulated by twofold or more in HRasG12V versus SmoM2 progenitors, from n = 3 independent biological replicates. Keratins are shown in blue. Statistical significance was determined by unpaired two-tailed t-test and P-values were corrected using the Benjamini–Hochberg method. c, Top, immunofluorescence images of keratin 14 (K14)+ and keratin 10 (K10)+ expression, and bottom, their quantifications (means + s.d.) for SmoM2 (n = 11) and HRasG12V (n = 11) lesions from three embryos each. d, AFM stiffness maps of oncogenic embryonic and adult SmoM2- and HRasG12V-driven lesions. Suprabasal (SB), basal (Bas), BM, keratin pearl (Krt pearl) and stroma (Str) tumour regions are indicated. Paired measurements of each tumour region for SmoM2 (n = 7), HRasG12V (n = 7), BCCs (n = 9), papillomas (n = 9) and SCCs (n = 9) lesions/tumours are shown (means; two-way ANOVA with Bonferroni’s multiple comparisons test; NS, not significant). Scale bars, 50 μm.
SmoM2 and HRasG12V progenitors undergo distinct differentiation programs23. Our transcriptional profiling highlighted these distinctions, with the GO terms ‘epidermal differentiation’, ‘keratinization’ and ‘adherens junction’ being enriched in HRasG12V versus SmoM2 basal cells (Fig. 3b). Correspondingly, suprabasal SmoM2 bud cells were K14+ while HRasG12V suprabasal layers were expanded and K10+ (Fig. 3c). The mechanical properties mirrored these differences: HRasG12V mutants exhibited a large stiffness difference between suprabasal and basal compartments that was nearly absent in SmoM2 mutants (Fig. 3d).
Notably, tumour architectures and differentiation-correlated stiffness gradients extended to adult mouse and human BCCs, papillomas and SCCs. BCCs exhibited only a slight elevation in stiffness (roughly 1.5-fold) from basal to suprabasal layers, while having diminished curvature radii by comparison with SCC counterparts (Fig. 3d and Extended Data Fig. 8a, b). A pronounced stiffening of the basement-membrane region was seen at the BCC–stroma interface. This correlated with RNA-sequencing data, which showed that purified basal progenitors from adult SmoM2 tumours that had invaginated into the dermal compartment (α6hi YFP+ Sca1neg) had substantially higher expression of ECM/basement-membrane genes than those that remained within the inter-follicular epidermis (α6hi YFP+ Sca1+; Extended Data Fig. 8c, d). By contrast, benign HRasG12V-driven papillomas had a modestly stiff basement membrane but substantial suprabasal stiffening. Most notable were SCCs: their hallmark keratinized pearls exhibited extraordinary stiffness (Fig. 3d). Correspondingly, and characteristic of invasive cancers, SCCs showed the lowest stiffness within the basement-membrane region compared with the other tumours.
Stratified cell mechanics and tumour invasion
Given these results, we decided to incorporate a suprabasal stiffness gradient into our multilayered simulations (Fig. 4a). We allowed progenitors to ‘differentiate’ and move upward into this pre-existing suprabasal stiffness gradient (Fig. 4a and Supplementary Note 3). As a consequence, tumours with high S shapes shifted towards higher membrane stiffness and reduced apical indentation was observed (Fig. 4b, Extended Data Fig. 9a, b and Supplementary Video 3).
Fig. 4 |. A role for the mechanics of stratified cells in tumour invasion.
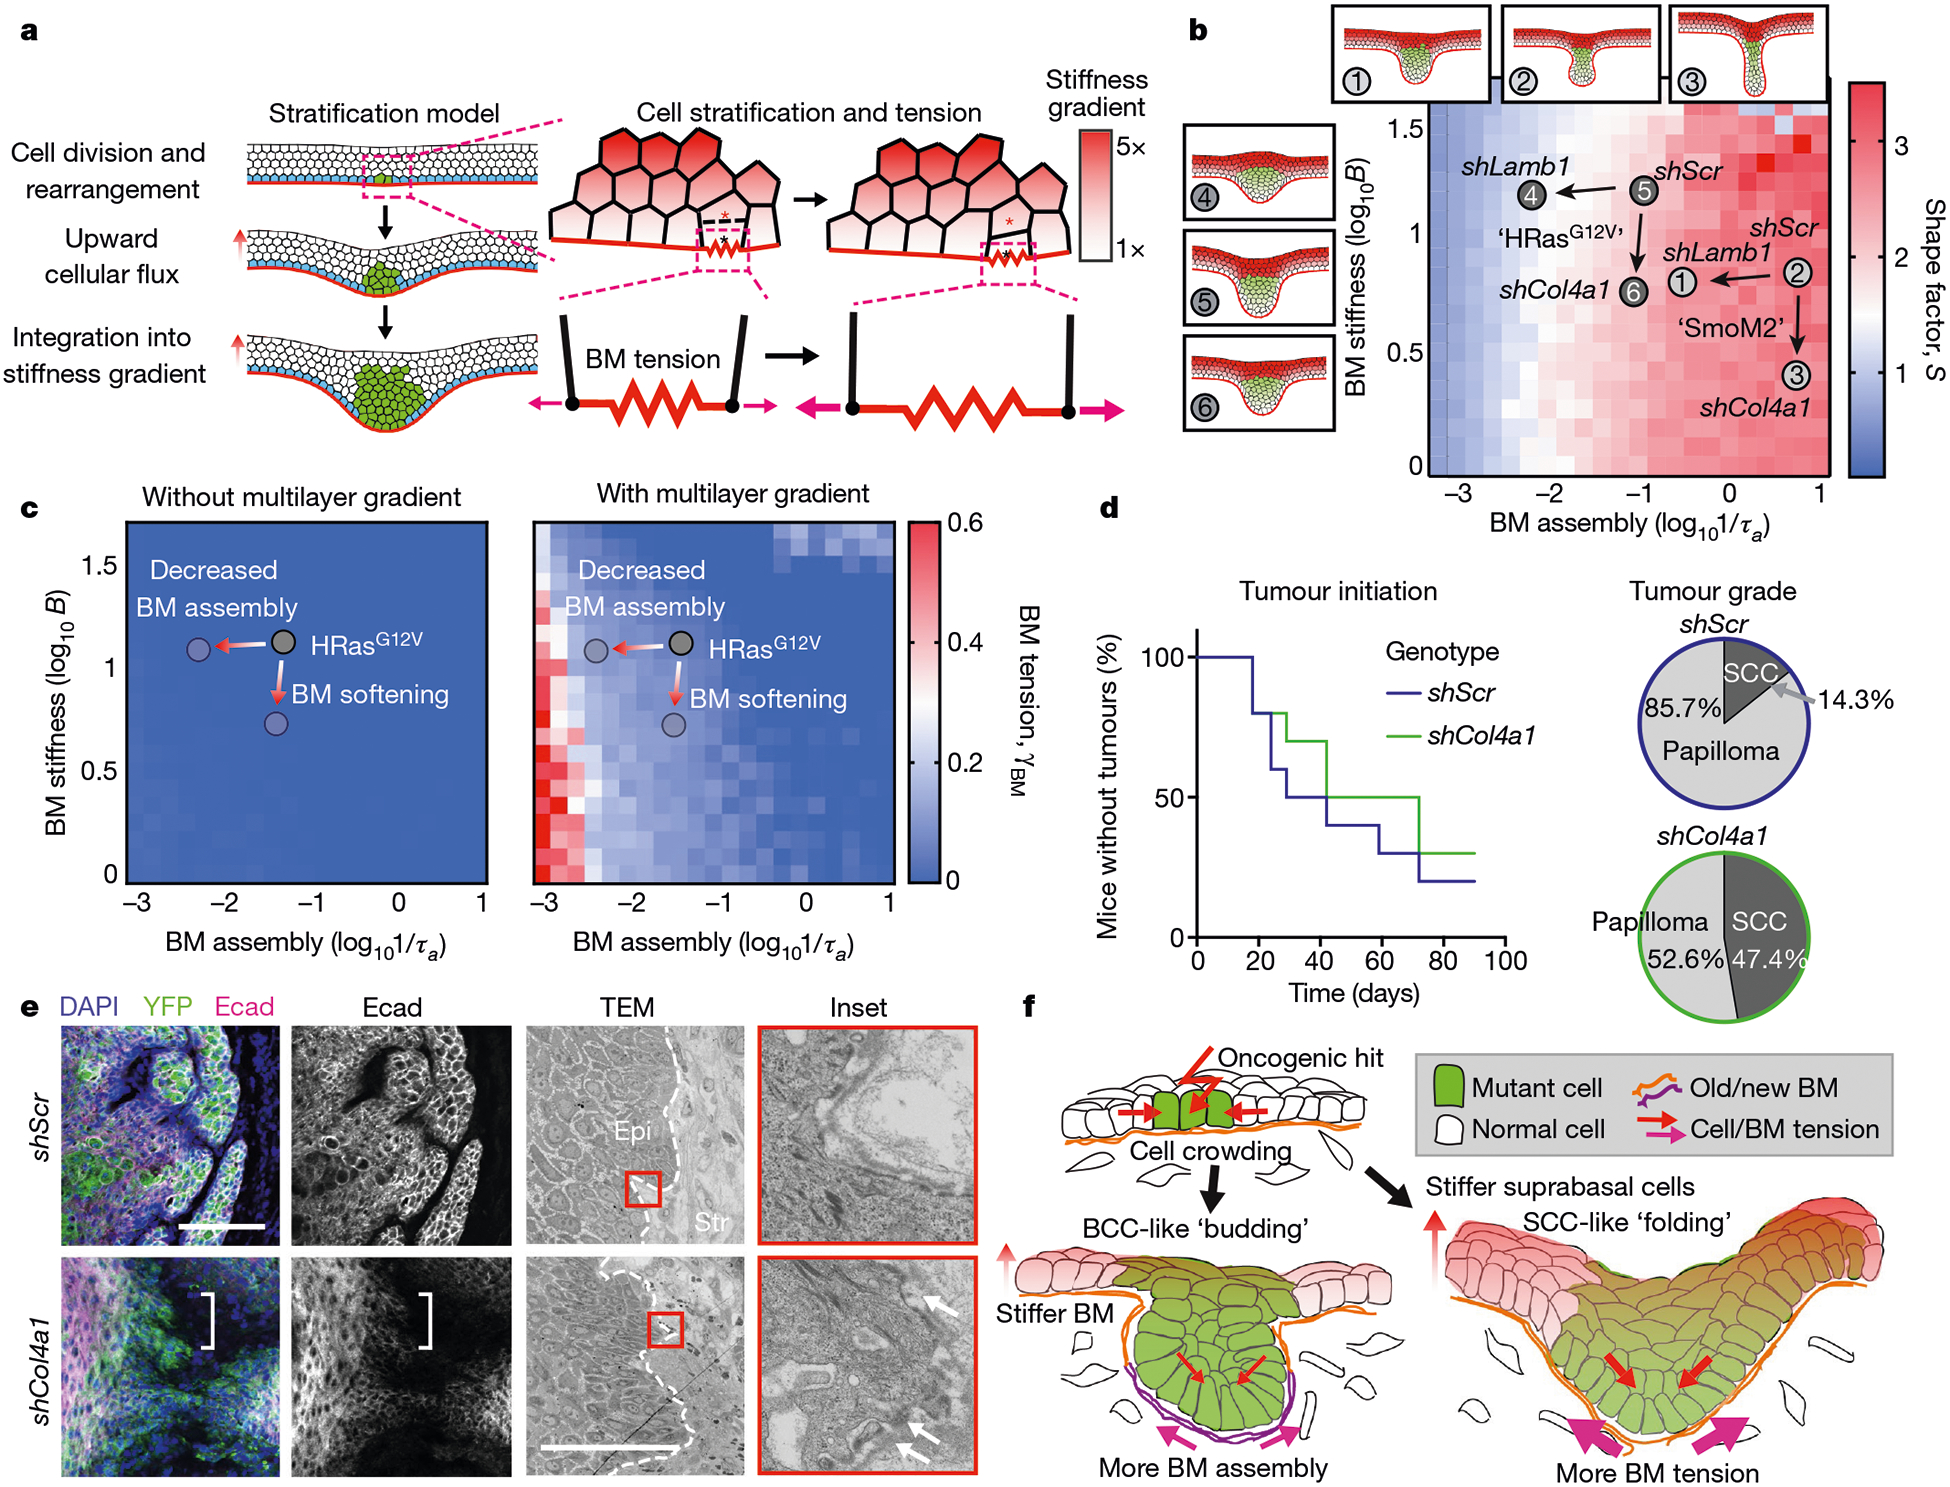
a, Multilayered epithelial vertex model. Tumour cells move upwards into suprabasal layers in a manner that depends on junctional tension and division orientation, while lateral cell tension increases as a function of vertical position. Red and black asterisks indicate a pair of dividing cells. b, Comparison of S values between experimental data and multilayer vertex model simulations that include a suprabasal stiffness gradient. S values are indicated by heatmap. Tissue architecture examples for experimental parameter values of shScr, shLamb1 and shCol4a1 are shown. Arrows denote changes in basement-membrane properties due to shRNAs. c, Changes in BM tension resulting from the multilayer stiffness gradient. Extensile tensions acting on the BM were calculated in the absence (left) and presence (right) of this gradient. d, Impact of decreasing BM stiffness (shCol4a1) on the percentage of mice bearing HRasG12V tumours over time. Papillomas and SCCs were distinguished by tumour pathology upon completion of the experiment (shScr, n = 10 mice; shCol4a1, n = 10 mice). e, Immunofluorescence and ultrastructure imaging of shCol4a1 versus shScr tumours from age-matched littermates. Regions with Ecad downregulation (left, brackets) and BM discontinuities (right, arrows) are indicated. Scale bars, 50 μm. f, Summary of the mechanical forces that affect tumour architecture and invasion.
To assess the functional significance of these predicted effects, we transduced embryos harbouring a suprabasal-specific involucrin promoter driving rtTA (Inv–rtTA) with TRE–Klhl16, whose encoded ubiquitin ligase causes degradation of keratin networks24. Doxycycline induction resulted in reduced suprabasal cell stiffness and increased IA values in HRasG12V mutants (Extended Data Fig. 9c–e).
Although the consequences of suprabasal stiffening for tumour shape were relatively modest, our model intriguingly predicted marked effects on extensile tensions of the tumour basement membrane (Fig. 4a, c). In a multilayered gradient of suprabasal stiffness, basement-membrane tension was predicted to be pronounced under conditions in which membrane-assembly rates were slow, namely in HRasG12V-driven tumours (Fig. 4c). Moreover, the effects of extensile tensions were predicted to be most pronounced when the stiffness of the basement membrane was reduced and suprabasal stiffness was elevated.
To test these predictions in vivo, we knocked down Col4a1 in HRasG12V skin progenitors and monitored the effects of reducing the stiffness of the basement membrane as tumours progressed from papillomas to SCCs in adult mice. Although the incidence of papilloma formation (that is, tumour initiation) was comparable to the effects of shScr, shCol4a1 greatly accelerated papilloma progression into invasive SCCs (Fig. 4d). Moreover, at the ultrastructural level, the basement membrane became considerably more discontinuous in shCol4a1 than in shScr SCCs, while the tumour epithelium showed hallmarks of invasion, including spindle-shaped cell morphology and diminished E-cadherin at cell–cell borders (Fig. 4e).
Discussion
By combining computational predictions with biophysical measurements and genetic manipulations, we have systematically unearthed constraining mechanical forces that coalesce at the basement membrane to govern the architecture and behaviour of cancers originating from stratified squamous epithelia (Fig. 4f). Given the distinct material properties that can be generated by oncogene-induced changes in the stiffness and assembly of basement membranes, and also in cellular differentiation programs2,25, the combination of these influences begins to explain the remarkable diversity in architectures of complex tissues and their cancers, and sets tumours of stratified epithelia apart from their simple epithelial counterparts12.
Our findings are interesting in light of recent reports that the mechanics of basement membranes can influence tissue morphogenesis and invasion26–30. We have shown that if mechanical forces transmitted by overlying differentiated cells are sufficiently strong, as they are in SCCs, tensile stresses experienced in the underlying basement membrane may contribute to loss of membrane integrity. Our findings also suggest that once integrity is lost–for instance through tumour-induced enzymatic digestion of ECM–forces emanating from overlying differentiated tumour cells may mechanically drive the invasion of tumour-initiating progenitors at the stromal border.
Methods
Mouse lines and lentiviral constructs
All animal experiments were performed in the Association for Assessment and Accreditation of Laboratory Animal Care (AAALAC)-accredited Comparative Bioscience Center at The Rockefeller University. Experiments were performed in accordance with National Institutes of Health (NIH) guidelines for Animal Care and Use, approved and overseen by The Rockefeller University’s Institutional Animal Care and Use Committee (IACUC). The following previously generated mouse lines were used here: Rosa26–SmoM2–YFPfl/fl (ref.31), FrHRas–G12Vfl/fl (ref.32), Rosa26–EYFPfl/fl (ref.33), Rosa26mTmG (ref.34), Krt14–rtTA (Fuchs laboratory) and hIVL–rtTA (ref.35). C57Bl6J/CD1 mixed-background strains were used. Embryos were injected with lentivirus at 9.5 days post-coitum (dpc) as described9. To induce recombination of transgenic cassettes, the following lentiviruses were injected: LV–Cre, LV–nls–iCreH2BRFP, or LV–nls–iCreH2BGFP9. shRNA clones were obtained from The RNAi Consortium (TRC) shRNA library (Sigma), present in the pLKO.1-puro vector and tested for knockdown efficiency in primary mouse keratinocytes isolated as previously described41. These cells were not routinely tested for mycoplasma. The puro cassette was swapped out for an H2B–RFP marker before transfection into 293-FT cells for high-titre lentivirus production.
To genetically manipulate basal cell proliferation, we cloned mouse Cdkn1b (GenBank accession number NM009875) complementary DNA (Origene, catalogue number MR201957) into doxycycline-inducible TRE-driven pLKO.1 vectors35 downstream of the TRE promoter using NheI/EcoRI restriction sites. Lentivirus was injected individually or co-injected with LV–Cre into SmoM2;Krt14–rtTA+ mice. To genetically manipulate the stability of suprabasal cell keratin, we introduced a gene encoding a fusion of monomeric (m)RFP1 to Kelch-like protein 16 (KLHL16; Uniprot accession number Q9H2C0)24. Both mRFP1 and KLHL16 were assembled from Integrated DNA Technologies (IDT) gblocks and cloned into our modified pLKO.1 vector downstream of the TRE promoter using NheI/EcoRI restriction sites. Lentivirus was injected into hIVL–rtTA mice35 or those crossed to FrHRas–G12Vfl/fl.
shRNA sequences
Short hairpin RNA sequences were as follows–Myh9 shRNA 1 (The RNAi Consortium (TRC) clone number (TRCN) 0000071504): 5′-CGGTAAATTCATTCGTATCAA-3′; Myh9 shRNA 2 (TRCN0000071507): 5′-GCGATACTACTCAGGGCTTAT-3′; Col4a1 shRNA 1 (TRCN0000311578): 5′-TCCTGGACAGGCACAAGTTAA-3′; Col4a1 shRNA 2 (TRCN0000306 536): 5′-ATCGGACCCACTGGTGATAAA-3′; Pxdn shRNA (TRCN0000 217715): 5′-GCGGAAAGCACTAAGTGTAAA-3′; Hspg2 shRNA (TRCN00002 46981): 5′-AGCCTGACAGTGTCGAGTATA-3′; Lamb1 shRNA 1 (TRCN 0000094314): 5′-CGCAGGTAGAAGTGAAATTAA-3′; Lamb1 shRNA 2 (TRCN0000309482): 5-’CGCAGGTAGAAGTGAAATTAA-3′; scramble shRNA (SHC002): 5′-CAACAAGATGAAGAGCACCAA-3′.
High-titre lentivirus production
We used 293FT cells from Thermo Fisher Scientific (catalogue number R70007). The production of vesicular stomatitis virus G (VSV-G) pseudotyped lentivirus was performed by calcium phosphate transfection of 293FT cells with pLKO plasmids and helper plasmids pMD2.G and pPAX2 (Addgene catalogue numbers 12259 and 12260). Viral supernatant was collected 46 h after transfection and filtered through a 0.45-μm filter. For in utero lentiviral transduction, viral supernatant was concentrated by ultracentrifugation. Final viral particles were resuspended in viral resuspension buffer (20 mM Tris (pH 8.0), 250 mM NaCl, 10 mM MgCl2 and 5% sorbitol) and 1 μl of viral suspension was injected in utero into E9.5 embryos9.
Immunofluorescence and antibodies
Mouse back skins were dissected and either embedded directly in optimal cutting temperature compound (OCT; premium frozen section compound, from VWR) or fixed with 4% paraformaldehyde (PFA) in phosphate-buffered saline (PBS) for 1 h at room temperature. For whole-mount imaging, embryos were fixed for 1 h in 4% paraformaldehyde, and back skin was dissected at all time points. Following fixation, samples were permeabilized in 0.3% PBS-Triton for 3–4 h at room temperature, and blocked in blocking buffer (5% donkey serum, 2.5% fish gelatin, 1% bovine serum albumin (BSA), 0.3% Triton in PBS) for 1 h at room temperature. Samples were incubated with primary antibodies at 4 °C overnight, washed for 3–4 h in PBS-Triton at room temperature, and then incubated with secondary antibodies together with 4′,6-diamidino-2-phenylindole (DAPI) overnight. Back skins were mounted in ProLong diamond antifade mountant with DAPI (Invitrogen) for imaging. For sections, back skin was placed on tissue paper, cut into strips, embedded and frozen in OCT (Leica), and sectioned with a Leica cryostat (producing sections of 12–16 μm). 5-Ethynyl-2′-deoxyuridine (EdU) was administered via intraperitoneal injection of pregnant females, which were sacrificed 30 min or 1 h post-injection; embryos were then dissected from the uterine horns. EdU labelling of embryos was performed using the Click-iT Alexa Fluor 647 Imaging kit (Thermofisher) according to the manufacturer’s instructions before application of primary and secondary antibodies. Antibodies used were as follows: rat anti-RFP (Chromotek, 5F8; 1:1,000), rabbit anti-RFP (MBL, PM005; 1:1,000), chicken anti-GFP (Abcam, ab13970; 1:2,000), goat anti-P-cadherin (R&D, AF761; 1:500), rabbit anti-E-cadherin (Cell Signaling Technology, 9835; 1:500), rat anti-E-cadherin (M. Takeichi, 1:200), guinea pig anti-K14 (Fuchs laboratory; 1:500), rabbit anti-K10 (Covance, poly19054; 1:1,000), rabbit anti-collagen type IV (Abcam, ab6586; 1:500), rat anti-nidogen (Santa Cruz Biotechnology, ELM1; 1:200), rat anti-laminin-β1 (Abcam, LT3; 1:100), rabbit anti-laminin-α5 (a gift from J. Miner, Washington Univ. St Louis; 1:500), rabbit anti-laminin-332 (a gift from P. Marinkovich, Stanford Univ.; 1:500), mouse anti-phospho-S22-myosin light chain 2 (Cell Signaling Technology, 3675; 1:100), mouse anti-vimentin (Dako, 3B4; 1:200) and rat anti-Sca-1 (Becton Dickinson, D7; 1:200). All secondary antibodies used were raised in a donkey host and were conjugated to one of AlexaFluor488, AlexaFluor546 or AlexaFluor647 (Life Technologies; 1:500). Rhodamine–RRX phalloidin (Life Technologies) was used to label F-actin (1:40).
Skin explant cultures
Back skins were excised from E16.5 embryos and placed into sterile PBS. Explants were cut in half along the anterior–posterior axis to compare morphogenesis of treated versus vehicle control skin. Each explant half was placed dermis side down onto a 1.0-μm-pore-size PET Falcon cell culture insert (Becton Dickinson). Culture inserts containing skin explants were placed in prewarmed keratinocyte culture medium, and explants were kept at 37 °C, 7.5% CO2 for the duration of the experiment. For actomyosin manipulation studies, 50 μM of the ROCK inhibitor Y-27632 or vehicle control (dimethylsulfoxide, DMSO) was added and samples were harvested after 24 h. For assays of basement-membrane assembly rate, laminin isolated from Engelbreth–Holm–Swarm (EHS) tumours (Millipore) was labelled with the AlexaFluor647 antibody labelling kit (A20186, ThermoFisher) according to the manufacturer’s instructions, or rhodamine-labelled laminin was purchased (LMN01-A, Cytoskeleton Inc). Labelled laminin or vehicle control (PBS) was then added to explant cultures at 5 μg ml−1. After 2 h, 4 h, 8 h or 16 h in culture, tissues were embedded in OCT blocks and prepared for immunofluorescence staining of the endogenous basement-membrane markers nidogen and LN-322. For gain-of-function laminin experiments, recombinant human LN-511 (BioLamina) was added at 100 μg ml−1 and explants were cultured for 24 h before fixation, OCT embedding, and immunofluorescence staining.
Microscopy
Confocal images were acquired using a spinning disk confocal system (Andor Technology) equipped with an Andor Zyla 4.2 camera and Yokogawa CSU-W1 (Yokogawa Electric, Tokyo) spinning disk head on a Nikon TE2000-E inverted microscope base. Four laser lines (405 nm, 488 nm, 561 nm and 625 nm) were used for near-simultaneous excitation with a ×40/1.3 numerical aperture (NA) CFI Plan Fluor oil objective. The system was driven by Andor IQ3 software. Images of cryosections were acquired using a Zeiss Axio Observer.Z1 epifluorescent/brightfield microscope with a Hamamatsu ORCA-ER camera and an ApoTome.2 slider (to reduce light scatter in the z direction), controlled by ZEN Blue (Carl Zeiss, Inc.) software. All images were assembled and processed using Fiji (NIH), CellProfiler (Broad Institute) and Imaris (Oxford Instruments).
Laser ablation
Junctional laser ablations were performed on an inverted LSM 880 NLO laser scanning confocal and multiphoton microscope (Zeiss) system using a tunable Ti:sapphire near-infrared laser (Chameleon Ultra II, Coherent Scientific) tuned to 800 nm, similar to the system described in ref.36. Laser power and dwell time were calibrated per experiment, but power was typically between 80% and 100% transmission at a scan speed of six or five repetitions (a dwell time of 90–140 μs). Quantification of the effects of ablation was performed by manually tracing the displacement of neighbouring tricellular junctions every two frames. Instantaneous retraction velocity was measured by linear fitting of junction displacement immediately following laser ablation and calculation of the slope37.
Image processing and analysis
Quantification of cell proliferation.
Proliferation was inferred from the incorporation of labelled nucleotide analogues following a 1 h EdU pulse. EdU+ and total basal cell nuclei were identified and counted manually on the basis of EdU and DAPI signals, respectively. Keratin 14 or P-cadherin staining was used to verify that EdU+ cells could be found within the basal layer. The total number of EdU+ cells was then plotted as a fraction of the total number of RFP+ basal cells. Measurements were pooled between multiple animals of the same genotype and used to perform unpaired analyses.
Quantification of tissue and cell morphology.
Multichannel immunofluorescence images were imported into CellProfiler, and maximum projection images of small (10–14 μm) z-stacks were assembled. The region of epidermal tissue was identified using an adaptive Otsu thresholding strategy based on E-cadherin or keratin 14 staining. The object region of interest comprising the oncogenic lesion was then identified by H2B–RFP staining and manual selection. Rolling circles were fit to the basal-most lesion surface, from which curvature radii (∅c) were calculated. Ferret diameters, defined by two lines tangential to the lateral lesion edges and perpendicular to the basal layer, were calculated. A straight line perpendicular from the basal layer to the dermal-most tip of the lesion measured basal indentation depth (IB), and shape factors (S) were calculated according to the equation in Extended Data Fig. 1b. Oncogenic cells were classified on the basis of the H2B–RFP signal, and the length of the basement-membrane interface was identified by α6 integrin or LN-332 staining, or manually drawn. Measurement of cell area and elongation was performed on whole-mount confocal images. Cells were segmented on the basis of cortical E-cadherin staining using a watershed algorithm. Cell elongation is defined as the ratio of major and minor axes of automatically segmented cells.
Quantification of basement-membrane assembly.
Multichannel images were imported into CellProfiler, and, after background subtraction, adaptive Otsu thresholding was used to identify and mask the endogenous basement membrane on the basis of the LN-α5 immunofluorescence signal. Fluorescence signals from AlexaFluor647-labelled LN (AF647-LN) were then measured within the endogenous basement-membrane mask, and a ratiometric intensity value for AF647-LN to LN-α5 signals was calculated on a per-pixel basis. Ratio-metric intensity values were calculated over 2 h, 4 h, 8 h and 16 h culture times, and a linear regression was applied to the data, from which the slope was determined. This slope gave the basement-membrane assembly rate (in fluorescence units per hour).
Atomic force microscopy
Tissue preparation for AFM measurements.
To prepare skin for measurements of basement-membrane stiffness, we excised backskin at E18.5 and incubated it in 50 mM EDTA (EDTA)/PBS at 37 °C for 30 min. The epidermis and dermis were manually separated and fixed with 4% PFA for 1 h at room temperature to verify separation and lentivirus infection efficiency by optical microscopy, or the dermis was prepared directly for AFM. The dermis with basement membrane side up was affixed to a glass-bottom Petri dish using a small volume (5–8 μl) of Matrigel, after which samples were maintained in PBS with cOmplete protease-inhibitor cocktail (Roche) for the duration of the experiment. For adult tumours, freshly excised tumours were flash-frozen in OCT, and 20-μm-thick cryosections were generated. Tissue was affixed to poly-d-lysine-coated coverglass and stained for E-cadherin (Cell Signaling Technology, 9835; 1:200), α6 integrin (clone GoH3, Biolegend; 1:200) or nidogen (Santa Cruz Biotechnology, ELM1; 1:200) with AlexaFluor546 or AlexaFluor647 secondary antibodies (Life Technologies; 1:500) and Hoechst (Invitrogen; 1:1,000). All staining and incubations were carried out in PBS with 5% donkey serum with cOmplete protease-inhibitor cocktail (AFM media).
AFM measurements.
A Zeiss Axio Observer inverted optical microscope (Zeiss) equipped with an MFP-3D AFM (Asylum Research) was used for all AFM experiments. AFM nanoindentation tests were performed using a 5-μm-diameter spherical tipped silicon nitride cantilever (Novascan) in AFM media. Cantilever spring constants were measured before sample analysis using the thermal fluctuation method, with nominal values of 100 pN nm−1. During measurements, samples were maintained in AFM media. Brightfield, nuclei (Hoechst), E-cadherin and α6 integrin staining were captured using standard DAPI/fluorescein isothiocyanate (FITC)/tetramethylrhodamine isothiocyanate (TRITC) filter cubes and used to align the cantilever to the sample and for image co-registration. Two-dimensional force maps were taken in 20 μm × 20 μm, 30 μm × 30 μm, or 60 μm × 60 μm square grids with 20–32 sample points per axial dimension. AFM measurements were made using a cantilever deflection set point of 2 nN and an indentation rate of 22 μm s−1 to capture elastic properties and minimize viscoelastic effects. In all experiments, the deflection of the cantilever did not exceed the linearity of the photodiode detector, even for forces up to 10 nN. The first 100 nm of indentation were used to measure elasticity from the basement membrane. Force-indentation curves were analysed using a modified Hertz model for contact mechanics of spherical elastic bodies. The sample Poisson’s ratio was assumed to be 0.4, and a power law of 1.5 was used to model tip geometry, as described38. To obtain Young’s modulus, we equate force-indentation curves according to Equation (1), where P is the loading force, δ is the indentation into the material, and R is the effective tip curvature radius:
| (1) |
E* is the apparent Young’s modulus, defined as , where ν1 and ν2 are Poisson’s ratio and the subscripts denote the two contacting bodies (namely the AFM tip and the sample, respectively). For all samples tested, the value of δ at which the linear–nonlinear regime transition, or δL, occurred was between 0.5 nN and 1 nN, and force curves for reporting Young’s moduli were fit within the linear regime. To obtain the pointwise Young’s modulus, we followed the methodology of refs.39,40. Briefly, each data point (Pi, δi) in the force-indentation curve (where Pi is the loading force and δi is the indentation into the material) was substituted into Equation (1) to calculate the corresponding Ei (the subscript ‘i’ denotes an individual data point along the force-indentation profile). We used 1 nN as the nominal value for δL and calculated a Young’s modulus of 70–90% of the loading curve (approximately 2 nN maximum load) for Ehigh and 10–30% of the loading curve for Elow. We defined an elasticity metric, L = Elow/Ehigh, where L = 1 is absolute linear elasticity and values of less than one are increasingly nonlinear. For plasticity measurements, we measured the difference in indentation lengths at zero force values between the approach and retraction curves. We also performed creep tests, measuring the change in indentation depth over time under constant force load, which gave qualitatively similar results for basement membrane and dermis. For adult tumour samples used for AFM analysis, serial cryosections were fixed in 4% PFA and processed for histology and immunofluorescence to verify tumour stages.
Electron microscopy
For electron microscopy, samples were fixed in 2% glutaraldehyde, 4% PFA, 1% tannic acid and 2 mM CaCl2 in 0.1 M sodium cacodylate buffer, pH 7.2, at room temperature for more than 1 h, post-fixed in 1% osmium tetroxide, and processed for Epon embedding; ultrathin sections (60–65 nm) were counterstained with uranyl acetate and lead citrate. Electron-microscopy images were taken with a transmission electron microscope (Tecnai G2–12; FEI) equipped with a digital camera (AMT BioSprint29).
Fluorescence-activated cell sorting
Single-cell suspensions were obtained from either E15.5 or adult skins using published methods41,42. Fluorescence-activated cell sorting (FACS) was carried out using a FACSAriaII (Becton Dickinson) by The Rockefeller University FACS core facility. CD45 (biotinylated rat anti-CD45, BD Biolegend; 1:200), CD117 (biotinylated rat anti-CD117/c-kit, Biolegend; 1:200), CD31 (biotinylated rat anti-CD31/PECAM, Bioscience; 1:200), and CD140a (biotinylated rat anti-CD140a, Biolegend; 1:200) were used as lineage-negative markers (to exclude immune cells, melanoblasts, endothelium and fibroblasts, respectively). All lineage-negative cells were detected with a strepdavidin-conjugated APC/Cy7 secondary antibody (Biolegend; 1:1,000). Cells highly expressing integrin α6 (rat anti-CD49f/α6-PE, clone GoH3, Biolegend; 1:1,000) were sorted to obtain basal cells. In adult SmoM2 mice, Sca-1 (rat anti-Sca-1-PE/Cy7, clone D7, eBioscience; 1:200) was used to isolate oncogenic budded cells (Sca-1neg) from oncogenic cells that remained in the epidermal layer (Sca-1+), and CD34 (rat anti-CD34-eFluor660, clone RAM34, eBioscience; 1:200) was used to remove hair-follicle stem cells. Each sample submitted for RNA-sequencing comprised cells from at least three embryos per genotype. Cells were sorted directly into Trizol.
RNA-sequencing and RT–PCR
Total RNA was purified using a Direct-zol RNA Miniprep Plus kit (Zymo Research). Briefly, after adding 500 μl of 100% ethanol to samples, the lysate was loaded to an RNA-binding column. The column was treated with DNase I for 15 min at room temperature. After several washing steps, the RNA was eluted in DNase/RNase-free water. The quality of RNA samples was determined using an Agilent 2100 Bioanalyzer, and all samples for sequencing had RNA integrity (RIN) numbers of more than 9. Poly(A) selection and library preparation using an Illumina TrueSeq mRNA sample preparation kit, and sequencing on an Illumina HiSeq 2500 or HiSeq 4000 machine, were carried out by the Weill-Cornell Medical College Genomic Core facility. Fifty-base-pair single-end and paired-end FASTQ sequences were aligned to the mouse genome (GRCm38/mm10 annotation) using STAR (v2.6.2a)43, and transcripts were annotated using Gencode release M9. Differential gene expression analysis was performed on the STAR gene-counts output using the DESeq2 (v1.24.0)44 package with default parameters in RStudio (v1.1.442). Genes with a fold change of more than 2 and false discovery rate (FDR) of less than 0.1 were considered to be differentially expressed.
Gene ontology terms were called using DAVID45. For real-time quantitative reverse transcription with polymerase chain reaction (qRT–PCR), equivalent amounts of RNA were reverse-transcribed using the Super-Script VILO cDNA synthesis kit (Invitrogen). Complementary DNAs were normalized to equal amounts using primers against Gapdh or Ppib2. cDNAs were mixed with the indicated primers and Power SYBR green PCR master mix (Applied Biosystems), and qPCR was performed using an Applied Biosystems 7900HT fast real-time PCR system. cDNAs were normalized to equal amounts using primers against Ppib.
Adult tumour progression studies
Embryos were injected with LV–Cre containing either scrambled control (shScr) or shCol4a1 RNAs at 9.5 dpc. Up to five mice were housed per cage, with a 12-h light/dark cycle, and were provided with food and water ad libitum. Mouse experiments were performed on age-matched and strain-matched littermates randomly assigned to experimental groups. For analysis of adult tumours, tumour burden was visually inspected every two days throughout the course of the experiment, and tumour size was measured using digital calipers. Tumours were not allowed to progress beyond 2 cm in diameter, and ulceration did not exceed 10 mm in diameter, as approved by the Rockefeller University IACUC (protocol 17091-H). Ulcerations or tumours approaching these sizes were considered an end point, and the experiment was terminated at the end of three months. Tumours were excised and prepared for histology and immunofluorescence, and the number of papillomas and SCCs was assessed on the basis of histopathology.
Human research participants
De-identified, OCT-embedded fresh tissue sections of SCCs, BCCs or healthy skin from individuals that underwent Mohs micrographic surgery were used. This study did not involve the recruitment of new patients. De-identified tissue blocks were obtained from the Department of Dermatology, Weill-Cornell Medical College (New York, US). We have complied with all relevant ethical regulations: informed consent was obtained from patients by Weill-Cornell; The Rockefeller University IRB approved the use of de-identified human samples (EFU-0529).
Computational modelling
Code was written in C/C++ languages, based on standard C libraries and the GNU Scientific Library (GSL). Each simulation was run at five different seeds for random number generation, and results were averaged over these five runs. To ensure reproducibility of the results, we describe all details of the model, together with the values of model parameters, in the Supplementary Information.
Statistics and study design
In general, all experiments were repeated using at least two litters per experiment. All data sets generated were tested for normal distribution using Prism 7 (Graphpad), and all data sets that failed this test were subject to nonparametric tests for further analysis. All statistical tests performed are indicated in the figure legends. No statistical methods were used to predetermine sample size. The experiments were not randomized and the investigators were not blinded to allocation during experiments and outcome assessment, except where stated.
Extended Data
Extended Data Fig. 1 |. Extended characterization of oncogenic tissue architecture models.
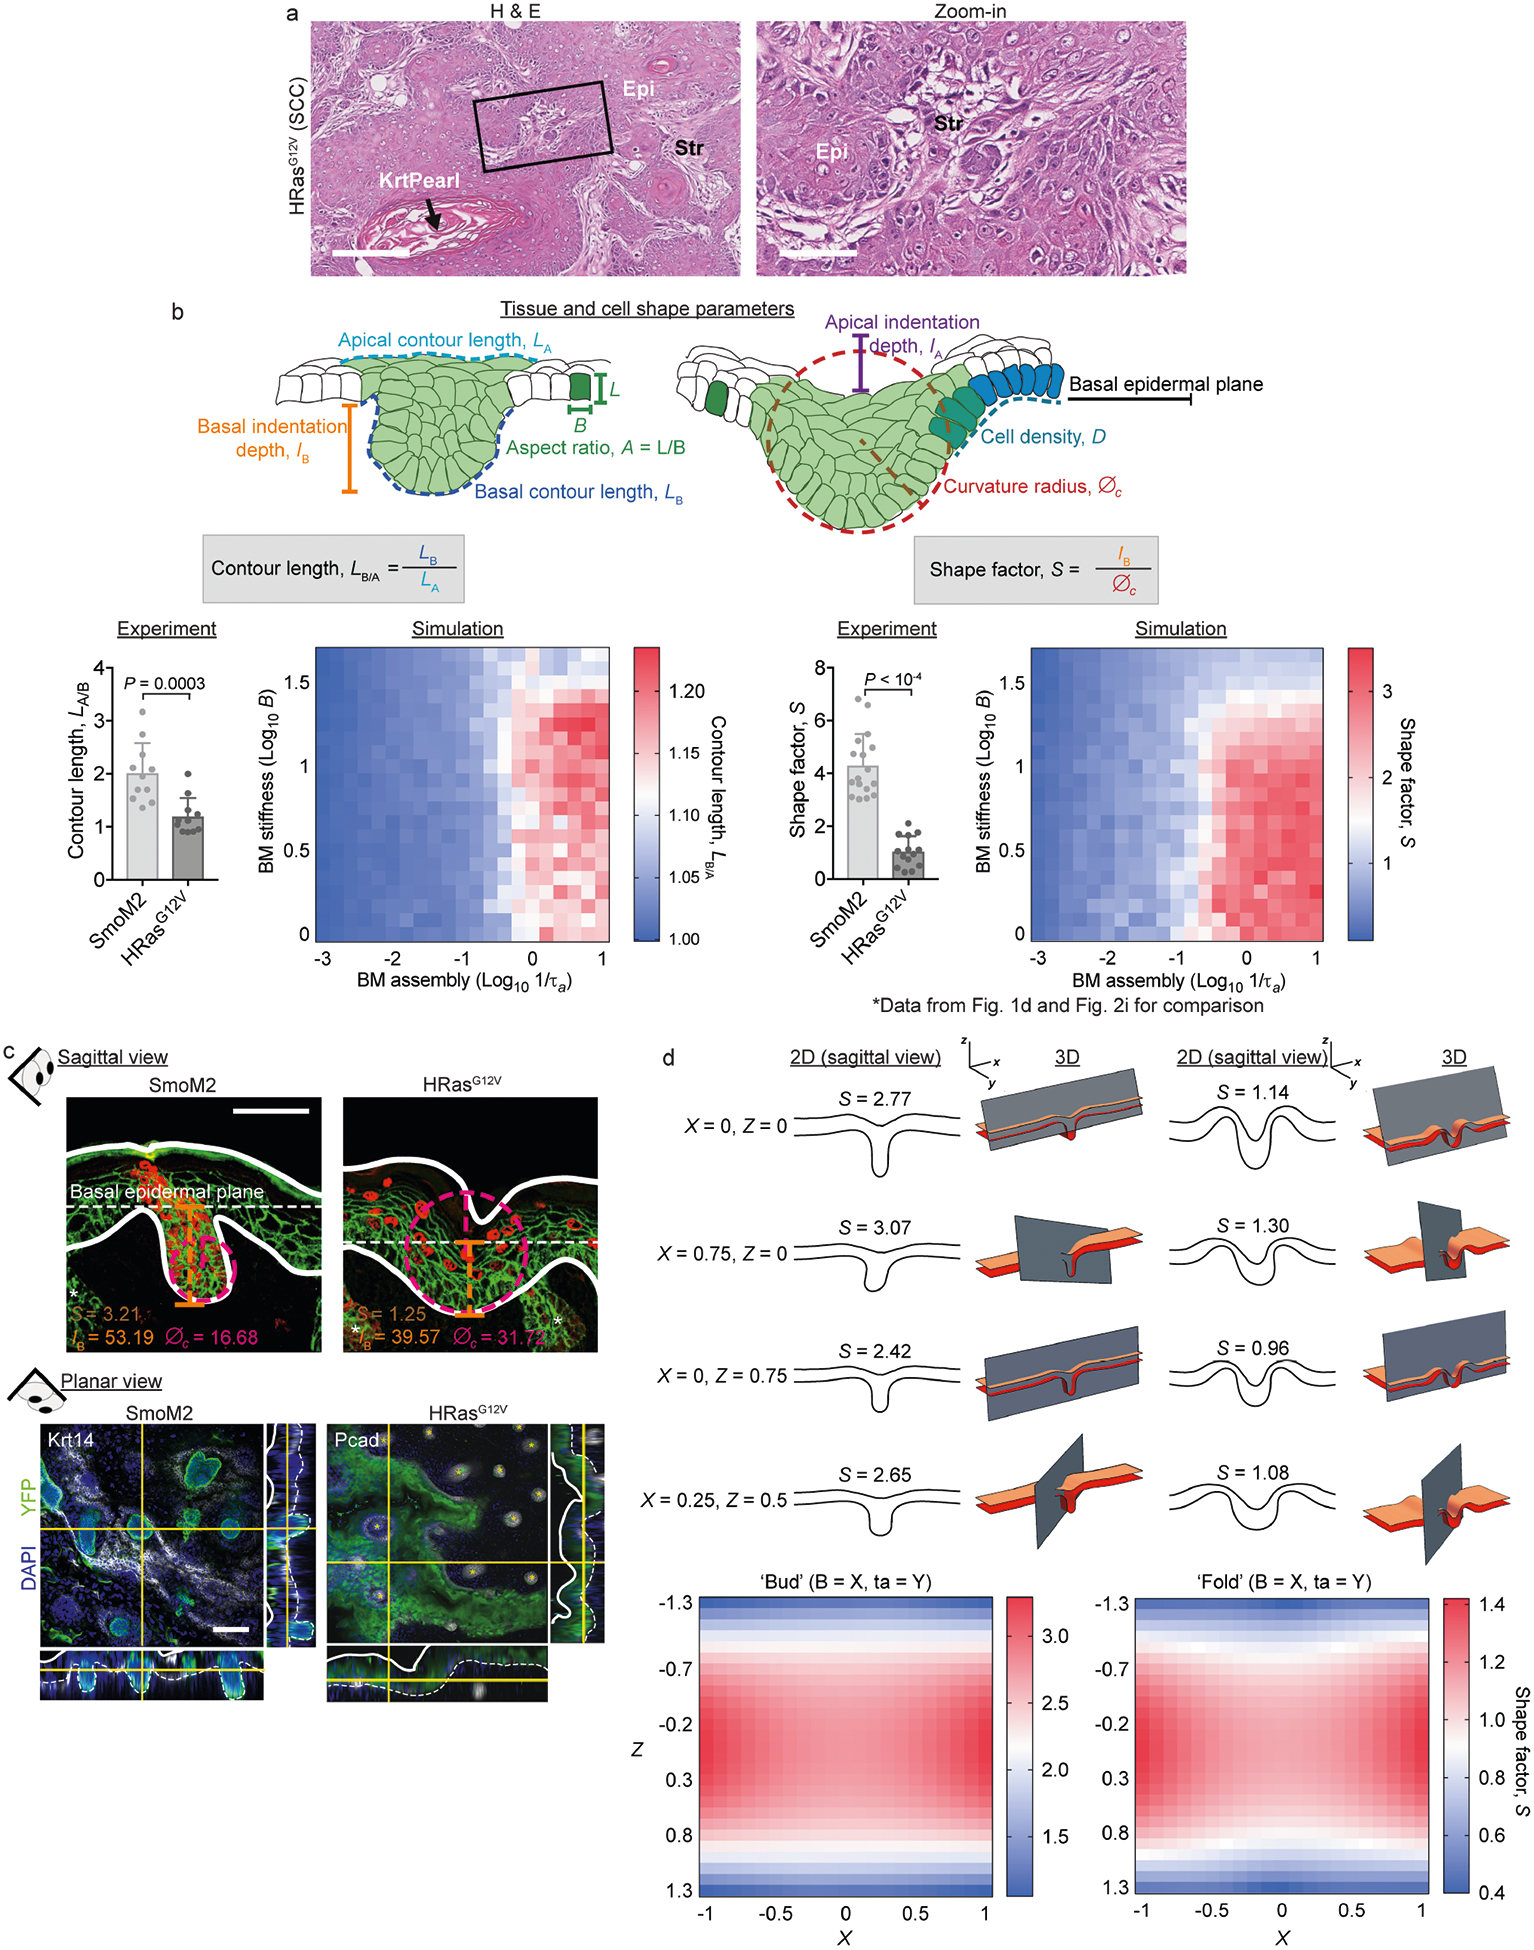
a, Characterization of adult SCCs. E9.5 oncogenic embryos were infected in utero with LV–Cre to selectively transduce single-layered embryonic epidermis. Tissues were harvested at three months (HRasG12V SCCs) and stained with haematoxylin and eosin (H & E). Epi, epithelium; Krt pearl, keratin pearl, a hallmark of SCCs; Str, stroma. Scale bars: left, 250 μm; right (zoom-in), 100 μm. b, Extended description of premalignant architectures and parameters used to quantify them. The schematics at the top show all parameters used here to quantify tissue and cell-shape parameters, including apical indentation depth (IA), basal indentation depth (IB), apical contour length (LA), basal contour length (LB), curvature radius (∅c), cell density (D) and cell aspect ratio (A). Bottom, quantification of S values (data repeated from Fig. 1d, 2i and contour length (LB/A; SmoM2, n = 11; HRasG12V, n = 11; mean + s.d.; Mann–Whitney U-test) for lesions from four embryos, two litters for each condition. We compare experimental measurements and simulation results (see Supplementary Note 1 for modelling details), which show strong agreement. However, we note that S is better able than LB/A to discriminate SmoM2 and HRasG12V phenotypes. c, Sagittal sections and whole-mount (planar) views show the distinct tissue shapes of SmoM2 and HRasG12V lesions. Measurements of IB and ∅c, from which S are calculated, are depicted on example images (sagittal view). d, Two-dimensional (2D) and 3D simulations of tissue shapes. Archetypal budded and folded tissue architectures were simulated in 3D and cut into 2D planes with varying cutting angles X and Z (see Supplementary Note 4 for details). The resultant tissues and their calculated S values are shown. Note that both architectures are equally well discerned without systematic bias (see the range of S values). Scale bars, 50 μm.
Extended Data Fig. 2 |. Cell proliferation drives skin tumour growth but not architectural differences between SmoM2 and HRasG12V lesions.
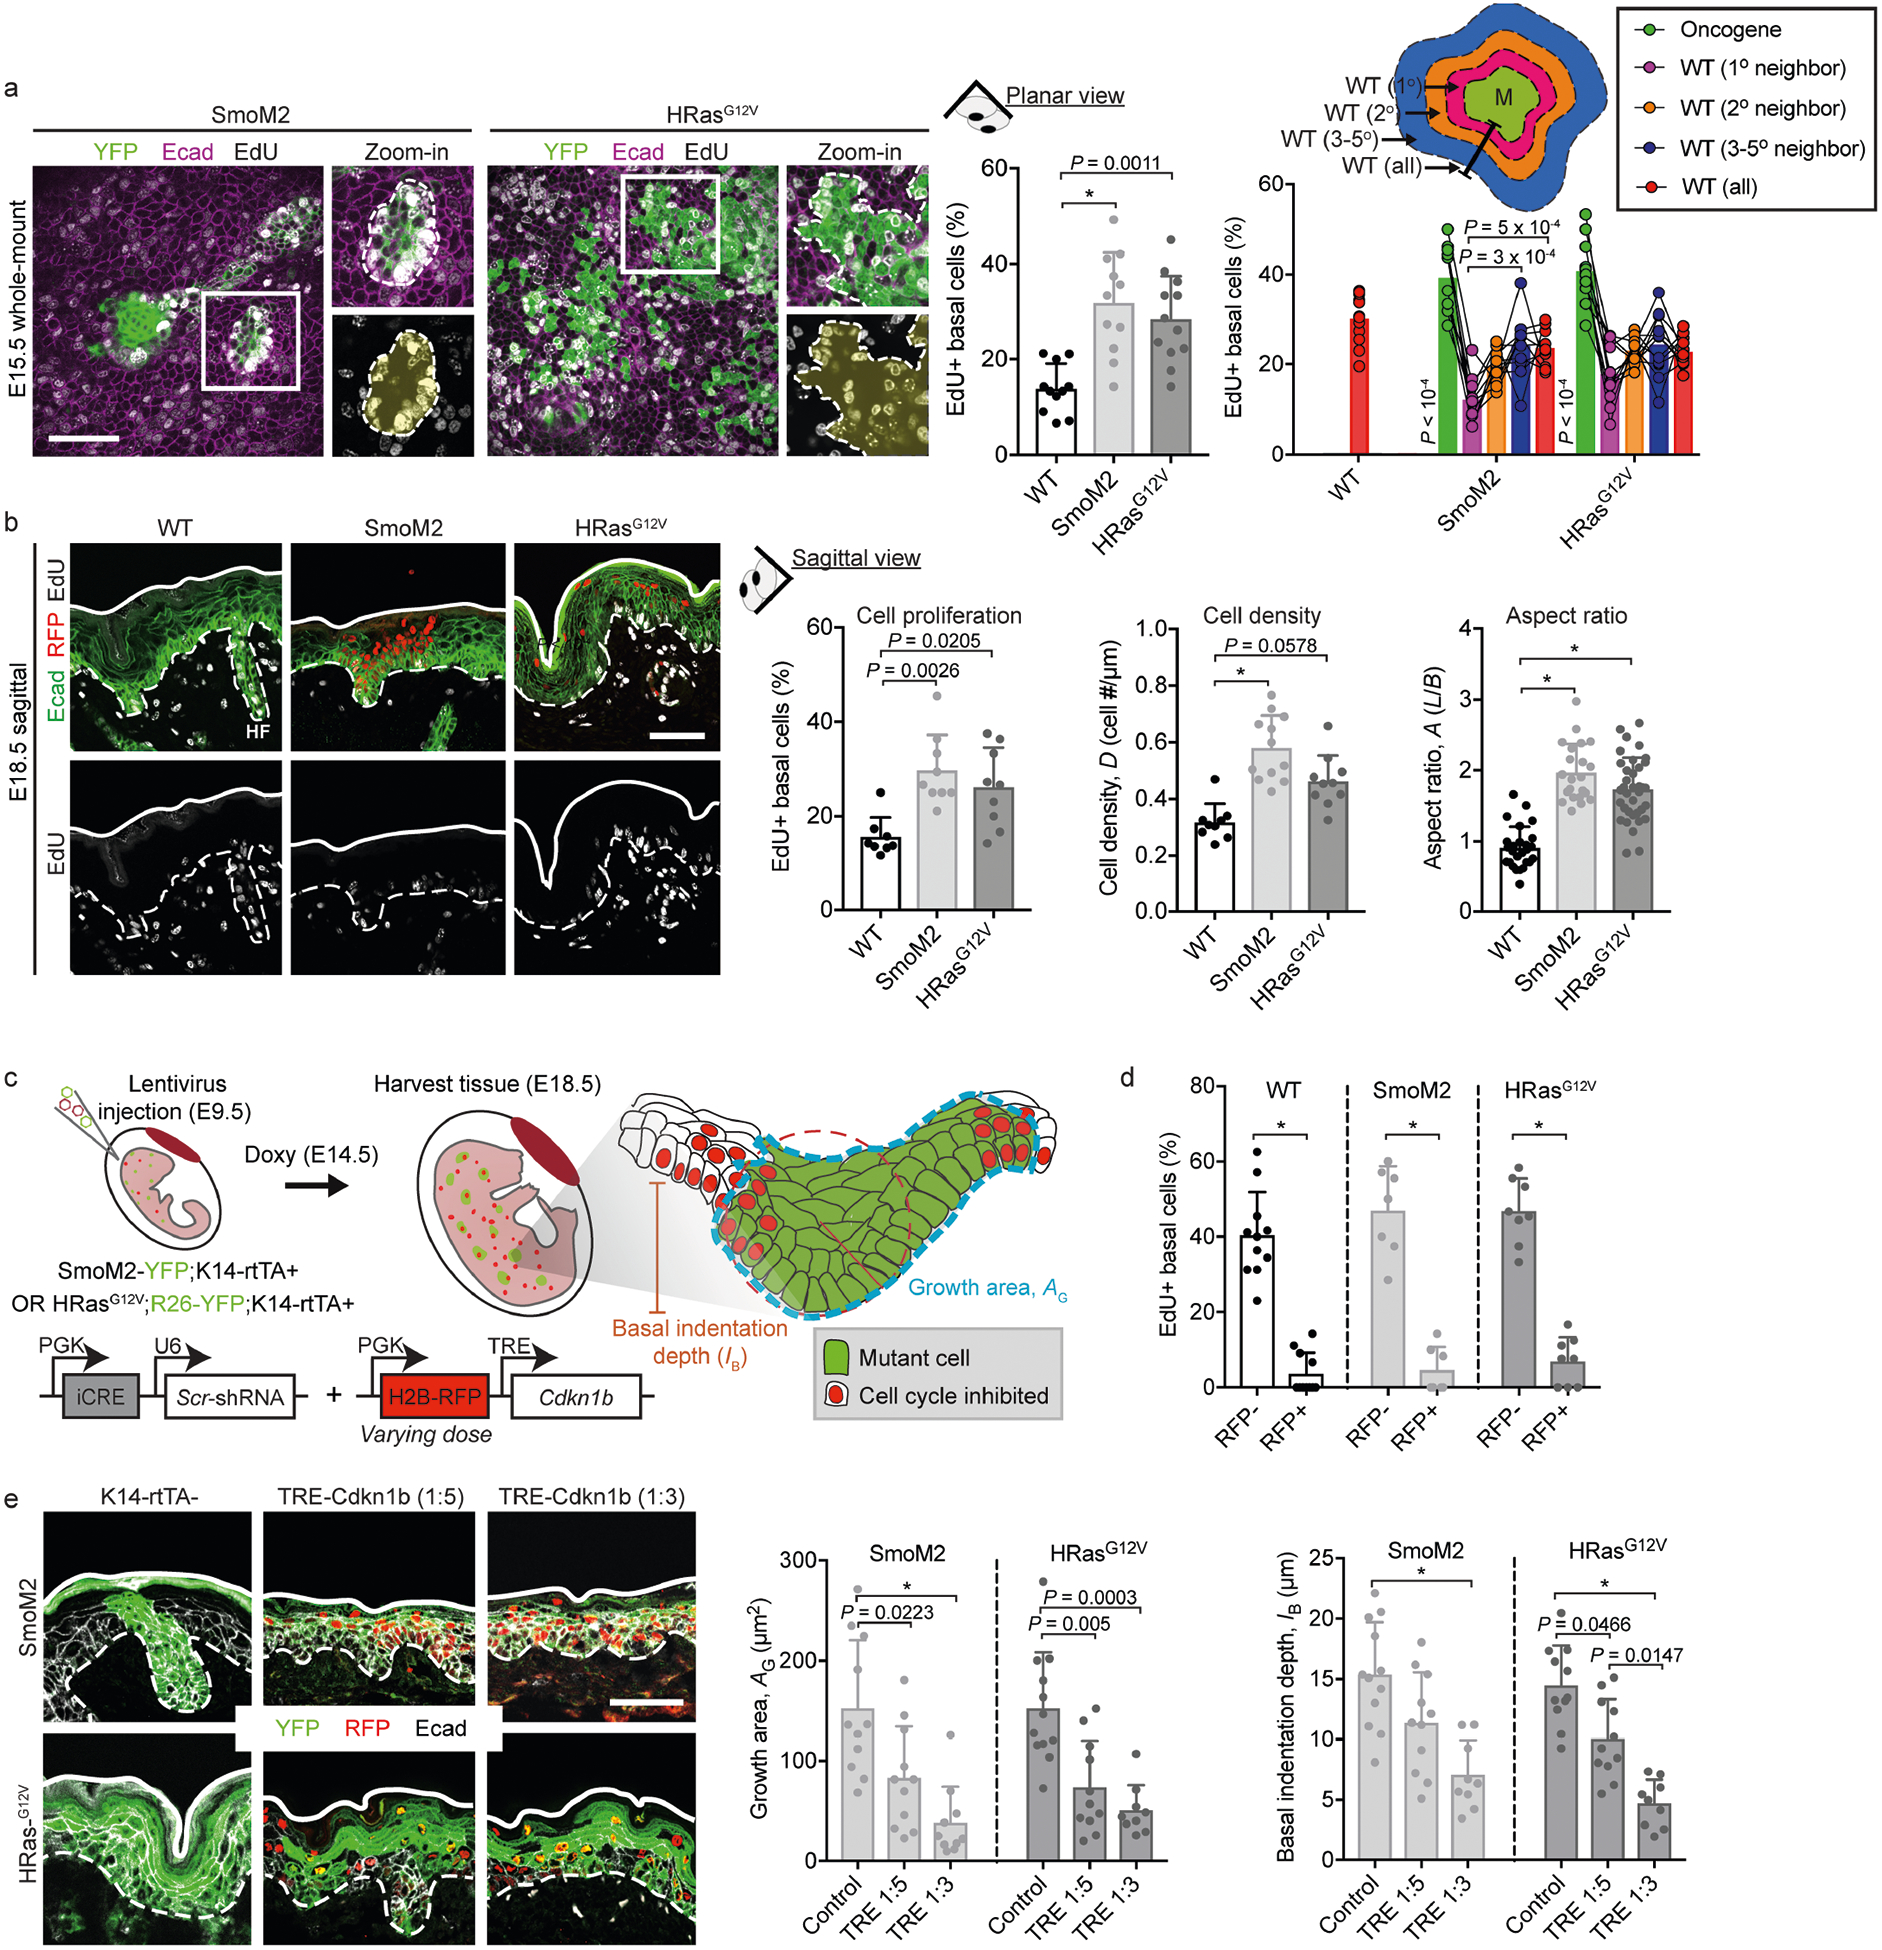
a, Cell proliferation as measured by EdU incorporation at E15.5. SmoM2- and HRasG12V-induced lesions are marked by YFP (left panels), and cell proliferation was quantified as the percentage of EdU+ basal cells in WT versus mutant lesions (centre panel; WT, n = 11; SmoM2, n = 11; HRasG12V, n = 12; one-way ANOVA with Tukey’s multiple comparisons test). The spatial distribution of WT cell proliferation in proximity to mutant clones was measured by quantifying the number EdU+ basal cells as a function of their neighbour distance from mutant clone edges (right panel; paired measurements from depicted tissue compartments; two-way ANOVA with Tukey’s multiple comparisons test). HF, hair follicle. b, Cell proliferation as measured by EdU incorporation at E18.5. SmoM2- and HRasG12V-induced lesions are marked by H2B–RFP. The graphs show cell proliferation, cell density (D) and aspect ratio (A; depicted in Extended Data Fig. 1b) at E18.5. Cell proliferation (WT, n = 8; SmoM2, n = 9; HRasG12V, n = 9; Kruskal–Wallis test with Dunn’s multiple comparisons test), D (WT, n = 9; SmoM2, n = 11; HRasG12V, n = 10; Kruskal–Wallis test with Dunn’s multiple comparisons test) and A (WT, n = 26; SmoM2, n = 22; HRasG12V, n = 36 cells; one-way ANOVA with Tukey’s multiple comparisons test) were measured for lesions from four embryos, two litters for each condition. c, Schematic showing our experimental approach to manipulating cell proliferation. LVs encoding H2B–GFP–iCRE and H2B–RFP–Cdkn1b under the control of a tetracycline-response element (TRE–Cdkn1b) were injected into SmoM2;K14–rtTA+ and HRasG12V;K14–rtTA+ mice. Embryos were injected with varying titres of TRE–Cdkn1b at E9.5, treated with doxycycline at E15.5, and harvested at E18.5. d, Cell-cycle manipulation was validated by measuring the EdU+ TRE–Cdkn1b+ (RFP+) and RFP− cells in both WT and oncogenic mutant backgrounds. e, Immunofluorescence and quantification of oncogenic tissue architectures in oncogenic mutant embryos infected with TRE–Cdkn1b. Quantification of lesion growth area (AG) and basal indentation depth (IB) shows that lesion size and deformations decrease with an increased titre of TRE–Cdkn1b similarly in SmoM2 (K14–rtTA–control, n = 11; 1:5 TRE–Cdkn1b, n = 11; 1:3 TRE–Cdkn1b, n = 10) and HRasG12V (K14–rtTA–control, n = 12; 1:5 TRE–Cdkn1b, n = 11; 1:3 TRE–Cdkn1b, n = 9) mutants from five embryos, two litters for each condition (one-way ANOVA with Tukey’s multiple comparisons test). All bar graphs show means + s.d. Scale bars, 50 μm. *P < 0.0001.
Extended Data Fig. 3 |. Role of interfacial actomyosin tension in a monolayer and multilayered epithelium.
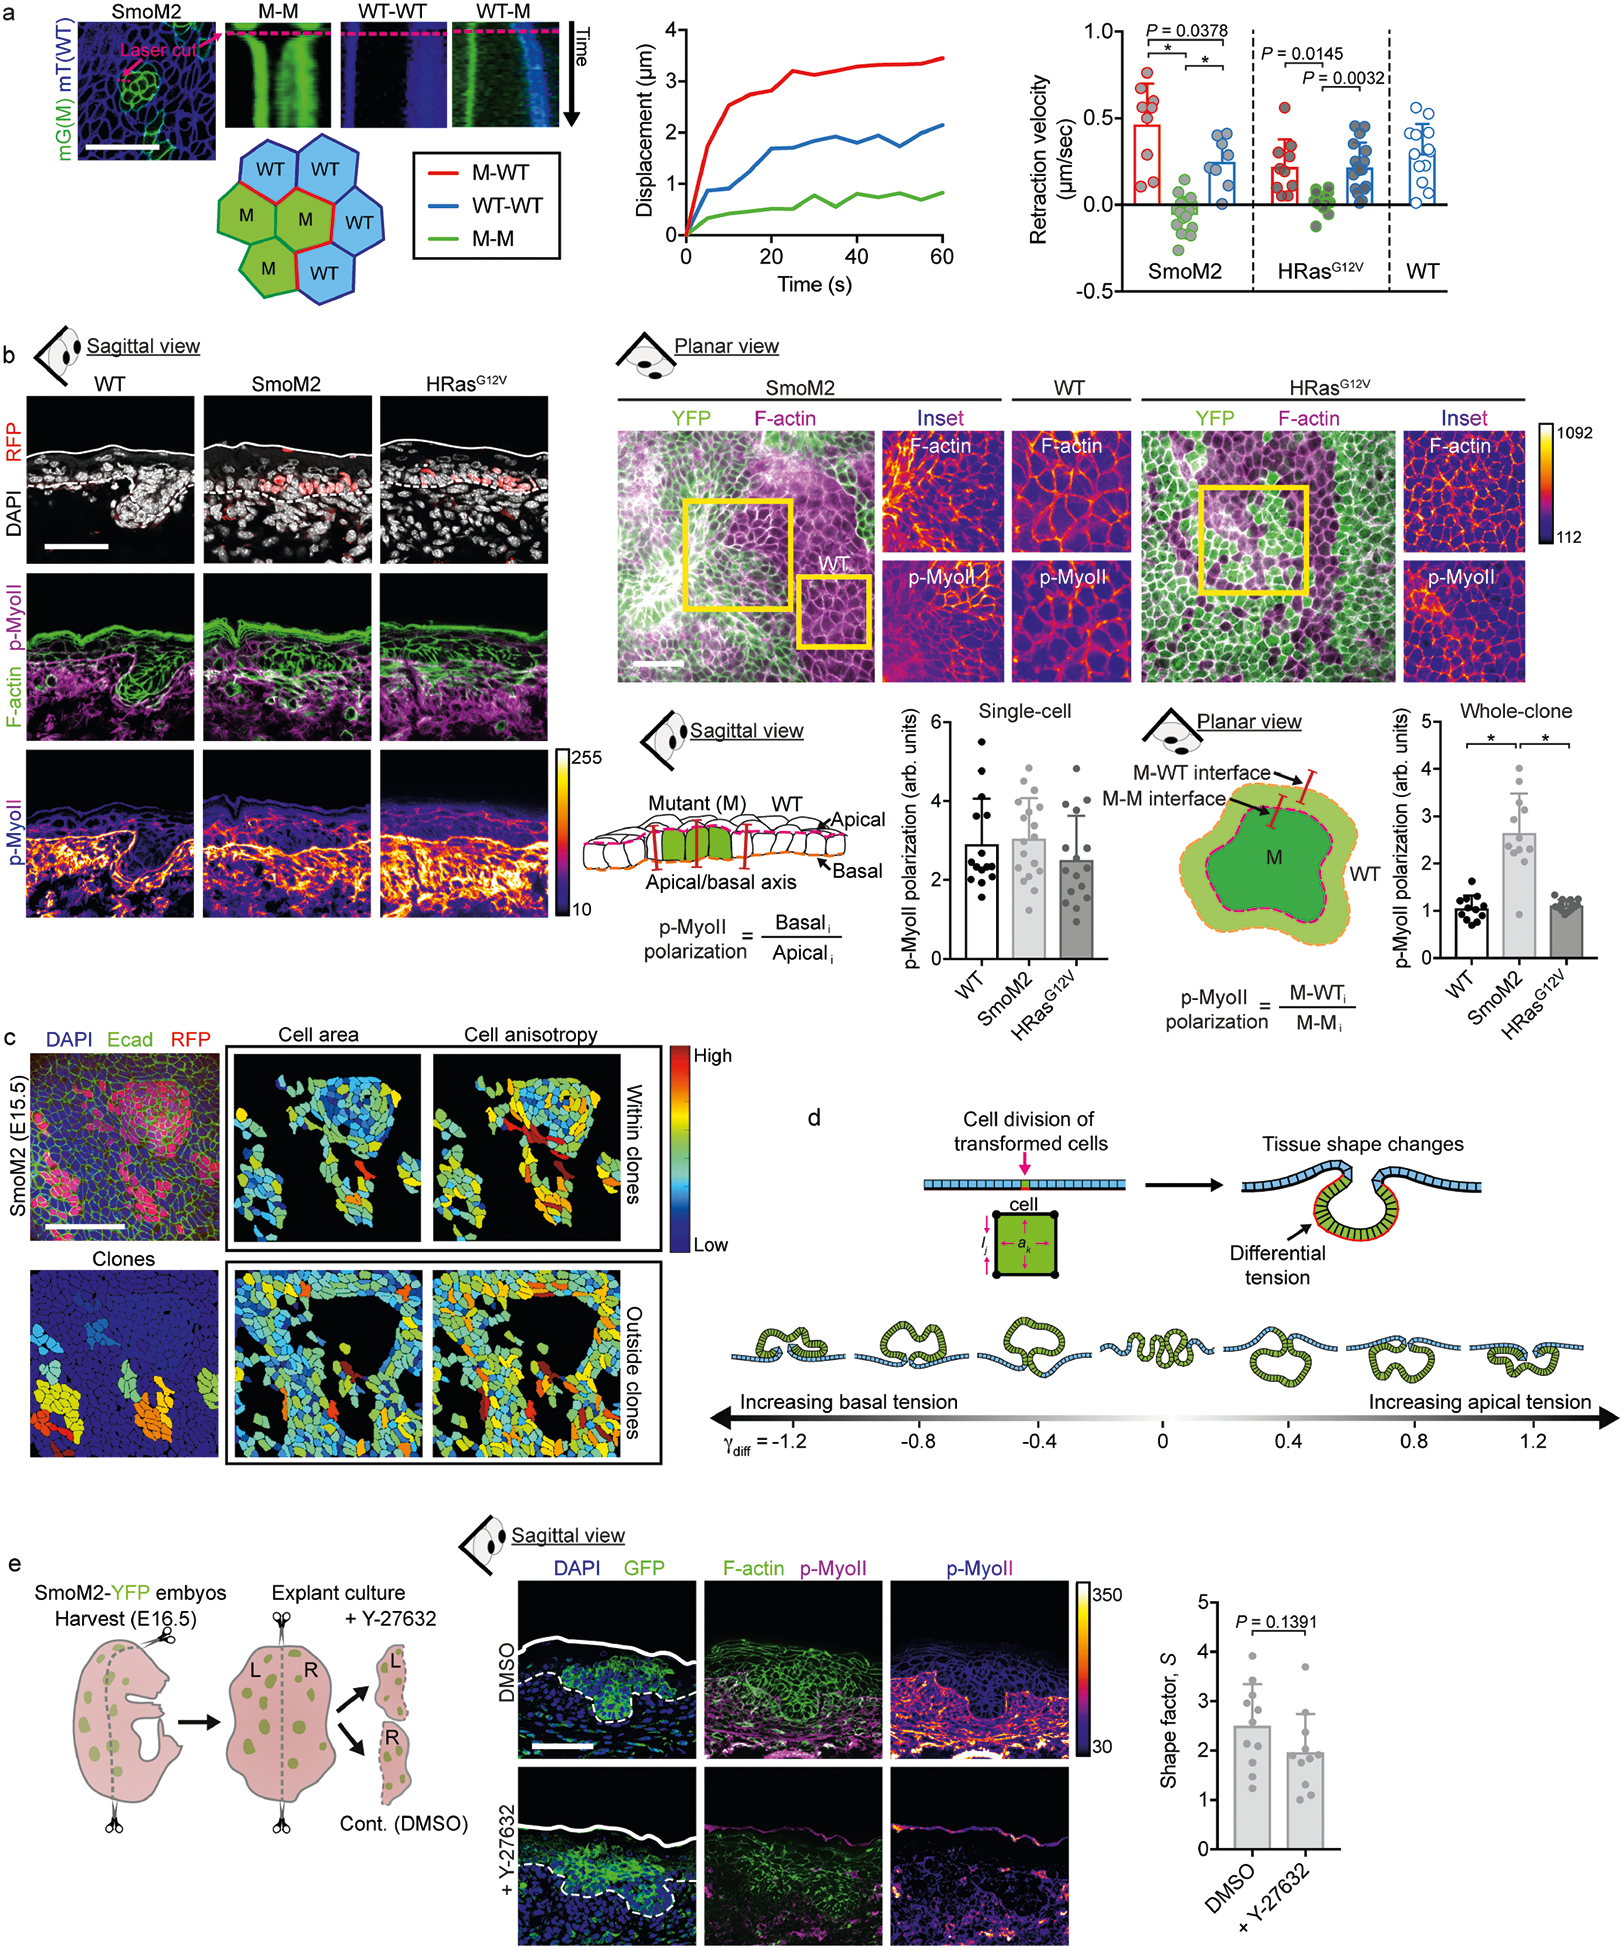
a, Left, example time-lapse kymographs showing junctional laser ablation. Plasma membranes are marked by membrane-Tomato and membrane-GFP (mT and mG) in SmoM2;mTmG and HRasG12V;mTmG mice, with mutant cells (M) in green, wild-type (WT) cells in blue, and M–WT/WT–WT/M–M interfaces labelled. Laser cut sites are marked with pink dashed lines. Centre and right, the displacement of neighbouring tricellular junctions was quantified over time to yield retraction velocity curves. Initial retraction velocity values are shown for WT (n = 13), SmoM2, (M–WT, n = 9; M–M, n = 17; WT–WT, n = 8) and HRasG12V (M–WT, n = 10; M–M, n = 16; WT–WT, n = 17; one-way ANOVA with Tukey’s multiple comparisons test) from four to five embryos from two litters for each condition. b, Immunofluorescence staining of F-actin (using phalloidin) and phospho-S19-myosin-II (p-MyoII) in SmoM2 and HRasG12V lesions in sagittal sections (left) and planar whole-mount (right) views at E15.5. The intensity of staining is shown in heatmap values. p-MyoII polarization was measured in single basal cells (along the apicobasal axis, sagittal view; WT, n = 15; SmoM2, n = 18; HRasG12V, n = 16; one-way ANOVA with Tukey’s multiple comparisons test) and in whole clones (M–WT versus M–M interface, planar view; WT, n = 12; SmoM2, n = 12; HRasG12V, n = 16). Note that although p-MyoII is enriched basally, this polarization does not change between WT epidermal progenitors and oncogenic basal cells. c, Cell shapes analysed from E15.5 SmoM2 mutant clones. Cell area and anisotropy (defined as the ratio of major and minor cell axes) were analysed from whole-mount confocal images. Cells were automatically segmented on the basis of cortical E-cadherin staining. Note the increased anisotropy in M and WT cells at the clone border and the diminished cell area at the clone centre. d, The monolayer model epithelium. A single cell is transformed (green) and then undergoes cycles of division to induce tissue growth and deformation (see Supplementary Note 1). Interfacial tensions were varied in magnitude and orientation from basally to apically polarized, resulting in evaginating or invaginating lesions, respectively. e, Explant cultures treated with the actomyosin inhibitor Y-27632. SmoM2 oncogenic skin explants were treated with Y-27632 or vehicle control (DMSO) for 24 h before preparing the tissue for microscopic analysis (n = 11 lesions from three explants each; two-tailed unpaired t-test). All bar graphs show means + s.d. Scale bars, 50 μm. *P < 0.0001.
Extended Data Fig. 4 |. FACS sorting strategy and RNA-sequencing analysis of SmoM2 and HRasG12V tumours.
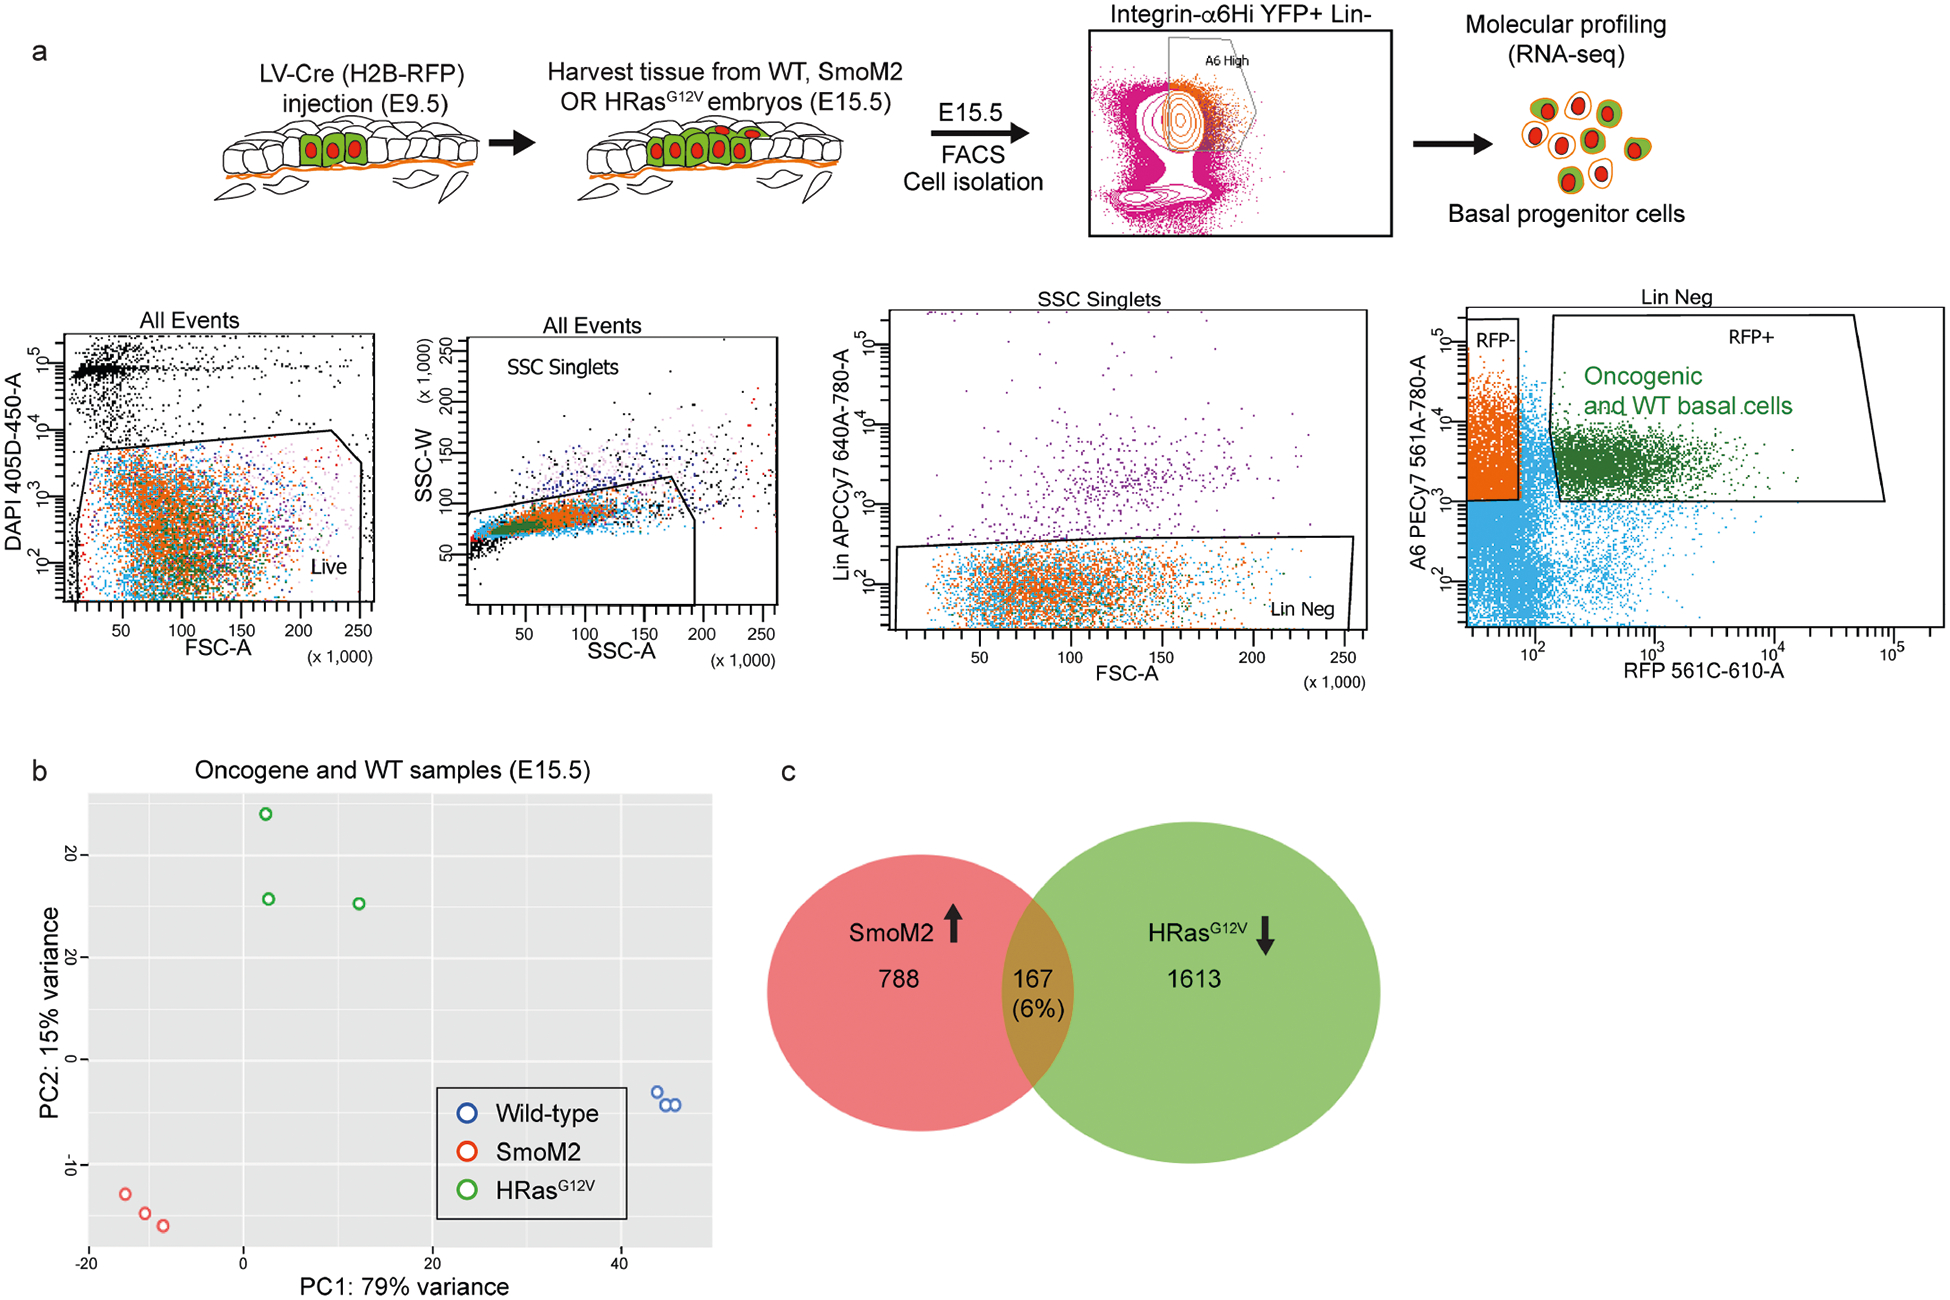
a, FACS strategy for isolating fluorescently marked basement membrane (BM)-associated (α6 integrinhi RFP+) basal progenitors from WT or oncogenic skins of E15.5 embryos. b, Principal component analysis (PCA) plots of n = 3 independent replicates of E15.5 oncogenic and WT basal progenitors reveals clustering of each replicate but distinct clustering across genetic lineages. c, Venn diagram showing genes upregulated or downregulated, comparing SmoM2 or HRasG12V mutants to WT basal progenitors. The overlap shows that 167 genes (6% of these differentially expressed genes) were coordinately upregulated in SmoM2 and downregulated in HRasG12V mutants.
Extended Data Fig. 5 |. Extended characterization of the mechanical properties of basement membrane.
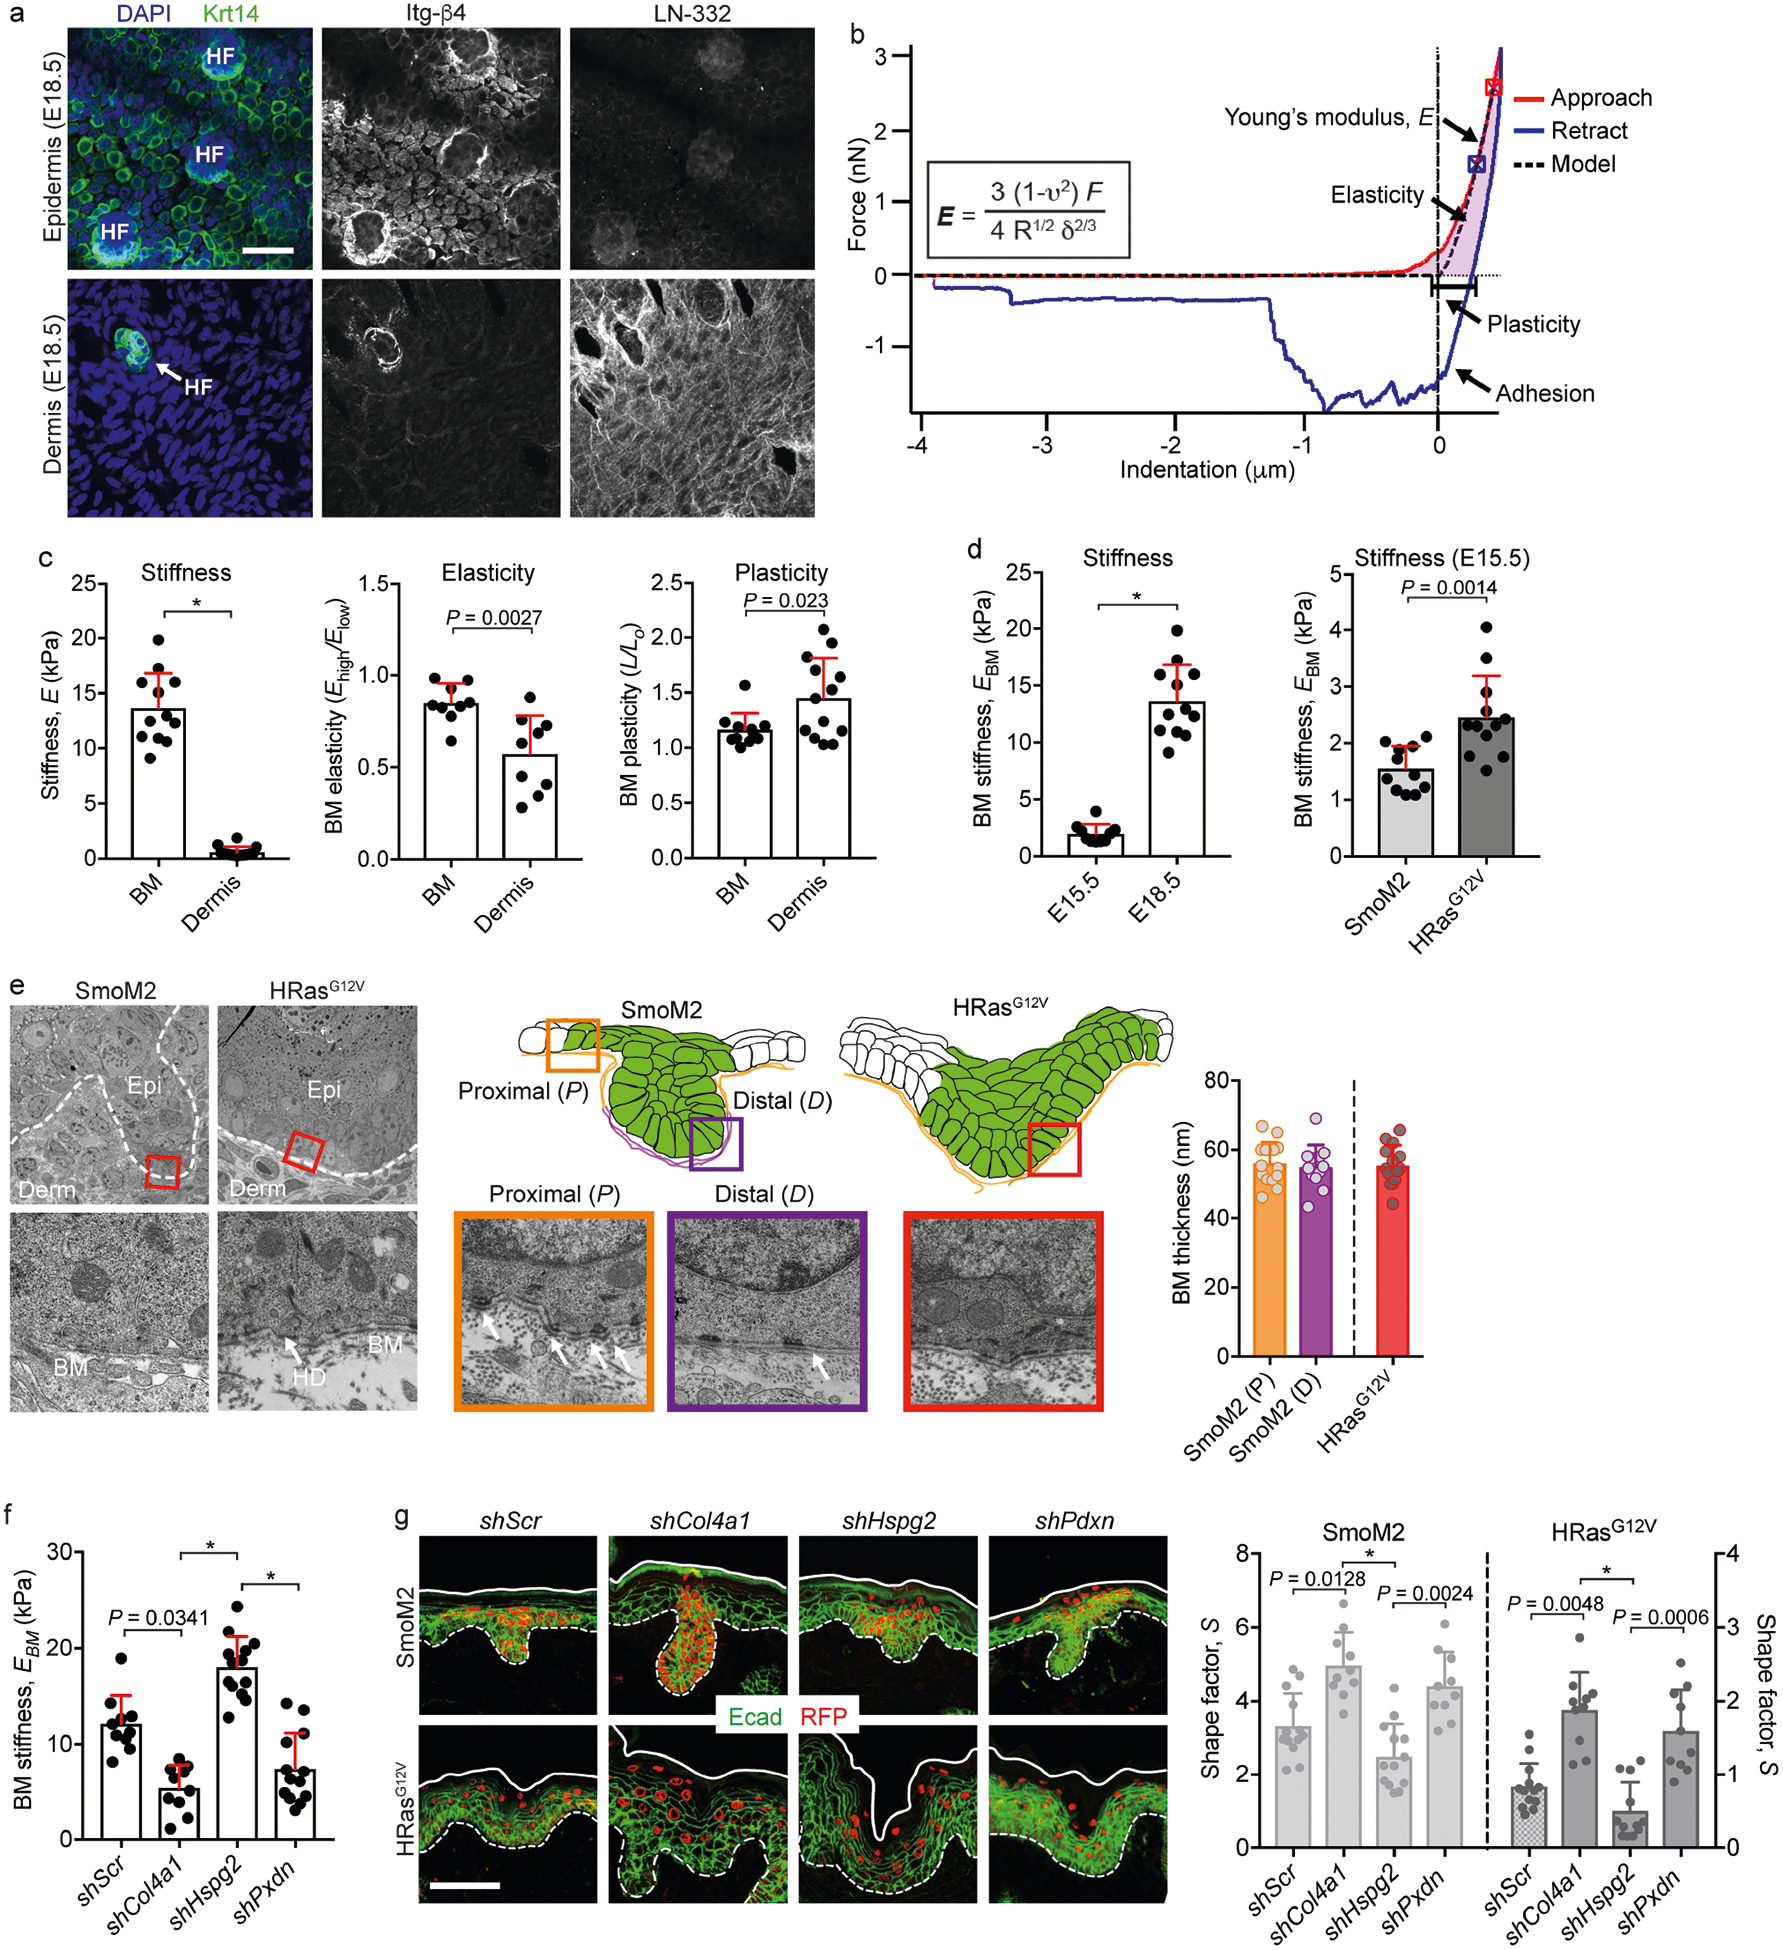
a, Immunofluorescence images of the epidermal and dermal interfaces following EDTA-induced skin separation. Integrins (marked here by Itg-β4) on the progenitors’ basal surface delineate the underside of Krt14+ epidermis, while the basement membrane (marked here by LN-332) delineates the dermal surface of the tissue. To prepare samples for AFM measurements of basement-membrane stiffness, EBM, lentivirus-infected skin is harvested, and the epidermis is separated from dermis using EDTA treatment, leaving the basement membrane exposed on the dermal surface. HF, hair follicles. b, Example of AFM data analysis: a force-displacement curve for basement membrane, showing approach (red) and retraction (blue) curves, as well as the contact point (crosshairs). The equation for the Hertz model used to calculate EBM and its corresponding curve fit (black dotted line) is also shown. c, Stiffness, elasticity and plasticity of the basement membrane and dermis. The elasticity metric is defined as Elow/Ehigh, where a value of one represents absolute linear elasticity and values less than are increasingly nonlinear. The plasticity metric (L/L0) is defined as the difference in indentation lengths at zero force values between the approach and retraction curves. Measurements are from average force maps (basement membrane, n = 12; dermis, n = 14; two-tailed unpaired t-test) from four WT embryos. d, Stiffening of the basement membrane during epidermis and tumour development. AFM measurements are shown for WT basement membrane (left; E15.5, n = 10; E18.5, n = 12; Mann–Whitney U-test) and oncogenic lesions at E15.5 (right; SmoM2, n = 11; HRasG12V, n = 12; two-tailed unpaired t-test) and E18.5. The data for basement-membrane stiffness at E18.5 are the same as in c for purposes of comparison. e, Ultrastructural measurements. TEM images of the indicated regions show basement membrane (BM), dermis (Derm), epidermis (Epi) and hemidesmosomes (HD). Basement-membrane thickness is also quantified (SmoM2 (P), n = 14; SmoM2 (D), n = 12; HRasG12V, n = 14; one-way ANOVA with Tukey’s multiple comparisons). f, EBM measurements of shRNA-transduced and EDTA-treated skins (shScr, n = 9; shCol4a1, n = 9; shHspg2, n = 13; shPxdn, n = 13; Kruskal–Wallis test with Dunn’s multiple comparisons) from three embryos each. g, Representative immunofluorescence images of oncogenic skins from SmoM2 or HRasG12V embryos transduced with LV–Cre harbouring either Scr, Col4a1, Hspg2 or Pdxn shRNAs. S values are quantified (SmoM2: shScr, n = 13; shCol4a1, n = 10; shHspg2, n = 10; shPxdn, n = 10. HRasG12V: shScr, n = 13; shCol4a1, n = 11; shHspg2, n = 12; shPxdn, n = 11; Kruskal–Wallis test with Dunn’s multiple comparisons) from four embryos, two litters for each condition. All bar graphs show means + s.d. Scale bars, 50 μm. *P < 0.0001.
Extended Data Fig. 6 |. Extended characterization of the effects of basement-membrane assembly on tumour architectures.
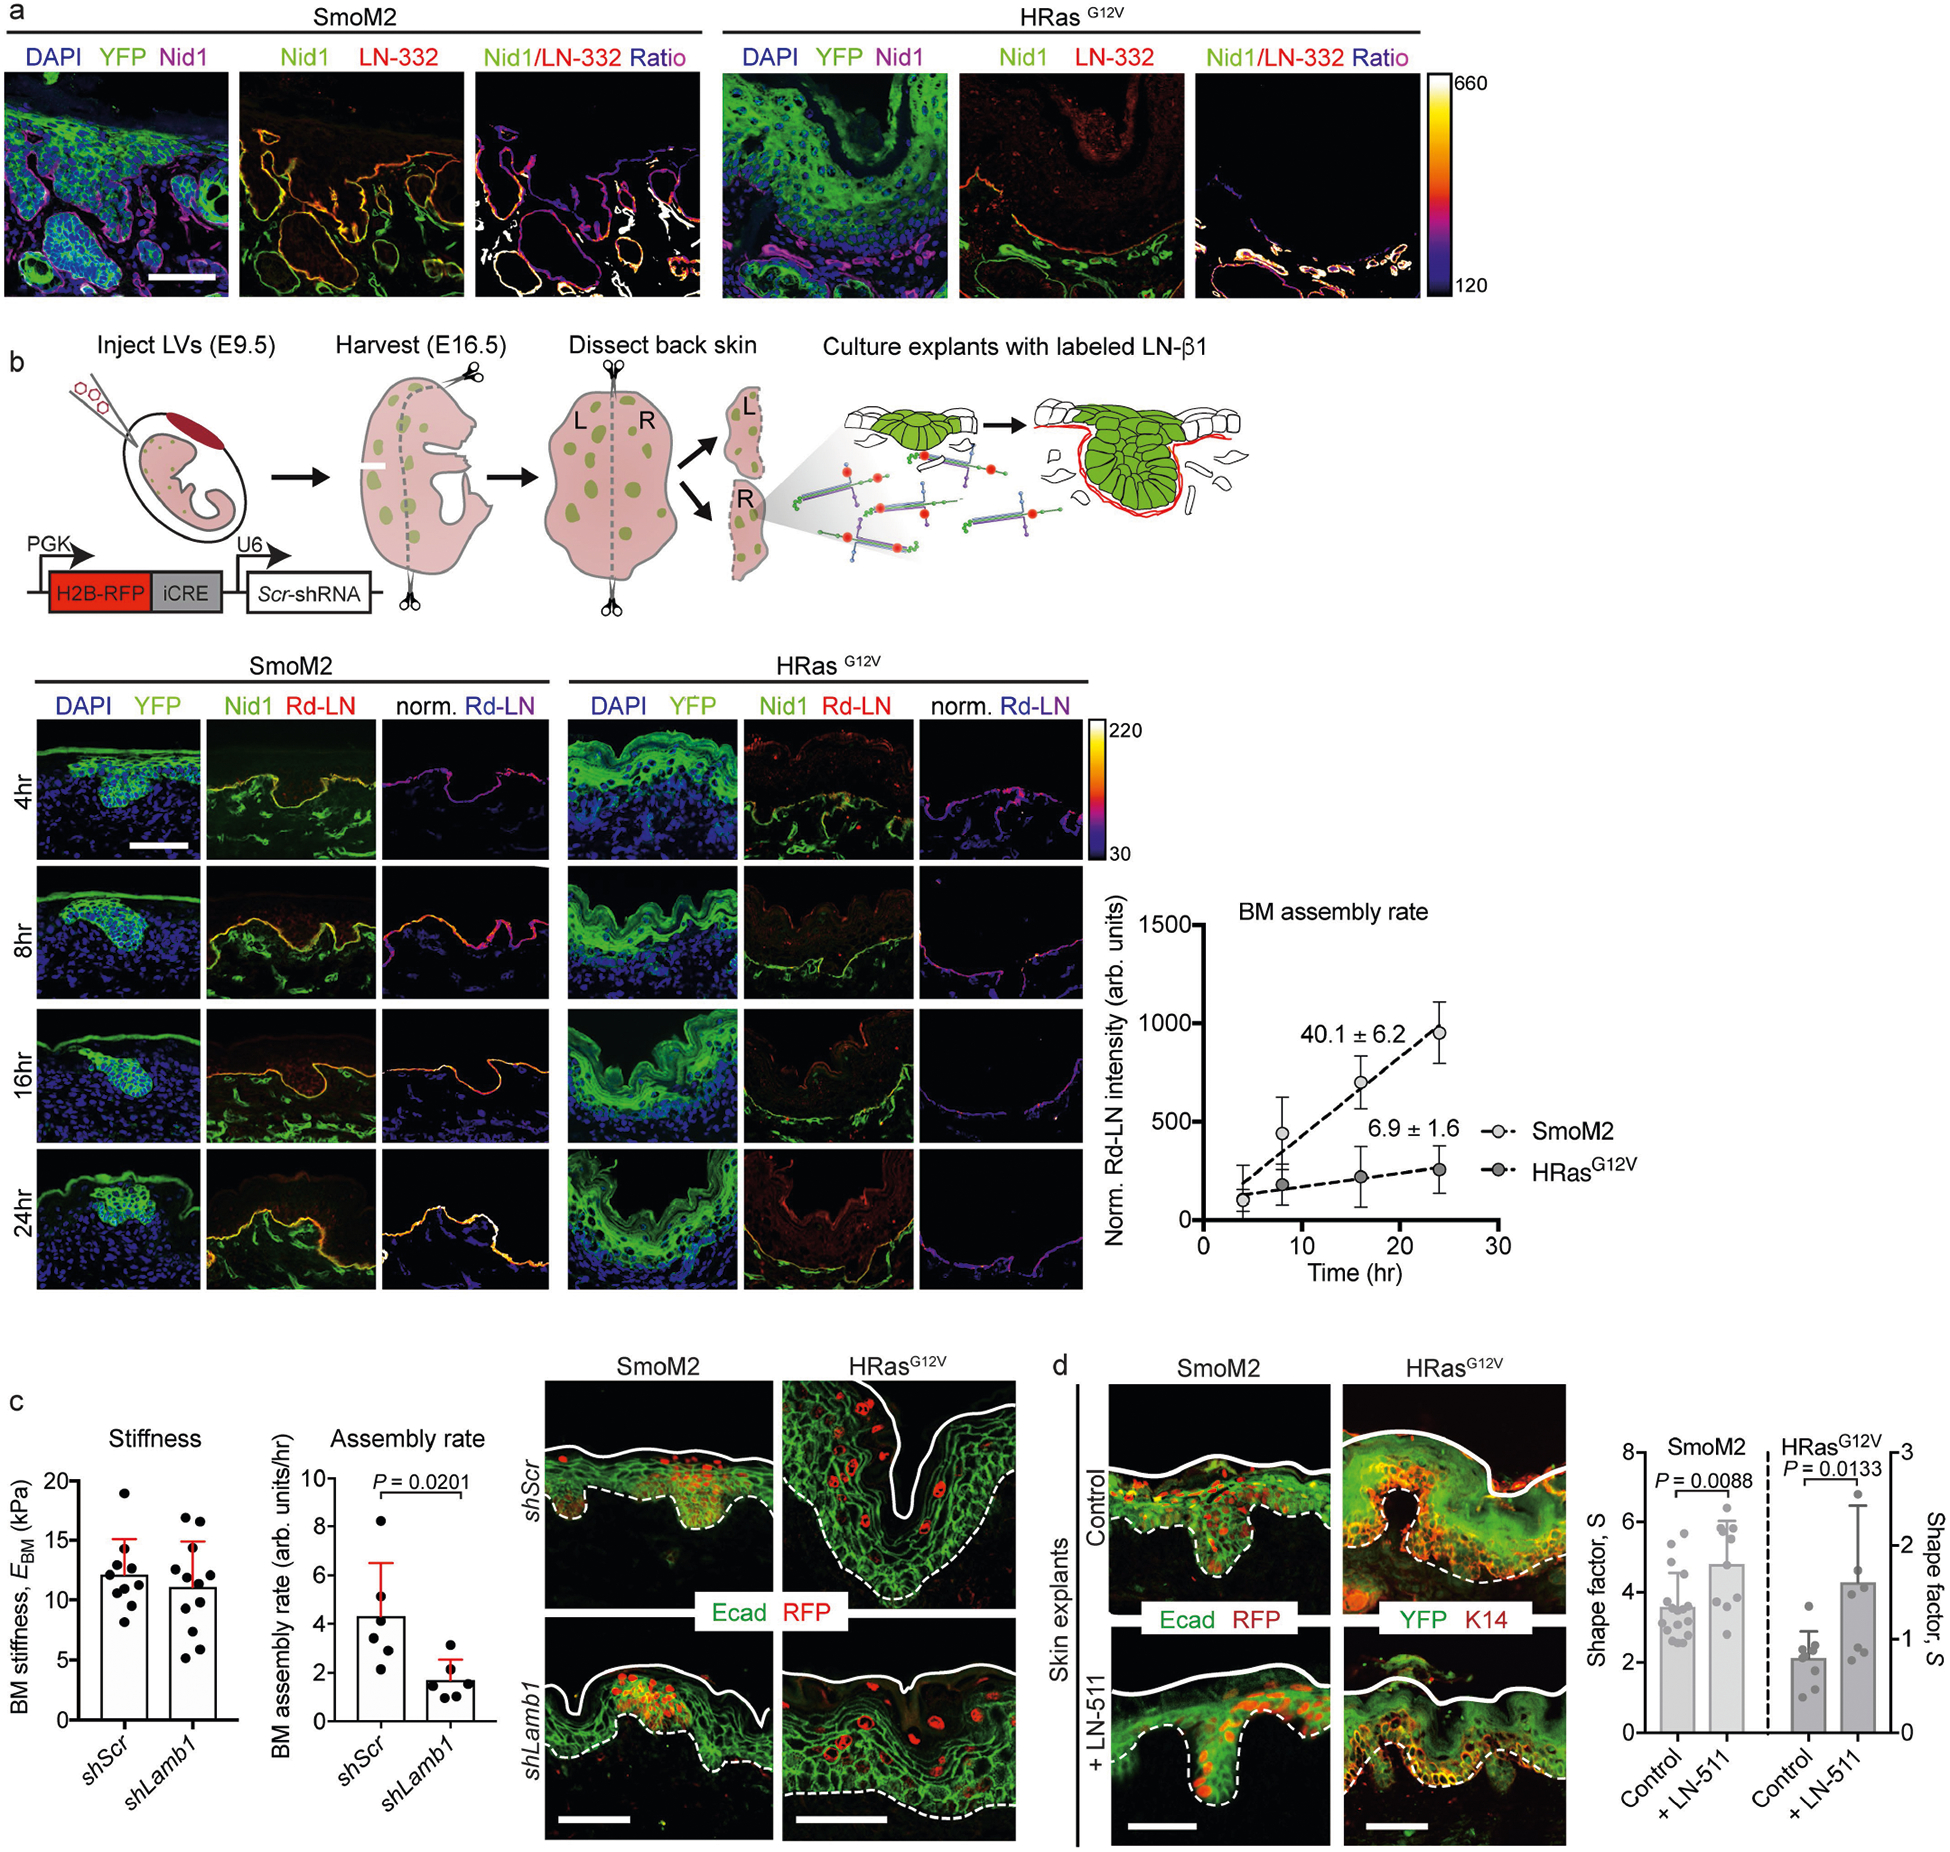
a, Immunofluorescence of oncogenic skin sections. Note the enriched expression of nidogen (Nid1, a component of nascent basement membranes) at the leading edge of SmoM2 lesions, compared with the expression of LN-332 (a component of mature basement membranes), as shown by the ratiometric intensity heatmap. b, Our experimental approach for assaying the assembly rate of basement membranes, and experimental results. Oncogenic skin explants were harvested, and basement-membrane assembly rates were measured by exogenous pulse-labelling with fluorescent LN-β1 (Rd-LN), measuring its incorporation into native membranes over time. Example images are shown at the bottom left, with the intensity ratio of labelled LN-β1 and endogenous Nid1 immunostaining shown in heatmap. Bottom right, quantification of the LN-β1/Nid1 intensity ratio over time, with the slope (m) of each linear fit indicated. c, Changes in basement-membrane stiffness and assembly resulting from Lamb1 knockdown. Left, EBM measurements from shRNA-transduced WT embryos (shScr, n = 10; shLamb1, n = 12; independent regions from three embryos each; mean + s.d.; two-tailed unpaired t-test). Centre, assembly rates were measured as in b (shScr, n = 6; shLamb1, n = 6; Mann–Whitney U-test). Right, representative immunofluorescence images. d, Gain-of-function effects of LN-α5β1γ1 (LN-511) on tissue architecture. E16.5 oncogenic skin explants were cultured for 24 h with an excess (100 μg ml−1) of soluble LN-511 or vehicle control. Left, immunofluorescence staining for E-cadherin and RFP (SmoM2) or YFP and K14 (HRasG12V). Transduced cells are RFP+ and YFP+, respectively. Right, lesional S measurements for LN-511-treated oncogenic explants (SmoM2: control, n = 17; + LN-511, n = 10. HRasG12V: control, n = 9; + LN-511, n = 8; two-tailed unpaired t-test) from four embryos. All bar graphs show means + s.d. Scale bars, 50 μm.
Extended Data Fig. 7 |. Extended characterization of the effects of biophysical properties of the basement membrane on tumour architecture.
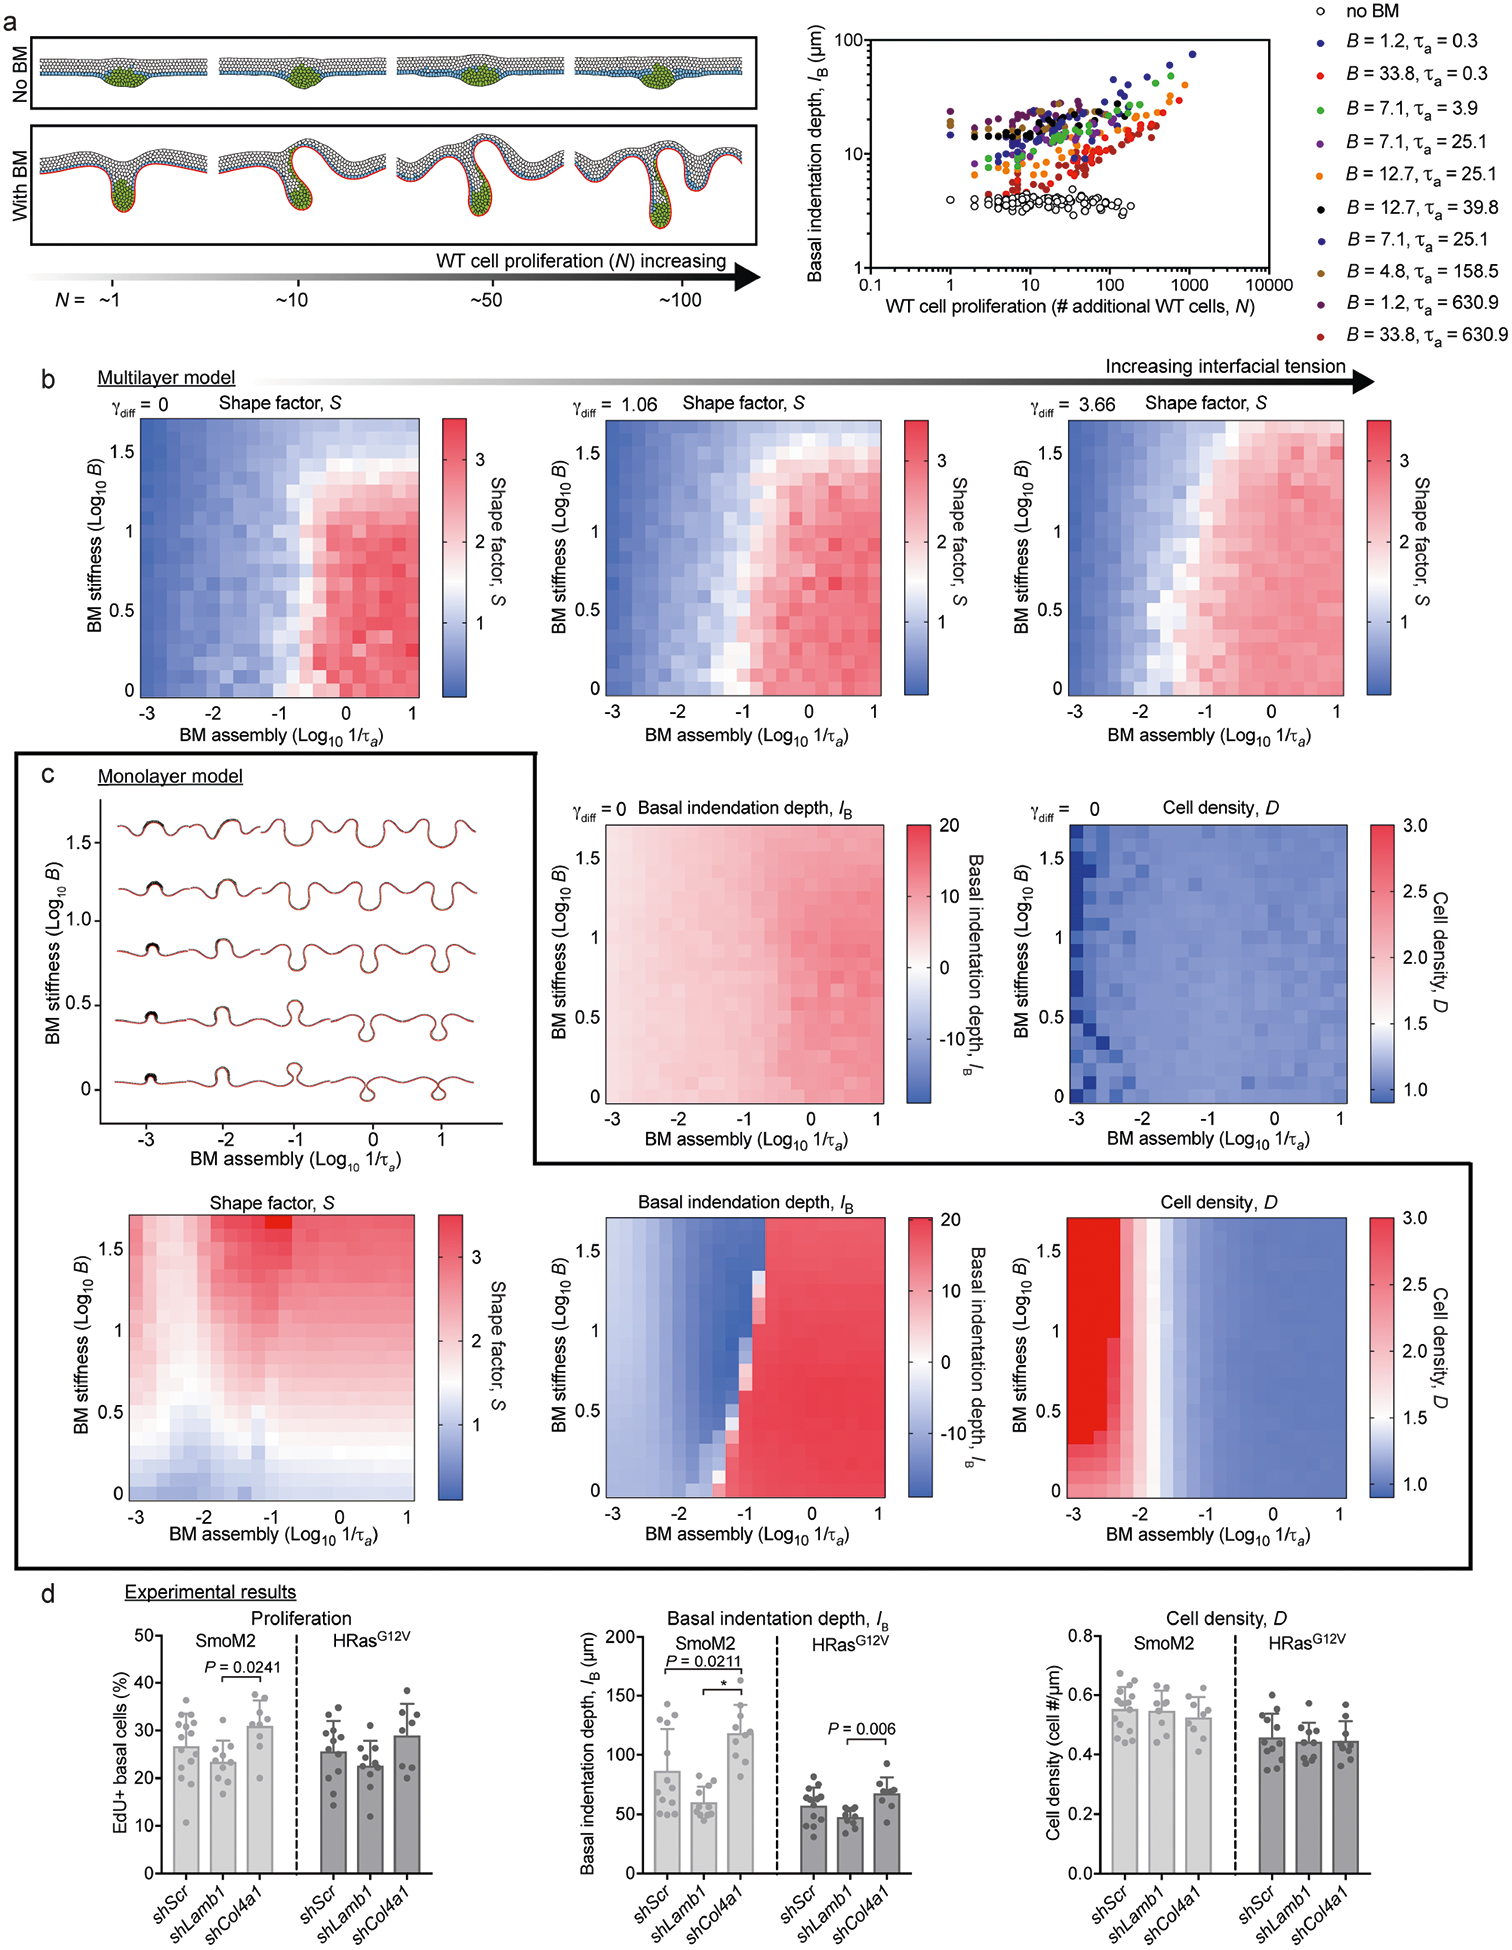
a, Left, a multilayer simulation was constructed to include WT cell proliferation in the absence or presence of the basement membrane. Simulated tissues with varying final numbers of WT cells (N) are shown. Right, basal indentation depth (IB) is quantified for varying values of basement-membrane stiffness (B) and assembly rate (1/τa). The extent of tissue deformations increases with increasing N, and this trend is globally conserved across multiple orders of magnitude and biophysical properties of basement membrane. b, The effect of interfacial tension on multilayer epithelia in the presence of basement membrane. Phase diagrams of S are shown are for γdiff = 0, 1.06 and 3.66. The effect is to gradually increase S values for an increasingly broad range of biophysical properties of the basement membrane. S, IB and cell density (D) phase diagrams from the multilayer model are shown for comparison with the monolayer simulations in c. c, The monolayer model, with mechanical properties of the basement membrane adjusted directly beneath transformed cells (see Supplementary Note 1). Shown (top) are phase diagrams for simulated tissue shapes predicted by the monolayer model as the stiffness and assembly rates of basement membrane are varied over the full parameter space, as well as (bottom) S, IB, and D simulations predicted by the monolayer model. d, Experimental measurements of cell density and proliferation in E18.5 WT, SmoM2 and HRasG12V skins and in oncogenic lesions transduced by shScr, shLamb1 or shCol4a1. Data are from four embryos, two litters for each condition (Kruskal–Wallis test with Dunn’s multiple comparisons). All bar graphs show means + s.d.
Extended Data Fig. 8 |. Measuring tissue mechanics, architecture and gene expression in human and adult mouse BCCs and SCCs.
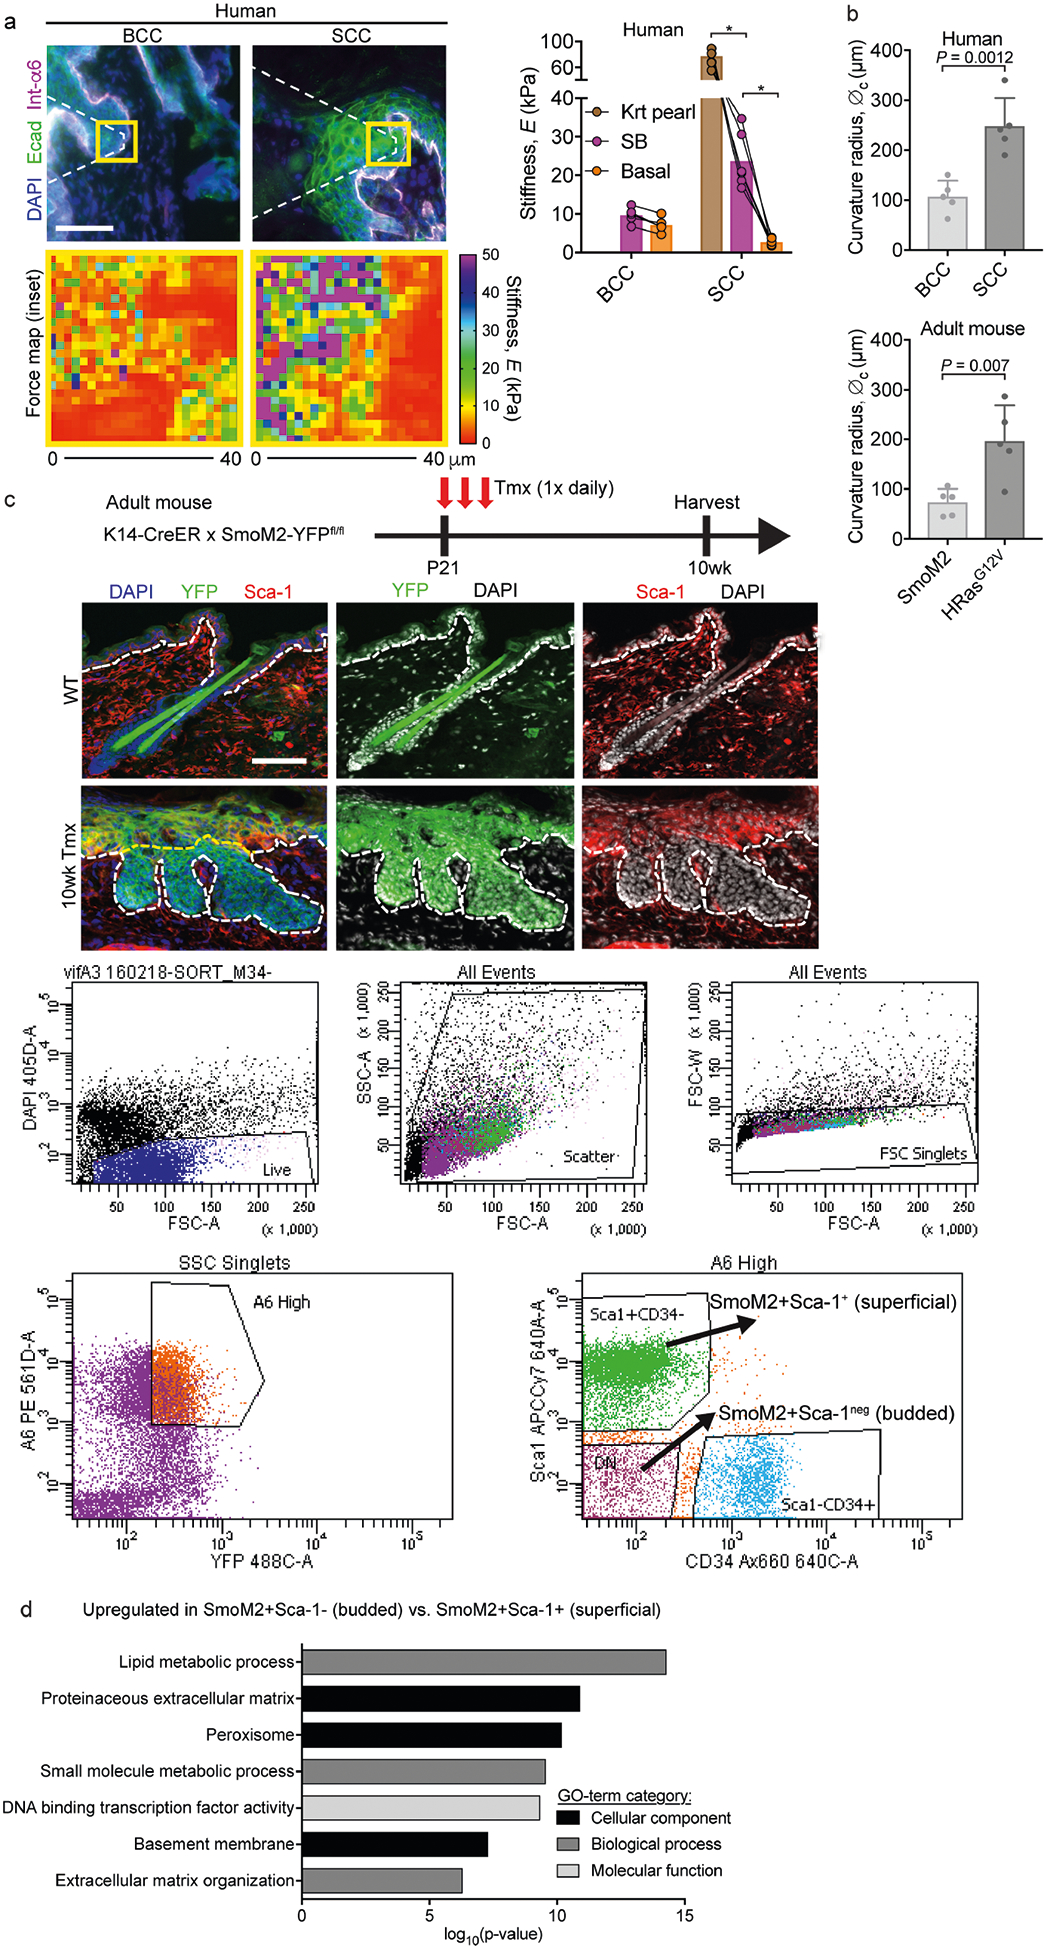
a, AFM measurements of the stiffness of tumour compartments in human BCCs and SCCs. Left, immunofluorescence images of BCCs and SCCs, with force maps of the boxed areas shown below each image. Right, graph showing stiffness values for basal, keratin pearl (Krt Pearl) and suprabasal (SB) regions from BCCs (n = 6 regions from four tumours) and SCCs (n = 6 regions from three tumours). Paired measurements are compared between tumour type and tumour compartment (two-way ANOVA with Tukey’s multiple comparisons test). b, Curvature radius (∅c) values for human and mouse BCCs and SCCs (n = 5 tumours for each group; two-tailed unpaired t-test). c, Strategy for inducing SmoM2 in mice at postnatal day (P)21 and then harvesting 10 weeks later for FACS isolation and transcriptional profiling of α6hi YFP+ SmoM2+ basal progenitors from budded (Sca1−) and superficial (non-budded, Sca1+) tissue. d, GO terms for mRNAs upregulated in budded versus superficial BCC progenitors. Note that the ECM and basement-membrane categories are particularly enriched in budded progenitors. All bar graphs show means + s.d. Scale bars, 50 μm. *P < 0.0001.
Extended Data Fig. 9 |. Effects of a suprabasal stiffness gradient on tissue architectures.
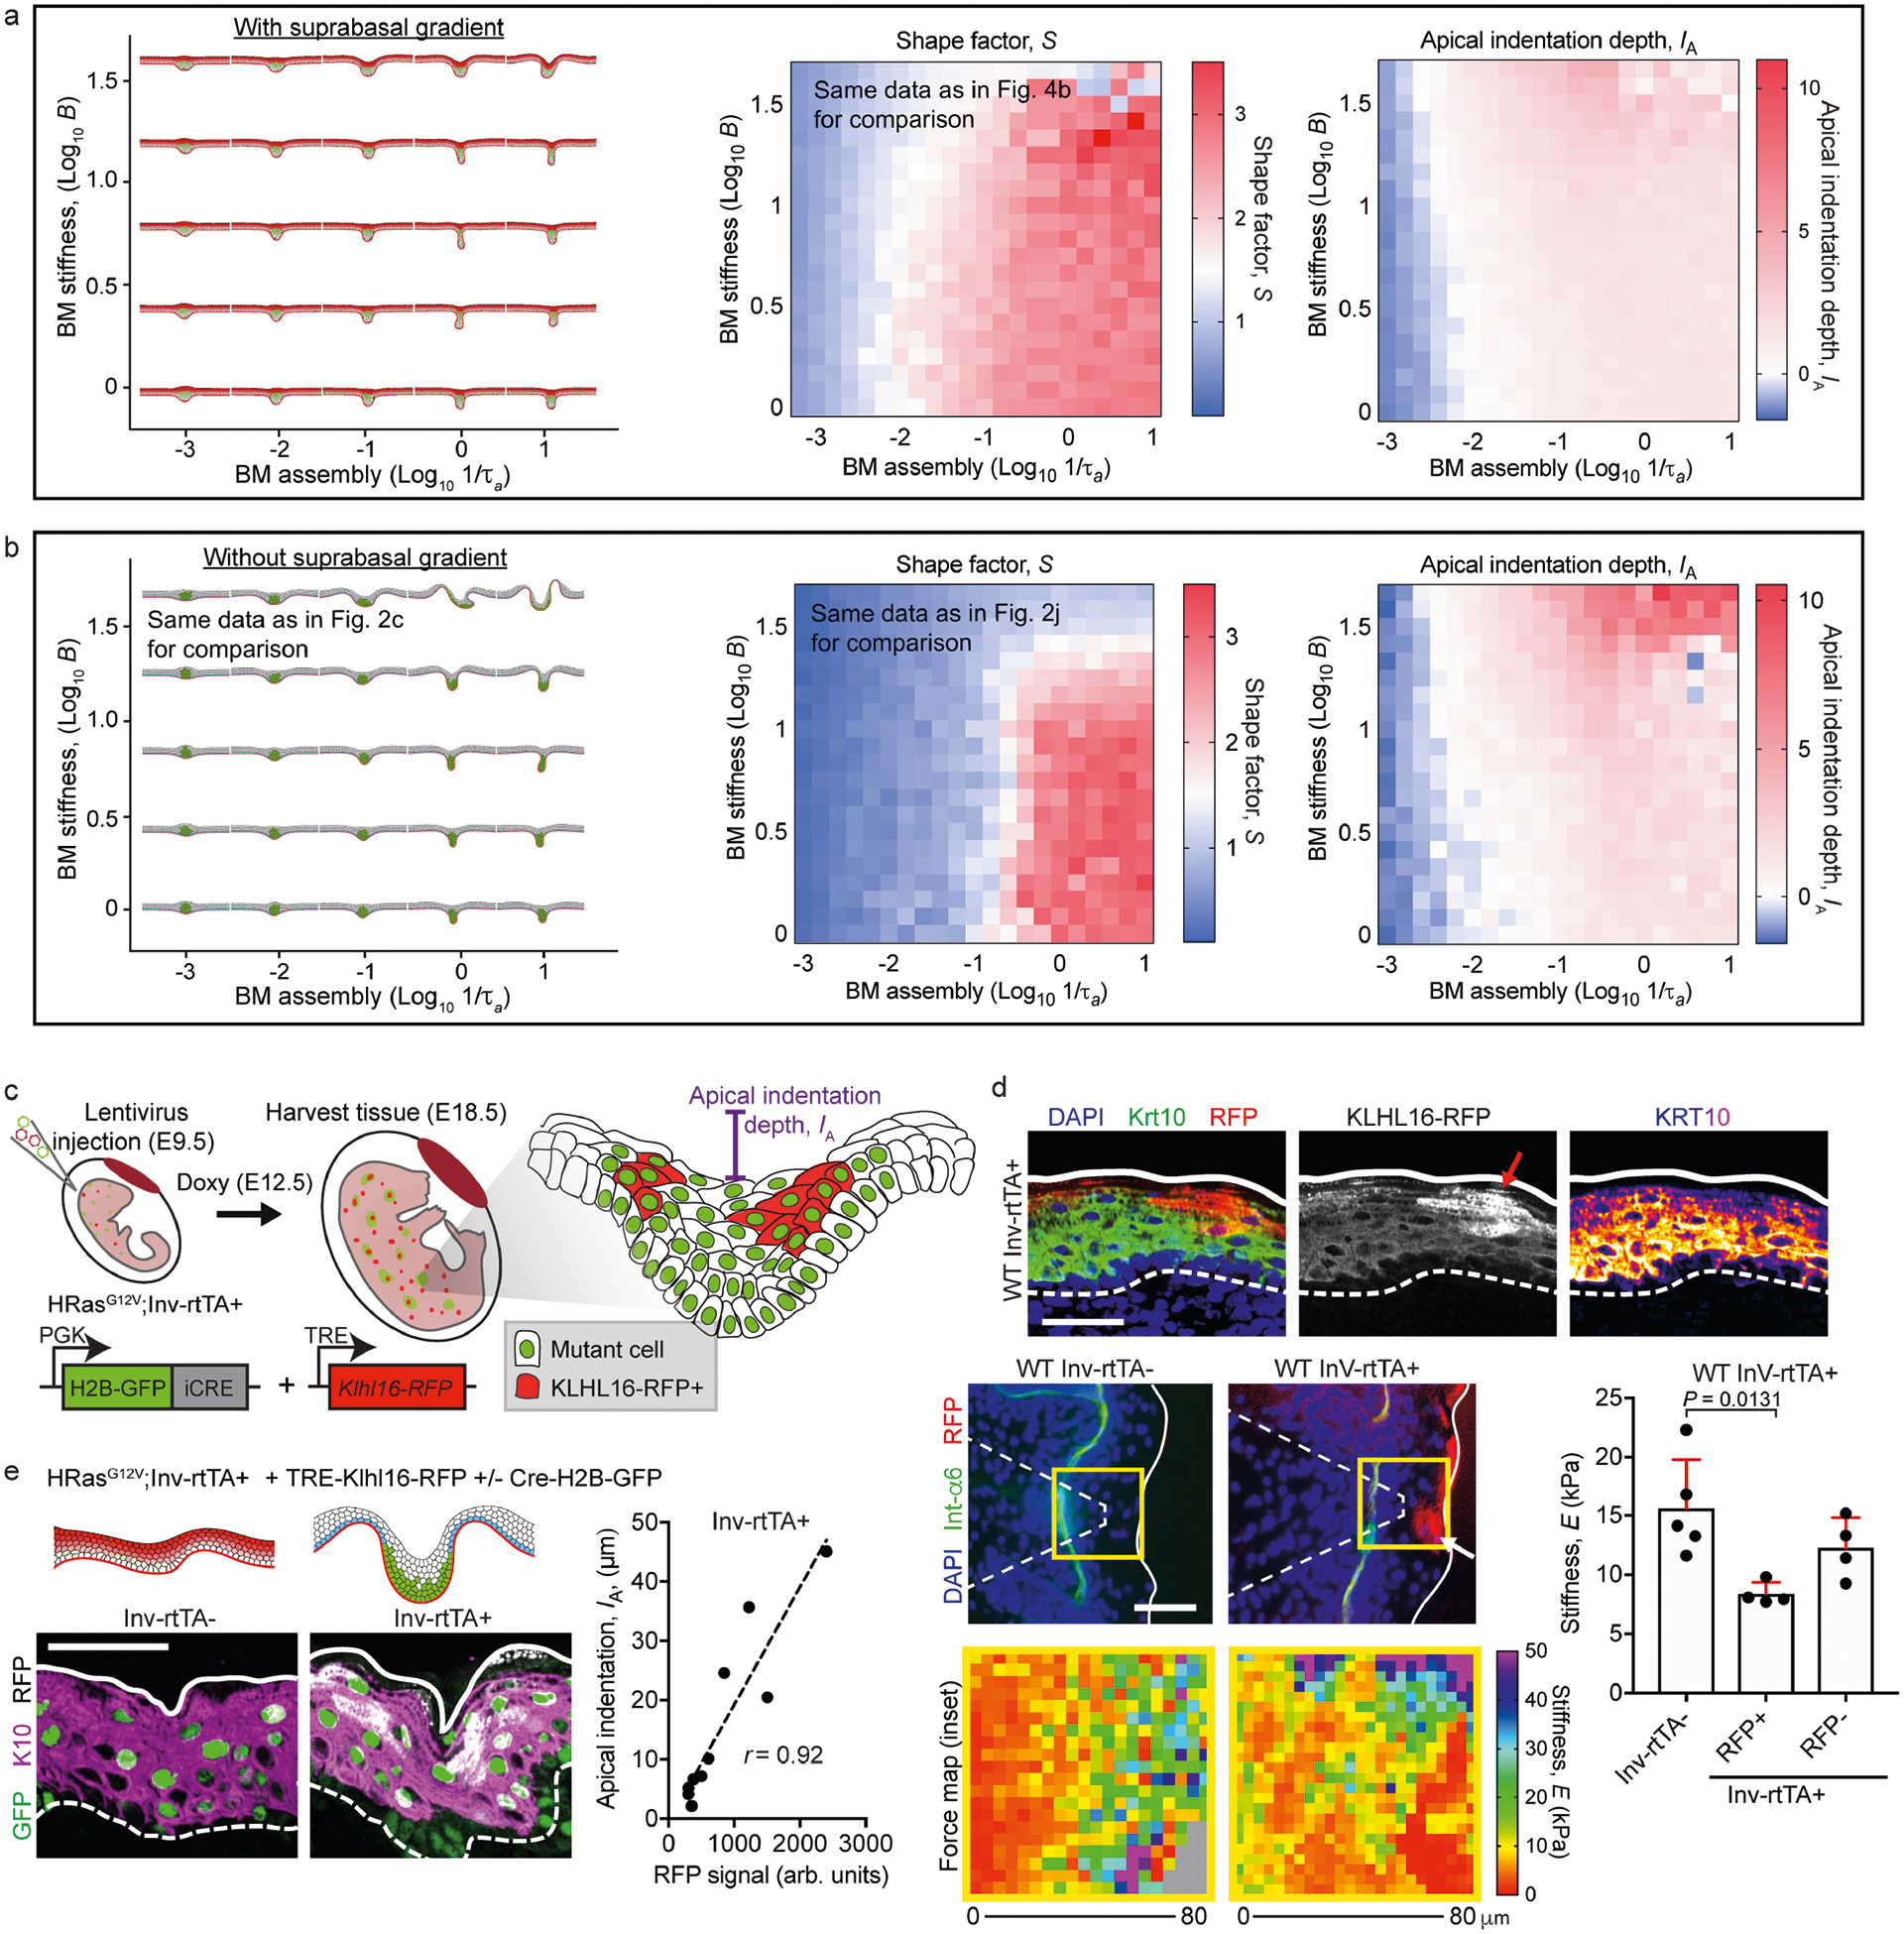
a, Right, phase diagrams of S and IA for the simulated tissue shapes shown at the left with the multilayer cell stiffness gradient for varying basement-membrane stiffness (B) and assembly rates (1/τa). For comparison, we show the same phase diagram for S as in Fig. 4b. b, Right, phase diagrams of S and IA for the simulated tissue shapes shown at the left without the multilayer cell stiffness gradient for varying B and 1/τa. For comparison, we show the same tissue shapes and phase diagram for S as in Fig. 2c, j, respectively. c, Manipulation of suprabasal cell stiffness with the ubiquitin ligase KLHL16. TRE–KLHL16–RFP was induced in suprabasal cells after treating Inv–rtTA mice with doxycycline at E9.5. d, Top, immunofluorescence staining shows a decrease in K10 intensity that overlaps with the RFP signal (arrow). Bottom left, AFM force maps from WT Inv–rtTA− and Inv–rtTA+ embryos at E18.5. Note the decreased stiffness that correlates with the RFP signal in Inv–rtTA+ embryos (arrow). Right, force maps were quantified and compared between RFP− and RFP+ regions of Inv–rtTA+ embryos and Inv–rtTA− embryos (mean + s.d., one-way ANOVA with Tukey’s multiple comparisons test). e, TRE–KLHL16–RFP was induced in suprabasal cells in the HRasG12V background using LV–Cre–H2B–GFP. Tissues harvested at E18.5 were analysed for IA, which correlated linearly with the extent of the TRE–KLHL16–RFP signal (r, Pearson’s correlation coefficient; n = 11 regions from four embryos). Scale bars, 50 μm.
Supplementary Material
Acknowledgements
We thank I. Matos, A. Asare, B. Hurwitz, S. Yuan, L. Polak, L. Hidalgo and M. Sribour for discussions and/or assistance; Y. Rominey in Memorial Sloan Kettering’s Molecular Cytology core for assistance with AFM; and Rockefeller University’s shared resources: the Bio-Imaging Center for microscope usage, and the Comparative Bioscience Center (AAALAC-accredited) for mouse care in accordance with NIH guidelines. V.F.F. was supported by the NIH–National Cancer Institute (NCI) Cancer Biology Training Program (grant CA009673-39) and a Charles H. Revson Senior Fellowship in Biomedical Sciences (Revson Foundation). M.K. was supported by the Slovenian Research Agency (research project Z1-1851). F.G.Q. holds a Career Award at the Scientific Interface from Burroughs Wellcome Fund. E.F. is a Howard Hughes Medical Institute (HHMI) Investigator. This research was supported by NIH grant R01-AR27883 to E.F.
Footnotes
Online content
Any methods, additional references, Nature Research reporting summaries, source data, extended data, supplementary information, acknowledgements, peer review information; details of author contributions and competing interests; and statements of data and code availability are available at https://doi.org/10.1038/s41586-020-2695-9.
Data availability
All RNA-sequencing data from this study have been deposited in the Gene Expression Omnibus (https://www.ncbi.nlm.nih.gov/geo/) under accession code GSE152488 (super-series). All other data in the manuscript, supplementary materials, source data and custom code are available from the corresponding author upon reasonable request. Source data are provided with this paper.
Code availability
Custom code for the multilayer vertex model is available upon request from M.K. (matej.krajnc@ijs.si), along with discussion/guidance for its use.
Competing interests The authors declare no competing interests.
Supplementary information is available for this paper at https://doi.org/10.1038/s41586-020-2695-9.
Peer review information Nature thanks Salvador Benitah, Nicolas Minc and the other, anonymous, reviewer(s) for their contribution to the peer review of this work.
References
- 1.Hanahan D & Weinberg RA Hallmarks of cancer: the next generation. Cell 144, 646–674 (2011). [DOI] [PubMed] [Google Scholar]
- 2.Gilmour D, Rembold M & Leptin M From morphogen to morphogenesis and back. Nature 541, 311–320 (2017). [DOI] [PubMed] [Google Scholar]
- 3.Mohammadi H & Sahai E Mechanisms and impact of altered tumour mechanics. Nat. Cell Biol 20, 766–774 (2018). [DOI] [PubMed] [Google Scholar]
- 4.Pickup MW, Mouw JK & Weaver VM The extracellular matrix modulates the hallmarks of cancer. EMBO Rep. 15, 1243–1253 (2014). [DOI] [PMC free article] [PubMed] [Google Scholar]
- 5.Jones PH, Harper S & Watt FM Stem cell patterning and fate in human epidermis. Cell 80, 83–93 (1995). [DOI] [PubMed] [Google Scholar]
- 6.Atwood SX, Chang AL & Oro AE Hedgehog pathway inhibition and the race against tumor evolution. J. Cell Biol 199, 193–197 (2012). [DOI] [PMC free article] [PubMed] [Google Scholar]
- 7.Crowson AN Basal cell carcinoma: biology, morphology and clinical implications. Mod. Pathol 19 (Suppl 2), S127–S147 (2006). [DOI] [PubMed] [Google Scholar]
- 8.Li S, Balmain A & Counter CM A model for RAS mutation patterns in cancers: finding the sweet spot. Nat. Rev. Cancer 18, 767–777 (2018). [DOI] [PubMed] [Google Scholar]
- 9.Beronja S, Livshits G, Williams S & Fuchs E Rapid functional dissection of genetic networks via tissue-specific transduction and RNAi in mouse embryos. Nat. Med 16, 821–827 (2010). [DOI] [PMC free article] [PubMed] [Google Scholar]
- 10.Beronja S et al. RNAi screens in mice identify physiological regulators of oncogenic growth. Nature 501, 185–190 (2013). [DOI] [PMC free article] [PubMed] [Google Scholar]
- 11.Munjal A & Lecuit T Actomyosin networks and tissue morphogenesis. Development 141, 1789–1793 (2014). [DOI] [PubMed] [Google Scholar]
- 12.Messal HA et al. Tissue curvature and apicobasal mechanical tension imbalance instruct cancer morphogenesis. Nature 566, 126–130 (2019). [DOI] [PMC free article] [PubMed] [Google Scholar]
- 13.Farhadifar R, Röper JC, Aigouy B, Eaton S & Jülicher F The influence of cell mechanics, cell-cell interactions, and proliferation on epithelial packing. Curr. Biol 17, 2095–2104 (2007). [DOI] [PubMed] [Google Scholar]
- 14.Daley WP & Yamada KM ECM-modulated cellular dynamics as a driving force for tissue morphogenesis. Curr. Opin. Genet. Dev 23, 408–414 (2013). [DOI] [PMC free article] [PubMed] [Google Scholar]
- 15.Štorgel N, Krajnc M, Mrak P, Štrus J & Ziherl P Quantitative morphology of epithelial folds. Biophys. J 110, 269–277 (2016). [DOI] [PMC free article] [PubMed] [Google Scholar]
- 16.Pöschl E et al. Collagen IV is essential for basement membrane stability but dispensable for initiation of its assembly during early development. Development 131, 1619–1628 (2004). [DOI] [PubMed] [Google Scholar]
- 17.Brown KL, Cummings CF, Vanacore RM & Hudson BG Building collagen IV smart scaffolds on the outside of cells. Protein Sci. 26, 2151–2161 (2017). [DOI] [PMC free article] [PubMed] [Google Scholar]
- 18.Fidler AL et al. A unique covalent bond in basement membrane is a primordial innovation for tissue evolution. Proc. Natl Acad. Sci. USA 111, 331–336 (2014). [DOI] [PMC free article] [PubMed] [Google Scholar]
- 19.Yurchenco PD Integrating activities of laminins that drive basement membrane assembly and function. Curr. Top. Membr 76, 1–30 (2015). [DOI] [PubMed] [Google Scholar]
- 20.Li J et al. Laminin-10 is crucial for hair morphogenesis. EMBO J. 22, 2400–2410 (2003). [DOI] [PMC free article] [PubMed] [Google Scholar]
- 21.DeRouen MC et al. Laminin-511 and integrin beta-1 in hair follicle development and basal cell carcinoma formation. BMC Dev. Biol 10, 112 (2010). [DOI] [PMC free article] [PubMed] [Google Scholar]
- 22.Asare A, Levorse J & Fuchs E Coupling organelle inheritance with mitosis to balance growth and differentiation. Science 355, eaah4701 (2017). [DOI] [PMC free article] [PubMed] [Google Scholar]
- 23.Gonzales KAU & Fuchs E Skin and its regenerative powers: an alliance between stem cells and their niche. Dev. Cell 43, 387–401 (2017). [DOI] [PMC free article] [PubMed] [Google Scholar]
- 24.Büchau F, Munz C, Has C, Lehmann R & Magin TM KLHL16 degrades epidermal keratins. J. Invest. Dermatol 138, 1871–1873 (2018). [DOI] [PubMed] [Google Scholar]
- 25.Discher DE, Mooney DJ & Zandstra PW Growth factors, matrices, and forces combine and control stem cells. Science 324, 1673–1677 (2009). [DOI] [PMC free article] [PubMed] [Google Scholar]
- 26.Chaudhuri O et al. Extracellular matrix stiffness and composition jointly regulate the induction of malignant phenotypes in mammary epithelium. Nat. Mater 13, 970–978 (2014). [DOI] [PubMed] [Google Scholar]
- 27.Crest J, Diz-Muñoz A, Chen DY, Fletcher DA & Bilder D Organ sculpting by patterned extracellular matrix stiffness. eLife 6, e24958 (2017). [DOI] [PMC free article] [PubMed] [Google Scholar]
- 28.Glentis A et al. Cancer-associated fibroblasts induce metalloprotease-independent cancer cell invasion of the basement membrane. Nat. Commun 8, 924 (2017). [DOI] [PMC free article] [PubMed] [Google Scholar]
- 29.Harunaga JS, Doyle AD & Yamada KM Local and global dynamics of the basement membrane during branching morphogenesis require protease activity and actomyosin contractility. Dev. Biol 394, 197–205 (2014). [DOI] [PMC free article] [PubMed] [Google Scholar]
- 30.Kelley LC et al. Adaptive F-Actin polymerization and localized ATP production drive basement membrane invasion in the absence of MMPs. Dev. Cell 48, 313–328 (2019). [DOI] [PMC free article] [PubMed] [Google Scholar]
- 31.Mao J et al. A novel somatic mouse model to survey tumorigenic potential applied to the Hedgehog pathway. Cancer Res. 66, 10171–10178 (2006). [DOI] [PMC free article] [PubMed] [Google Scholar]
- 32.Chen X et al. Endogenous expression of HrasG12V induces developmental defects and neoplasms with copy number imbalances of the oncogene. Proc. Natl Acad. Sci. USA 106, 7979–7984 (2009). [DOI] [PMC free article] [PubMed] [Google Scholar]
- 33.Srinivas S et al. Cre reporter strains produced by targeted insertion of EYFP and ECFP into the ROSA26 locus. BMC Dev. Biol 1, 4 (2001). [DOI] [PMC free article] [PubMed] [Google Scholar]
- 34.Muzumdar MD, Tasic B, Miyamichi K, Li L & Luo L A global double-fluorescent Cre reporter mouse. Genesis 45, 593–605 (2007). [DOI] [PubMed] [Google Scholar]
- 35.Quiroz FG et al. Liquid-liquid phase separation drives skin barrier formation. Science 367, eaax9554 (2020). [DOI] [PMC free article] [PubMed] [Google Scholar]
- 36.Luxenburg C et al. Wdr1-mediated cell shape dynamics and cortical tension are essential for epidermal planar cell polarity. Nat. Cell Biol 17, 592–604 (2015). [DOI] [PMC free article] [PubMed] [Google Scholar]
- 37.Rauzi M & Lenne PF Probing cell mechanics with subcellular laser dissection of actomyosin networks in the early developing Drosophila embryo. Methods Mol. Biol 1189, 209–218 (2015). [DOI] [PubMed] [Google Scholar]
- 38.Brown AC, Fiore VF, Sulchek TA & Barker TH Physical and chemical microenvironmental cues orthogonally control the degree and duration of fibrosis-associated epithelial-to-mesenchymal transitions. J. Pathol 229, 25–35 (2013). [DOI] [PMC free article] [PubMed] [Google Scholar]
- 39.Costa KD, Sim AJ & Yin FC Non-Hertzian approach to analyzing mechanical properties of endothelial cells probed by atomic force microscopy. J. Biomech. Eng 128, 176–184 (2006). [DOI] [PubMed] [Google Scholar]
- 40.Fiore VF et al. αvβ3 Integrin drives fibroblast contraction and strain stiffening of soft provisional matrix during progressive fibrosis. JCI Insight 3, e97597 (2018). [DOI] [PMC free article] [PubMed] [Google Scholar]
- 41.Nowak JA & Fuchs E Isolation and culture of epithelial stem cells. Methods Mol. Biol 482, 215–232 (2009). [DOI] [PMC free article] [PubMed] [Google Scholar]
- 42.Ouspenskaia T, Matos I, Mertz AF, Fiore VF & Fuchs E WNT-SHH antagonism specifies and expands stem cells prior to niche formation. Cell 164, 156–169 (2016). [DOI] [PMC free article] [PubMed] [Google Scholar]
- 43.Dobin A et al. STAR: ultrafast universal RNA-seq aligner. Bioinformatics 29, 15–21 (2013). [DOI] [PMC free article] [PubMed] [Google Scholar]
- 44.Love MI, Huber W & Anders S Moderated estimation of fold change and dispersion for RNA-seq data with DESeq2. Genome Biol. 15, 550 (2014). [DOI] [PMC free article] [PubMed] [Google Scholar]
- 45.Huang W, Sherman BT & Lempicki RA Bioinformatics enrichment tools: paths toward the comprehensive functional analysis of large gene lists. Nucleic Acids Res. 37, 1–13 (2009). [DOI] [PMC free article] [PubMed] [Google Scholar]
Associated Data
This section collects any data citations, data availability statements, or supplementary materials included in this article.


