Abstract
The analysis of simple sequence repeats (SSRs) in 98 genomes across four genera of the family Polyomaviridae was performed. The genome size ranged from 3962 (BM87) to 7369 bp (BM85) but maximum genomes were in the range of 5–5.5 kb. The GC% had an average of 42% and ranged between 34.69 (BM95) and 52.35 (BM81). A total of 3036 SSRs and 223 cSSRs were extracted using IMEx with incident frequency from 18 to 56 and 0 to 7, respectively. The most prevalent mono-nucleotide repeat motif was “T” (48.95%) followed by “A” (33.48%). “AT/TA” was the most prevalent dinucleotide motif closely followed by “CT/TC”. The distribution was expectedly more in the coding region with 77.6% SSRs of which nearly half were in Large T Antigen (LTA) gene. Notably, most viruses with humans, apes and related species as host exhibited exclusivity of mono-nucleotide repeats in AT region, a proposed predictive marker for determination of humans as host in the virus in course of its evolution. Each genome has a unique SSR signature which is pivotal for viral evolution particularly in terms of host divergence.
Supplementary Information
The online version contains supplementary material available at 10.1007/s13205-020-02583-w.
Keywords: Simple sequence repeats, Polyomaviridae, Prevalence, Distribution, Virus host, Evolution
Introduction
The genome of any organism is the key to understanding its functionality and evolutionary significance. Besides the sequence per se, each genome has some features which provide for very crucial information. For instance, the repeat sequences or satellite sequences which are classified on the basis of the length of the repeat motif. Simple sequence repeats (SSRs) are the smallest of satellite sequences also known as microsatellites. SSRs are ubiquitously present across the genomes of all organisms, albeit with different incidence, complexity and iterations. Ever since the identification of these repeats in multiple species, across coding and non-coding regions, their functional relevance has been explored at different levels (Gur-Arie et al. 2000; Kofler et al. 2008; Chen et al. 2012). Clinical relevance of SSRs in humans has also been reported. For instance, the expansion of these repeats through copy number alterations has been associated with enhancer amplification near oncogenes in cancer as well as in neuronal degradation in multiple neuropathies (Burguete et al. 2015; Hung et al. 2019). Based on iterations and intervening sequences, tandemly repeated SSRs may be classified into interrupted, pure, compound, interrupted compound, complex or interrupted complex (Chambers and MacAvoy 2000).
Amongst various organisms, viruses are a unique platform to study SSRs owing to their small but rapidly evolving genomes. Further, the dependence of viruses on the host cell for survival makes it an easy aspect to study in terms of genome features and evolution. SSRs have been reported to play a role in genome evolution (Bennetzen 2000) and host range in viruses (Alam et al. 2019).
Present study focuses on extraction and analysis of microsatellites from genomes of 98 species of Polyomaviridae, which is a family of small, non-enveloped viruses that derives its name “Polyoma” from its ability to induce multiple tumors in its host. These viruses normally have mammals, avians and fish as their hosts (Ahsan and Shah 2006). The circular/linear genome generally encodes for two types of proteins. First, the early regulatory proteins which include large tumour antigen (LTAg), small tumour antigen (STAg), middle tumour antigen (MTAg), alternative tumour antigen (ATAg) and putative alternative large tumour antigen (PALTAg). These are pivotal for replication, transcription and maturation of the virus during infection. Second category of genes include those encoding for late structural proteins, which include the major capsid protein, viral protein 1 (VP1) and minor capsid proteins, VP2 and VP3. As the name suggests these are important for capsid formation (Moens et al. 2011; Meijden et al. 2015).
In this analysis, we extracted SSRs from genomes of Polyomavirus and studied its incidence, distribution and complexity to understand the genome SSR signature. Further, the role of SSRs in viral evolution and contributing genome regions therein has been studied. This understanding of the viral genomics holds the key to combat viral pathogenesis and host divergence.
Materials and methods
Genome sequences
Whole-genome sequence of 98 species of Alphapolyomavirus of family Polyomaviridae across 4 different genera which is listed in ICTV (https://talk.ictvonline.org/ictv-reports/ictv_online_report/dsdna-viruses/w/polyomaviridae) was extracted from NCBI (http://www.ncbi.nlm.nih.gov/). These include Alphapolyomavirus (43 species), Betapolyomavirus (33 species), Gammapolyomavirus (9 species) and Deltapolyomavirus (4 species). The study also included 9 species yet to be assigned Genera. The details of all the species included in the study (Genome type, Genera, Genome size, GC%, Host, Accession number) have been summarized in Supplementary file 1. All the genomes were double-stranded DNA, mostly circular except for 10 linear genomes. The information for all the known hosts for these viruses was assessed from Virus-Host Database (https://www.genome.jp/virushostdb/note.html).
Microsatellite extraction
We have used Imperfect Microsatellite Extractor (IMEx) for extracting SSRs, wherein mono- to hexa-nucleotide repeat motifs are uncovered, imperfect microsatellites are allowed and compound microsatellites (cSSR: multiple SSRs separated by a distance of less than equal to dMAX) have a dMAX range of 10–50. So, the results need to be assessed within these parameters.
Microsatellite extraction was carried out using the ‘Advance-Mode’ of IMEx with the parameters reported for HIV (Mudunuri and Nagarajaram 2007; Chen et al. 2012) and as used for Mycobacteriophages (Alam et al. 2019). Briefly, the parameters included minimum repeat size which was set as follows: 6 (mono-), 3 (di-), 3 (tri-), 3 (tetra-), 3 (penta-), 3 (hexa-). Two SSRs separated by a distance of less than or equal to dMAX are treated as a single cSSR. In other words, maximum distance allowed between any two SSRs is called dMAX which was set at 10 initially and subsequently varied to 20, 30, 40, 50. All corresponding changes in cSSR incidence were recorded. It should be noted here that the maximum permissible dMAX value in IMEx is 50, because beyond that the fate of microsatellites is individualistic and hence clubbing it as cSSR becomes irrelevant. Other parameters were set to the defaults.
Statistical analysis
All statistical analyses performed on the spreadsheet using data Analysis ToolPak of MS Office Suite v2016. Linear regression was used to reveal the correlation between the relative abundance, relative density of microsatellites with genome size and GC%.
Dot plot analysis for host specificity
Dot plot analysis of two nucleic acid/protein sequences using Genome Pair Rapid Dotter (GEPARD) highlights the presence of SSRs within the genomes (Krumsiek et al. 2007; Alam et al. 2019) to ascertain their evolutionary relationships in context of repeats, reverse matches, and conserved domains. We used GEPARD v1.40 (Krumsiek et al. 2007) to perform dot plot analysis between genomes on the basis of hosts.
Evolutionary relationship
The phylogenetic tree construction was carried out by aligning the nucleotide sequence with the default specifications of MAFFT v6.861b (Katoh and Standley 2013) and the alignment was pruned by the trimAl v1.4.rev6 gappyout algorithmic method (Capella-Gutierrez et al. 2009) using the ETE3 v3.1.1 “build” function as implemented on GenomeNet (https://www.genome.jp/tools/ete/). To evaluate the evolutionary perspective that matches the alignment perfectly, we used pmodeltest v1.4 among JC, K80, TrNef, TPM1, TPM2, TPM3, TIM1ef, TIM2ef, TIM3ef, TVMef, SYM, F81, HKY, TrN, TPM1uf, TPM2uf, TPM3uf, TIM1, TIM2, TIM3, TVM and GTR models to infer ML tree. Using RAxML v8.1.20 of the GTRGAMMAI model with default parameters (Stamatakis 2014), the Maximum-Likelihood (ML) tree was asserted with the 100 bootstrap replicates. The final tree for visualization was constructed utilizing the webtool interactive Tree Of Life (Letunic and Bork 2019).
Results
Genome features
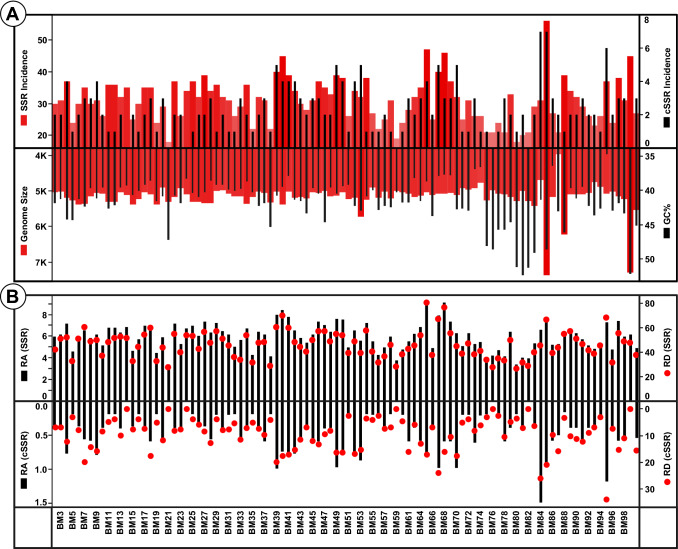
The genome size ranged from 3962 (BM87) to 7369 bp (BM85) but maximum genomes were in the range of 5–5.5 kb. However, the GC% with an average of 42% ranged between 34.69 (BM95) and 52.35 (BM81) but exhibits much more diversity as compared to genome size (Fig. 1a, Supplementary file 1). In essence, the Polyomaviridae genomes are mostly of similar sizes, but its composition in terms of GC% is much more variable. If we hypothesize that SSR incidence has an equal chance across the whole genome, irrespective of the composition. Then the same should be reflected in the motifs of SSRs present. However, as discussed later, this is not the case. There are several species which have mono-nucleotide motifs exclusively in the AT region.
Fig. 1.
a Genome features and SSR/cSSR incidence of Polyomaviridae genomes. Though genome size is predominantly around 5–5.5 kb as evident by a fairly constant level of red bars whereas the corresponding GC variations (superimposed black bars) have a much broader range. In addition, note the diversity in SSRs incidence in genomes of similar length. Furthermore, higher SSR incidence does not necessarily translate to more cSSRs. b Relative abundance (RA) and relative density (RD) of SSRs and cSSRs RA is the number of microsatellites present per kb of the genome whereas RD is the sequence space composed of SSRs of microsatellites per kb of the genome. The varying peaks signify the presence of a unique SSR signature for each genome
The correlation between genome size and GC content was ascertained with various SSR features. SSR incidence was found to be significantly correlated (r = 0.19, P < 0.05) with genome size and GC content (r = 0.08, P < 0.05). Though relative density and relative abundance were not significantly correlated with genome size (r = 0.01, P > 0.05; r = 0.005, P > 0.05), significant correlation was observed with GC content (r = 0.20, P < 0.05; and r = 0.23, P < 0.05), respectively.
Further, cSSR incidence is significantly correlated with genome size (r = 0.06, P < 0.05) but its corresponding relative density (r = 0.0038, P > 0.05) and relative abundance (r = 0.004, P > 0.05) shows no significant correlation therein. GC content is also significantly correlated for cSSR incidence (r = 0.06, P < 0.05), relative density (r = 0.11, P < 0.05), and relative abundance (r = 0.08, P < 0.05).
Incidence of SSRs and cSSRs
A total of 3036 SSRs and 223 cSSRs were extracted from the 98 species of Polyomaviridae (Supplementary files 2–4). The average distribution of SSRs and cSSRs per genome varied from 23 and 1.3 (Gammapolyomavirus) to 33 and 2.9 (Betapolyomavirus), respectively. Their distribution across genera has been summarized in Table 1.
Table 1.
SSR and cSSR incidence across the different genera of Polyomaviridae
| S. No. | Genera | No. of Species | SSR incidence | Average SSR per Species | cSSR incidence | Average cSSR per Species |
|---|---|---|---|---|---|---|
| 1 | Alphapolyomavirus | 43 | 1315 | 30.58 | 80 | 1.86 |
| 2 | Betapolyomavirus | 33 | 1090 | 33.03 | 96 | 2.9 |
| 3 | Deltapolyomavirus | 04 | 108 | 27 | 6 | 1.5 |
| 4 | Gammapolyomavirus | 09 | 208 | 23.11 | 12 | 1.33 |
| 5 | Unassigned Species | 09 | 315 | 35 | 29 | 3.22 |
| Total | 98 | 3036 | 223 |
Maximum of 56 SSRs were present in BM85 whereas minimum of 18 were present in BM80 and BM21. cSSR incidence ranged from 0 in seven species (BM99, BM82, BM76, BM59, BM24, BM21, BM14) to 7 in two species (BM85 and BM84) (Fig. 1a). Two interesting but contrasting observations can be made from this data. First, BM85 and BM84 with 7 cSSRs have 56 and 31 SSRs in a genome size of 7369 and 4697 bp, respectively (Supplementary file 2). What it essentially means is that though a longer genome should ideally account for more SSRs but the eventual clustering of SSRs reflected as cSSR incidence remains the same. Thus, the SSR rich regions of the genome are independent of genome size. The second aspect is that the above observation is not the norm as is evident from the cSSR range of zero to seven. Multiple genomes of Polyomaviridae with varying number of SSRs have same number of cSSRs. This is highlighted by 29 species having 2 cSSRs (Fig. 1a, Supplementary files 2–4) suggesting of a unique genome SSR signature.
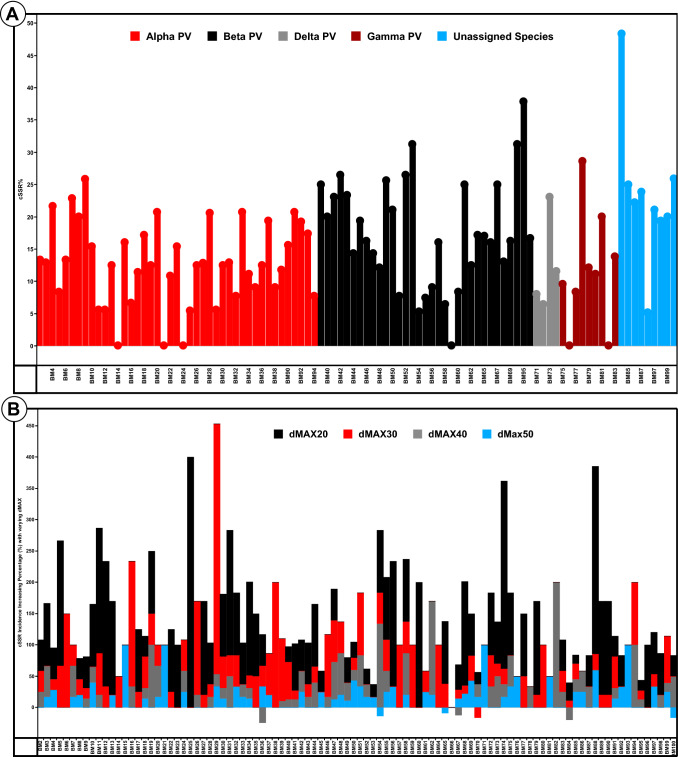
To further highlight the regularity of this anomaly, we looked into cSSR%, which is percentage of SSRs present as cSSRs in a particular genome. Note, the variations in cSSR% are not only across different genera but even within, thereby negating the clustering of SSRs in a genera specific manner (Fig. 2a). These are reflective of specific yet variable localizations and clustering of SSRs in a particular genome.
Fig. 2.
a cSSR% in the studied Polyomaviridae genomes. Percentage of individual SSRs as part of cSSRs is cSSR%. The data for all the genera are differentially coloured. Not only there is diversity across the genera but also within the genomes of the same genera as well. Interestingly, BM84 which has the highest cSSR% is yet to be classified into any genera. b Percentage increase in cSSR incidence with increasing dMAX (10–50). Note the non-linearity in increase. Negative bars represent a decrease in cSSR incidence when two cSSRs merge into one with increasing dMAX
Relative abundance (RA) and relative density (RD) of SSRs and cSSRs
RA is the number of microsatellites present per kb of the genome whereas RD is the sequence space composed of SSRs of microsatellites per kb of the genome. So, these values are reflective of number of iterations of SSRs present. If the SSRs have a conserved tendency to be iterated, then higher incidence should correspond to elevated RD values. Moreover, a higher RA value should correspond to high RD value. As observed, BM65 has the highest RA and RD values of 9.32 and 80.4, respectively, for SSRs which means, since more SSRs are present per kb of the genome, more genome is comprised of SSRs. The corresponding lowest values for RA and RD was 3.39 (BM21) and 26.5 (BM80), respectively (Fig. 1b, Supplementary files 2–4).
Similarly, the cSSR relative abundance (cRA) and relative density (cRD) was also studied. Since there were 7 species with no cSSR (Fig. 1a), hence the minimum cRA and cRD values were zero for these species. The highest values for cRA and cRD were 1.490 (BM84) and 33.93 (BM95), respectively (Fig. 1b, Supplementary files 2–4). This difference may be due to the differential composition of the cSSRs.
dMAX and cSSR
cSSR incidence is dependent on the allowed distance (dMAX) between two SSRs for it to be treated as one cSSR. Since cSSR is reflective of clustering of SSRs, and IMEx allows for dMAX values till 50, we analyzed cSSR incidence of Polyomaviridae genomes by varying the dMAX values from initial value of 10 to 20, 30, 40 and 50. Subsequently, % increase was calculated using the given formula.
This % increase was thereon plotted. Though maximum increase is observed for most species when dMAX increased from 10 to 20 as evident from the predominant black bar, it does not conform to a pattern per se (Fig. 2b). This means that even in species of the same family, SSRs chart their own path in terms of localizations in each genome.
SSR motif types and their prevalence
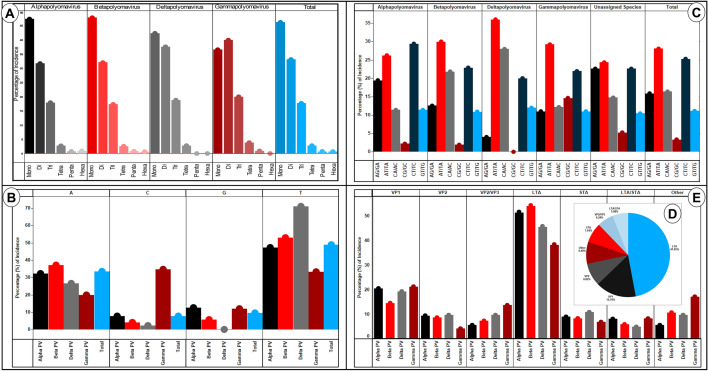
First, the contribution of different repeat motif (mono- to hexa) to the overall SSRs incidence was ascertained. The data were analysed separately for each of the genera. Moreover, the analysis was done in percentage and not absolute numbers to account for variable number of species across genera. Note that the data from species with unassigned genera was not included herein. The contribution of mononucleotide repeats motifs ranged from 36 (Gammapolyomavirus) to 47% (Betapolyomavirus). Deltapolyomavirus had no incidence of penta- and hexa-nucleotide repeats whereas Gammapolyomavirus lacked hexanucleotide repeats. This can be attributed to fewer species in these genera. Gammapolyomavirus had the highest contribution from di-nucleotide repeats (39.42%) and the only genus to have more di-nucleotide repeats than mono-nucleotide repeats (Fig. 3a, Supplementary files 2–3).
Fig. 3.
a SSR incidence and motif length. An increase in repeat motif resulted in lesser incidence, inverse proportionality, which is expected. However, two observations should be noted. First, Gammapolyomavirus is the only genera where the highest incidence is of di-nucleotide repeat motifs. All others have mono-nucleotide motif as most represented along expected lines. Second, the fall in incidence from mono- to di-nucleotide motif SSRs is the least in Deltapolyomavirus. b Mono-nucleotide motif composition. In-spite of varying GC percentage (Fig. 1), the mono-nucleotide motif composition is very much biased towards A/T across all genera. Total represents overall data. c Di-nucleotide motif composition. Though AT/TA is the most represented di-nucleotide repeat motif overall, it does not enjoy the same status across all genera, with Alphapolyomavirus being the exception. Here, CT/TC has the highest incidence closely followed by AT/TA. d Distribution of SSRs (%) across different proteins. Overall, LTAg accounted for over 47% of all SSRs in the coding region with VP1 coming a distant second at around 16%. Only the 6 proteins which accounted for the highest SSRs were included, the rest have been collectively taken as “Others”. e SSRs contribution (%) by proteins across different genera. Herein, subtle variations are visible. Though LTAg gene accounts for maximum SSRs in the coding genome across all the genera but the contributing percentage varies from 35% in Gammapolyomavirus to almost 50% in Betapolyomavirus
We thereon looked into the motif composition of mono- and di-nucleotide repeats for their prevalence across the different genera of Polyomaviridae. For the mono-nucleotides, if we look at the overall data, the most prevalent repeat motif is “T” (48.95%) followed by “A” (33.48%). “T” also remains the most prevalent mono-nucleotide motif for Alpha-, Beta- and Delta-polyomavirus (47, 52 and 71 percent, respectively). However, Gammapolyomavirus has a highest contribution from “C” (34.67%) followed by “T” (33.33%) (Fig. 3b, Supplementary files 2–3). Interestingly, the same Gammapolyomavirus has the highest di-nucleotide repeat motif contribution from “AT/TA” (29.27%) motif while Alphapolyomavirus has its largest contribution from “CT/TC” (29.37). Overall, “AT/TA” was the most prevalent dinucleotide repeat motif closely followed by “CT/TC” (Fig. 3c) PV: polyomavirus.
SSRs in coding regions
The assessment of SSRs distribution across genome revealed that non-coding region accounted for 679 SSRs (22.4%) whereas coding region comprised of 32 proteins/putative genes/ORFs housed 2357 (77.6%) of SSRs (Supplementary file 2).
Subsequently, we analyzed the SSR prevalence across different genes of the studied genomes. Six genes accounted for over 92% of SSRs. Overall, the LTAg gene alone accounted for over 47% of total SSRs with VP1 gene a distant second at around 16% (Fig. 3d). Thereafter, we dissected the data across different genera. Interestingly, though LTAg gene takes the pole position in the housing of SSRs across genera, its contribution varied. In Betapolyomavirus, it was accounting for one in every two SSR (49.54%) while in Gammapolyomavirus, approximately one in every three SSR was housed in LTAg gene (35%). This difference permeates to all the genes, albeit to a lesser extent (Fig. 3e, Supplementary files 2–3).
SSRs (mono-nucleotide) specificity and host range exclusivity
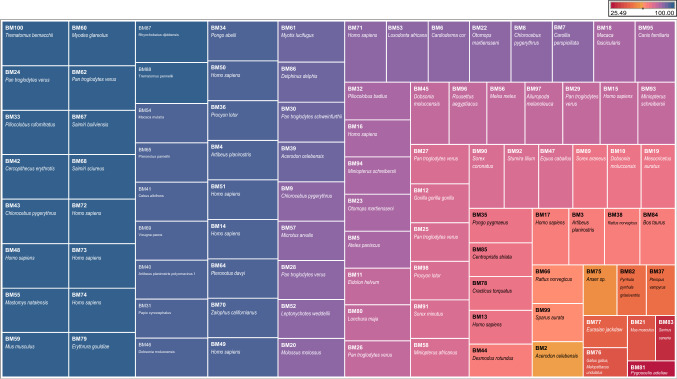
The compilation of different SSRs contribution to overall incidence revealed an interesting observation. Eighteen species had one hundred percent mono-nucleotide SSRs comprising of A/T. Further, the majority of these viruses had humans or members of the ape family as their hosts. To elucidate a possible pattern and significance of the same, we arranged all the studied species in decreasing order of their mono-nucleotide SSR contribution by A/T (Fig. 4, Supplementary files 1–2). Notably, viruses with humans, apes, and related species as hosts have a much higher A/T mono-nucleotide SSRs composition as compared to birds and fishes as hosts (Fig. 4).
Fig. 4.
Genomes with decreasing % of A/T mono-nucleotides repeat motif. Though, not perfect, the similar values for humans and related species suggests host range dependency on SSR distribution across AT genome regions. Higher the contribution of mono-nucleotide repeat motifs from AT region, greater are the chances that it will have humans or related species as its host. The color gradient represents the percentage of A/T mono-nucleotide repeat motif
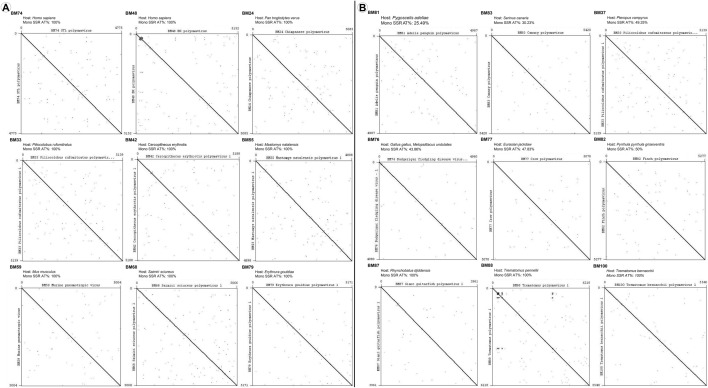
Using representative species (9 each) we thereon investigated whether the SSRs composition by A/T and the hosts reflect a pattern. Dot plot analysis was performed for nine species each with humans, apes and related species as hosts (Fig. 5a) and nine species with birds, fishes and other species as hosts (Fig. 5b). Interestingly, even though three species in Fig. 4 have 100% mono-nucleotide SSR contribution by A/T (same as Fig. 5a), the overall number of dots (reflective of repeat sequences) is higher for all the genomes of Fig. 5a, representing humans and related species as hosts.
Fig. 5.
Dotplot analysis of Polyomaviridae genomes with a human, apes or related species as hosts with mono-nucleotide repeat motif contribution of 100% from the AT region and b divergent hosts with varying mono-nucleotide repeats in the AT region
Phylogenetic tree of Polyomaviridae
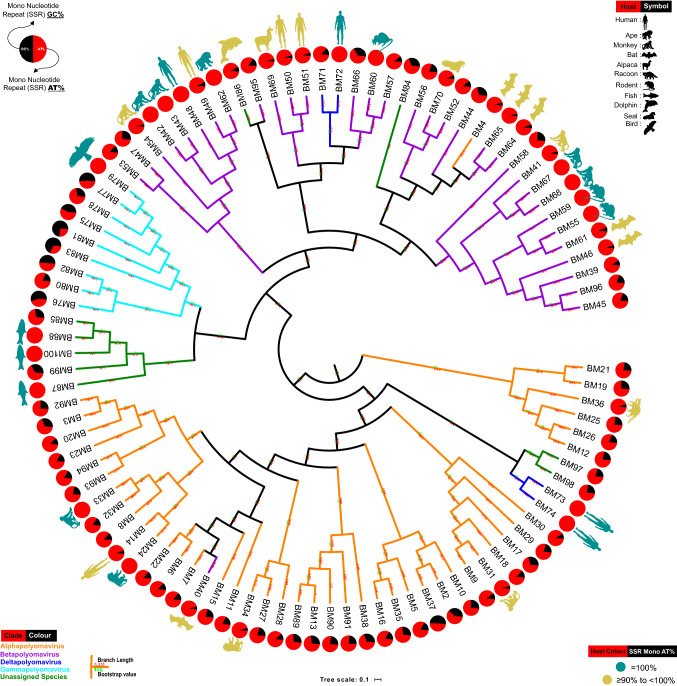
Subsequently, we constructed the phylogenetic tree of the 98 Polyomaviridae genomes and observed that all the viruses are not evolved together as per their hosts. However, hosts do reflect in the tree. Multiple places of clustering of the virus with the same or related hosts can be observed (Fig. 6). The fact that all viruses with human or same hosts do not follow the pattern is only indicative of other players in genome evolution besides hosts.
Fig. 6.
Phylogenetic and host range analysis. The phylogenetic tree is based on whole genome sequence alignment with few important observations. First, the unassigned species are sharing nodes with different genera and hence their cumulative data need to be assessed with care. Second, the circles representing mono-nucleotide SSR contribution indicate that those genomes with exclusive mono-nucleotide SSR in the AT region are distributed across all genera, albeit with varying frequency. Third, the selective representation of host for genomes has been done in two categories, those with exclusive mono-SSRs in AT region (100% indicated by a complete red circle) and those with (90 ≤ mono-SSRs in AT region < 100). It suggests their host range potential which is supported by recent Coronavirus transmission from bats
We thereon superimposed the data for percentage mono-nucleotide SSR contribution by AT region, the phylogenetic analysis and the known hosts. For the sake of clarity, hosts of only those species with > 90% mono-nucleotide SSR contribution from AT region are shown as illustrations here, though the complete information is provided in Fig. 4. We hypothesize that the presence of mono-repeats in the AT region is somehow providing for viral host flexibility and interchangeability.
Discussion
Owing to the variable nature of the A/T and G/C regions of the DNA, often these sequences exhibit specific attributes. The significance of AT repeats in strand slippage and copy number polymorphism is well documented (Katti et al. 2001). Though this implies GC content to be an important aspect for SSR studies but it is not necessarily the case primarily because of two reasons. First, the uneven distribution of SSRs across any genome as observed herein and reported for other genomes is not determined by the GC content (Chen et al. 2012; Alam et al. 2013, 2019). For instance, there are 18 species herein where the complete mono-nucleotide SSRs are localized to the A/T region. The fact that these genomes have a maximum GC content of 52%, proves the argument with 48% of the genome housing hundred percent of the mono-nucleotide repeats. We believe that this unevenness in distribution is not random but with a purpose; most probably host range, as discussed later. Second, the prevalence of repeats is dependent on size of repeat motifs, as in what is applicable to mono-nucleotides, is not true for di-nucleotides and it also varies from one genus to another. However, two exceptions both in Gammapolyomavirus deserve mention. First, it is the only genera to have maximum mono-nucleotide SSRs as “C”. It is a deviation from AT region being hub for shorter repeat motifs. Contrastingly, it returns to expected lines with “AT/TA” being the most represented di-nucleotide repeat motif. Second, we should bear in mind that this genus has lesser number of species (nine) but that may be looked with multiple perspectives. Either we consider the fewer species as the reason for the aberrant observation or we can assume this uniqueness is the reason for fewer species in Gammapolyomavirus. We believe in the latter.
The study of cSSRs has always been relevant with SSRs owing to their involvement in functional aspects such as regulation of gene expression (Kashi and King 2006; Chen et al. 2011). Essentially, cSSR is a reflection of accumulation of SSRs in the genome. Higher cSSR incidence refers to SSRs present in close proximity to each other and with these being sources of variations and genome evolution (Kim et al. 2008; Madsen et al. 2008), we further looked at cSSRs in terms of cSSR% and by varying dMAX. An increase in cSSR incidence with increasing dMAX is expected and observed as well (Fig. 2b). However, the increase not conforming to any pattern as visible by the different lengths of differently coloured lines is indicative of each genomes’ uniqueness. The few instances wherein negative percentage is observed is owing to merging of two independent cSSRs into one with increasing dMAX, thus leading to a decrease in cSSR incidence. Moreover, the cSSR% varies not only across the genera of Polyomaviridae but also within the species of same genera (Fig. 2a). In spite of these variations, of all the reported cSSRs, only 17 are composed of three SSRs and 3 of four SSRs. Rest all are of two SSRs only. There is only one species BM97 which has two cSSRs of more than 3 SSRs each. Other genomes have a single representation only. All the above figures are for dMAX of 10 (Supplementary file 4).
The prevalence of SSRs in coding region of viral genomes conforms to earlier reports (Alam et al. 2014, 2019). The distribution of around 78% SSRs across coding regions is in accordance with other viral genomes through the gene specific data (Fig. 3d–e) exhibits uniqueness to Polyomaviridae genomes. The overlap of genes is reflected by LTAg/STAg or VP2/VP3 representation. Presence of SSRs in these overlapping regions can be influential in the scenario that an alteration there would have an impact on two genes simultaneously. The cSSRs constitution ranged from two to four SSRs, albeit with divergent motifs as mentioned above. The distribution of SSRs failed to conform to a pattern. Thus, we can affirm that the genome-specific clustering of SSRs is not only unique but regulated as well. This may be an attempt of the genome to shield itself from changes as clustering of SSRs will lead to developing hotspots for mutations.
Though the overall evolution of viruses is guided by multiple factors such as host range and genome features, the number and composition of mono-nucleotide SSRs showed a correlation with the hosts and we believe the data has the foundation of predicting the future hosts for any viral species. Our hypothesis stems from the fact that there were eighteen genomes which exhibited mono-nucleotide repeats being exclusively restricted to the AT region. A closer analysis (Fig. 4) revealed a pattern suggesting humans or related hosts in those genomes. On widening our analysis, we can say with confidence that the contribution of mono-nucleotide SSRs from AT region is pivotal for host range determination. Viruses are constantly expanding their hosts as is supported by HIV which had origins in monkey and Coronavirus which had originally bats as host (19). Both the species, monkey and bats, are hosts for Polyomavirus genomes having the exclusive or near-exclusive contribution of mono-SSRs from AT region.
Earlier studies on the evolution of Polyomavirus have suggested gene duplications and inversions as sources for variations in genome size and also predicted their prior existence in invertebrate hosts indicating an evolving virus family in terms of host (Buck et al. 2016). This becomes all the more relevant when we look at the suggested organisms on the basis of this study to share a common/interchangeable host range for viruses. This includes monkeys (HIV) and Bats (Coronavirus) (Parrish et al. 2008). We accept that the correlation between mono-repeat from AT region and host is not universal suggesting other influencing factors but its presence in species across genera demands further authentication of the idea.
To conclude, the incidence and distribution of SSRs in the Polyomaviridae genomes suggests a unique genome SSR signature which is defined by multiple factors. These include GC content, evolutionary relation and coding/non-coding regions. We also propose the mono-nucleotide distribution in A/T region of the genome as a key parameter to host divergence to humans and related species. This needs to be ascertained in all the known human infecting viruses.
Supplementary Information
Below is the link to the electronic supplementary material.
Supplementary file1 Supplementary file S1: Details of Polyomaviridae genomes used in the study. Genome features (NCBI Accession number, size, shape and GC%); virus details (Classification, name, abbreviation) and Host details are summarized. Supplementary file S2: SSRs and cSSRs extracted form studied Polyomaviridae genomes. RA is the number of microsatellites present per kb of the genome whereas RD is the sequence space composed of SSRs of microsatellites per kb of the genome. The corresponding value for cSSR has been represented by cRA and cRD. Overall SSR incidence, tract size as well as for individual repeat motifs along with their localization and other features are mentioned. Supplementary file S3: Raw data for distribution of SSRs found in the Polyomaviridae genomes. This includes consensus sequence, number of iterations, tract size, their start and end positions along with localization (Coding/Non coding). Supplementary file S4: Raw data for distribution of cSSRs found in the Polyomaviridae genomes. This includes composition of the cSSRs, their iterations and their positioning on the genome (start/end). (PDF 1641 KB)
Author contributions
RL performed all the analysis of extracted SSRs and prepared all the figures and tables. MGJ carried out the extraction of microsatellites from IMEx. SA supervised the whole study and prepared the manuscript.
Funding
Not applicable.
Compliance with ethical standards
Conflict of interest
The authors declare that they have no conflict of interest.
Availability of data and material
All data have been provided as supplementary material.
Contributor Information
Rezwanuzzaman Laskar, Email: rezwanuzzaman.laskar@gmail.com.
Md Gulam Jilani, Email: aman.jilani1@gmail.com.
Safdar Ali, Email: safdar_mgl@live.in, Email: ali@aliah.ac.in.
References
- Ahsan N, Shah KV. Polyomaviruses and human diseases. Adv Exp Med Biol. 2006;577:1–18. doi: 10.1007/0-387-32957-9_1. [DOI] [PubMed] [Google Scholar]
- Alam CM, Singh AK, Sharfuddin C, Ali S. In-silico analysis of simple and imperfect microsatellites in diverse tobamovirus genomes. Gene. 2013;530:193–200. doi: 10.1016/j.gene.2013.08.046. [DOI] [PubMed] [Google Scholar]
- Alam CM, Singh AK, Sharfuddin C, Ali S. Incidence, complexity and diversity of simple sequence repeats across potexvirus genomes. Gene. 2014;537:189–196. doi: 10.1016/j.gene.2014.01.007. [DOI] [PubMed] [Google Scholar]
- Alam CM, Iqbal A, Sharma A, et al. Microsatellite diversity, complexity, and host range of mycobacteriophage genomes of the Siphoviridae family. Front Genetics. 2019 doi: 10.3389/fgene.2019.00207. [DOI] [PMC free article] [PubMed] [Google Scholar]
- Bennetzen JL. Transposable element contributions to plant gene and genome evolution. Plant Mol Biol. 2000;42:251–269. doi: 10.1023/A:1006344508454. [DOI] [PubMed] [Google Scholar]
- Buck CB, Doorslaer KV, Peretti A, et al. The ancient evolutionary history of polyomaviruses. PLoS Pathog. 2016;12:e1005574. doi: 10.1371/journal.ppat.1005574. [DOI] [PMC free article] [PubMed] [Google Scholar]
- Burguete AS, Almeida S, Gao F-B, et al. GGGGCC microsatellite RNA is neuritically localized, induces branching defects, and perturbs transport granule function. eLife. 2015;4:e08881. doi: 10.7554/eLife.08881. [DOI] [PMC free article] [PubMed] [Google Scholar]
- Capella-Gutierrez S, Silla-Martinez JM, Gabaldon T. trimAl: a tool for automated alignment trimming in large-scale phylogenetic analyses. Bioinformatics. 2009;25:1972–1973. doi: 10.1093/bioinformatics/btp348. [DOI] [PMC free article] [PubMed] [Google Scholar]
- Chambers GK, MacAvoy ES. Microsatellites: consensus and controversy. Comp Biochem Physiol B Biochem Mol Biol. 2000;126:455–476. doi: 10.1016/S0305-0491(00)00233-9. [DOI] [PubMed] [Google Scholar]
- Chen M, Zeng G, Tan Z, et al. Compound microsatellites in complete Escherichia coli genomes. FEBS Lett. 2011;585:1072–1076. doi: 10.1016/j.febslet.2011.03.005. [DOI] [PubMed] [Google Scholar]
- Chen M, Tan Z, Zeng G, Zeng Z. Differential distribution of compound microsatellites in various Human Immunodeficiency Virus Type 1 complete genomes. Infect Genet Evol. 2012;12:1452–1457. doi: 10.1016/j.meegid.2012.05.006. [DOI] [PubMed] [Google Scholar]
- Gur-Arie R, Cohen CJ, Eitan Y, et al. Simple sequence repeats in Escherichia coli: abundance, distribution, composition, and polymorphism. Genome Res. 2000;10:62–71. [PMC free article] [PubMed] [Google Scholar]
- Hung S, Saiakhova A, Faber ZJ, et al. Mismatch repair-signature mutations activate gene enhancers across human colorectal cancer epigenomes. eLife. 2019;8:e40760. doi: 10.7554/eLife.40760. [DOI] [PMC free article] [PubMed] [Google Scholar]
- Kashi Y, King DG. Simple sequence repeats as advantageous mutators in evolution. Trends Genet. 2006;22:253–259. doi: 10.1016/j.tig.2006.03.005. [DOI] [PubMed] [Google Scholar]
- Katoh K, Standley DM. MAFFT multiple sequence alignment software version 7: improvements in performance and usability. Mol Biol Evol. 2013;30:772–780. doi: 10.1093/molbev/mst010. [DOI] [PMC free article] [PubMed] [Google Scholar]
- Katti MV, Ranjekar PK, Gupta VS. Differential distribution of simple sequence repeats in eukaryotic genome sequences. Mol Biol Evol. 2001;18:1161–1167. doi: 10.1093/oxfordjournals.molbev.a003903. [DOI] [PubMed] [Google Scholar]
- Kim T-S, Booth JG, Gauch HG, et al. Simple sequence repeats in Neurospora crassa: distribution, polymorphism and evolutionary inference. BMC Genomics. 2008;9:31. doi: 10.1186/1471-2164-9-31. [DOI] [PMC free article] [PubMed] [Google Scholar]
- Kofler R, Schlötterer C, Luschützky E, Lelley T. Survey of microsatellite clustering in eight fully sequenced species sheds light on the origin of compound microsatellites. BMC Genomics. 2008;9:612. doi: 10.1186/1471-2164-9-612. [DOI] [PMC free article] [PubMed] [Google Scholar]
- Krumsiek J, Arnold R, Rattei T. Gepard: a rapid and sensitive tool for creating dotplots on genome scale. Bioinformatics. 2007;23:1026–1028. doi: 10.1093/bioinformatics/btm039. [DOI] [PubMed] [Google Scholar]
- Letunic I, Bork P. Interactive Tree Of Life (iTOL) v4: recent updates and new developments. Nucleic Acids Res. 2019;47:W256–W259. doi: 10.1093/nar/gkz239. [DOI] [PMC free article] [PubMed] [Google Scholar]
- Madsen BE, Villesen P, Wiuf C. Short tandem repeats in human exons: a target for disease mutations. BMC Genomics. 2008;9:410. doi: 10.1186/1471-2164-9-410. [DOI] [PMC free article] [PubMed] [Google Scholar]
- Moens U, Ludvigsen M, Van Ghelue M (2011) Human polyomaviruses in skin diseases. In: Pathology research international. https://www.hindawi.com/journals/pri/2011/123491/. Accessed 3 May 2020 [DOI] [PMC free article] [PubMed]
- Mudunuri SB, Nagarajaram HA. IMEx: imperfect microsatellite extractor. Bioinformatics. 2007;23:1181–1187. doi: 10.1093/bioinformatics/btm097. [DOI] [PubMed] [Google Scholar]
- Parrish CR, Holmes EC, Morens DM, et al. Cross-species virus transmission and the emergence of new epidemic diseases. Microbiol Mol Biol Rev. 2008;72:457–470. doi: 10.1128/MMBR.00004-08. [DOI] [PMC free article] [PubMed] [Google Scholar]
- Stamatakis A. RAxML version 8: a tool for phylogenetic analysis and post-analysis of large phylogenies. Bioinformatics. 2014;30:1312–1313. doi: 10.1093/bioinformatics/btu033. [DOI] [PMC free article] [PubMed] [Google Scholar]
- van der Meijden E, Kazem S, Dargel CA, et al. Characterization of T antigens, including middle T and alternative T, expressed by the human polyomavirus associated with trichodysplasia spinulosa. J Virol. 2015;89:9427–9439. doi: 10.1128/JVI.00911-15. [DOI] [PMC free article] [PubMed] [Google Scholar]
Associated Data
This section collects any data citations, data availability statements, or supplementary materials included in this article.
Supplementary Materials
Supplementary file1 Supplementary file S1: Details of Polyomaviridae genomes used in the study. Genome features (NCBI Accession number, size, shape and GC%); virus details (Classification, name, abbreviation) and Host details are summarized. Supplementary file S2: SSRs and cSSRs extracted form studied Polyomaviridae genomes. RA is the number of microsatellites present per kb of the genome whereas RD is the sequence space composed of SSRs of microsatellites per kb of the genome. The corresponding value for cSSR has been represented by cRA and cRD. Overall SSR incidence, tract size as well as for individual repeat motifs along with their localization and other features are mentioned. Supplementary file S3: Raw data for distribution of SSRs found in the Polyomaviridae genomes. This includes consensus sequence, number of iterations, tract size, their start and end positions along with localization (Coding/Non coding). Supplementary file S4: Raw data for distribution of cSSRs found in the Polyomaviridae genomes. This includes composition of the cSSRs, their iterations and their positioning on the genome (start/end). (PDF 1641 KB)


