

Three major molecular subtypes of Alzheimer’s disease are identified, cross-validated, and characterized across 1543 individuals.
Abstract
Alzheimer’s disease (AD), the most common form of dementia, is recognized as a heterogeneous disease with diverse pathophysiologic mechanisms. In this study, we interrogate the molecular heterogeneity of AD by analyzing 1543 transcriptomes across five brain regions in two AD cohorts using an integrative network approach. We identify three major molecular subtypes of AD corresponding to different combinations of multiple dysregulated pathways, such as susceptibility to tau-mediated neurodegeneration, amyloid-β neuroinflammation, synaptic signaling, immune activity, mitochondria organization, and myelination. Multiscale network analysis reveals subtype-specific drivers such as GABRB2, LRP10, MSN, PLP1, and ATP6V1A. We further demonstrate that variations between existing AD mouse models recapitulate a certain degree of subtype heterogeneity, which may partially explain why a vast majority of drugs that succeeded in specific mouse models do not align with generalized human trials across all AD subtypes. Therefore, subtyping patients with AD is a critical step toward precision medicine for this devastating disease.
INTRODUCTION
Alzheimer’s disease (AD) is the most common form of dementia in the elderly, estimated to affect more than 5.8 million individuals in the United States and more than 50 million worldwide, with almost half of individuals aged over 75 years (1). AD is primarily characterized by progressive neurological decline, especially selectively targeted memory loss and cognitive dysfunction (2). The neuropathological manifestations of AD start long before apparent cognitive symptoms, however. It is traditionally understood that these include the accumulation of amyloid-beta (Aβ) peptide as extracellular plaques and hyperphosphorylated tau as intracellular neurofibrillary tangles (NFTs), typically identified on postmortem biopsy and used for definitive AD diagnosis. Both Aβ and NFT accumulation typically progress to targeted neuronal and synaptic loss, mainly in regions of the cerebral cortex and the hippocampus. Concurrent with the neuronal loss in AD, there is an additional coordinated breakdown across other brain cell types such as gliosis, demyelination, and inflammation that exacerbates cognitive dysfunction (3).
However, an increasingly growing body of evidence has demonstrated that AD is a heterogeneous disease caused by various pathophysiologic mechanisms beyond the typical dogma. For instance, up to one-third of patients with a clinical diagnosis of AD have no accumulation of Aβ (4), while many of those diagnosed with AD at postmortem biopsy do not show cognitive impairment (5). Among those at risk of sporadic late-onset AD (LOAD), patients may carry a unique set of numerous genetic changes with greater risk for developing the disease, including clusterin (CLU), triggering receptor expressed on myeloid cells 2 (TREM2), and apolipoprotein E (APOE) variants (6). The interaction between specific LOAD risk alleles and changes in disease pathogenesis, however, remains elusive.
Furthermore, it is very challenging to predict the progression of AD, suggesting high heterogeneity in disease progression among patients with AD. There is growing evidence that disease progression and responses to interventions differ substantially within LOAD. For instance, patients with LOAD often branch into distinct groups including (i) slow versus rapid cognitive decliners (7), (ii) amnestic versus nonamnestic AD (8), (iii) executive versus cortical visual defect versus dysphasia-predominant AD (9), (iv) psychosis and depression-associated AD (10–12), and (v) metabolic dysfunction–associated AD modulated by abnormalities in insulin resistance, hormonal deficiencies, or homocysteinemia (13). Last, the relationship between the various forms of AD and other non-AD dementias such as primary age-related tauopathy (14), vascular contributions to cognitive impairment and dementia (15), and frontotemporal dementia (16) must be better understood. Therefore, identifying unique molecular subtypes of AD resistant to other comorbid conditions may provide new insights into AD patient subpopulations and pave the way for precision medicines for AD.
Molecular biomarkers may hold the promise for improving methodologies for AD subtype identification and classification (17, 18). Some recent studies have highlighted the great advantages of using RNA sequencing (RNA-seq) to profile the transcriptome of the brain with neurodegenerative diseases. For instance, a multiomic molecular analysis of LOAD across four brain regions uncovered subnetworks and previously unidentified molecular drivers of the disease, including the vacuolar adenosine 5′-triphosphate (ATP)–dependent proton pump ATP6V1A, which are now shown to modulate cognitive function in Drosophila models of AD (19). In addition, molecular network analysis of LOAD brains has identified an excess of dysregulated genes that cannot be fully predicted by a single model of the disease (19). Nevertheless, only a limited number of published papers describe RNA-seq studies of the most relevant material, namely, human AD brains across multiple regions (20). Therefore, it is highly likely that specific subtype signatures of AD exist across large transcriptomic studies that have not yet been identified.
In this study, we investigate molecular subtypes of AD in the Mount Sinai/JJ Peters VA Medical Center Brain Bank (MSBB-AD) (21) study and replicate these findings in the Religious Orders Study–Memory and Aging Project (ROSMAP) (22, 23). The MSBB-AD cohort is a critical resource to understand postmortem molecular changes leading to regional vulnerability as the samples were extracted from four brain regions, including the frontal pole (FP), the superior temporal gyrus (STG), the parahippocampal gyrus (PHG), and the inferior frontal gyrus (IFG), of the same set of human. Understanding the genetic and molecular differences between molecular subtypes of AD within these data will provide novel insights into disease pathogenesis and offer new avenues for developing effective therapeutics.
RESULTS
The PHG carries the strongest molecular signal of LOAD
We obtained clinical and transcriptomic signatures from the MSBB-AD study of 364 human brains, including whole-transcriptome RNA-seq data from four brain regions (FP, STG, PHG, and IFG) from participants with AD that showed neurocognitive decline as measured by clinical dementia rating (CDR) score > 1 and nondemented controls (CDR = 0). An overview of the cohorts, methods, and analyses used in this study is provided in fig. S1. In addition, table S1 summarizes the clinical and pathologic phenotypes for the samples in the MSBB-AD cohort with the transcriptomic data from the PHG. We identified several confounding factors in the RNA-seq data, including age of death, race, and postmortem interval (PMI). To minimize reidentification of clinical and technical covariates (see Materials and Methods), we first correct the transcriptomic data for age of death, race, gender, PMI, batch number, and RNA integrity number (RIN) using a mixed-effects model.
To understand which brain regions and molecular processes are most vulnerable to dysregulation in AD, we perform differential gene expression analysis between AD and control, generating differentially expressed genes (DEGs) for each of the four brain regions in the MSBB-AD (see Materials and Methods). The PHG brain region has the largest number of DEGs [3571 genes; adjusted false discovery rate (FDR), 0.05] compared to the FP (3 genes), STG (1 gene), and IFG (181 genes). The results are consistent with previous DEG analyses (19) of the MSBB-AD transcriptomic data and suggest that the PHG is most vulnerable in AD as manifested by marked transcriptomic dysregulation. In addition, these findings are consistent with our previous pan-cortical atlas of AD (independent of the data described here), in which the PHG brain region showed the most substantial transcriptomic changes (24). Previous work has shown that the hippocampus is strongly associated with Aβ and tau accumulation and early memory loss in AD (24). We have also shown in previous studies of the MSBB-AD cohort that transcriptomic changes in the PHG region highly overlap the Kyoto Encyclopedia of Genes and Genomes (KEGG) (25) Alzheimer’s and Parkinson’s disease gene sets and are correlated with high Aβ plaque density (19), demonstrating that these changes are consistent with AD disease progression. Therefore, the PHG region carries the strongest molecular signature of AD.
Normalization of data by AD stages removes confounding signal of neuronal loss
Patients with more severe AD-associated dementia, such as those in a later stage of the disease, have been reported to have more neuronal loss at postmortem biopsy (3). Therefore, it is important to control for AD stage before transcriptomic analysis is performed between AD participants. Previous work by our laboratory has shown that brain cell–type surrogate proportion values (SPVs), including the proportion of neurons in a sample, can be inferred from bulk RNA-seq data when combined with measurements of brain cell type–specific gene expression patterns (26) and may serve as a marker of neuronal loss in AD.
To determine the extent of hippocampal neuronal loss in the MSBB-AD cohort, we perform cell-type proportion analysis (Materials and Methods) of bulk tissue transcriptomic data from the PHG region. As shown in fig. S2A, there is a strong relationship between PHG neuronal loss and CDR score in the MSBB-AD cohort, with astrogliosis and increased abundances of other cell types associated with disease progression. Currently, there is no universally accepted method to rectify for neuronal loss seen in AD, as this reduction in neurons is both the cause and effect of molecular changes leading to cognitive impairment. We examine both normalization by neuronal cell-type proportion SPVs and AD dementia (as measured by CDR score, range 0 to 6) to reduce the molecular signature of neuronal loss in AD, using a linear effect model (Materials and Methods). We show that after either normalization by neuronal cell-type proportion or dementia severity (fig. S2, A and B), there is no remaining significant correlation between cell type and AD stage. Furthermore, the remaining correlation after normalization by dementia severity is not reduced further with additional normalization for neuronal cell type, as shown in fig. S2C. Thus, both normalization by CDR and cell-type proportion SPVs effectively remove the confounding effects of neuronal loss along disease progression in the MSBB-AD cohort.
We further normalize the PHG transcriptomic data by CDR score, to remove the confounding effects of neuronal loss in later AD stages. Therefore, any identified differences between groups of AD participants should be distinct from previously identified clinical subtypes of AD that rely on these metrics.
Identification of AD putative subtypes from molecular data of the PHG
We seek to determine whether subgroups of AD participants demonstrate molecular and clinical differences. To robustly identify subgroups of AD participants, we evaluate the performance of several sample clustering methods for AD participants using the normalized gene expression data within each brain region in the MSBB-AD cohort. We choose two classical clustering algorithms (hierarchical, k-means) as well as two novel network-based clustering algorithms [weighted sample gene network analysis (WSCNA) and multiscale embedded gene expression network analysis (MEGENA)] to group similar samples together into putative AD subtypes. WSCNA shows the best performance in terms of clustering quality and thus is adopted to identify AD subtypes for the subsequent analyses.
As shown in Fig. 1, WSCNA identifies five subtypes in the MSBB-AD (clusters A, B1, B2, C1, and C2) across all 151 participants with PHG transcriptomic data. On the basis of the dendrogram and the network similarity heatmap (Fig. 1, A and B), these five subtypes can be further grouped into three major classes of AD-labeled class A, class B (comprising subtypes B1 and B2), and class C (comprising subtypes C1 and C2). Each class of subtypes has a similar number of samples (47 in class A, 54 in class B, and 50 in class C) (Fig. 1C).
Fig. 1. Identification of five stable molecular subtypes of AD.

(A and B) WSCNA clustering dendrogram and topological overlap matrix (TOM) heatmap, showing three major classes (A, B, and C) and five subtypes annotated as A, B1, B2, C1, and C2, corresponding to the yellow, red, blue, turquoise, and orange clusters, respectively. (C) Number of samples in each subtype, control (CDR = 0) and mild cognitive impairment (MCI) (CDR = 0.5). (D) Gene expression profiles of all the samples in the PHG from the MSBB-AD cohort. The samples on the columns are grouped by subtype, and the genes on the rows are grouped by WINA module. FC, fold change. (E) Change in mean expression level of various gene pathways for each AD subtype in comparison with the normal control samples. AD-related pathways, representing differential expression from previous AD studies, are derived from the MSigDB. Sets are grouped by major area of biological activity.
Cluster stability is defined here as the rate at which sample pairs group together into the same subtypes upon repeated reclustering on a random subset of the input data (Materials and Methods). Subtypes from WSCNA clustering are generally stable (fig. S4), and sample pairs grouped together, on average, between 60 and 91% across all five detected AD subtypes. The class C subtypes have the strongest stability, followed by class A and class B; all subtypes demonstrate a cluster stability strongly above random clusters, which was empirically determined at a stability range between 20 and 30%. Therefore, these subtypes show specific robust molecular signals suitable for classification into stable subtypes.
Molecular signatures of putative AD subtypes
To characterize the molecular signatures of these AD subtypes, we identify DEGs for each of the five subtypes compared with nondemented controls (CDR = 0) from the RNA-seq data in the PHG region. The identified AD subtype molecular signatures are provided in data file S1. Each AD subtype has a specific transcriptomic signature of up- and down-regulated genes that distinguishes it from the others at a molecular level, suggesting a plurality of different mechanisms of AD. As shown by Fig. 1D, there is a clear separation of molecular signatures between the five AD subtypes that can be visually appreciated from the whole-transcriptome gene expression heatmap after identifying gene modules using weighted interaction network analysis (WINA) (24, 27).
Using mean gene expression levels grouped by Gene Ontology (GO) pathway as surrogate markers for the activity level of various molecular processes in the brain, we identify a number of differences in key AD-related pathways between the subtypes, providing insights into disease pathogenesis. As shown in Fig. 1E, we highlight significant deviations (Welsh’s P < 0.05) of 74 AD-related signatures from previous studies and GO pathways (17, 28), including pathways related to Aβ, oxidative stress, tau NFT, and synaptic function, across the five AD subtypes and controls. First, we compare our subtype molecular signatures with the postmortem hippocampal transcriptional signatures of AD by Blalock et al. (28) (termed Blalock signatures). Overall, molecular signatures from all AD participants are consistent with Blalock; however, this consistency is not shared between each of the individual AD subtypes. We observe that the direction of the gene expression changes in the class C subtypes is consistent with the Blalock signatures, while the changes in the class A subtype are opposite to Blalock. In contrast, the signature of the class B subtypes does not show significant enrichment of the Blalock signatures. Therefore, AD subtypes may be classified into three larger classes (classes A, B, and C), i.e., typical (class C), intermediate (class B), or atypical (class A), by molecular presentation when compared to the Blalock signatures of AD.
We observe only weak molecular enrichment of Aβ- and tau-related pathways across all AD participants as a group, but strong enrichment of these pathways in the subtypes. For instance, we see strong up-regulation of Aβ binding, clearance, and fiber formation pathways in subtype C1 and scavenger receptor activity in subtypes C1 and C2, while these same pathways are down-regulated in subtypes A and B1. On the other hand, tau-neighborhood genes (“GNF2_MAPT” pathway) are strongly up-regulated in subtypes A, B1, and B2 but down-regulated in C1 and C2. Tau protein binding and tau-related P35 pathway genes are up-regulated in the subtype A. Therefore, it is likely that AD subtypes may be characterized by either Aβ activity predominant (class C) or microtubule associated protein tau (MAPT)–activity predominant (class A + B) although they cannot fully explain all differences seen between the five subtypes.
The predicted subtypes also differ strongly in neuronal activity despite normalization for AD staging. We see broad down-regulation of glutaminergic, γ-aminobutyric acid (GABA) related, glycinergic, and dendritic synaptic pathways in class C subtypes, with absent changes in cholinergic and dopaminergic synaptic pathways, suggesting that these synapse types are selectively resilient to AD subtype molecular changes. On the other hand, we observe strong up-regulation of these same synapse pathways in classes A and B, with the exception of up-regulation of glycinergic synapse in class A. This pattern is consistent with differences in synaptic excitation pathways between subtypes: Excitatory synapses are up-regulated in classes A and B but down-regulated in class C. These data suggest that AD subtypes may be split into those selectively vulnerable to synaptic depression (class C) versus synaptic excitation (classes A and B).
Dysregulated immune system activities, including reactive gliosis and the breakdown of the blood-brain barrier, have been repeatedly observed in AD brains (29). In subtypes B2, C2, and especially C1, immune-related pathways including the innate and adaptive immune response, immune system activation, inflammation, circulatory system development, and endothelial cell migration are up-regulated compared with normal controls. Such up-regulation coincides with increased expression of blood-brain barrier, basement membrane, and cell matrix adhesion genes. However, these immune response pathways are down-regulated in subtypes A and B1. These data and the findings relative to synaptic pathways suggest that disease progression across AD subtypes is characterized by either increased immune or synapse pathway activity.
Last, certain molecular pathways are subtype specific and thus provide greater insights into disease pathogenesis when considering other enriched AD pathways. For example, many protein degradation–related genes, including ubiquitination and polyubiquitination, protein catabolism, the proteasome, and proteins targeting for destruction, are up-regulated in subtype A while organic acid–related genes, including acid secretion and acidic amino acid transport, are specifically up-regulated in class B. Defects in the acidification of lysosomes in neurons have been previously associated with neuronal and synaptic loss in AD, as well as decreases in long-term potentiation (19).
Association of clinical and pathological phenotypes and APOE variants with putative AD subtypes
To understand the clinical characteristics of these molecularly defined AD subtypes, we examine the relationship between characterized AD pathologic markers in the MSBB-AD study and each subtype. As shown in Fig. 2 (B and C), under the Kruskal-Wallis (KW) one-way analysis of variance (ANOVA) test, the AD subtypes are marginally associated with several clinical AD markers, including tau NFT levels in the medial frontal cortex (KW, P = 0.041), Aβ mean plaque density (KW, P = 0.020), and APOE e4 (KW, P = 0.048) and APOE e2 (KW, P = 0.012) allele counts. The “Aβ predominant” AD subtypes (class C), with a mean plaque density of 14.2/mm2, show a significantly larger Aβ plaque burden than both of the “tau-predominant” class A (mean, 8.4/mm2; Welsh’s t test, P = 3.1 × 10⁻³) and the class B (mean, 9.6/mm2; Welsh’s t test, P = 0.018) subtypes, despite no significant difference in cognitive decline as measured by CDR. Consistent with the preprocessing steps already performed on the PHG data, the subtypes do not show significant differences in previously corrected covariates. We do not see significant changes in CDR score (KW, P = 0.082; Fig. 2C), biological sex (KW, P = 0.554; Fig. 2, B and C), ethnicity (KW, P = 0.748), PMI (KW, P = 0.502), or age of death (KW, P = 0.503) across AD subtypes.
Fig. 2. Mean values of several clinical and pathologic traits across AD subtypes.
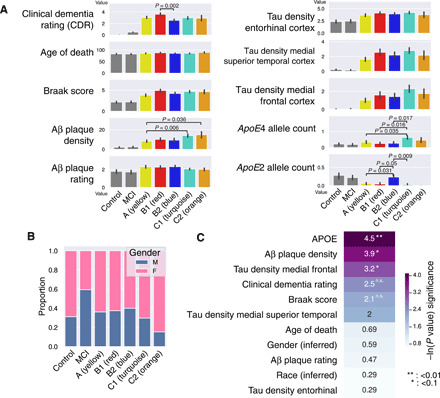
(A) Bar plots of mean CDR, Braak score, Aβ plaque density, tau NFT densities (measured in the entorhinal cortex, the medial superior temporal cortex, and the medial frontal cortex), APOE4 allele count, and APOE2 allele count across five subtypes, control, and MCI. (B) Stacked bar chart of inferred biological sex from transcriptomic data for all the PHG samples, across five subtypes, control, and MCI. (C) Natural log-transformed P values from the KW ANOVA test of clinical, pathologic, and demographic variables. Significant tests are greater than ~3.0, which corresponds to an α of 0.05. n.s., not significant.
We also seek to better understand differences in APOE allele dosages between AD subtypes. We find that certain subtypes are preferentially enriched or depleted for the e4 and e2 alleles compared with others. For instance, the subtype C1 has a significantly increased APOE e4 allele dosage (median, 0.61 alleles per participant) compared with the subtypes A (P = 0.035 under Welsh’s t test), B1 (P = 0.015), and B2 (P = 0.017). This is consistent with the known influence of the e4 allele on AD pathogenesis, including the formation of Aβ plaques and NFTs, most similar to the molecular signature of the Aβ-predominant subtypes. On the other hand, subtype C2, which shares many molecular features with C1, does not have this association with APOE e4. Furthermore, subtype B2 has an increased APOE e2 allele dosage (median, 0.23 alleles per participant) compared with subtype A (P = 0.031) and C1 (P = 0.0091); however, similar to APOE e4 among the class C subtypes, the APOE e2 dosage is also much higher than subtype B1 (P = 0.049). Therefore, while APOE may modulate AD pathogenesis and contribute to some molecular signatures in a portion of subtypes, we show that APOE dosage is insufficient to fully explain all of the molecular similarities and differences between both related and distinct AD subtypes.
A subset of postmortem Alzheimer’s brains with PHG transcriptomic data available (n = 55 of 151) has additional quantification of Aβ plaque and tau NFT amounts across multiple brain regions, as shown in fig. S6. We observed that tau NFT counts are significantly associated with the AD subtypes across the inferior parietal lobule (KW test, P = 0.017) and medial frontal gyrus (KW, P = 0.034). In these regions, both the class B and C subtypes have increased tau NFT burden. In contrast, Aβ plaque rating is significantly elevated in the inferior parietal lobule (KW, P = 0.031), medial frontal gyrus (KW, P = 0.041), and lateral frontal gyrus (KW, P = 0.012) in only the class C (Aβ-predominant) subtypes. These results are consistent with the previous signatures from the GO pathway analysis, indicating that class C subtypes are Aβ predominant, while class B subtypes are tau NFT predominant. It is likely that while class A shows increased MAPT pathway activity, it is resilient to the development of tau NFTs, perhaps via increased protein degradation pathway activity. Therefore, these results suggest that class A subtypes are tau NFT resilient. As expected from the analysis on all samples, both CDR (KW, P = 0.155) and Braak score (KW, P = 0.075) are not associated with the AD subtypes. Therefore, AD staging is not associated with the changes in Aβ plaque and tau NFT levels in the subtypes.
Key network regulators of putative AD subtypes
The diverse molecular changes in the AD subtypes suggest distinct intrinsic molecular mechanisms underlying each subtype. To identify potential key regulators of the molecular changes in each AD subtype, we use a network biology approach that integrates multiscale embedded gene coexpression network analysis (MEGENA) (30) and Bayesian causal network (BN) (31) inference (19, 24, 27, 32). Toward this end, we construct a coexpression network on the basis of all the AD samples in the PHG, which includes 22,291 genes and 61,152 edges, and a BN comprised of 21,577 genes and 23,554 edges. Key driver analysis (KDA; Materials and Methods) of each resulting network and the subtype DEG signatures identifies a ranked list of 955 up-regulated and 639 down-regulated key network regulator genes (KNRs) in the MEGENA network and a ranked list of 1226 up-regulated and 846 down-regulated KNRs in the BN. Last, the intersection of the BN and MEGENA network KNRs yields a subset of 233 up- and 164 down-regulated KNRs across the five subtypes (table S2). The full list of AD subtype molecular signatures, MEGENA and BN KNRs, as well as their intersection and combined P values under the aggregated Cauchy association test, is provided in data file S1.
Figure 3 (A and B) shows the up- and down-regulated key drivers of each subtype in the context of the MEGENA network, while Fig. 3 (C and D) shows the top 20 up- and down-regulated KNRs per subtype in the MEGENA network and the BN. Even the subtypes within each class (e.g., B and C) have subtype-specific drivers. As shown in Fig. 3 (A and B), each subtype’s key drivers fall onto separate parts of the MEGENA network, suggesting that specific gene modules are subtype specific, and subtypes may be driven by a specific, yet diverse set of disease mechanisms that lead to AD. For instance, a large number of neuronal genes located at the center of the global network are down-regulated in the Aβ-predominant AD subtypes (C1 and C2) and are predicted to be pathogenic in AD. These down-regulated neuronal genes are predicted to be regulated by KNRs GABRB2 (BN, P = 7.2 × 10−44), SYT1 (P = 3.6 × 10⁻³⁰), ATP6V1A (P = 1.81 × 10⁻²⁷), and SCN2A (P = 4.07 × 10−116) in both models. On the other hand, the top right of the MEGENA network consists of many oligodendrocytic genes that are down-regulated in the class B subtypes and are predicted to be regulated by PLP1 (BN, P = 1.05 × 10⁻¹⁴), Ermin (ERMN) (P = 1.51 × 10⁻³²), Quaking (QKI) (P = 6.95 × 10⁻³⁰), and Stromal antigen 2 (STAG2) (8.89 × 10⁻²⁷) in both models. Last, the bottom right of the network is enriched for several down-regulated microglial, endothelial, and astrocytic genes that are driven by LRP10 (BN P = 2.15 × 10⁻⁸), TLN1 (P = 3.71 × 10⁻⁸), LAMB2 (P = 2.2 × 10⁻⁸), MYO1C (P = 5.2 × 10⁻³), and NOTCH1 (P = 4.6 × 10⁻¹²). Consistent with the observation that the AD subtypes in the classes A and C show opposite gene expression changes in known AD-associated gene signatures, many up-regulated neuronal KNRs (GABRB2, LRP10, SYT1, and PREPL) in the class A subtype are down-regulated in class C. Therefore, it is likely that both the class A and class C subtypes result from either inhibitory or excitatory dysregulation along a single axis in specific neuronal processes.
Fig. 3. MEGENA and BN-based key drivers of the AD subtypes.
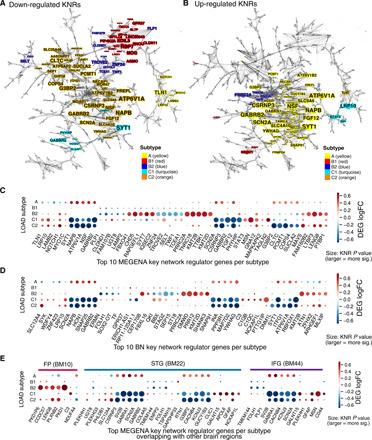
(A and B) Top down- and up-regulated MEGENA key drivers for each subtype plotted in its location in the network. Color of a node represents subtype (ties resolved; described below), while size of a node corresponds to the total number of genes in the two-hop network neighborhood around the gene, which are differentially expressed. Some genes are drivers for more than one subtype, and ties are resolved by coloring the node corresponding to the subtype with the smallest signature so as to preserve faint signals. (C) Heatmap of the top 20 down- and up-regulated MEGENA key drivers for each AD subtype, where size of the node represents KNR natural log P value (larger is more significant). (D) Heatmap of the top 20 down- and up-regulated BN key drivers for each AD subtype. (E) AD subtype key drivers in the MEGENA network supported by gene expression changes in other brain regions, which the region of overlap listed.
Last, we sought to investigate whether these subtype KNRs in the PHG are also key regulators in other brain regions in the MSBB-AD cohort. The same network analysis procedure is applied to the other regions, including the FP, IFG, and STG. As shown in Fig. 3E, many neuronal genes, including the KNRs SCN2A, GABRB2, PLP1, and UGT8, have a consistent direction (up- or down-regulation) in two or more brain regions in the MAPT pathway and Aβ-predominant AD subtypes. Furthermore, some key oligodendrocytic genes such as PLP1 and UGT8 remain as key network regulators for the class B subtypes. Therefore, although the PHG shows the greatest vulnerability, the subtype key regulators have consistent dysregulation in all the regions studied here.
Cell-type specificity of subtype molecular signatures
As previously discussed, to better understand brain cell–type specificity of transcriptomic changes in each AD subtype, we perform cell-type proportion analysis (Materials and Methods) on each sample using the brain cell–type marker signatures determined by cell type–specific sequencing previously conducted by our laboratory (26). Figure 4A shows significant and unique changes in the cell-type composition in the AD subtypes. For instance, class A has a small increase in neurons combined with a decrease of oligodendrocyte precursor cells (OPCs), astrocytes, and endothelial cells. On the other hand, class C has a substantial loss of neurons accompanied by an increase of oligodendrocytes, astrocytes, OPCs, and endothelial cells, opposite of the changes observed in class A. The class B subtypes have mixed changes in other cell types, but both have a small to moderate decrease in oligodendrocytes, consistent with the oligodendrocytic key regulators found through network analysis. These patterns are consistent with the reactive astrocytosis and microgliosis commonly seen in some patients with AD with immune system activation in response to misfolded or polymerized amyloid Aβ (3), which is indicated by the presence of inflammatory markers.
Fig. 4. Cell type–specific changes within each MSBB-AD subtype.
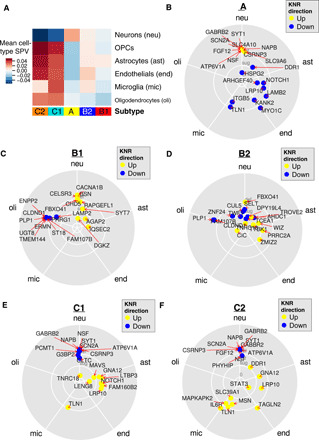
(A) Mean change in cell-type proportion in each AD subtype, computed by averaging SPVs for the samples after cell-type deconvolution by BRETIGEA. (B to F) Vector addition of squared expression levels of AD subtype key regulators (up- and down- regulated) across five different cell types in a brain cell type–specific sequencing experiment (52).
Next, using RNA-seq data derived from cultured brain cells (including neurons, astrocytes, microglia, endothelial cells, and oligodendrocytes), we examine the cell-type specificity of the key regulator genes of each AD subtype (Materials and Methods). As shown in Fig. 4 (B to F), we find that for the class C (“Ab-predominant”) subtypes, KNRs are up-regulated in microglia (TLN1, MSN, and IL6R), endothelial cells (TAGLN2), and astrocytes (LRP10, GNA12, and LTBP3) and down-regulated in neurons (ATP6V1A, SCN2A, GABRB2, and NAPB), consistent with neuroinflammatory destruction. On the other hand, the class A subtype has up-regulated neuronal regulators (GABRB2, SYT1, and SCN2A), indicating increased neuron remodeling and activity, and down-regulated KNRs in astrocytes, endothelial cells, and microglia (LRP10, NOTCH1, MYO1C, and TLN1). Only the class B shows marked down-regulation of genes in oligodendrocytes (PLP1, UGT8, CLDND1, ERMN, and ENPP2) with up-regulation in other cell types, suggesting that a demyelinating process may be relevant in this class.
Enrichment of known AD genetic risk markers with specific subtypes
To identify the influence of genetic determinants on AD subtype, we investigate the differences in polygenic risk score (PRS) between the predicted AD subtypes. We first compute each sample’s PRS against the genome wide association study (GWAS) meta-analysis of Kunkle et al. (33) across AD using the PRSice R package (34). As non-European samples are excluded from the meta-analysis, we exclude non-European individuals in the MSBB-AD during the PRS calculation. As shown in fig. S7, two of the three subtype classes show an increase in PRS burden compared with nondemented controls, with significant differences in class A (median PRS, 0.235; P = 0.048 under Welsh’s t test) and C (PRS, 0.44; P = 0.013) subtypes. While class B shows an increase in PRS, this difference is not significant from nondemented controls (PRS, 0.33; P = 0.117). In addition, we see an increased PRS burden across all AD samples (median PRS, 0.35) compared with nondemented controls (PRS, −0.43; P = 0.016). Despite these significant differences between individual AD subtypes and nondemented controls, there is no significant difference in PRS between the AD subtype classes. Therefore, these analyses demonstrate that genetic factors likely predispose individuals in the MSBB cohort to developing AD across each subtype, but these factors fail to adequately discriminate the molecular subtypes.
To better interrogate the intersection between known AD-associated genetic loci and the AD subtypes, we also intersect the AD risk genes compiled by the International Genomics of Alzheimer’s Project (IGAP) Consortium (6) and the predicted subtype-specific key regulators. Forty-nine key regulators of the MEGENA network across all five MSBB subtypes have genetic loci associated with AD (IGAP gene-level significance, P ≤ 0.01), including AMPH, PICALM, MEF2C, EPDR1, and PSMC6 (table S2). AMPH, MEF2C, and EPDR1 are down-regulated in the class C subtypes and up-regulated in class A. PICALM is down-regulated in subtype B2. PSMC6 is down-regulated in both the class B and C subtypes.
AMPH, otherwise known as amphiphysin 1, is a vesicle cell surface protein important in clathrin-mediated endocytosis and is primarily expressed in neurons. It is an important homolog of BIN1, which is highly expressed in oligodendrocytes as well as immune cell types and has been shown to be correlated with tau levels as well as glial fibrillary acidic protein (GFAP) and myelin basic protein (MBP) expression (35). In neurons, increased AMPH expression is associated with increased tau pathology, while increased BIN1 expression is associated with decreased tau pathology (36). On the other hand, human autoantibodies to AMPH, which are observed in rare diseases (e.g., Stiff person syndrome), have been shown to induce defective presynaptic vesicle dynamics and composition, leading to decreased GABAergic transmission (37). Many GABA pathway genes are also predicted as key regulators in multiple subtypes (GABRB2, GABRA1, and GABRA4). Therefore, either up- or down-regulation of AMPH may lead to synaptic defects, either directly on the synaptic vesicles or through the secondary effects of tau accumulation. This is in line with our understanding of class C in which decreased AMPH may lead to decreased neuronal activity and up-regulated AMPH may increase tau pathway activity. Therefore, the effects of GABAergic signaling on cognitive dysfunction are likely critical to understanding and treating AD subtypes.
Subclassification of MSBB-AD samples with mild cognitive impairment (CDR = 0.5) recapitulates three major AD subtype classes
We have previously shown that AD subtypes are not correlated with dementia severity as measured by CDR score and that molecular signatures of these subtypes are independent from neuron degeneration and reactive gliosis seen in later stages of AD. We then seek to investigate whether participants with a mild cognitive impairment (MCI), without clinically defined AD, exhibit a subtype-specific signature consistent with the identified AD subtypes. On the basis of the clinical data available, we defined MCI for the MSBB-AD cohort as having a CDR score of 0.5, which corresponded to possible or mild dementia (n = 32).
To determine whether MCI samples group together with AD subtypes or whether MCI samples cluster separately on the basis of their molecular signatures, we repeat the WSCNA on the combined AD and MCI samples in the MSBB-AD cohort. As shown in the clustering dendrogram given in figs. S8 and S9, MCI samples are distributed in the branches corresponding with all five AD subtypes, including both Aβ and tau-predominant AD subtypes. We count the number of MCI samples distributed to each branch, labeled by the corresponding AD subtype (table S4). We observe that the distribution of the MCI samples across the subtypes is different than that of the AD samples (one-way ANOVA, P = 4.7 × 10⁻³, F statistic = 14.947, df = 1). The MCI samples are distributed more often to tau-predominant AD subtypes than Aβ-predominant AD subtypes. This could be due to a variety of reasons, including potential resilience to certain AD subtypes among the MCI group. Therefore, MCI samples may also be subclassified into different subtypes, providing additional insights into the molecular features of the disease.
Validation of MSBB-AD subtypes in ROSMAP shows conserved AD subtype molecular signatures
To verify the generalizability of AD subtypes identified in the MSBB-AD cohort, we perform the WSCNA-based subtyping analysis on the gene expression data from the dorsolateral prefrontal cortex (DLPFC) in the ROSMAP cohort (n = 610, with 391 AD cases). The ROSMAP cohort is an independent study of a different brain region with more MCI (n = 64) and severe AD participants. The postmortem brains in the ROSMAP cohort were collected from individuals residing around multiple geographically distant sites across the United States, and participants enrolled in the study were evaluated multiple times over many years before death for cognitive impairment that was suggestive of AD (38). Cognitive impairment was measured by the mini-mental status exam (MMSE) at multiple time points, and pathologic factors such as Aβ and tau NFT burden were measured postmortem. In addition, the study includes three predominantly African-American and Hispanic communities in multiple locations (38). Therefore, reidentification of similar molecular subtypes of AD in the ROSMAP cohort should allow for greater generalization of the findings from the MSBB-AD alone.
Similar to the normalization process performed on the MSBB RNA-seq data, the ROSMAP gene expression data are corrected for batch effect, PMI, gender, RIN, and outliers, as well as dementia severity using MMSE scores to remove any potential effect of increasing neuronal loss with AD staging on the ROSMAP subtypes. Previous studies have shown a strong correspondence between CDR scores and MMSE (39), and therefore, MMSE would serve as a similar measure of dementia severity. As shown in fig. S10 (A and B), we measure the cell-type proportion of ROSMAP samples with increasing dementia severity before and after MMSE normalization. We demonstrate that—like in MSBB-AD—neuronal loss inferred from bulk transcriptomic data in ROSMAP is correlated with decreasing cognition (MMSE), and normalization using MMSE score can eliminate this observed bias and allows for stage-free subtyping. Furthermore, we show that cell-type proportion normalization is not sufficient to completely eliminate the bias from dementia severity, as a non-zero residual correlation still persists between MMSE and various cell types, and therefore, we choose MMSE normalization to correct for this.
As shown in Fig. 5A, we identify five subtypes from AD participants in this cohort, similar to those in the MSBB-AD cohort. Expression profiles from this cohort and from the subtypes in the PHG of the MSBB-AD cohort are significantly correlated (Fig. 5, B and C). First, by inspection of the up- and down-regulated gene modules alone, we observe two subtypes (blue and turquoise) with decreased synaptic signaling and increased immune response, one subtype (green) with increased synaptic signaling and protein modification activity, and two subtypes (yellow and red) that do not show changes in either pathway. Next, to quantify the similarity between the two sets of AD subtypes in the two independent cohorts, we perform correlation analysis of the mean gene expression profiles of these subtypes, followed by hierarchical clustering analysis. As shown in Fig. 5C, most subtypes in the ROSMAP cohort well match certain subtypes from the PHG in the MSBB-AD cohort, except the yellow subtype in the ROSMAP (Pearson correlation coefficients between 0.6 and 0.8). The clustering analysis further demonstrates that three major AD subtype classes (tau-predominant classes A and B, and Aβ-predominant class C) are highly conserved across both cohorts with different brain regions.
Fig. 5. Identification of the AD subtypes in the ROSMAP cohort.
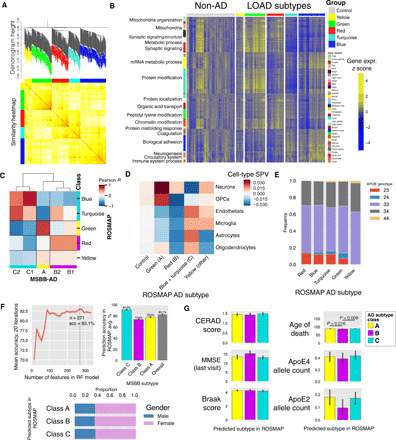
(A) WSCNA Clustering dendrogram and TOM similarity heatmap of the AD samples in the ROSMAP cohort. (B) Heatmap of gene expression across all the ROSMAP AD and control samples. Genes are organized by the WINA gene modules identified in the gene expression data of the PHG in the MSBB cohort. (C) Correlations between the MSBB and ROSMAP subtypes. First, mean gene expression across each AD subtype is computed for each gene, resulting in a 10 by 13,982 matrix of expression levels for all the 10 subtypes in the two cohorts (lowly expressed genes are excluded). Pearson correlation is then computed between each pair of subtypes, resulting in a 10 by 10 correlation matrix. (D) Cell-type SPV mean by ROSMAP AD subtype class, inferred as in (A) and (B), for MMSE-normalized data. (E) APOE genotype proportion by ROSMAP subtype. (F) Mean prediction accuracy of prediction of the ROSMAP subtypes by a classifier trained from the subtypes and the data from the RNA-seq data from the PHG in the MSBB cohort. RF classifiers are trained on the basis of different numbers of key regulators of the AD subtype classes identified in the MSBB cohort. The subtypes for each AD case in the ROSMAP cohort are independently determined as described in fig. S7 and are thus used as ground truth for evaluating the prediction by the predictors trained by the MSBB-AD data. (G) Bar plots of the association of clinical and pathologic phenotypes with the predicted subtypes of each ROSMAP sample.
We then seek to determine whether the participants in the ROSMAP cohort are distributed in the AD subtypes at the same relative proportion as those in the MSBB-AD cohort. The distributions are roughly proportional to each other, with fewer samples in the C2 subtype than C1, with most samples either falling into class A or B (table S5). Excluding samples that do not match any subtype across both datasets, we perform a one-way ANOVA test across both MSBB-AD and ROSMAP and find no significant difference in the distribution of samples. P = 0.089, F statistic = 5.01.
As shown in Fig. 5D, the ROSMAP subtypes also exhibit predicted cell-type proportion changes in the frontal cortex. For example, the blue and turquoise subtypes (class C–like) show decreases in neuronal SPVs and increases in microglia and endothelial cell SPVs. On the other hand, the green subtype (class A–like) shows strong increases in neuronal and OPC SPVs, along with decreases in other cell types. Last, the red subtype (class B–like) shows strong decreases in OPC SPV only. Therefore, AD subtypes show strong, characteristic susceptibility to cell-type proportion changes that are consistent across subtypes identified in the two independent cohorts.
Similar to the MSBB subtypes, the ROSMAP subtypes are not associated with clinical and pathological traits, including biological sex, cognitive scores, age, Consortium to Establish a Registry for Alzheimer’s Disease (CERAD) pathologic scores, MMSE, and Braak staging, suggesting that these subtypes are truly molecular subtypes with distinct expression patterns. As shown in Fig. 5E, APOE e2 allele dosage significantly decreases in the yellow (“other AD”) subtype compared to all other subtypes (Welsh’s t test, P < 0.025), which did not contain any APOE e2 individuals. On the other hand, APOE e4 allele dosage is not significantly associated with ROSMAP AD subtypes.
In addition, PRSs for ROSMAP subtypes and nondemented controls are also computed using the GWAS meta-analysis of Kunkle et al. (33) using the same methodology as for MSBB-AD, as shown in fig. S10C. Similarly to the MSBB-AD cohort, each of the ROSMAP classes A (median, 0.339, P = 5.1 × 10⁻⁴ under Welsh’s t test), B (median, 0.084, P = 0.032), and C (median, 0.191, P = 1 × 10⁻⁵) have an increased PRS compared to nondemented controls (median, −0.239); however, there are no significant PRS differences between subtypes.
Prediction of AD subtypes across different cohorts
We then develop a high-performance classifier to predict the MSBB-AD PHG-based subtype classes (A, B, and C) of the participants in the ROSMAP AD cohort. A random forest (RF) model is trained using all the AD samples in the MSBB PHG dataset and a range of 5 to 350 subtype key regulators as features until maximum accuracy is achieved. Additional details about the training and classification processes are given in Materials and Methods.
As shown in Fig. 5F, the performance of the RF model on the ROSMAP data peaks in accuracy with 271 features. This top-performing RF model was then selected for further validation and characterization. A list of molecular features used in the model, as well as top-performing features by class, is given in data file S2 and fig. S11. Using the ROSMAP-derived subtype categories as the ground truth, our classifier model reaches an accuracy of 83.1% (SD, 1.0%), with class C (Aβ predominant) AD subtype prediction peaking at 91.3% (SD, 1.0), suggesting that the identified subtypes are highly reproducible and predictable. Similar to the ROSMAP subtypes, the subtypes predicted by the classifier do not show a significant difference in cognition, CERAD score, MMSE, Braak score, APOE, or biological sex (Fig. 5G). There is a small but significant association with age of death under the KW test, but this was no longer significant after multiple testing correction (P = 0.036, adjusted P = 0.252), which is likely due to differences in age between the atypical and intermediate subtypes (Welsh’s t test, P = 0.0048). The difference in mean age between the groups is 1.6 years (87.6 years versus 86.0 years for atypical and intermediate, respectively), which is relatively small and likely does not reflect marked differences in AD stages. In addition, there is no significant difference in age under the Welsh’s t test between the predicted Aβ- and tau-predominant subtypes even without multiple test correction.
Correspondence between human AD subtypes and AD mouse models
In the past two decades, several different mouse models of AD have been developed to characterize AD pathology, biology, and behavioral changes. Many of these mouse models perturb various AD-related proteins or regulatory genes such as Aβ, APP, MAPT, PSEN1, TYROBP, and HDAC1. Given the substantial differences in molecular signatures among the AD subtypes, we explore whether these AD subtypes’ transcriptomic signatures match the existing mouse model signatures.
We collect aligned RNA-seq data from 19 mouse model studies of AD that are publicly available at the Accelerating Medicines Partnership–Alzheimer’s Disease (AMP-AD) portal on Synapse.org and Gene Expression Omnibus, as listed in data file S3. Transcriptomic signatures for each mouse model are also identified. Many of these models may harbor multiple amyloid precursor protein (APP) variants and tau protein variants. The Swedish mice (APPK670N/M671NL) develop Aβ plaques near neurons. The Dutch (APPE693Q) mice accumulate soluble Aβ in perivascular cells at the blood-brain barrier. The 5XFAD mice recapitulate APP variants seen in familial forms of AD but do not have related tau NFT seen in AD. Tau protein variant TauP301L (“D35”) and TauP301S (“PS19”) mice develop hyperphosphorylated tau, as well as presenilin 1 (PSEN1) Δexon9 and M146V variants. We also examine APOE variant mice and mouse models with mutant HDAC1, TYROBP, TREM2, BIN1, CD2AP, CLU, and GFAP alleles.
As shown in Fig. 6A, the class C subtypes (Aβ predominant) match to the 5XFAD (familial), APP Dutch (inflammatory), and APP Swedish (amyloid) mice, consistent with an amyloid-driven disease with increased immune and circulatory system activity, as well as previous findings that the class C subtypes may be driven by inflammatory processes (shown in Fig. 1E). Inflammation at the blood-brain barrier has been noted in AD and other age-related neurodegenerative diseases such as vascular dementia. On the other hand, the tau-predominant class A subtype has a gene signature opposite to those of 5XFAD and APP mouse models but consistent with that of the TauP301L model, in line with gene expression changes in known tau pathways. The remaining two class B subtypes (B1 and B2) show the strongest match with the CLU (apoJ-) mutant model and a good match with the CD2AP and BIN1 mutant models. Clusterin, a secreted neuroprotective glycoprotein secreted primarily by astrocytes, has been shown to be increased in AD in response to tau-mediated neurodegeneration. Clusterin mutant mice have been shown to have less Aβ damage and neuritic dystrophy when bred with 5XFAD model mice versus controls (40). Therefore, the class B subtypes match the mouse models that carry tau-related neurodegenerative factors over amyloid-related factors.
Fig. 6. Matching existing AD mouse models to the MSBB-AD subtypes.
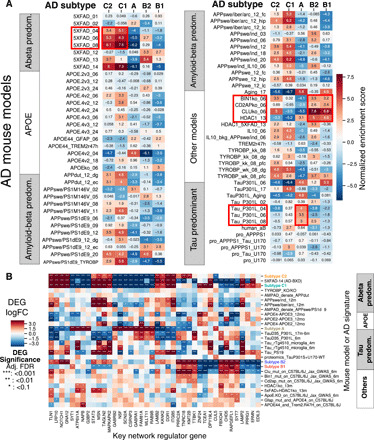
(A) GSEA enrichment of differential expression signatures of the identified AD subtypes (up- and down-regulated) for the gene signatures of the AD mouse models. Positive scores indicate strong consistency. (B) Gene expression of the top subtype key regulators across the mouse models, with significant DEGs shown.
We further examine the expression changes of the subtype-specific key regulators in the 5XFAD, TauP301L, and CLU mutant mouse models that match the three subtype classes. Figure 6B shows the gene expression levels of the top four key regulators from each of the five MSBB-AD subtypes in each mouse model. As expected, the gene expression differences between the AD subtypes across human participants are recapitulated in specific mouse models. Many KNRs of the Aβ- and tau-predominant subtypes have consistent expression changes in the respective human brain samples and the matched mouse models.
DISCUSSION
In this study, we systematically identify five molecular subtypes of AD in three major classes and subsequently characterize them with molecular signatures, network regulator genes, and matched mouse models. Through a novel clustering method, the AD subtypes are identified and cross-validated using independent postmortem brain RNA data. The hippocampal area demonstrates the greatest subtyping signal over the other regions, despite the fact that subtype effects are detectable across all brain regions studied here. These subtypes are independent of age and disease severity. These AD subtypes are well conserved across different independent cohorts. A small number of predicted key regulators can be used to predict clinical features such as cognitive function or dementia. Each subtype has a unique set of key regulator genes, and many predicted subtype key regulators are also known as AD genetic risk genes. Last, we show that each existing mouse model of AD may match to a particular subset of human AD subtypes but not all subtypes simultaneously. This may partially explain how many existing clinical trials that showed promising efficacy in one particular mouse model later do not align with human trial results, assuming that study participants had consisted of a heterogeneous group of participants across many AD subtypes.
The molecular subtypes of AD cannot be fully explained by differences in postmortem pathologic variables such as Aβ and tau accumulation or by differences in APOE risk allele genotype between participants. These findings are consistent with previous studies that have shown that cognitive impairment is neither dependent on nor fully assured by high levels of Aβ and tau accumulation (4, 5). It is more likely that Aβ and tau accumulation are often mediators or the end effects of neurodegeneration and inflammation, independent of hippocampal load. This is also consistent with recent meta-analyses of AD that have shown that the effects of APOE genotype on AD risk are significantly diminished in older individuals (>75 years, LOAD) (41).
The predicted subtypes and their molecular signatures as well as key regulators along with matched mouse models pave the way for developing novel therapeutics for AD toward precision medicine. The specific mouse models identified in this study that most closely match each of the AD subtypes may serve an important role in the validation of subtype key regulator genes and hit compounds. Additional work toward validating and better understanding the role of each subtype key regulator in its matching mouse model will provide great value and have a great impact on future studies of AD.
We observed many cell type–specific signatures and key regulator genes for each AD subtype, which are persistent even after the effects of dementia severity on neuronal loss and reactive gliosis are removed, suggesting that subpopulations of neuronal or glial cell types may contribute distinctively to different AD subtypes. Therefore, single-cell transcriptomic analysis of control and AD human brains will gain more insights into these cell types and the underlying molecular mechanisms, leading to the heterogeneity in AD. This will be a future direction of the research on AD subtype analysis.
Only about one-third of the AD cases carry consistent hallmarks (e.g., increased immune response and decreased synaptic signaling) of a “typical” AD presentation (class C), while the rest show opposite molecular gene regulation and other complex changes across multiple pathways and cell types (classes A and B). One potential avenue for research on the modulation of the hallmark signature across the subtypes is to look at the interaction between Aβ folding, tau, mitochondria, and lysosomal acidification, which are all dysregulated across the subtypes. Recent work has shown that certain Aβ oligomers may, depending on the presence of tau, block mitochondrial activity through lysosomal mTORC1 protein kinase activity but potentially stimulate mitochondrial activity in the absence of tau (42).
The bidirectional nature of certain key regulator genes (e.g., GABRB2 and ATP6V1A) across the identified AD subtypes is notable but not unsupported by previous research. Recent work in AD mouse models has shown that the effects of α-synuclein on Alzheimer’s pathology and clinical phenotypes are important when the gene is up- and down-regulated. For instance, while reduced α-synuclein increases Aβ deposition in APP mutant mice, increased α-synuclein was shown in the same experiment to decrease spatial memory formation, increase neuronal cell cycle dysfunction, and increase specific tau conformational markers (43).
Among all the clinical, pathological, and genetic factors tested, APOE genotype is highly associated with some of the AD subtypes. Besides APOE, additional genetic risk factors for AD, such as those identified by linkage analysis and GWAS in the IGAP study, hint at a plurality of mechanisms through which AD is developed (6, 44, 45). Furthermore, one study shows that some patients with MCI or depression before AD have a more gradual progression to the disease and that they have pathologic Aβ and tau cerebrospinal fluid (CSF) level changes that are not affected by APOE allele status, while the other forms of AD show a strong APOE association (46).
We demonstrate that participants with only MCI could be classified into all three subtype classes, suggesting that certain patients may be selectively vulnerable for a certain disease-causing molecular process over others. One caveat of our analyses is that participants in both the MCI and AD groups are similarly aged; therefore, participants with MCI in the MSBB-AD likely demonstrate resilience to AD as a group and, as a result, may be in an earlier stage of the disease. While MCI participants are more often classified into tau-predominant subtypes than AD participants, it is unlikely that this is due to participant age in the MSBB-AD. Future work will investigate the progression of MCI to AD subtype via a prospective study to establish whether participants maintain a particular subtype designation from one stage of dementia to the next over a range of ages and clinical course of disease progression.
Drug repositioning, a process of matching known drug transcriptomic signatures to a disease signature in silico to identify hit candidates that produce the desired change in expression, may be useful in identifying compounds that change the level of top key regulator genes among certain AD subtypes that can be validated in their matched AD animal model system. For instance, a particular candidate compound identified using molecular signature data alone using an in silico drug repositioning algorithm (47) was able to increase the expression level of ATP6V1A and restore long-term potentiation and memory formation in both cultured neurons and AD mouse models (19). Therefore, AD subtype–specific signatures identified in the MSBB-AD cohort will play an important role not only in identifying new candidate drugs for treating AD but also in stratifying the patient population for suitable AD treatments.
To develop personalized treatments for AD, each patient should be classified by subtype. As we have shown, AD subtypes have very different transcriptomic signatures and therefore will likely require specialized treatments. Given that many subtype-specific key regulators have opposite directions in some AD subtypes, it is also possible that drugs that reduce AD symptoms in one subtype may exacerbate symptoms in another subtype. Furthermore, we construct a machine learning model for predicting AD subtypes that is effective and robust. However, since the prediction is based on brain transcriptomic data that are not available from vast majority of patients, unnecessary biomarkers for AD subtypes either from peripheral tissues (e.g., CSF and blood) or noninvasive brain imaging are highly desirable.
MATERIALS AND METHODS
AD cohorts
In this study, we used two AD cohorts of RNA-seq data: the MSBB-AD (21) study and the ROSMAP (22, 23). The MSBB-AD cohort includes RNA expression data in the following four different brain regions: FP (Brodmann area 10; n = 265 with 187 AD cases), STG (Brodmann area 22; n = 240 with 174 AD cases), PHG (Brodmann area 36; n = 215 with 151 AD cases), and the IFG (Brodmann area 44; n = 222 with 157 AD cases). Clinical phenotypes for each participant are also collected including age, race, sex, hypoxia-induced encephalopathy score, cognitive function scores, CDR, age of onset and death, and pathologic findings of tau and Aβ on biopsy. This cohort was specifically selected to include cases with either no neuropathology or only neuropathological lesions diagnostic of AD. Cases with mixed neuropathology, e.g., AD and cerebrovascular disease and AD with Lewy bodies, were specifically excluded from the study cohort. Controls were defined as those presenting with no cognitive impairment (i.e., CDR = 0) and no overt neuritic plaque or NFT involvement.
The ROSMAP (22, 23) includes whole-transcriptome RNA-seq data of the DLPFC from 615 participants including those with AD (n = 391), MCI (n = 64) and nondemented controls (n = 160) determined by a CERAD pathology score of definite AD or probable AD. Clinical and pathologic phenotypes, as well as demographic information, were also collected as well for each sample including MMSE scores (at time of diagnosis and last known), CERAD score, Braak score, cognitive score, APOE genotype, age of death, age at diagnosis, PMI, gender, race, education level, and if the participant was Spanish-speaking.
Clustering algorithm evaluation and cluster stability determination
We present a method to determine the empirical likelihood that a particular clustering is robust and apply it to each considered clustering algorithm and transcriptomic brain region. If true molecular subtypes exist and are reflected in the transcriptomic data from a certain brain region, then a robust clustering algorithm should produce the same set of clustered samples on repeated reclustering, even if fewer samples or molecular features are used to create the clustering. However, if no molecular signature is reflected in the transcriptomic data, or the clustering algorithm is not robust, then different sets of clustered samples may be produced upon repeated reclustering. On the MSBB-AD cohort data, we performed 50 rounds of bootstrapped reclustering using each of the four clustering algorithms, withholding 20% of the samples and genes per round. We calculate the rate at which pairs of samples shared the same cluster across all 50 bootstrapping rounds (e.g., a pair of samples clustered together in 35 of 50 bootstrapped clustering rounds would have a rate of 70%), defined here as the pairwise sample reclustering rate. We then calculate the average pairwise sample reclustering rate for all pairs of samples within the sample clusters identified by each algorithm, as well as the average rate of same-sized clusters drawn from a distribution of 100,000 random pairs of samples. We term these average rates the cluster stability rate and the null cluster stability rate, respectively. We then calculate the empirical likelihood that the cluster stability rate and the null cluster stability rate are the same, under the binomial distribution. Using this method, a specific subtype grouping is considered a putative subtype if its empirically adjusted P value is less than 0.05.
RNA-seq data normalization
MSBB-AD RNA-seq data were processed with the Spliced Transcripts Alignment to a Reference (STAR) aligner and normalized using mixed-model correction for batch effect, RIN, ribosomal RNA rate, exonic RNA rate, PMI, age of death, inferred race, and inferred sex. Label swaps were inferred and corrected or removed if resolution was not possible.
To remove the disease stage effect, CDR is corrected in the MSBB-AD gene expression data through linear model normalization. This was verified by performing a second round of linear model fitting between CDR and gene expression, which showed that no significant DEGs remained between participants with different CDR scores across all brain regions in the MSBB-AD.
ROSMAP DLPFC RNA-seq data were also normalized for age of death, gender, batch, RIN, and PMI using mixed-model correction. Data were then subsequently normalized for last known MMSE score using a linear model, and no genes are shown subsequently to have a correlation with MMSE (R2 = 0).
Differential gene expression analysis of AD subtypes
As described here, we performed differential gene expression (DEG) analysis to determine the molecular signatures of each of the AD subtypes compared with nondemented (CDR = 0) controls, starting with the RNA-seq counts per million (CPM) data as input. The analysis was carried out separately for each comparison. Log-scaled (base 2) gene CPMs from samples in the comparison were first fit to a linear model using the lmfit() provided by the limma R package before contrasts were fit. Empirical Bayes statistics for differential expression were then calculated using the eBayes() R function, followed by the topTable() R function to output significant DEGs. P values were adjusted by q values provided by the qvalue Bioconductor package, using default parameters.
Clustering algorithms used in the establishment of putative AD subtypes
WSCNA identifies sample clusters by analyzing gene expression level correlations between pairs of samples to build a sample correlation network, which is then used to calculate topological overlap [topological overlap matrix (TOM)] score that can be used to cluster similar samples together via k-means clustering. WSCNA extends the WINA algorithm (48) to samples by transposing the input matrix so that sample-sample correlations are compared. Note that gene expression data are standardized to z scores so that expression differences do not inflate the correlation metric.
Network-based KNR analysis of molecular subtype signatures
We applied the key driver analysis (KDA) (49) to the multiscale embedded gene expression network analysis (MEGENA) network generated from PHG data in the MSBB. KDA first generates a subnetwork NG, defined as the set of nodes in N that are no more than h layers away from the nodes in G, and then searches the h-layer neighborhood (h = 1,…, H) for each gene in NG (HLNg,h) for the optimal h*, such that
where ESh,g is the computed enrichment statistic for HLNg,h. This results in a list of predicted key network regulatory hub genes that may alter the expression pattern of its surrounding nodes and result in the DEG pattern observed.
Machine learning subtype classifier across other cohorts
We developed an RF model to classify samples into each AD subtype using the MSBB-AD PHG brain region data for training and then validated this model on the ROSMAP data. All RF models were built using the scipy Python library, with initial parameters of 300 decision trees and a maximum tree depth of 8. Before model creation, both datasets are first corrected for cohort effect between MSBB-AD and ROSMAP, using the ComBat program, to reduce technical differences between studies. We divide classifier creation into three steps: feature selection, model training, and model validation. For the feature selection step, we first selected different numbers of top KNRs as features from each subtype (n = 1 to 80 features per subtype; total, 5 to 400 features). We then train multiple RF models to predict subtype classification within the MSBB-AD (PHG) cohort and evaluate the model accuracy using leave-one-out cross-validation between the predicted and observed subtypes. In the model training step, an RF model is created on all AD participants’ PHG samples in MSBB-AD using only the top-performing features identified in the previous step. Last, for the model validation step, the RF model created from the MSBB-AD data is applied to the ROSMAP data, and model accuracy is evaluated by comparing the predicted ROSMAP subtypes from the RF model and the observed ROSMAP subtypes from network-based clustering analysis. We increase the number of features used in the RF model until maximum validation accuracy is achieved, and the top-performing set of features from this model is retained.
BN construction
A BN was constructed by integrating genome-wide gene expression, SNP genotype, and known transcription factor (TF)–target relationships in the PHG in the MSBB-AD cohort, similar to our previous work (27). Briefly, we first computed expression quantitative trait loci (eQTLs) and then used a formal statistical causal inference test (50) to infer the causal probability between gene pairs associated with the same eQTL. The causal relationships inferred are used, together with TF-target relationships from the Encyclopedia of DNA Elements (ENCODE) project, as structural priors for building a causal gene regulatory network from the gene expression data through a Markov chain Monte Carlo (MCMC) simulation–based procedure (51). We followed a network averaging strategy in which 1000 networks are generated from the MCMC procedure starting with different random structure, and links that shared by more than 30% of the networks are used to define a final consensus network structure. To ensure the consensus network is a directed acyclic graph, an iterative deloop procedure was conducted, removing the most weakly supported link of all links involved in any loop. Following Zhang et al. (27), we performed KDA (49) on the consensus Bayesian network to identify key network regulatory genes that can potentially regulate a large number of downstream nodes.
Cell-type proportion analysis and cell-type normalization
To estimate the cell-type proportion of bulk tissue RNA-seq data used in this study, we perform a cell-type deconvolution on each sample using the brain cell–type marker signatures provided by the BRETIGEA R package (26). One thousand marker genes per cell type were used from the human brain cell marker gene set (neurons, endothelials, oligodendrocytes, microglia, astrocytes, and OPCs) to generate all surrogate cell-type proportion (SPV) estimates, except for OPCs, which only had 500 marker genes available. Normalization of the bulk RNA-seq by brain cell type was also performed by BRETIGEA, using the default parameters and the calculated SPV values from the previous step.
Cell-type specificity plots
To generate cell-type specificity plots, using the mean cell-type gene expression levels from Zhang et al. (52), we plotted each squared expression value as a vector from the center on a polar coordinate system. We then calculated the vector sum from each of the expression levels and multiply the final result by a scaling parameter to create a final point as the estimate of the cell-type specificity of any gene under consideration.
Supplementary Material
Acknowledgments
We thank M. Peters for assisting with the preparation of documents and files for upload and sharing via the AD Knowledge Portal. Funding: Data collection was supported through funding by National Institute on Aging (NIA) (grants U01AG046170, RF1AG054014, RF1AG057440, R01AG057907, U01AG052411, R01AG062355, U01AG058635, R01AG068030, P30AG10161, R01AG15819, R01AG17917, R01AG30146, R01AG36836, U01AG32984, U01AG46152, U01AG52411, K01AG062683, and U01AG058635), the Illinois Department of Public Health, and the Translational Genomics Research Institute. Ethics statement: All IRB guidelines were followed with human or animal subjects’ data when applicable. Author contributions: B.Z. perceived the concept and designed the study. R.A.N. performed the research. M.W., S.V., L.G., C.M., Q.W., E.W., E.H.-M., and W.-m.S. curated data and provided software tools. A.L., E.L.C., J.TCW., L.H., A.G., V.F., S.N., S.G., M.E.E., P.K., E.S., D.C., K.J.B., and V.H. participated in the discussion of the results. R.A.N. and B.Z. wrote the paper. All the authors reviewed and revised the paper. Competing interests: The authors declare that they have no competing interests. Data and materials availability: The human postmortem sequencing data are available via the AD Knowledge Portal (https://adknowledgeportal.synapse.org). The AD Knowledge Portal is a platform for accessing data, analyses, and tools generated by the Accelerating Medicines Partnership Alzheimer’s Disease (AMP-AD) Target Discovery Program and other NIA-supported programs to enable open-science practices and accelerate translational learning. The data, analyses, and tools are shared early in the research cycle without a publication embargo on secondary use. Data are available for general research use according to the following requirements for data access and data attribution (https://adknowledgeportal.synapse.org/DataAccess/Instructions). For access to content described in this manuscript see: https://doi.org/10.7303/syn23521805. In addition, all data needed to evaluate the conclusions presented in the paper and the Supplementary Materials are available from the authors upon request.
SUPPLEMENTARY MATERIALS
Supplementary material for this article is available at http://advances.sciencemag.org/cgi/content/full/7/2/eabb5398/DC1
REFERENCES AND NOTES
- 1.Alzheimer’s Association, 2019 Alzheimer’s Disease Facts and Figures (2019); https://alz.org/media/Documents/alzheimers-facts-and-figures-2019-r.pdf.
- 2.Fiandaca M. S., Mapstone M. E., Cheema A. K., Federoff H. J., The critical need for defining preclinical biomarkers in Alzheimer’s disease. Alzheimers Dement. 10, S196–S212 (2014). [DOI] [PubMed] [Google Scholar]
- 3.De Strooper B., Karran E., The cellular phase of Alzheimer’s disease. Cell 164, 603–615 (2016). [DOI] [PubMed] [Google Scholar]
- 4.Sekiya M., Wang M., Fujisaki N., Sakakibara Y., Quan X., Ehrlich M. E., De Jager P. L., Bennett D. A., Schadt E. E., Gandy S., Ando K., Zhang B., Iijima K. M., Integrated biology approach reveals molecular and pathological interactions among Alzheimer’s Aβ42, Tau, TREM2, and TYROBP in Drosophila models. Genome Med. 10, 26 (2018). [DOI] [PMC free article] [PubMed] [Google Scholar]
- 5.Iacono D., Resnick S. M., O’Brien R., Zonderman A. B., An Y., Pletnikova O., Rudow G., Crain B., Troncoso J. C., Mild cognitive impairment and asymptomatic alzheimer disease subjects: Equivalent β-amyloid and tau loads with divergent cognitive outcomes. J. Neuropathol. Exp. Neurol. 73, 295–304 (2014). [DOI] [PMC free article] [PubMed] [Google Scholar]
- 6.Lambert J. C., Ibrahim-Verbaas C. A., Harold D., Naj A. C., Sims R., Bellenguez C., Jun G., DeStefano A. L., Bis J. C., Beecham G. W., Grenier-Boley B., Russo G., Thornton-Wells T. A., Jones N., Smith A. V., Chouraki V., Thomas C., Ikram M. A., Zelenika D., Vardarajan B. N., Kamatani Y., Lin C. F., Gerrish A., Schmidt H., Kunkle B., Fiévet N., Amouyel P., Pasquier F., Deramecourt V., De Bruijn R. F. A. G., Amin N., Hofman A., Van Duijn C. M., Dunstan M. L., Hollingworth P., Owen M. J., O’Donovan M. C., Jones L., Holmans P. A., Moskvina V., Williams J., Baldwin C., Farrer L. A., Choi S. H., Lunetta K. L., Fitzpatrick A. L., Harris T. B., Psaty B. M., Gilbert J. R., Hamilton-Nelson K. L., Martin E. R., Pericak-Vance M. A., Haines J. L., Gudnason V., Jonsson P. V., Eiriksdottir G., Bihoreau M. T., Lathrop M., Valladares O., Cantwell L. B., Wang L. S., Schellenberg G. D., Ruiz A., Boada M., Reitz C., Mayeux R., Ramirez A., Maier W., Hanon O., Kukull W. A., Buxbaum J. D., Campion D., Wallon D., Hannequin D., Crane P. K., Larson E. B., Becker T., Cruchaga C., Goate A. M., Craig D., Johnston J. A., Mc-Guinness B., Todd S., Passmore P., Berr C., Ritchie K., Lopez O. L., De Jager P. L., Evans D., Lovestone S., Proitsi P., Powell J. F., Letenneur L., Barberger-Gateau P., Dufouil C., Dartigues J. F., Morón F. J., Rubinsztein D. C., St. George-Hyslop P., Sleegers K., Bettens K., Van Broeckhoven C., Huentelman M. J., Gill M., Brown K., Morgan K., Kamboh M. I., Keller L., Fratiglioni L., Green R., Myers A. J., Love S., Rogaeva E., Gallacher J., Bayer A., Clarimon J., Lleo A., Tsuang D. W., Yu L., Bennett D. A., Tsolaki M., Bossù P., Spalletta G., Collinge J., Mead S., Sorbi S., Nacmias B., Sanchez-Garcia F., Naranjo M. C. D., Fox N. C., Hardy J., Bosco P., Clarke R., Brayne C., Galimberti D., Mancuso M., Matthews F., Moebus S., Mecocci P., Del Zompo M., Hampel H., Pilotto A., Bullido M., Panza F., Caffarra P., Mayhaus M., Pichler S., Gu W., Riemenschneider M., Lannfelt L., Ingelsson M., Hakonarson H., Carrasquillo M. M., Zou F., Younkin S. G., Beekly D., Alvarez V., Coto E., Razquin C., Pastor P., Mateo I., Combarros O., Faber K. M., Foroud T. M., Soininen H., Hiltunen M., Blacker D., Mosley T. H., Graff C., Holmes C., Montine T. J., Rotter J. I., Brice A., Nalls M. A., Kauwe J. S. K., Boerwinkle E., Schmidt R., Rujescu D., Tzourio C., Nöthen M. M., Launer L. J., Seshadri S., Meta-analysis of 74,046 individuals identifies 11 new susceptibility loci for Alzheimer’s disease. Nat. Genet. 45, 1452–1458 (2013). [DOI] [PMC free article] [PubMed] [Google Scholar]
- 7.Risacher S. L., Anderson W. H., Charil A., Castelluccio P. F., Shcherbinin S., Saykin A. J., Schwarz A. J.; Alzheimer’s Disease Neuroimaging Initiative , Alzheimer disease brain atrophy subtypes are associated with cognition and rate of decline. Neurology 89, 2176–2186 (2017). [DOI] [PMC free article] [PubMed] [Google Scholar]
- 8.Bredesen D. E., Metabolic profiling distinguishes three subtypes of Alzheimer’s disease. Aging 7, 595–600 (2015). [DOI] [PMC free article] [PubMed] [Google Scholar]
- 9.Phillips J. S., Da Re F., Dratch L., Xie S. X., Irwin D. J., McMillan C. T., Vaishnavi S. N., Ferrarese C., Lee E. B., Shaw L. M., Trojanowski J. Q., Wolk D. A., Grossman M., Neocortical origin and progression of gray matter atrophy in nonamnestic Alzheimer’s disease. Neurobiol. Aging 63, 75–87 (2018). [DOI] [PMC free article] [PubMed] [Google Scholar]
- 10.Qian W., Fischer C. E., Schweizer T. A., Munoz D. G., Association between psychosis phenotype and APOE genotype on the clinical profiles of Alzheimer’s disease. Curr. Alzheimer Res. 15, 187–194 (2018). [DOI] [PMC free article] [PubMed] [Google Scholar]
- 11.Lee Y.-M., Chung Y.-I., Park J.-M., Lee B.-D., Moon E., Jeong H.-J., Kim J.-H., Kim H.-J., Mun C.-W., Kim T.-H., Kim Y.-H., Kim E.-J., Decreased gray matter volume is associated with the subtypes of psychotic symptoms in patients with antipsychotic-naïve mild or moderate Alzheimer’s disease: A voxel-based morphometry study. Psychiatry Res. Neuroimaging 249, 45–51 (2016). [DOI] [PubMed] [Google Scholar]
- 12.Rapp M. A., Schnaider-Beeri M., Purohit D. P., Perl D. P., Haroutunian V., Sano M., Increased neurofibrillary tangles in patients with Alzheimer disease with comorbid depression. Am. J. Geriatr. Psychiatry 16, 168–174 (2008). [DOI] [PubMed] [Google Scholar]
- 13.Huang Y., Mucke L., Alzheimer mechanisms and therapeutic strategies. Cell 148, 1204–1222 (2012). [DOI] [PMC free article] [PubMed] [Google Scholar]
- 14.Crary J. F., Trojanowski J. Q., Schneider J. A., Abisambra J. F., Abner E. L., Alafuzoff I., Arnold S. E., Attems J., Beach T. G., Bigio E. H., Cairns N. J., Dickson D. W., Gearing M., Grinberg L. T., Hof P. R., Hyman B. T., Jellinger K., Jicha G. A., Kovacs G. G., Knopman D. S., Kofler J., Kukull W. A., Mackenzie I. R., Masliah E., McKee A., Montine T. J., Murray M. E., Neltner J. H., Santa-Maria I., Seeley W. W., Serrano-Pozo A., Shelanski M. L., Stein T., Takao M., Thal D. R., Toledo J. B., Troncoso J. C., Vonsattel J. P., White C. L. III, Wisniewski T., Woltjer R. L., Yamada M., Nelson P. T., Primary age-related tauopathy (PART): A common pathology associated with human aging. Acta Neuropathol. 128, 755–766 (2014). [DOI] [PMC free article] [PubMed] [Google Scholar]
- 15.Chornenkyy Y., Wang W.-X., Wei A., Nelson P. T., Alzheimer’s disease and type 2 diabetes mellitus are distinct diseases with potential overlapping metabolic dysfunction upstream of observed cognitive decline. Brain Pathol. 29, 3–17 (2019). [DOI] [PMC free article] [PubMed] [Google Scholar]
- 16.Bang J., Spina S., Miller B. L., Frontotemporal dementia. Lancet 386, 1672–1682 (2015). [DOI] [PMC free article] [PubMed] [Google Scholar]
- 17.Blalock E. M., Geddes J. W., Chen K. C., Porter N. M., Markesbery W. R., Landfield P. W., Incipient Alzheimer’s disease: Microarray correlation analyses reveal major transcriptional and tumor suppressor responses. Proc. Natl. Acad. Sci. U.S.A. 101, 2173–2178 (2004). [DOI] [PMC free article] [PubMed] [Google Scholar]
- 18.Courtney E., Kornfeld S., Janitz K., Janitz M., Transcriptome profiling in neurodegenerative disease. J. Neurosci. Methods 193, 189–202 (2010). [DOI] [PubMed] [Google Scholar]
- 19.Wang M., Li A., Sekiya M., Beckmann N. D., Quan X., Schrode N., Fernando M. B., Yu A., Zhu L., Cao J., Lyu L., Horgusluoglu E., Wang Q., Guo L., Wang Y., Neff R., Song W.-m., Wang E., Shen Q., Zhou X., Ming C., Ho S.-M., Vatansever S., Kaniskan H. U., Jin J., Zhou M.-M., Ando K., Ho L., Slesinger P. A., Yue Z., Zhu J., Gandy S., Ehrlich M. E., Cai D., Haroutunian V., Iijima K. M., Schadt E., Brennand K. J., Zhang B., Molecular networks and key regulators of the dysregulated neuronal system in Alzheimer’s disease. bioRxiv 788323 (2019). [Google Scholar]
- 20.Twine N. A., Janitz K., Wilkins M. R., Janitz M., Whole transcriptome sequencing reveals gene expression and splicing differences in brain regions affected by Alzheimer’s disease. PLOS ONE 6, e16266 (2011). [DOI] [PMC free article] [PubMed] [Google Scholar]
- 21.Wang M., Beckmann N. D., Roussos P., Wang E., Zhou X., Wang Q., Ming C., Neff R., Ma W., Fullard J. F., Hauberg M. E., Bendl J., Peters M. A., Logsdon B., Wang P., Mahajan M., Mangravite L. M., Dammer E. B., Duong D. M., Lah J. J., Seyfried N. T., Levey A. I., Buxbaum J. D., Ehrlich M., Gandy S., Katsel P., Haroutunian V., Schadt E., Zhang B., The Mount Sinai cohort of large-scale genomic, transcriptomic and proteomic data in Alzheimer’s disease. Sci. Data 5, 180185 (2018). [DOI] [PMC free article] [PubMed] [Google Scholar]
- 22.De Jager P. L., Ma Y., McCabe C., Xu J., Vardarajan B. N., Felsky D., Klein H.-U., White C. C., Peters M. A., Lodgson B., Nejad P., Tang A., Mangravite L. M., Yu L., Gaiteri C., Mostafavi S., Schneider J. A., Bennett D. A., A multi-omic atlas of the human frontal cortex for aging and Alzheimer’s disease research. Sci. Data 5, 180142 (2018). [DOI] [PMC free article] [PubMed] [Google Scholar]
- 23.Bennett D. A., Buchman A. S., Boyle P. A., Barnes L. L., Wilson R. S., Schneider J. A., Religious orders study and rush memory and aging project. J. Alzheimers Dis. 64, S161–S189 (2018). [DOI] [PMC free article] [PubMed] [Google Scholar]
- 24.Wang M., Roussos P., McKenzie A., Zhou X., Kajiwara Y., Brennand K. J., De Luca G. C., Crary J. F., Casaccia P., Buxbaum J. D., Ehrlich M., Gandy S., Goate A., Katsel P., Schadt E., Haroutunian V., Zhang B., Integrative network analysis of nineteen brain regions identifies molecular signatures and networks underlying selective regional vulnerability to Alzheimer’s disease. Genome Med. 8, 104 (2016). [DOI] [PMC free article] [PubMed] [Google Scholar]
- 25.Ogata H., Goto S., Sato K., Fujibuchi W., Bono H., Kanehisa M., KEGG: Kyoto encyclopedia of genes and genomes. Nucleic Acids Res. 27, 29–34 (1999). [DOI] [PMC free article] [PubMed] [Google Scholar]
- 26.McKenzie A. T., Wang M., Hauberg M. E., Fullard J. F., Kozlenkov A., Keenan A., Hurd Y. L., Dracheva S., Casaccia P., Roussos P., Zhang B., Brain cell type specific gene expression and co-expression network architectures. Sci. Rep. 8, 8868 (2018). [DOI] [PMC free article] [PubMed] [Google Scholar]
- 27.Zhang B., Gaiteri C., Bodea L.-G., Wang Z., McElwee J., Podtelezhnikov A. A., Zhang C., Xie T., Tran L., Dobrin R., Fluder E., Clurman B., Melquist S., Narayanan M., Suver C., Shah H., Mahajan M., Gillis T., Mysore J., MacDonald M. E., Lamb J. R., Bennett D. A., Molony C., Stone D. J., Gudnason V., Myers A. J., Schadt E. E., Neumann H., Zhu J., Emilsson V., Integrated systems approach identifies genetic nodes and networks in late-onset Alzheimer’s disease. Cell 153, 707–720 (2013). [DOI] [PMC free article] [PubMed] [Google Scholar]
- 28.Blalock E. M., Buechel H. M., Popovic J., Geddes J. W., Landfield P. W., Microarray analyses of laser-captured hippocampus reveal distinct gray and white matter signatures associated with incipient Alzheimer’s disease. J. Chem. Neuroanat. 42, 118–126 (2011). [DOI] [PMC free article] [PubMed] [Google Scholar]
- 29.Sweeney M. D., Sagare A. P., Zlokovic B. V., Blood–brain barrier breakdown in Alzheimer disease and other neurodegenerative disorders. Nat. Rev. Neurol. 14, 133–150 (2018). [DOI] [PMC free article] [PubMed] [Google Scholar]
- 30.Song W. M., Zhang B., Multiscale embedded gene co-expression network analysis. PLOS Comput. Biol. 11, e1004574 (2015). [DOI] [PMC free article] [PubMed] [Google Scholar]
- 31.M. Scutari, Journal of Statistical Software Learning Bayesian Networks with the bnlearn R Package (1996); www.jstatsoft.org/.
- 32.Wang Q., Zhang Y., Wang M., Song W.-M., Shen Q., McKenzie A., Choi I., Zhou X., Pan P.-Y., Yue Z., Zhang B., The landscape of multiscale transcriptomic networks and key regulators in Parkinson’s disease. Nat. Commun. 10, 5234 (2019). [DOI] [PMC free article] [PubMed] [Google Scholar]
- 33.Kunkle B. W., Grenier-Boley B., Sims R., Bis J. C., Damotte V., Naj A. C., Boland A., Vronskaya M., van der Lee S. J., Amlie-Wolf A., Bellenguez C., Frizatti A., Chouraki V., Martin E. R., Sleegers K., Badarinarayan N., Jakobsdottir J., Hamilton-Nelson K. L., Moreno-Grau S., Olaso R., Raybould R., Chen Y., Kuzma A. B., Hiltunen M., Morgan T., Ahmad S., Vardarajan B. N., Epelbaum J., Hoffmann P., Boada M., Beecham G. W., Garnier J. G., Harold D., Fitzpatrick A. L., Valladares O., Moutet M.-L., Gerrish A., Smith A. V., Qu L., Bacq D., Denning N., Jian X., Zhao Y., Del Zompo M., Fox N. C., Choi S.-H., Mateo I., Hughes J. T., Adams H. H., Malamon J., Sanchez-Garcia F., Patel Y., Brody J. A., Dombroski B. A., Naranjo M. C. D., Daniilidou M., Eiriksdottir G., Mukherjee S., Wallon D., Uphill J., Aspelund T., Cantwell L. B., Garzia F., Galimberti D., Hofer E., Butkiewicz M., Fin B., Scarpini E., Sarnowski C., Bush W. S., Meslage S., Kornhuber J., White C. C., Song Y., Barber R. C., Engelborghs S., Sordon S., Voijnovic D., Adams P. M., Vandenberghe R., Mayhaus M., Cupples L. A., Albert M. S., De Deyn P. P., Gu W., Himali J. J., Beekly D., Squassina A., Hartmann A. M., Orellana A., Blacker D., Rodriguez-Rodriguez E., Lovestone S., Garcia M. E., Doody R. S., Munoz-Fernadez C., Sussams R., Lin H., Fairchild T. J., Benito Y. A., Holmes C., Karamujić-Čomić H., Frosch M. P., Thonberg H., Maier W., Roschupkin G., Ghetti B., Giedraitis V., Kawalia A., Li S., Huebinger R. M., Kilander L., Moebus S., Hernández I., Kamboh M. I., Brundin R. M., Turton J., Yang Q., Katz M. J., Concari L., Lord J., Beiser A. S., Keene C. D., Helisalmi S., Kloszewska I., Kukull W. A., Koivisto A. M., Lynch A., Tarraga L., Larson E. B., Haapasalo A., Lawlor B., Mosley T. H., Lipton R. B., Solfrizzi V., Gill M., Longstreth W. T., Montine T. J., Frisardi V., Diez-Fairen M., Rivadeneira F., Petersen R. C., Deramecourt V., Alvarez I., Salani F., Ciaramella A., Boerwinkle E., Reiman E. M., Fievet N., Rotter J. I., Reisch J. S., Hanon O., Cupidi C., Uitterlinden A. G. A., Royall D. R., Dufouil C., Maletta R. G., de Rojas I., Sano M., Brice A., Cecchetti R., George-Hyslop P. S., Ritchie K., Tsolaki M., Tsuang D. W., Dubois B., Craig D., Wu C. K., Soininen H., Avramidou D., Albin R. L., Fratiglioni L., Germanou A., Apostolova L. G., Keller L., Koutroumani M., Arnold S. E., Panza F., Gkatzima O., Asthana S., Hannequin D., Whitehead P., Atwood C. S., Caffarra P., Hampel H., Quintela I., Carracedo Á., Lannfelt L., Rubinsztein D. C., Barnes L. L., Pasquier F., Frölich L., Barral S., McGuinness B., Beach T. G., Johnston J. A., Becker J. T., Passmore P., Bigio E. H., Schott J. M., Bird T. D., Warren J. D., Boeve B. F., Lupton M. K., Bowen J. D., Proitsi P., Boxer A., Powell J. F., Burke J. R., Kauwe J. S. K., Burns J. M., Mancuso M., Buxbaum J. D., Bonuccelli U., Cairns N. J., McQuillin A., Cao C., Livingston G., Carlson C. S., Bass N. J., Carlsson C. M., Hardy J., Carney R. M., Bras J., Carrasquillo M. M., Guerreiro R., Allen M., Chui H. C., Fisher E., Masullo C., Crocco E. A., DeCarli C., Bisceglio G., Dick M., Ma L., Duara R., Graff-Radford N. R., Evans D. A., Hodges A., Faber K. M., Scherer M., Fallon K. B., Riemenschneider M., Fardo D. W., Heun R., Farlow M. R., Kölsch H., Ferris S., Leber M., Foroud T. M., Heuser I., Galasko D. R., Giegling I., Gearing M., Hüll M., Geschwind D. H., Gilbert J. R., Morris J., Green R. C., Mayo K., Growdon J. H., Feulner T., Hamilton R. L., Harrell L. E., Drichel D., Honig L. S., Cushion T. D., Huentelman M. J., Hollingworth P., Hulette C. M., Hyman B. T., Marshall R., Jarvik G. P., Meggy A., Abner E., Menzies G. E., Jin L.-W., Leonenko G., Real L. M., Jun G. R., Baldwin C. T., Grozeva D., Karydas A., Russo G., Kaye J. A., Kim R., Jessen F., Kowall N. W., Vellas B., Kramer J. H., Vardy E., LaFerla F. M., Jöckel K.-H., Lah J. J., Dichgans M., Leverenz J. B., Mann D., Levey A. I., Pickering-Brown S., Lieberman A. P., Klopp N., Lunetta K. L., Wichmann H. E., Lyketsos C. G., Morgan K., Marson D. C., Brown K., Martiniuk F., Medway C., Mash D. C., Nöthen M. M., Masliah E., Hooper N. M., McCormick W. C., Daniele A., McCurry S. M., Bayer A., McDavid A. N., Gallacher J., McKee A. C., van den Bussche H., Mesulam M., Brayne C., Miller B. L., Riedel-Heller S., Miller C. A., Miller J. W., Al-Chalabi A., Morris J. C., Shaw C. E., Myers A. J., Wiltfang J., O’Bryant S., Olichney J. M., Alvarez V., Parisi J. E., Singleton A. B., Paulson H. L., Collinge J., Perry W. R., Mead S., Peskind E., Cribbs D. H., Rossor M., Pierce A., Ryan N. S., Poon W. W., Nacmias B., Potter H., Sorbi S., Quinn J. F., Sacchinelli E., Raj A., Spalletta G., Raskind M., Caltagirone C., Bossù P., Orfei M. D., Reisberg B., Clarke R., Reitz C., Smith A. D., Ringman J. M., Warden D., Roberson E. D., Wilcock G., Rogaeva E., Bruni A. C., Rosen H. J., Gallo M., Rosenberg R. N., Ben-Shlomo Y., Sager M. A., Mecocci P., Saykin A. J., Pastor P., Cuccaro M. L., Vance J. M., Schneider J. A., Schneider L. S., Slifer S., Seeley W. W., Smith A. G., Sonnen J. A., Spina S., Stern R. A., Swerdlow R. H., Tang M., Tanzi R. E., Trojanowski J. Q., Troncoso J. C., Van Deerlin V. M., Van Eldik L. J., Vinters H. V., Vonsattel J. P., Weintraub S., Welsh-Bohmer K. A., Wilhelmsen K. C., Williamson J., Wingo T. S., Woltjer R. L., Wright C. B., Yu C. E., Yu L., Saba Y., Pilotto A., Bullido M. J., Peters O., Crane P. K., Bennett D., Bosco P., Coto E., Boccardi V., De Jager P. L., Lleo A., Warner N., Lopez O. L., Ingelsson M., Deloukas P., Cruchaga C., Graff C., Gwilliam R., Fornage M., Goate A. M., Sanchez-Juan P., Kehoe P. G., Amin N., Ertekin-Taner N., Berr C., Debette S., Love S., Launer L. J., Younkin S. G., Dartigues J. F., Corcoran C., Ikram M. A., Dickson D. W., Nicolas G., Campion D., Tschanz J. A., Schmidt H., Hakonarson H., Clarimon J., Munger R., Schmidt R., Farrer L. A., Van Broeckhoven C., O’Donovan M. C., DeStefano A. L., Jones L., Haines J. L., Deleuze J. F., Owen M. J., Gudnason V., Mayeux R., Escott-Price V., Psaty B. M., Ramirez A., Wang L. S., Ruiz A., van Duijn C. M., Holmans P. A., Seshadri S., Williams J., Amouyel P., Schellenberg G. D., Lambert J.-C., Pericak-Vance M. A.; Alzheimer Disease Genetics Consortium (ADGC); European Alzheimer’s Disease Initiative (EADI); Cohorts for Heart and Aging Research in Genomic Epidemiology Consortium (CHARGE); Genetic and Environmental Risk in AD/Defining Genetic, Polygenic and Environmental Risk for Alzheimer’s Disease Consortium (GERAD/PERADES) , Genetic meta-analysis of diagnosed Alzheimer’s disease identifies new risk loci and implicates Aβ, tau, immunity and lipid processing. Nat. Genet. 51, 414–430 (2019). [DOI] [PMC free article] [PubMed] [Google Scholar]
- 34.Euesden J., Lewis C. M., O’Reilly P. F., PRSice: Polygenic risk score software. Bioinformatics 31, 1466–1468 (2015). [DOI] [PMC free article] [PubMed] [Google Scholar]
- 35.De Rossi P., Buggia-Prévot V., Clayton B. L. L., Vasquez J. B., van Sanford C., Andrew R. J., Lesnick R., Botté A., Deyts C., Salem S., Rao E., Rice R. C., Parent A., Kar S., Popko B., Pytel P., Estus S., Thinakaran G., Predominant expression of Alzheimer’s disease-associated BIN1 in mature oligodendrocytes and localization to white matter tracts. Mol. Neurodegener. 11, 59 (2016). [DOI] [PMC free article] [PubMed] [Google Scholar]
- 36.Calafate S., Flavin W., Verstreken P., Moechars D., Loss of Bin1 promotes the propagation of tau pathology. Cell Rep. 17, 931–940 (2016). [DOI] [PubMed] [Google Scholar]
- 37.Werner C., Pauli M., Doose S., Weishaupt A., Haselmann H., Grünewald B., Sauer M., Heckmann M., Toyka K. V., Asan E., Sommer C., Geis C., Human autoantibodies to amphiphysin induce defective presynaptic vesicle dynamics and composition. Brain 139, 365–379 (2016). [DOI] [PubMed] [Google Scholar]
- 38.Bennett D. A., Schneider J. A., Arvanitakis Z., Wilson R. S., Overview and findings from the religious orders study. Curr. Alzheimer Res. 9, 628–645 (2012). [DOI] [PMC free article] [PubMed] [Google Scholar]
- 39.Perneczky R., Wagenpfeil S., Komossa K., Grimmer T., Diehl J., Kurz A., Mapping scores onto stages: Mini-mental state examination and clinical dementia rating. Am. J. Geriatr. Psychiatry 14, 139–144 (2006). [DOI] [PubMed] [Google Scholar]
- 40.Jax Mouse Model 005642 - B6.Cg-Clutm1Jakh/J (2020); www.jax.org/strain/005642.
- 41.Liu L., Caselli R. J., Age stratification corrects bias in estimated hazard of APOE genotype for Alzheimer’s disease. Alzheimer’s Dementia 4, 602–608 (2018). [DOI] [PMC free article] [PubMed] [Google Scholar]
- 42.Norambuena A., Wallrabe H., Cao R., Wang D. B., Silva A., Svindrych Z., Periasamy A., Hu S., Tanzi R. E., Kim D. Y., Bloom G. S., A novel lysosome-to-mitochondria signaling pathway disrupted by amyloid-β oligomers. EMBO J. 37, e100241 (2018). [DOI] [PMC free article] [PubMed] [Google Scholar]
- 43.Khan S. S., LaCroix M., Boyle G., Sherman M. A., Brown J. L., Amar F., Aldaco J., Lee M. K., Bloom G. S., Lesné S. E., Bidirectional modulation of Alzheimer phenotype by alpha-synuclein in mice and primary neurons. Acta Neuropathol. 136, 589–605 (2018). [DOI] [PMC free article] [PubMed] [Google Scholar]
- 44.Ruiz A., Heilmann S., Becker T., Hernández I., Wagner H., Thelen M., Mauleón A., Rosende-Roca M., Bellenguez C., Bis J. C., Harold D., Gerrish A., Sims R., Sotolongo-Grau O., Espinosa A., Alegret M., Arrieta J. L., Lacour A., Leber M., Becker J., Lafuente A., Ruiz S., Vargas L., Rodríguez O., Ortega G., Dominguez M. A., Mayeux R., Haines J. L., Pericak-Vance M. A., Farrer L. A., Schellenberg G. D., Chouraki V., Launer L. J., Van Duijn C., Seshadri S., Antúnez C., Breteler M. M., Serrano-Ríos M., Jessen F., Tárraga L., Nöthen M. M., Maier W., Boada M., Ramírez A. L., Follow-up of loci from the International Genomics of Alzheimer’s Disease Project identifies TRIP4 as a novel susceptibility gene. Transl. Psychiatry 4, e358 (2014). [DOI] [PMC free article] [PubMed] [Google Scholar]
- 45.Karch C. M., Cruchaga C., Goate A. M., Alzheimer’s disease genetics: From the bench to the clinic. Neuron 83, 11–26 (2014). [DOI] [PMC free article] [PubMed] [Google Scholar]
- 46.Hansson O., Zetterberg H., Buchhave P., Londos E., Blennow K., Minthon L., Association between CSF biomarkers and incipient Alzheimer’s disease in patients with mild cognitive impairment: A follow-up study. Lancet Neurol. 5, 228–234 (2006). [DOI] [PubMed] [Google Scholar]
- 47.Zhou X., Wang M., Katsyv I., Irie H., Zhang B., EMUDRA: Ensemble of multiple drug repositioning approaches to improve prediction accuracy. Bioinformatics 34, 3151–3159 (2018). [DOI] [PMC free article] [PubMed] [Google Scholar]
- 48.McKenzie A. T., Moyon S., Wang M., Katsyv I., Song W.-M., Zhou X., Dammer E. B., Duong D. M., Aaker J., Zhao Y., Beckmann N., Wang P., Zhu J., Lah J. J., Seyfried N. T., Levey A. I., Katsel P., Haroutunian V., Schadt E. E., Popko B., Casaccia P., Zhang B., Multiscale network modeling of oligodendrocytes reveals molecular components of myelin dysregulation in Alzheimer’s disease. Mol. Neurodegener. 12, 82 (2017). [DOI] [PMC free article] [PubMed] [Google Scholar]
- 49.B. Zhang, J. Zhu, in Proceedings of the World Congress on Engineering 2013 (International Association of Engineers), vol. 2, pp. 1309–1312. [Google Scholar]
- 50.Millstein J., Zhang B., Zhu J., Schadt E. E., Disentangling molecular relationships with a causal inference test. BMC Genet. 10, 23 (2009). [DOI] [PMC free article] [PubMed] [Google Scholar]
- 51.Zhu J., Wiener M. C., Zhang C., Fridman A., Minch E., Lum P. Y., Sachs J. R., Schadt E. E., Increasing the power to detect causal associations by combining genotypic and expression data in segregating populations. PLOS Comput. Biol. 3, 692–703 (2007). [DOI] [PMC free article] [PubMed] [Google Scholar]
- 52.Zhang Y., Sloan S. A., Clarke L. E., Caneda C., Plaza C. A., Blumenthal P. D., Vogel H., Steinberg G. K., Edwards M. S. B., Li G., Duncan J. A., Cheshier S. H., Shuer L. M., Chang E. F., Grant G. A., Gephart M. G. H., Barres B. A., Purification and characterization of progenitor and mature human astrocytes reveals transcriptional and functional differences with mouse. Neuron 89, 37–53 (2016). [DOI] [PMC free article] [PubMed] [Google Scholar]
Associated Data
This section collects any data citations, data availability statements, or supplementary materials included in this article.
Supplementary Materials
Supplementary material for this article is available at http://advances.sciencemag.org/cgi/content/full/7/2/eabb5398/DC1