Abstract
Sepsis is the major cause of mortality in the intensive care unit. The aim of this study was to identify the key prognostic biomarkers of abnormal expression and immune infiltration in sepsis. In this study, a total of 36 differentially expressed genes were identified to be mainly involved in a number of immune-related Gene Ontology terms and Kyoto Encyclopedia of Genes and Genomes pathways. The hub genes (MMP9 and C3AR1) were significantly related to the prognosis of sepsis patients. The immune infiltration analysis indicated a significant difference in the relative cell content of naive B cells, follicular Th cells, activated NK cells, eosinophils, neutrophils and monocytes between sepsis and normal controls. Weighted gene co-expression network analysis and a de-convolution algorithm that quantifies the cellular composition of immune cells were used to analyse the sepsis expression data from the Gene Expression Omnibus database and to identify modules related to differential immune cells. CEBPB is the key immune-related gene that may be involved in sepsis. Gene set enrichment analysis revealed that CEBPB is involved in the processes of T cell selection, B cell–mediated immunity, NK cell activation and pathways of T cells, B cells and NK cells. Therefore, CEBPB may play a key role in the biological and immunological processes of sepsis.
Keywords: Sepsis, immune infiltration, key biomarkers, WGCNA, CIBERSORT
Introduction
Sepsis is a major cause of mortality in the intensive care unit (ICU), and the burden of sepsis remains considerably high.1,2 Estimates suggest that sepsis affects millions of people worldwide, and annually causes nearly six million deaths; the mortality rate varies from 30% to 60% in the ICU.3,4 Sepsis is currently defined as a life-threatening organ dysfunction that is caused by a dysregulated host response to infection.5 Sepsis is characterised by the complex pathophysiology and heterogeneous phenotypes of affected patients regarding the symptoms, response to treatment and outcomes.6 At present, there is no gold standard to diagnose sepsis, and its clinical assessment is often difficult. Therefore, the use of additional biomarkers to diagnose patients is attractive.7,8 Biomarkers can be the key to personalised medicine in sepsis whereby patients receive tailored treatment based on their unique characteristics.
The systemic immune response plays a crucial role in the pathogenesis of severe sepsis. The immune response in sepsis can be divided into two main phases: a pro-inflammatory phase and an anti-inflammatory phase.9 In the early phase of sepsis in previously healthy individuals, pro-inflammatory processes dominate the immune response. However, growing evidence suggests that novel immunological biomarkers can be used as potential predictors of the outcome of sepsis.10 Therefore, the exploration of immune-related prognostic markers is an important focus of studies on sepsis.
The rapid development of bioinformatics has produced numerous tools for the identification of biomarkers.11 Weighted gene co-expression network analysis (WGCNA) is an effective tool that can be used to identify relevant patterns of the genes to determine relevant modules and key genes for specific diseases.12 This algorithm has been extensively used to identify biomarkers at the transcriptional level.13 Cell-type Identification by Estimating Relative Subsets Of RNA Transcripts (CIBERSORT) is another bioinformatics tool for the analysis of gene expression data. This tool quantifies the cellular composition of immune cells using a deconvolution algorithm.14 This algorithm has been successfully used to approximate the level of immune cell infiltration in various diseases, such as cancer. The aims of this study were to identify the key biomarkers of the abnormally expressed genes and immune infiltration in sepsis and to provide targets for diagnosis and therapy of sepsis.
Methods
Data selection and processing
The sepsis RNA expression data were downloaded from the Gene Expression Omnibus (GEO; http://www.ncbi.nlm.nih.gov/geo/). Data from the GSE 64457, GSE 28750 and GSE 12624 data sets were used for differential expression analysis, and the GSE 54514 data set was used for survival analysis. GSE 64457 (GPL570 platform, Affymetrix human genome U133 Plus 2.0 array) contains 23 samples, including eight tissue samples without/sepsis and 15 sepsis samples. GSE 28750 (GPL570 platform, Affymetrix human genome U133 Plus 2.0 array) contains 41 samples, including 20 tissue samples without sepsis and 21 sepsis samples. GSE 12624 (GPL4204 platform, GE Healthcare/Amersham Biosciences CodeLink UniSet human I bioarray) contains 70 samples, including 36 tissue samples without sepsis and 34 sepsis samples. GSE 54514 (GPL6947 platform, Illumina HumanHT-12 V3.0 expression beadchip) contains 127 sepsis samples, including 31 sepsis samples from non-survivors and 96 sepsis samples from survivors. R v3.6.2 (R Foundation for Statistical Computing, Vienna, Austria) was used for data extraction and sorting to obtain the gene expression matrices. The batch effect resulting from the heterogeneity between different studies was eliminated by the ComBat module of the SVA package that uses the empirical Bayes methods; background adjustments and data normalisation were performed with the limma package.15
Differential expression analysis and survival analysis
To identify differentially expressed genes (DEGs) in tissue samples with sepsis and without sepsis, the limma package in R was used to identify DEGs in the sepsis samples versus the control samples of the GEO transcriptome data. The Mann–Whitney test was performed to determine differential expression levels of the genes between the sepsis samples and the corresponding control samples; |log2-fold change (FC)| >1 and false discovery rate (FDR) values < 0.05 were considered statistically significant. Overall survival curves were constructed by Kaplan–Meier estimation, and log-rank test (P < 0.05) was used to identify DEGs significantly associated with survival.
Protein–protein interaction network construction and functional enrichment analysis of DEGs
A protein–protein interaction (PPI) network of DEGs was constructed using the STRING online database (https://stringdb.org/),16 and the confided score with correlation degree > 0.400 was used as the cut-off value for inclusion into the network. Gene Ontology (GO) and Kyoto Encyclopedia of Genes and Genomes (KEGG) pathway enrichment analysis were performed using the clusterProfiler and enrichplot packages in R. Bubble charts were used to visualise the biological process (BP), cellular component (CC) and molecular function (MF) categories of GO enrichment. Circle plots were used to visualise the KEGG pathways.
CIBERSORT immune cell scores
CIBERSORT (https://cibersort.stanford.edu/) was used to estimate the relative proportions of cell subpopulations statistically in the complex tissue expression profiles and to estimate the abundance of special cells in a mixed tissue sample. In this study, CIBERSORT R package was used to estimate the fraction of immune cells in the samples. Absolute immune cell scores were computed using the gene expression data sets (model = absolute, permutation = 1000, disable quantile normalisation for RNA-seq data as recommended) by the LM22 (22 immune cell types) gene signature of CIBERSORT.17 The samples were screened according to P values < 0.05, and the percentage of each type of immune cells in the samples was calculated. Principal component analysis (PCA) was performed to detect the differences in immune cell infiltration between the sepsis patients and normal controls. The differences in the immune infiltration levels of each immune cell type between the two groups were analysed by the vioplot package in R v3.6.2.
Co-expression network and module construction
Weighted network adjacency was defined by raising the co-expression similarity to a power of β ≥ 1. WGCNA was also used to determine the associations between a module gene and MetS. The correlations between the module eigengenes and the differential infiltration levels of immune cells were calculated to determine the significance of the modules by Pearson’s test. An individual module was considered significantly correlated with differential levels of immune cells when P < 0.05.
Identification of immune-related key genes
Initially, the candidate genes were selected based on the modular connectivity and immune cell associations of each gene. Module connectivity is defined as the absolute value of Pearson’s correlation between the genes and a module. The immune cell association is defined as the absolute value of Pearson’s correlation between each gene and the immune cells. Genes related to six immune cells with a P value < 0.05 were considered candidate genes. Then, the candidate genes were selected, and the STRING database was used to construct a PPI network to identify the top 30 genes. Construction of the gene network based on the results of the scale-free network was performed by the network visualisation software Cytoscape (http://www.cytoscape.org/).18 Genes with node connectivity >10 were considered central nodes. Venn analysis was used to compare the candidate genes and central nodes in the scale-free network using the online Venn tool (http://bioinformatics. psb.ugent.be/webtools/Venn/).
Gene set enrichment analysis
Gene set enrichment analysis (GSEA) is the computational method used to determine whether basically defined gene sets have statistically significant differences between two biological states.19 According to the median value of gene expression, the samples were divided into two groups – c2.cp.kegg.v5.0.symbol.gmt and c5.bp.v5.0.entrez.gmt – for GSEA. P values < 0.05 and FDR < 0.25 were indicative of statistical significance.
Results
Identification of DEGs in sepsis
The RNA expression profiling data were downloaded from the GEO database. Implementation of a series of stringent filters provided the expression levels of all genes from 64 sepsis samples and 70 samples without sepsis. Heat-map analysis showed that these genes have differential expression profiles between tissues with and without sepsis (Figure 1a). A total of 36 DEGs, including three down-regulated genes and 33 up-regulated genes, were validated using a volcano plot (Figure 1b).
Figure 1.
Identification of differentially expressed genes (DEGs) in sepsis. (a) Volcano plot of 36 DEGs in sepsis. Red plots represent aberrantly expressed mRNAs with P < 0.05 and absolute log FC >1. Black plots represent normally expressed mRNAs. Green plots represent aberrantly expressed mRNAs with P < 0.05 and log FC < −1. (b) Heat-map analysis of differential expression profiles.
Enrichment analysis and identification of the hub genes
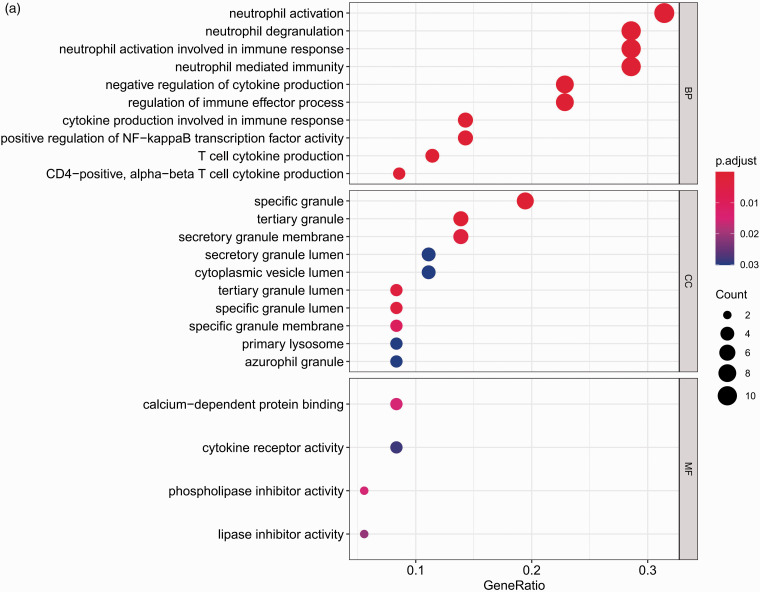
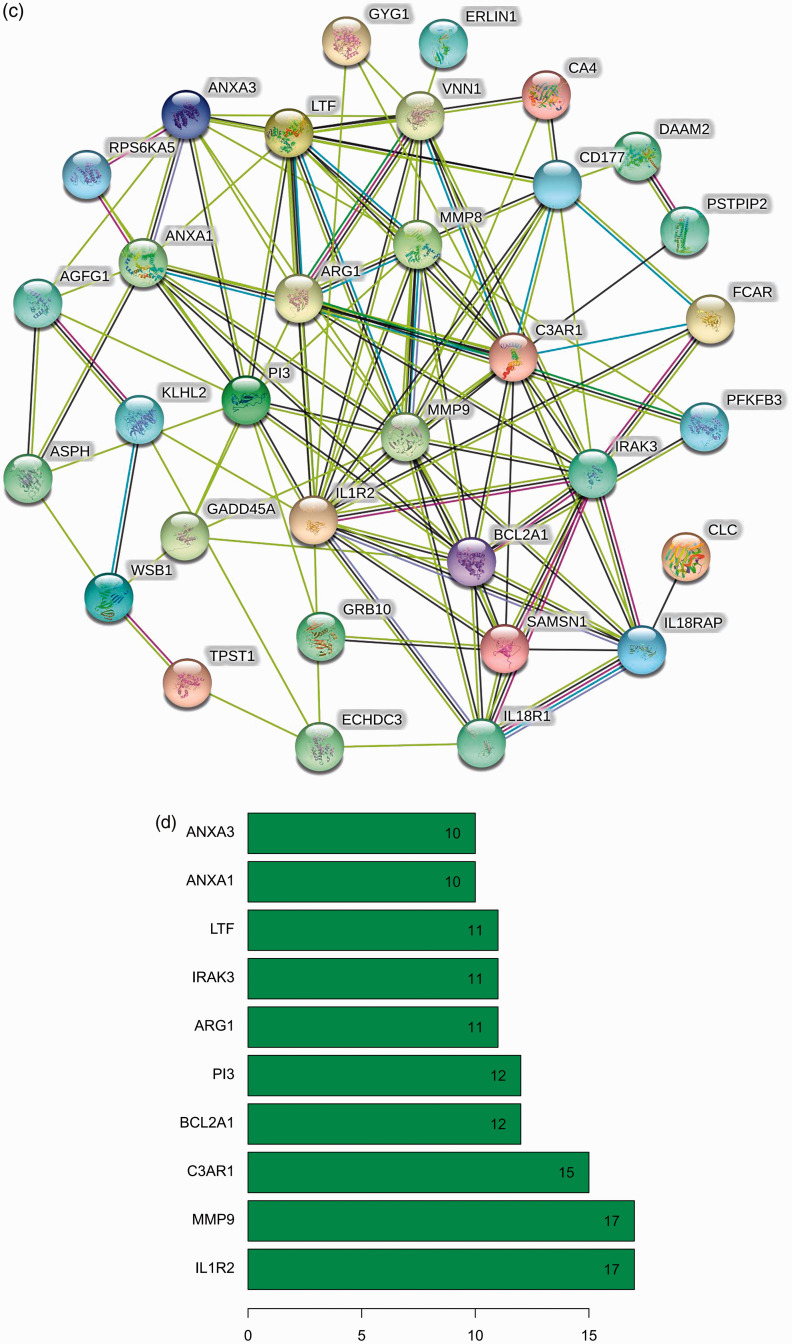
To explore the biological functions of 36 DEGs, they were categorised into BP, CC and MF. A total of 69 specific BP, 17 CC and 4 MF GO terms were enriched in these genes with P < 0.05. All 20 of the highest enrichment terms were immune related (Figure 2a), and the most highly enriched term was neutrophil activation. Additionally, analysis using clusterProfiler indicated that these genes were significantly enriched in immune-related pathways, such as the TNF-α, NF-κB and neutrophin signalling pathways. The results are shown in Figure 2b. The PPI network of DEGs was analysed by using STRING (Figure 2c). Bar plot identified the top 10 genes in the PPI networks (Figure 2d), and these top 10 hub genes were selected for survival analysis in R. The results indicate that the expression levels of MMP9 and C3AR1 are significantly related to the prognosis of sepsis patients (Figure 3a and b).
Figure 2.
Functional enrichment analysis of DEGs. (a) Top 10 terms in GO analysis with P < 0.05. (b) Enriched terms in KEGG pathway analysis P < 0.05. (c) PPI networks were constructed using the STRING tool at a median confidence interval of 0.400. (d) Bar plot showing the top 10 genes in the PPI networks. DEGs: differentially expressed genes; GO: Gene Ontology; KEGG: Kyoto Encyclopedia of Genes and Genomes; PPI: protein–protein interaction.
Figure 3.
Prognostic value of hub genes in GSE 54514. (a) Kaplan–Meier overall survival curve for sepsis patients with high and low expression levels of MMP9. (b) Kaplan–Meier overall survival curve for sepsis patients with high and low C3AR1 expression levels.
Immune cell infiltration
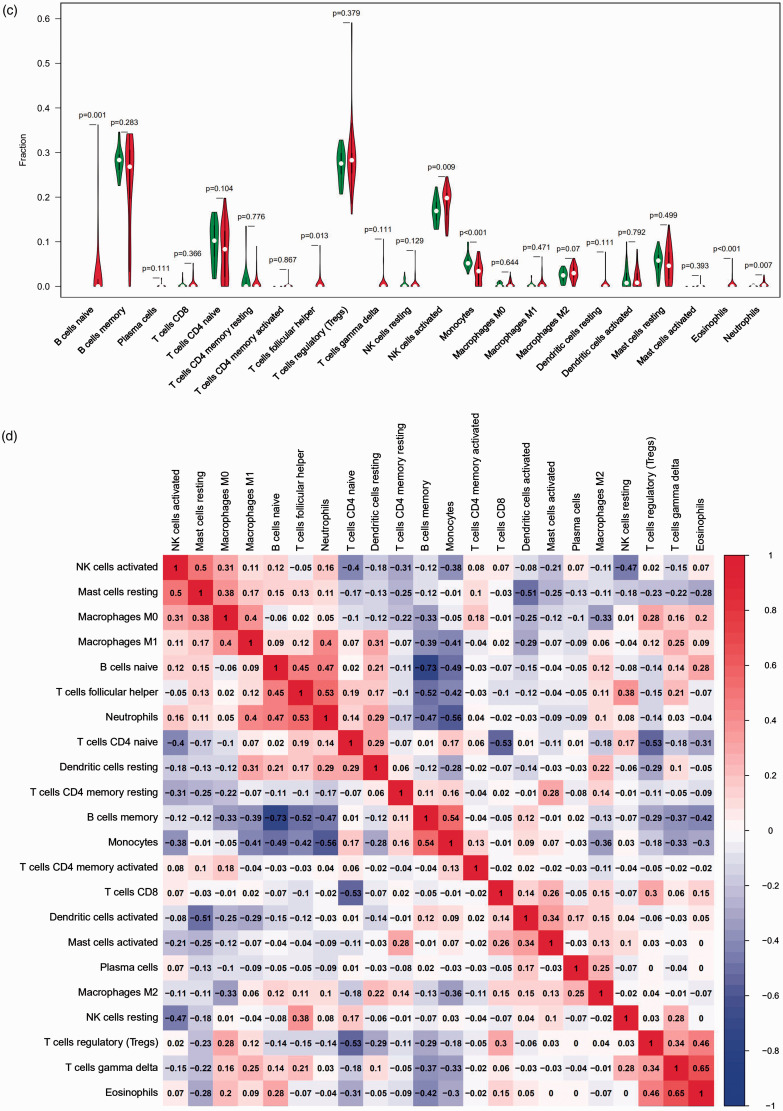
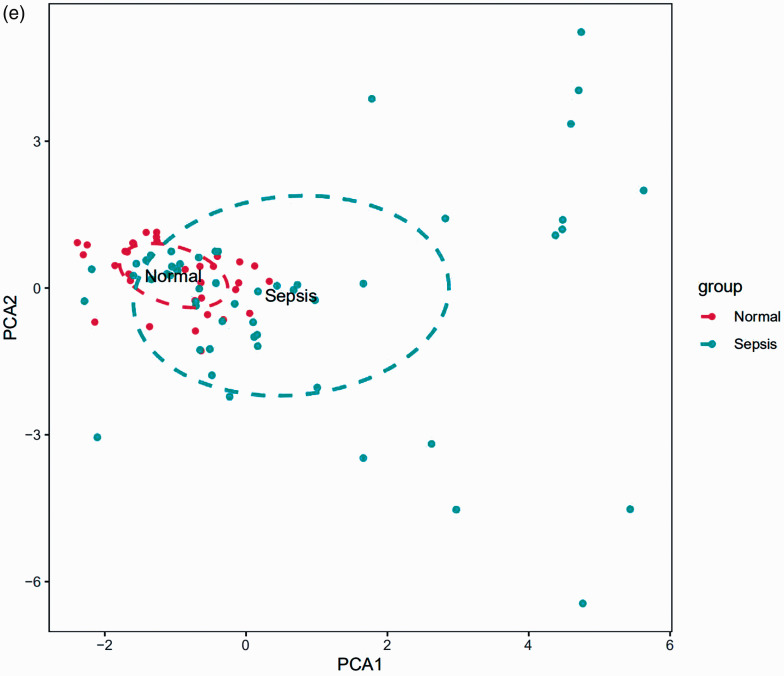
The differences in immune infiltration between the sepsis and control tissue samples in 22 subpopulations of immune cells were analysed by the CIBERSORT algorithm, and the results are shown in a bar plot (Figure 4a) and heat map (Figure 4b). The violin plot of the immune cell infiltration differences shows that naive B cells, follicular Th cells, activated NK cells, eosinophils and neutrophils had higher infiltration than that in the normal control samples, and monocytes had lower infiltration (Figure 4c). A correlation heat map of the 22 types of immune cells revealed that naive and memory B cells had the highest negative correlation. Gamma delta T cells and eosinophils had the highest positive correlation (Figure 4d). PCA cluster analysis was used to test the consistency of biological repetition and differences between various groups. The results of the PCA cluster analysis of immune cell infiltration showed that there were small differences in immune cell infiltration between the sepsis and control samples (Figure 4e).
Figure 4.
Landscape of immune cell infiltration in sepsis versus normal controls. (a) Relative percentage of 22 subpopulations of immune cells in the samples. (b) Immune infiltration of 22 subpopulations of immune cells in sepsis versus control tissue samples is shown in the heat map. (c) Difference in immune infiltration between the sepsis and normal control samples. (Normal control group marked in green; sepsis group marked in red). P Values < 0.05 were considered statistically significant. (d) Correlation heat map of 22 types of immune cells. The size of the coloured squares represents the strength of the correlation: blue represents a negative correlation; red represents a positive correlation. (f) Principal component analysis cluster plot of immune cell infiltration in sepsis versus control samples.
Construction of the gene co-expression network and identification of the key genes
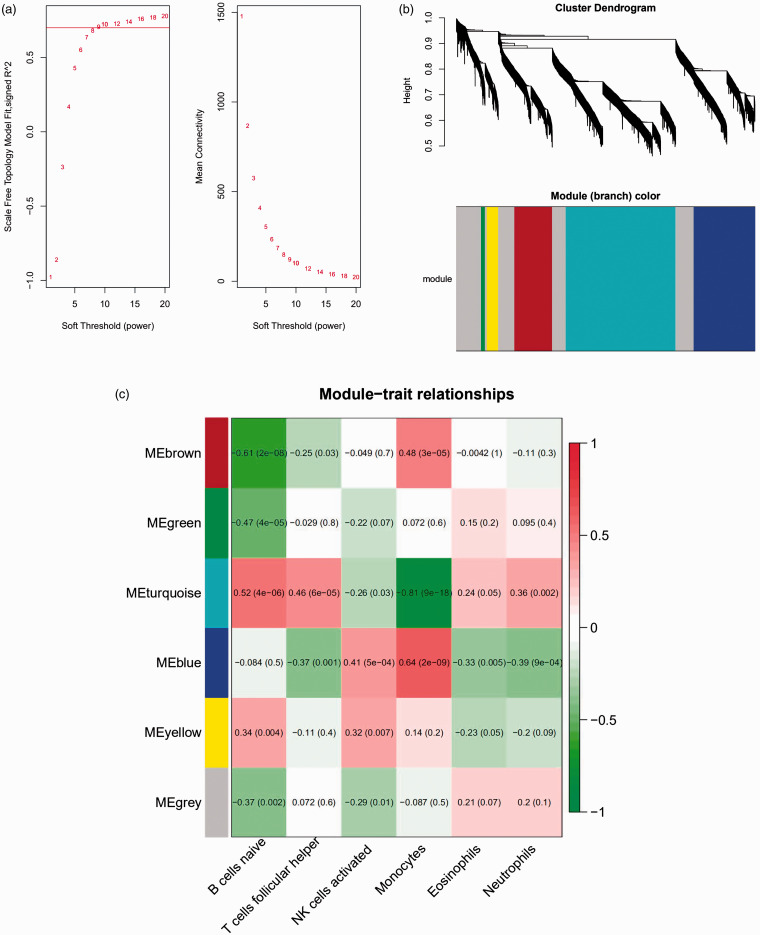
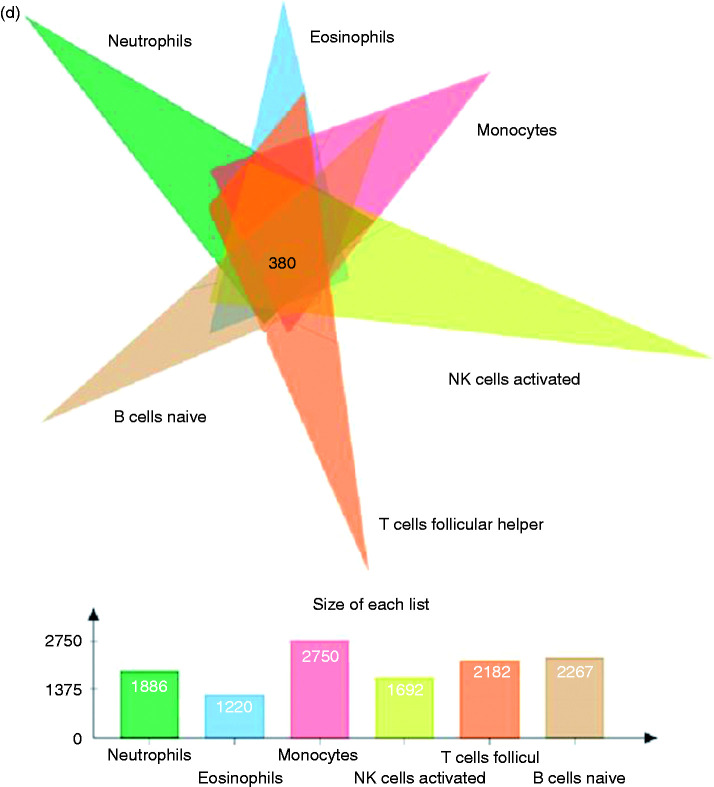
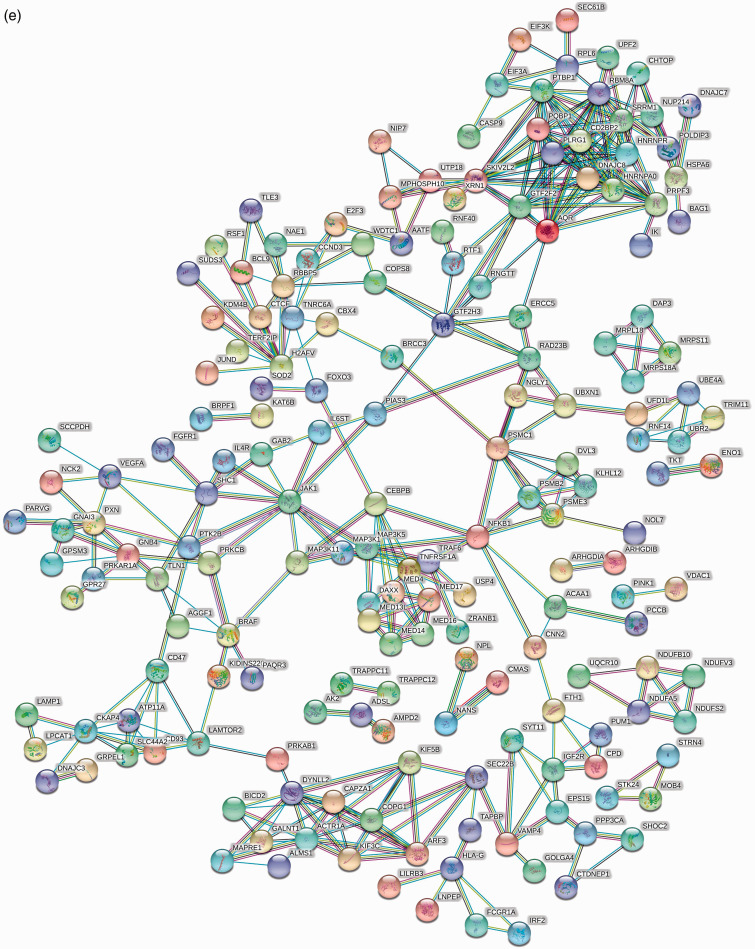
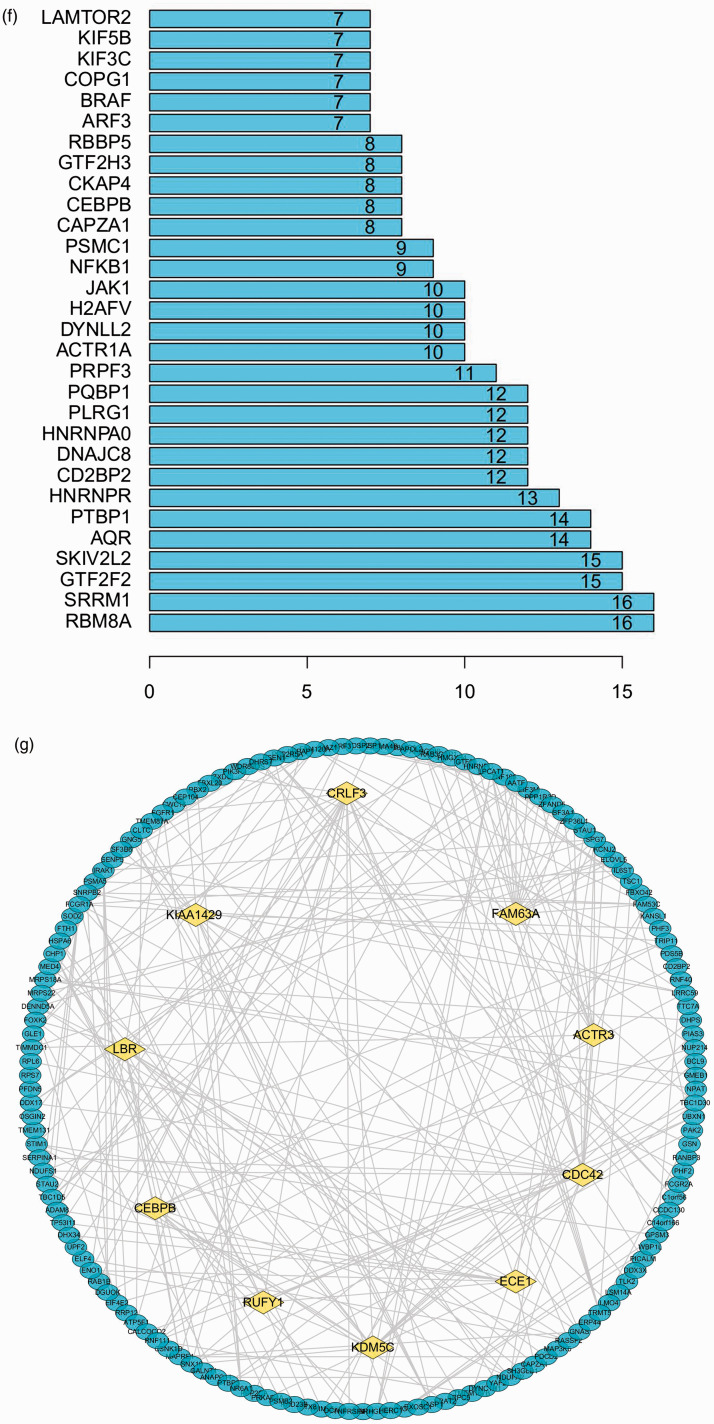
The expression levels of 3365 genes were used to construct a co-expression network using the WGCNA package. The soft threshold power was set to 9, with a R2 of 0.858 to ensure a scale-free network (Figure 5a). A hierarchical clustering tree was constructed using dynamic hybrid cutting. Each leaf on the tree represents a single gene, and genes with similar expression levels are adjacent and form a branch of the tree representing a gene module. Six modules were generated (Figure 5b). Correlations between immune cell infiltration and the key genes of the module were analysed and used to create a heat map (Figure 5c). The turquoise module was highly correlated with monocytes (r = –0.81, P < 0.05), naive B cells (r = 0.52, P < 0.05) and follicular Th cells (r = 0.48, P < 0.05). The brown module had a higher correlation with monocytes (r = 0.48, P < 0.05) and naive B cells (r = –0.61, P < 0.05), and the blue module showed a higher correlation with monocytes (r = 0.64, P < 0.05; Figure 4c). Correlation coefficients between other modules and immune cells were < 0.5. The highly connected genes were investigated as potential key factors related to six immune cell infiltration levels. Common genes associated with six types of immune cells were analysed using 380 genes obtained as result of the Venn analysis (Figure 5d). According to the cut-off values (P < 0.05) and the PPI network analysis (Figure 5e), the top 30 genes were selected as the candidate hub genes (Figure 5f). Genes with node connectivity >10 were considered central nodes of the scale-free network; these results were visualised using Cytoscape (Figure 5g). CEBPB was selected according to the results of both analyses, and was selected as a key gene (Figure 6a).
Figure 5.
Gene co-expression network construction and hub gene identification. (a) Analysis of the network topology for various soft threshold powers. (b) Genes are grouped into various modules by hierarchical clustering, and different colours represent different modules. (c) Heat map shows correlations of modules with differential immune cell infiltration. (d) Venn diagram shows the intersection of the markers in the six differentially infiltrating immune cells. (e) PPI network of 380 common genes in six differentially infiltrating immune cells. (f) Bar plot showing the top 10 genes in the PPI networks. (g) Scale-free network of genes based on the soft threshold power results. Yellow nodes represent a central node with more than 10 connections.
Figure 6.
Identification of the key genes and functional annotation. (a) Key genes were selected based on overlap between the PPI and co-expression networks. (b): Six GO terms of biological process for CEBPB by GSEA. (c) Three KEGG pathways enriched in CEBPB according to GSEA. GSEA: gene set enrichment analysis.
Correlation of functional annotation with immune cell infiltration and CEBPB
GSEA is extensively used to predict the biological functions of the hub genes. Differential analysis was used to investigate the biological role of CEBPB based on the high and low expression levels of CEBPB. Six representative BPs were associated with immune cell infiltration and CEBPB levels at an FDR of <25%, including T cell selection, alpha-beta T cell activation, positive T cell selection, B cell–mediated immunity, NK cell activation and cell–cell signalling (Figure 6b). The results indicated that several pathways were enriched in CEBPB with a FDR < 25%, including the T cell and B cell receptor signalling pathways and NK cell-mediated cytotoxicity, which were validated in the analysis (Figure 6c).
Discussion
Sepsis is a severe condition characterised by an abnormal host response to pathogenic micro-organisms consisting of an excessive inflammatory response and subsequent multiple organ failure.20 Although epidemiological data indicate that sepsis-associated mortality rates appear to have declined, the incidence is still on the rise, and sepsis is currently regarded as a major health-care burden.21 Sepsis-induced immunosuppression fosters bacterial growth and increases the production of immunosuppressive soluble mediators and depletion of T cells and dendritic cells by increased apoptosis and immune exhaustion with paralysis of CD8+ T cell effector properties.22,23 Sepsis immunosuppression prolongs the primary microbial infection and increases the risk of opportunistic infections and organ dysfunctions with poor predicted outcomes.24 Numerous protein biomarkers have been evaluated to discriminate between sepsis and normal conditions, and immune cell infiltration has been shown to play an important role in the development of sepsis. Therefore, identification of specific prognostic markers and analysis of the patterns of immune cell infiltration are very important for the improvement of prognosis of sepsis patients. In this study, a comprehensive and detailed assessment of immune cell infiltration in sepsis was performed based on the deconvolution of the bulk gene expression data from a large set of samples to identify novel prognostic markers of sepsis.
A total of 36 DEGs in the sepsis versus control samples were identified in our study, and the top 10 genes in the PPI network were determined to be hub genes. Kaplan–Meier analysis of the 10 hub genes was performed. The results of MMP9 and C3AR1 were statistically significant, and the prognosis was poor when these genes were expressed at low levels. According to the data in the literature, the levels of MMP9 expression in patients with sepsis are significantly higher than those in healthy individuals, and MMP9 expression levels have been investigated as prognostic biomarkers of sepsis.25–27 Bojic et al.28 found that low MMP-9 levels in sepsis are associated with more severe kidney and liver injury, and this result was supported by Renckens et al., who demonstrated that MMP-9-knockout mice with abdominal sepsis developed more severe distant organ damage.29 Furthermore, MMP9 was a better prognostic biomarker of sepsis in agreement with our results. C3AR1 was suggested to be restricted to the innate immune response and a role in the complement cascade. However, the roles of C3AR1 have been extended to participation in cancer, neurogenesis and hormone release from the pituitary.30 However, clinical reports on C3AR1 in sepsis-associated studies are not available. Our study is the first to demonstrate that down-regulation of C3AR1 expression is significantly associated with poor prognosis in patients with sepsis. Therefore, C3AR1 may significantly contribute to the pathophysiology of sepsis. The identification of the hub genes may contribute to the development of prognostic markers or therapeutic targets in sepsis.
The immune pathogenesis of sepsis is very complex. During sepsis, microbial infection or necrotic tissue releases high levels of harmful substances, resulting in the activation of the systemic immune response and excessive activation of immune cells. In our study, GO enrichment analysis showed that DEGs are mainly related to neutrophil activation, neutrophil degranulation, neutrophil activation involved in the immune response and other immune-related GO terms. KEGG analysis indicates that DEGs are involved in the TNF-α, NF-κB and neutrophin signalling pathways. These results suggest that the immune response plays an important role in the development of a rationale for immunotherapy in sepsis.
After identification of DEGs involved in numerous immune responses, the immune cell infiltration in sepsis was analysed by the CIBERSORT algorithm method. Our results indicate significant differences in the relative cell contents of naive B cells, follicular Th cells, activated NK cells, eosinophils, neutrophils and monocytes between the sepsis and normal control samples. Kumar31 demonstrated the importance of immune cells, including neutrophils, macrophages and T cells, in the pathogenesis of sepsis. Various lymphocyte populations (B and T lymphocytes) are influenced by and likely contribute to the immunosuppressive effects of sepsis. TGF-β has been shown to play a role in endotoxin desensitisation of monocytes induced in sepsis patients during the septic response. TGF-β inhibits T cell function, including IL-2 production and T cell proliferative responses.32 These studies confirm the reliability of our results and provide evidence for our subsequent studies. A gene expression matrix was used to construct the co-expression network and calculate the infiltration levels of differential immune cells; correlation analysis was used to identify the genes highly associated with six immune cell types. CEBPB was determined to be a hub gene because it is the most connected gene in the co-expression and PPI networks.
CEBPB is required for stress or inflammation and is often induced by inflammatory mediators, including anabolic growth factors and immunoregulatory cytokines.33 A previous study showed that CEBPB expression is an essential checkpoint for generation of immunosuppressive Gr1+CD11b+ myeloid-derived suppressor cells during sepsis, contributes to clinical outcome of sepsis and is a plausible target for the development of immune checkpoint treatment.34 In our study, GSEA indicated that CEBPB is involved in the processes of T cell selection, B cell–mediated immunity, NK cell activation and pathways of T cells, B cells and NK cells. Therefore, in agreement with previous studies, CEBPB may play a key role in the biological and immunological processes of sepsis. However, this result requires additional studies to clarify the complex interactions between CEBPB and immune cell infiltration.
Conclusions
In summary, a total of 36 identified DEGs are mainly involved in numerous immune-related GO terms and KEGG pathways. The hub genes (MMP9 and C3AR1) are significantly associated with the prognosis of sepsis patients. CEBPB is the key immune-related gene that may participate in sepsis. In addition, CEBPB is significantly associated with the relevant processes in NK cells, T cells and B cells. These immune cells may play a key role in the development of sepsis, and additional investigations of these immune cells may determine the targets for immunotherapy of sepsis and help to improve immunomodulatory therapies in sepsis patients. However, further studies are needed to confirm the associations between the key genes and immune infiltration, and the specific mechanisms of action of these genes in sepsis require further investigation.
Acknowledgements
We would like to extend our sincere gratitude to our departmental chair for all support. Additionally, we would like to thank physicians, engineers, nurses and other staff of the department.
Footnotes
Declaration of conflicting interests: The author(s) declared no potential conflicts of interest with respect to the research, authorship and/or publication of this article.
Funding: The author(s) received no financial support for the research, authorship and/or publication of this article.
ORCID iD: Meng Wu https://orcid.org/0000-0002-2437-4993
References
- 1.Finfer S, Bellomo R, Lipman J, et al. Adult-population incidence of severe sepsis in Australian and New Zealand intensive care units. Intensive Care Med 2004; 30: 589–596. [DOI] [PubMed] [Google Scholar]
- 2.Reinhart K, Daniels R, Kissoon N, et al. Recognizing sepsis as a global health priority – a WHO resolution. N Engl J Med 2017; 377: 414–417. [DOI] [PubMed] [Google Scholar]
- 3.Fleischmann C, Scherag A, Adhikari NK, et al. Assessment of global incidence and mortality of hospital-treated sepsis. Current estimates and limitations. Am J Respir Crit Care Med 2016; 193: 259–272. [DOI] [PubMed] [Google Scholar]
- 4.Pierrakos C, Vincent JL. Sepsis biomarkers: a review. Crit Care 2010; 14: R15. [DOI] [PMC free article] [PubMed] [Google Scholar]
- 5.Singer M, Deutschman CS, Seymour CW, et al. The third international consensus definitions for sepsis and septic shock (Sepsis-3). JAMA 2016; 315: 801–810. [DOI] [PMC free article] [PubMed] [Google Scholar]
- 6.Cohen J, Vincent JL, Adhikari NK, et al. Sepsis: a roadmap for future research. Lancet Infect Dis 2015; 15: 581–614. [DOI] [PubMed] [Google Scholar]
- 7.Perner A, Rhodes A, Venkatesh B, et al. Sepsis: frontiers in supportive care, organisation and research. Intensive Care Med 2017; 43: 496–508. [DOI] [PubMed] [Google Scholar]
- 8.Singer M. Biomarkers in sepsis. Curr Opin Pulm Med 2013; 19: 305–309. [DOI] [PMC free article] [PubMed] [Google Scholar]
- 9.Hotchkiss RS, Monneret G, Payen D. Immunosuppression in sepsis: a novel understanding of the disorder and a new therapeutic approach. Lancet Infect Dis 2013; 13: 260–268. [DOI] [PMC free article] [PubMed] [Google Scholar]
- 10.Reinhart K, Bauer M, Riedemann NC, et al. New approaches to sepsis: molecular diagnostics and biomarkers. Clin Microbiol Rev 2012; 25: 609–634. [DOI] [PMC free article] [PubMed] [Google Scholar]
- 11.Lin T, Gu J, Qu K, et al. A new risk score based on twelve hepatocellular carcinoma-specific gene expression can predict the patients prognosis. Aging (Albany NY) 2018; 10: 2480–2497. [DOI] [PMC free article] [PubMed] [Google Scholar]
- 12.Langfelder P, Horvath S. WGCNA: an R package for weighted correlation network analysis. BMC Bioinformatics 2008; 9: 559. [DOI] [PMC free article] [PubMed] [Google Scholar]
- 13.Niemira M, Collin F, Szalkowska A, et al. Molecular signature of subtypes of non small cell lung cancer by large-Scale transcriptional profiling: identification of key modules and genes by weighted gene co-expression network analysis (WGCNA). Cancers (Basel) 2019; 12: 37. [DOI] [PMC free article] [PubMed] [Google Scholar]
- 14.Newman AM, Liu CL, Green MR, et al. Robust enumeration of cell subsets from tissue expression profiles. Nat Methods 2015; 12: 453–457. [DOI] [PMC free article] [PubMed] [Google Scholar]
- 15.Ritchie ME, Phipson B, Wu D, et al. limma powers differential expression analyses for RNA-sequencing and microarray studies. Nucleic Acids Res 2015; 43: e47. [DOI] [PMC free article] [PubMed] [Google Scholar]
- 16.Franceschini A, Szklarczyk D, Frankild S, et al. STRING v9.1: protein–protein interaction networks, with increased coverage and integration. Nucleic Acids Res 2013; 41: D808–815. [DOI] [PMC free article] [PubMed] [Google Scholar]
- 17.Newman AM, Liu CL, Green MR, et al. Robust enumeration of cell subsets from tissue expression profiles. Nat Methods 2015; 12: 453–457. [DOI] [PMC free article] [PubMed] [Google Scholar]
- 18.Shannon P, Markiel A, Ozier O, et al. Cytoscape: a software environment for integrated models of biomolecular interaction networks. Genome Res 2003; 13: 2498–2504. [DOI] [PMC free article] [PubMed] [Google Scholar]
- 19.Subramanian A, Tamayo P, Mootha VK, et al. Gene set enrichment analysis: a knowledge-based approach for interpreting genome-wide expression profiles. Proc Natl Acad Sci U S A 2005; 102: 15545–15550. [DOI] [PMC free article] [PubMed] [Google Scholar]
- 20.Singer M, Deutschman CS, Seymour CW, et al. The third international consensus definitions for sepsis and septic shock (Sepsis-3). JAMA 2016; 315: 801–810. [DOI] [PMC free article] [PubMed] [Google Scholar]
- 21.Kim HI, Park S. Sepsis: early recognition and optimized treatment. Tuberc Respir Dis (Seoul) 2019; 82: 6–14. [DOI] [PMC free article] [PubMed] [Google Scholar]
- 22.Remick DG. Pathophysiology of sepsis. Am J Pathol 2007; 170: 1435–1444. [DOI] [PMC free article] [PubMed] [Google Scholar]
- 23.Shubin NJ, Monaghan SF, Ayala A. Anti-inflammatory mechanisms of sepsis. Contrib Microbiol 2011; 17: 108–124. [DOI] [PubMed] [Google Scholar]
- 24.Torgersen C, Moser P, Luckner G, et al. Macroscopic postmortem findings in 235 surgical intensive care patients with sepsis. Anesth Analg 2009; 108: 1841–1847. [DOI] [PubMed] [Google Scholar]
- 25.Stamenkovic I. Extracellular matrix remodelling: the role of matrix metalloproteinases. J Pathol 2003; 200: 448–464. [DOI] [PubMed] [Google Scholar]
- 26.Wang M, Zhang Q, Zhao X, et al. Diagnostic and prognostic value of neutrophil gelatinase-associated lipocalin, matrix metalloproteinase-9, and tissue inhibitor of matrix metalloproteinases-1 for sepsis in the emergency department: an observational study. Crit Care 2014; 18: 634. [DOI] [PMC free article] [PubMed] [Google Scholar]
- 27.Niño ME, Serrano SE, Niño DC, et al. TIMP1 and MMP9 are predictors of mortality in septic patients in the emergency department and intensive care unit unlike MMP9/TIMP1 ratio: multivariate model. PLoS One 2017; 12: e0171191. [DOI] [PMC free article] [PubMed] [Google Scholar]
- 28.Bojic S, Kotur-Stevuljevic J, Aleksic A, et al. Matrix metalloproteinase-9 and tissue inhibitor of matrix metalloproteinase-1 in sepsis after major abdominal surgery. Dis Markers 2018; 2018: 5064684. [DOI] [PMC free article] [PubMed] [Google Scholar]
- 29.Renckens R, Roelofs JJ, Florquin S, et al. Matrix metalloproteinase-9 deficiency impairs host defense against abdominal sepsis. J Immunol 2006; 176: 3735–3741. [DOI] [PubMed] [Google Scholar]
- 30.Francis K, Lewis BM, Akatsu H, et al. Complement C3a receptors in the pituitary gland: a novel pathway by which an innate immune molecule releases hormones involved in the control of inflammation.FASEB J 2003; 17: 2266–2268. [DOI] [PubMed] [Google Scholar]
- 31.Kumar V. Immunometabolism: another road to sepsis and its therapeutic targeting. Inflammation 2019; 42: 765–788. [DOI] [PubMed] [Google Scholar]
- 32.Ahmad S, Choudhry MA, Shankar R, et al. Transforming growth factor-beta negatively modulates T-cell responses in sepsis. FEBS Lett 1997; 402: 213–218. [DOI] [PubMed] [Google Scholar]
- 33.Marigo I, Bosio E, Solito S, et al. Tumor-induced tolerance and immune suppression depend on the C/EBPbeta transcription factor. Immunity 2010; 32: 790–802. [DOI] [PubMed] [Google Scholar]
- 34.McPeak MB, Youssef D, Williams DA, et al. Frontline science: myeloid cell specific deletion of Cebpb decreases sepsis-induced immunosuppression in mice. J Leukoc Biol 2017; 102: 191–200. [DOI] [PMC free article] [PubMed] [Google Scholar]


