Abstract
Myeloid-derived suppressor cells (MDSCs) are a heterogeneous population of immature myeloid cells that play a critical immunosuppressive role in the tumour micro-environment. Although biological research on MDSCs has made progress, the relationship between the secretion of cytokines by MDSCs and poor prognosis is not clear, and there are no criteria to measure the functional status of MDSCs. Here, we detected the mRNA expression of IL-10, IL-12, TGF-β and TNF-α in MDSCs and the levels of these cytokines in MDSC culture supernatants of patients with myelodysplastic syndromes, and quantified the functional status of MDSCs by IL-10/IL-12 ratio and TGF-β/TNF-α ratio. We found that the ratio of IL-10/IL-12 and TGF-β/TNF-α was significantly higher in higher-risk MDS than in lower-risk MDS and normal control groups. The TGF-β/TNF-α ratio in MDSCs was positively correlated with the percentage of blast cells and was negatively correlated with the percentage of CD3+CD8+ T lymphocytes. Meanwhile, the TGF-β/TNF-α ratio was higher in patients with a lower absolute neutrophil count. It suggested that MDSCs in higher-risk MDS have a stronger immunosuppressive effect and might be related to poor prognosis. Quantifying the functional status of MDSCs with IL-10/IL-12 and TGF-β/TNF-α ratio might help to evaluate the balance of cellular immunity of MDSCs in MDS.
Keywords: Myelodysplastic syndromes, myeloid-derived suppressor cells, cytokines, cellular immunity, tumour micro-environment
Introduction
Myelodysplastic syndromes (MDS) are a group of malignant clonal diseases characterised by ineffective haematopoiesis and high risk of conversion to acute myeloid leukaemia that results from dysplastic-appearing bone marrow (BM).1,2 Cellular immune tolerance and BM micro-environment changes might be critical to the pathogenesis of the disease.3–5 Cytotoxic T lymphocyte (CTL) exhaustion and hyperactivity of immunoregulation in regulatory T cells (Tregs) and myeloid-derived suppressor cells (MDSCs) could lead to cellular immune tolerance in MDS.3,6,7 MDSCs are a heterogeneous population of immature myeloid cells with an immunosuppressive function in the tumour micro-environment.8,9 The role of MDSCs in suppressing the immune system has been demonstrated in infection, chronic inflammation, autoimmune diseases, graft-versus-host disease,10,11 many solid tumours12–14 and haematological malignant diseases.15,16 The amplification of MDSCs is stimulated by cytokines that are secreted by tumour cells and stromal cells, such as stem-cell factor (SCF), granulocyte-macrophage (GM)-CSF) and vascular endothelial growth factor (VEGF), and regulated by the JAK protein family and STAT317 signalling pathway.
MDSCs are defined as two subsets based on the phenotypic and morphological characteristics: polymorphonuclear (PMN)- and monocytic (M)-MDSCs.18 In mice, PMN-MDSCs can be defined as CD11b+Ly6G+Ly6Clo, and M-MDSC as CD11b+ Ly6G−Ly6Chi.19,20 In humans, PMN-MDSCs are defined as CD11b+CD14−CD66b+ or CD11b+CD14− CD15+, and M-MDSC as CD11b+CD14+ HLA-DR−/loCD15−. Lin− (including CD3–, CD14–, CD15–, CD19– and CD56) HLA-DR−CD33+ cells contain mixed groups of MDSCs comprising more immature progenitors.21,22 In our previous research, Lin– HLA-DR– CD33+ MDSCs were increased in MDS patients, and they were clearly separated by flow cytometry. MDSCs are a group of immature myeloid cells with various surface markers and not unique. Distinguishing MDSC according to function seems to more conducive to the study of disease mechanisms.
Suppressing immune cells is an essential feature of MDSCs. MDSCs deplete the nutrients in the micro-environment required for T cells through the up-regulation of metabolic enzymes (e.g. arginase 1 (Arg1), and NO synthase (iNOS)) and ectoenzymes.23 Programmed death-ligand 1 (PD-L1) and hypoxia-inducible factor-1a (HIF-1a) were highly expressed in MDSCs to implement immune suppression.24,25 MDSCs can release a series of immunosuppressive molecules such as reactive oxygen species (ROS), VEGF, IL-10 and TGF-β to create a state of immunosuppression in the tumour micro-environment.26 Studies have found that MDSCs appear to have different functions in the tumour micro-environment,27 but there is no definite way to quantify the function state of MDSCs, especially in MDS. Here, we detected the mRNA expression of IL-10, IL-12, TGF-β and TNF-α in MDSCs and the levels of these cytokines in the MDSC culture supernatants of MDS patients, and quantified the functional status of MDSCs by IL-10/IL-12 ratio and TGF-β/TNF-α ratio. This might provide a method for clinical evaluation of the functional status of MDSCs.
Methods
Patients
Thirty-nine newly diagnosed MDS patients (24 male; median age 62 yr (range 52–70 yr); Table 1) were enrolled in the haematology department of Tianjin Medical University General Hospital from December 2018 to January 2020. Patients were categorised according to the World Health Organization classification, including MDS with single lineage dysplasia (MDS-SLD, n = 7), MDS with multilineage dysplasia (MDS-MLD, n = 8), MDS-RS with multilineage dysplasia (MDS-RS-MLD, n = 2), MDS with excess blasts 1(MDS-EB-1, n = 7), MDS with excess blasts 2 (MDS-EB-2, n = 11) and MDS unclassifiable (MDS-U, n = 4). Nineteen normal controls (NCs; median age 49 yr (range 46–54 yr) were also enrolled. According to the IPSS-R scoring system, we defined the higher-risk MDS group as those with a score >3.5, and the lower-risk MDS group as those with a score of ≤ 3.5. There was no difference in the age and the sex ratio between MDS patients and NCs (P > 0.05).
Table 1.
Clinical features of MDS patients.
| Sample | Sex | Age | WHO subtype | Blasts of BM (%) | Hb (g/l) | PLT (×109/l) | ANC (×109/l) | Cytogenetics | IPSS-R |
|---|---|---|---|---|---|---|---|---|---|
| 01 | Male | 56 | MDS-EB-1 | 9 | 63 | 24 | 1.3 | (–) | 5.5 |
| 02 | Male | 74 | MDS-EB-2 | 15.5 | 70 | 155 | 0.51 | (–) | 6 |
| 03 | Female | 63 | MDS-EB-1 | 8 | 42 | 34 | 2.23 | (–) | 5.5 |
| 04 | Female | 63 | MDS-EB-2 | 19 | 74 | 37 | 0.59 | 5q−, 20q− | 7 |
| 05 | Male | 54 | MDS−U | 1 | 48 | 83 | 0.82 | (–) | 3 |
| 06 | Female | 33 | MDS-SLD | 4 | 117 | 137 | 2.32 | (–) | 2 |
| 07 | Female | 83 | MDS-SLD | 1 | 79 | 114 | 1.64 | 5q− | 2.5 |
| 08 | Male | 47 | MDS-MLD | 0 | 66 | 15 | 0.41 | (–) | 3 |
| 09 | Female | 64 | MDS-SLD | 0 | 87 | 219 | 2.21 | (–) | 2 |
| 10 | Male | 59 | MDS-MLD | 0 | 112 | 50 | 0.41 | (–) | 2 |
| 11 | Female | 43 | MDS-MLD | 0 | 56 | 34 | 1.72 | (–) | 3.5 |
| 12 | Female | 57 | MDS-SLD | 2.5 | 58 | 165 | 1.24 | (–) | 3.5 |
| 13 | Male | 49 | MDS-SLD | 0 | 110 | 44 | 1.47 | (–) | 2 |
| 14 | Male | 63 | MDS-EB-2 | 12 | 50 | 3 | 0.26 | (–) | 7 |
| 15 | Female | 65 | MDS-EB-2 | 19 | 80 | 89 | 0.3 | (–) | 6 |
| 16 | Male | 71 | MDS-RS-MLD | 3 | 91 | 80 | 1.17 | 7q− | 4.5 |
| 17 | Male | 74 | MDS-U | 1 | 61 | 78 | 1.33 | 20q−, +8 | 4 |
| 18 | Female | 42 | MDS-EB-2 | 16.5 | 67 | 6 | 0.7 | −7 | 9 |
| 19 | Female | 73 | MDS-EB-1 | 8 | 102 | 295 | 0.37 | (–) | 3.5 |
| 20 | Female | 57 | MDS-EB-1 | 5.5 | 112 | 35 | 1.05 | (–) | 3 |
| 21 | Male | 40 | MDS-MLD | 2 | 72 | 63 | 2.41 | (–) | 3 |
| 22 | Male | 39 | MDS-EB-1 | 9 | 64 | 139 | 1.46 | (–) | 3.5 |
| 23 | Male | 40 | MDS-MLD | 1 | 89 | 35 | 1.39 | (–) | 3 |
| 24 | Male | 71 | MDS-U | 1 | 138 | 61 | 4.07 | 5q−, +8, −Y | 3.5 |
| 25 | Male | 69 | MDS-SLD | 0.5 | 126 | 333 | 0.84 | 7q−, 20q− | 3 |
| 26 | Male | 67 | MDS-EB2 | 13.5 | 86 | 17 | 0.47 | +8 | 7.5 |
| 27 | Male | 61 | MDS-EB2 | 18.5 | 78 | 34 | 10.35 | 20q− | 6.5 |
| 28 | Male | 62 | MDS-EB2 | 15 | 66 | 112 | 0.19 | (–) | 6 |
| 29 | Male | 30 | MDS-SLD | 0.5 | 66 | 14 | 5.63 | 7q− | 4.5 |
| 30 | Male | 78 | MDS-U | 4.5 | 88 | 52 | 0.88 | (–) | 3.5 |
| 31 | Male | 72 | MDS-RS-MLD | 0 | 104 | 21 | 2.18 | 7q− | 3 |
| 32 | Male | 62 | MDS-EB-2 | 18.5 | 75 | 30 | 11.03 | 20q− | 6.5 |
| 33 | Male | 74 | MDS-EB-2 | 10.5 | 95 | 42 | 2.6 | (–) | 6 |
| 34 | Male | 59 | MDS-EB-1 | 5 | 87 | 213 | 4.47 | 5q−; −7 | 6 |
| 35 | Male | 71 | MDS-MLD | 1 | 118 | 76 | 3.79 | (–) | 1.5 |
| 36 | Female | 67 | MDS-EB-1 | 6.5 | 60 | 23 | 1.1 | (–) | 5.5 |
| 37 | Female | 42 | MDS-MLD | 0 | 64 | 39 | 0.69 | 20q− | 4 |
| 38 | Female | 60 | MDS-MLD | 0 | 65 | 53 | 1.44 | (–) | 3 |
| 39 | Female | 66 | MDS-EB-2 | 18.5 | 81 | 44 | 6.66 | (–) | 6 |
MDS: myelodysplastic syndromes; BM: bone marrow; Hb: haemoglobin; PLT: platelet; ANC: absolute neutrophil count.
This study was approved by the Ethics Committee of Tianjin Medical University. Informed written consent was obtained from all participants following the Declaration of Helsinki.
Sorting MDSCs and separating PBMCs
Ten ml of BM was obtained from MDS patients and NCs, and a threefold volume of red blood cell lysing solution (Solarbio, Beijing, PR China) was added. Red cells were incubated in the dark for 15 min at 4°C and washed twice with PBS, and 40 µl Lin/HLA-DR/CD33 Abs were added to identify surface markers of MDSCs and co-incubated in the dark for 30 min at 4°C and then washed with PBS. Cells were collected by FACS Aria II (BD Biosciences, San Jose, CA). PBMCs from NCs were isolated by density gradient centrifugation using Ficoll solution (Solarbio) according to the manufacturer’s instructions.
Real-time PCR
The expression of IL-10, IL-12, TGF-β and TNF-α genes in MDSCs was detected by real-time quantitative PCR. Purified MDSCs of MDS patients and NCs were lysed using TRIzol reagent (Invitrogen Life Technologies, Carlsbad, CA). After phase separation and RNA precipitation with chloroform and isopropanol, RNA was washed with 75% ice absolute ethanol. Then, RNA was reversed transcribed with a DNA synthesis kit (Takara Bio, Inc., Shiga, Japan) according to the manufacturer’s protocol. The primers are listed in Table 2. Reactions were performed using the Bio-Rad iQ5 Real-Time System (Bio-Rad, Hercules, CA) and SYBR Green I kit (Takara Bio). The mRNA levels of IL-10, IL-12, TGF-β and TNF-α were normalised to correction with β-actin, and the relative expression of mRNA was calculated by the 2−ΔΔCt method.
Table 3.
Percentage of blast cells in BM and of peripheral blood T lymphocyte subsets of MDS patients, determined by flow cytometry.
| Sample | Blasts of BM (%) | CD3+CD8+ cells (%) | CD3+CD4+ cells (%) | CD4+/CD8+ ratio |
|---|---|---|---|---|
| 01 | 6.72 | 19.4 | 41.01 | 2.11 |
| 02 | / | 26.24 | 57.08 | 2.18 |
| 05 | 0 | 32.41 | 39.13 | 1.21 |
| 06 | 0.64 | 28.76 | 39.99 | 1.39 |
| 07 | 0.16 | 38.38 | 40.05 | 1.04 |
| 08 | 0 | 39 | 44.18 | 1.13 |
| 09 | 0 | 47.04 | 26.95 | 0.57 |
| 10 | 0 | 44.98 | 44.66 | 2.11 |
| 11 | 0 | 20.12 | 42.43 | 1.62 |
| 12 | 2.29 | 33.5 | 54.24 | 5.5 |
| 13 | 0 | 8.53 | 46.88 | 0.99 |
Table 2.
Primer sequence of IL-10, IL12, TGF-β, TNF-α and β-actin in PCR.
| Target gene | Primer sequences |
|---|---|
| IL-10 | F: 5′-CTGCCTAACATGCTTCGAGAT-3′ R: 5′-CAACCCAGGTAACCCTTAAAGT-3′ |
| IL-12 | F: 5′-GGTATCACCTGGACCTTGGA-3′ R: 5′-GCTTAGAACCTCGCCTCCTT-3′ |
| TGF-β | F: 5′-TTGAGGGCTTTCGCCTTAG-3′ R: 5′-GGTAGTGAACCCGTTGATGT-3′ |
| TNF-α | F: 5′-CGTCTCCTACCAGACCAAGG-3′ R: 5′-GGAAGACCCCTCCCAGATAG-3′ |
| β-actin | F: 5′-TTGCCGACAGGATGCAGAA-3′ R: 5′-GCCGATCCACACGGAGTACT-3′ |
F: forward primer; R: reverse primer.
Culture MDSCs
Purified MDSCs were cultivated with 10% FBS (containing 60 mg/l penicillin and 100 mg/l streptomycin; Gibco, Grand Island, NY) at 37°C in a 5% CO2 incubator, and adding 50 ng/ml recombinant human granulocyte–monocyte (GM) CSF (PeproTech, Inc., Rocky Hill, NJ) to co-incubate. The culture supernatants were collected after 48 h for ELISA.
ELISA
MDSC culture supernatants from the MDS patients and NCs were harvested. The levels of IL-10, IL-12, TGF-β and TNF-α were measured by using the human IL-10, human IL-12, human TGF-β and human TNF-α ELISA kits (MultiSciences, Hangzhou, PR China) according to the manufacturer’s instructions.
Co-culture of PBMCs from NC with MDSCs from MDS
To investigate whether MDSCs from MDS (MDS-MDSCs) could induce Tregs from CD4+ conventional T cells, 2 × 10⁵ PBMCs from NCs (NC-PBMCs) and MDS-MDSCs at a ratio of 1:1 were supplemented with 10% FBS (containing 60 mg/l penicillin and 100 mg/l streptomycin, and 1 µg/ml anti-CD3 (OKT, eBioscience, San Diego, CA) and 1 µg/ml anti-CD28 (CD28.2, eBioscience)) were added and co-cultured at 37°C in a 5% CO2 incubator for 48 h. The percentage of Tregs was detected by FACS Calibur flow cytometer (BD Biosciences).
Flow cytometry analysis
One hundred µl of peripheral blood from MDS patients and NCs was collected. The specimens were incubated with 15 µl Lin/HLA-DR/CD33 Abs at 4°C for 15 min. Then, they were divided into tubes with CD80, CD86, CD206, CD66b and CD163 Abs, and incubated in the dark for 15 min at 4°C. CD68 was added after permeabilising the cell membrane. The data were collected on a flow cytometer (Beckman Coulter, Brea, CA), and the results were analysed with Kaluza software (Beckman Coulter).
The specimens were incubated with 15 µl CD4/CD25 and their isotype control Abs at 4°C for 30 min. After incubation, erythrocytes were lysed with 2 ml erythrolysin for 10 min and washed twice with PBS. After permeabilising the cell membrane using an IntraSure Kit (BD Biosciences), 5 μl Foxp3 Ab was added to the cells, incubated for 20 min at 4°C in the dark and then washed twice with PBS. Finally, 5 × 10⁵ cells per tube were detected by flow cytometry. After NC-PBMCs and MDS-MDSCs were co-cultured, they were co-incubated with CD4/CD25/Foxp3 Abs in the same way. The phenotype of the Tregs was analysed for the cell markers CD4, CD25 and Foxp3. All data were collected on the FACS Calibur flow cytometer (BD Biosciences) and analysed using CellQuest v3.1 (BD Biosciences).
The labelled Abs included Lin-FITC (BD Biosciences), HLA-DR-PerCP (L243; BD Biosciences), CD33-APC (WM53; BD Biosciences), CD80-PE (2D10; BioLegend, San Diego, CA), CD86-PE (BU63; BioLegend), CD206-PE (15-2; BioLegend), CD66b-PE (G10F5; BioLegend), CD163-PE (GHI/61; BioLegend), CD68-PE (Y1/82A; BioLegend), CD4-PE (L200; BD Biosciences), CD25-FITC (M-A251; BD Biosciences) and Foxp3-APC (236A/E7; BD Biosciences). The above Abs were added as described by the manufacturer.
Statistical analysis
GraphPad Prism v7.00 (GraphPad Software, Inc., La Jolla, CA) was used for data analysis. Statistical differences between two groups were analysed using Student’s t-test. One-way ANOVA was used to compare three groups or more. A linear correlation test was used for correlation analysis. All data are presented as the mean ± standard error of the mean (normal distribution data) or median (25% percentile–75% percentile; non-normal distribution data).
Results
Expression of different markers in MDSCs
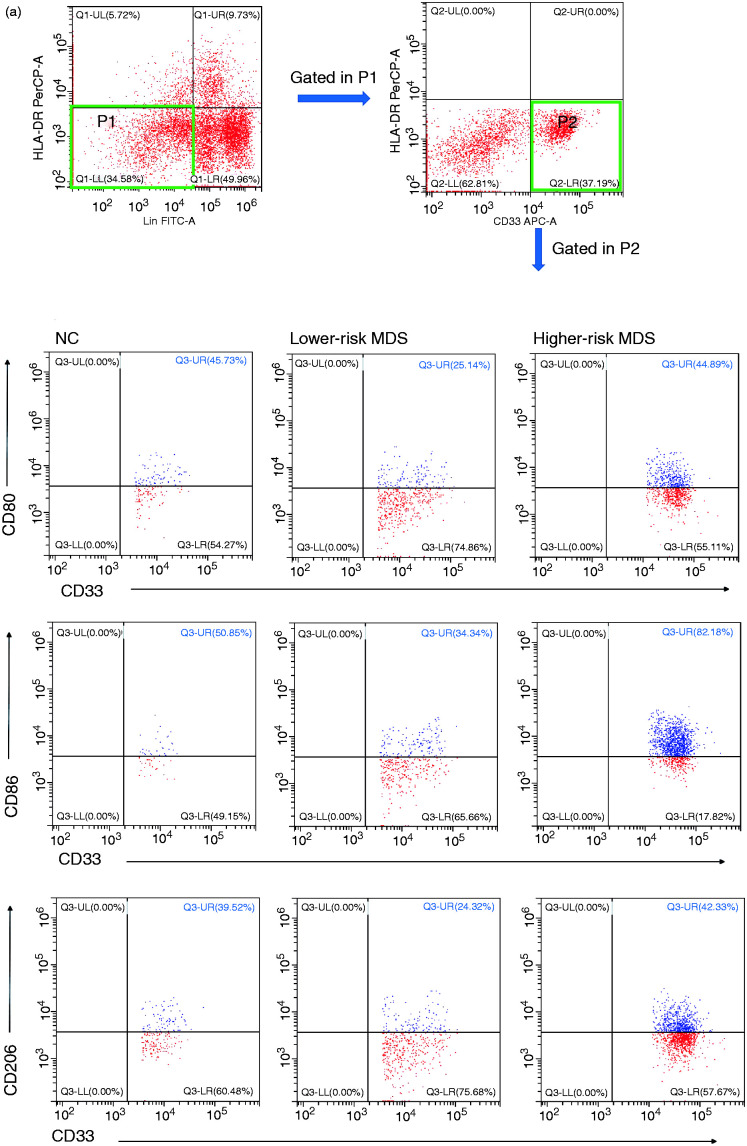
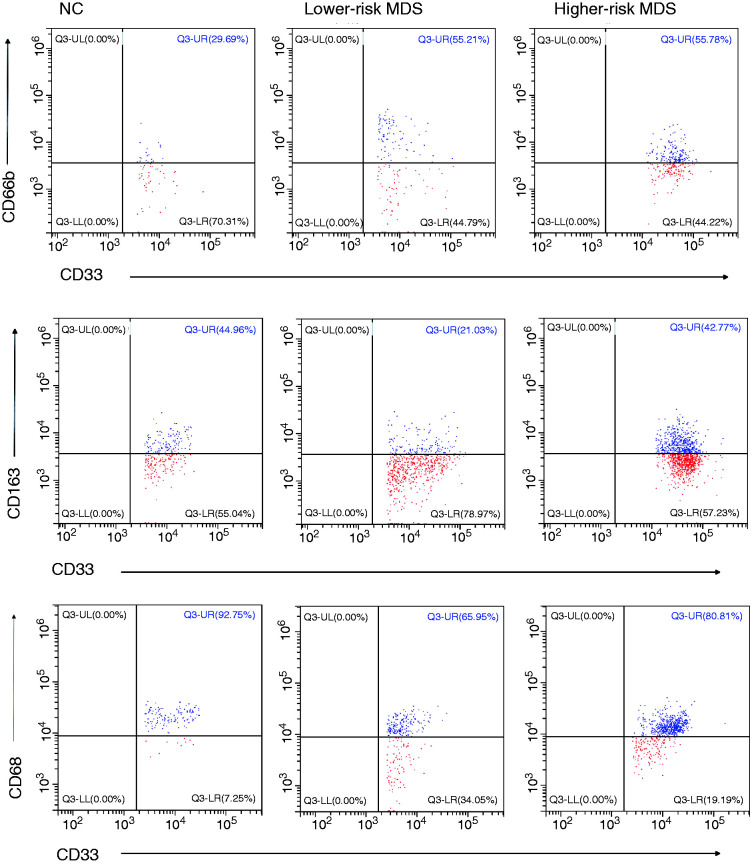
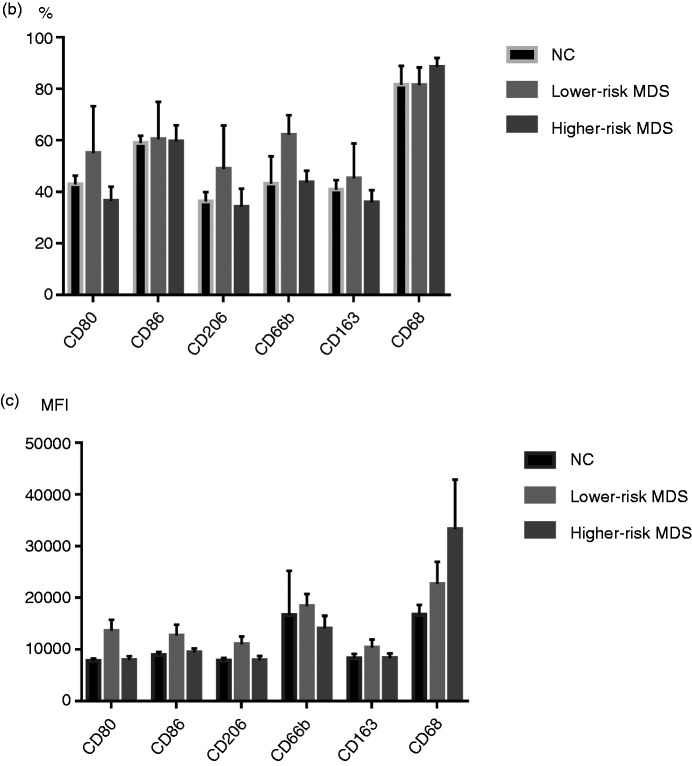
According to the different markers of M1- and M2-like macrophages, we selected CD80, CD86, CD206, CD66b, CD163 and CD68 to mark MDSCs, and the results showed no difference in the expression of those markers between higher-risk MDS, lower-risk MDS and NCs (CD80: 36.5 ± 5.51% vs. 55.01 ± 18.29% vs. 42.94 ± 3.45%, respectively; P = 0.4108; CD86: 59.51 ± 6.36% vs. 60.49 ± 14.44% vs. 58.98 ± 2.85%, respectively; P > 0.05; CD206: 34.19 ± 7.08% vs. 48.97 ± 16.86% vs. 36.33 ± 3.65%, respectively; P = 0.5333; CD66b: 43.70 ± 4.59% vs. 62.13 ± 7.69% vs. 43.2 ± 10.58%, respectively; P = 0.2214; CD163: 35.92 ± 4.80% vs. 45.28 ± 13.49% vs. 40.87 ± 3.74%, respectively; P = 0.6732; CD68: 88.55 ± 3.46% vs. 81.48 ± 6.90% vs. 81.60 ± 7.39%, respectively; P = 0.6046; Figure 1a and b). There was no difference in mean fluorescence intensity (MFI) of CD80, CD86, CD206, CD66b, CD163 and CD68 in MDSCs between higher-risk MDS, lower-risk MDS and NCs (CD80: P = 0.1045; CD86: P = 0.1019; CD206: P = 0.0720; CD66b: P = 0.2573; CD163: P = 0.4495; CD68: P = 0.2650).
Figure 1.
(a) Representative flow cytometer scatter diagrams of the proportion of CD80, CD86, CD206, CD66b, CD163 and CD68 in MDSCs from lower-risk MDS, higher-risk MDS and NCs. The cells in the P2 green rectangle were Lin– HLA-DR– CD33+ cells (MDSCs), and the upper-right quadrant represented the percentage of CD80, CD86, CD206, CD66b, CD163 and CD68 in MDSCs. (b) The histogram represents the percentage of CD80, CD86, CD206, CD66b, CD163 and CD68 in MDSCs. (c) The histogram represents the MFI of CD80, CD86, CD206, CD66b, CD163 and CD68 in MDSCs. MDSC: myeloid-derived suppressor cells; MDS: myelodysplastic syndromes; NC: normal controls; MFI: mean fluorescence intensity.
Expression of IL-10, IL-12, TGF-β and TNF-α mRNA in MDSCs of MDS patients and NCs
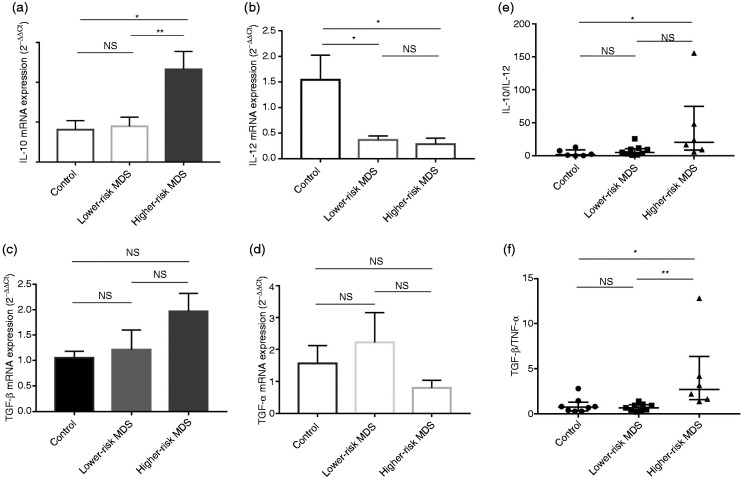
After sorting MDSCs by flow cytometry, we detected IL-10, IL-12, TGF-β and TNF-α mRNA expression in these cells from lower-risk MDS, higher-risk MDS patients and NCs. IL-10 mRNA in MDSCs in higher-risk MDS was higher than that in lower-risk MDS and NC (4.65 ± 0.90 vs. 1.79 ± 0.46 vs. 1.62 ± 0.46, respectively; P = 0.0050; Figure 2a). IL-12 mRNA in MDSCs in higher-risk MDS and lower-risk MDS was lower than that in NC (0.28 ± 0.12 vs. 0.37 ± 0.08 vs. 1.54 ± 0.48, respectively; P = 0.0085; Figure 2b). There was no difference in TGF-β and TNF-α mRNA expression between higher-risk MDS, lower-risk MDS and NCs (TGF-β: 1.97 ± 0.35 vs. 1.21 ± 0.39 vs. 1.05 ± 0.13, respectively; P = 0.1721; TNF-α: 0.80 ± 0.24 vs. 2.22 ± 0.94 vs. 1.56 ± 0.56, respectively; P = 0.4288; Figure 2c and d).
Figure 2.
Expression of IL-10 (a), IL-12 (b), TGF-β (c) and TNF-α (d) mRNA and the ratio of IL-10/IL-12 mRNA (e) and TGF-β/TNF-α mRNA (f) in MDSCs from NCs, lower-risk MDS and higher-risk MDS, determined by quantitative RT-PCR. *P < 0.05; **P < 0.01; NS=not significant.
Ratio of IL-10/IL-12 and TGF-β/TNF-α mRNA in MDSCs
To determine the functional status of MDSCs in MDS, we compared the ratio of tumour-promoting factors (IL-10 and TGF-β) to tumour-suppressing factors (IL-12 and TNF-α). We found that MDSCs highly expressed IL-10 and TGF-β in the higher-risk MDS group. The ratio of IL-10/IL-12 mRNA and TGF-β/TNF-α mRNA relative expression in higher-risk MDS was higher than that in lower-risk MDS and NCs (IL-10/IL-12: 20.2 (8.54–75.12) vs. 5.13 (2.23–25.63) vs. 1.80 (0.33–8.93), respectively; P = 0.0145; Figure 2e; TGF-β/TNF-α: 2.69 (1.56–6.35) vs. 0.64 (0.37–0.99) vs. 0.73 (0.30–2.79), respectively; P = 0.0055; Figure 2f).
Ratio of IL-10/IL-12 and TGF-β/TNF-α levels in MDSC culture supernatants
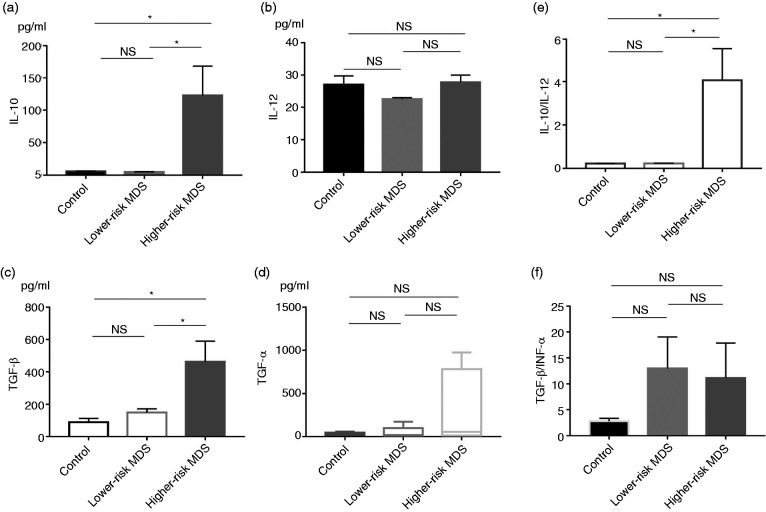
To detect the levels of these cytokines secreted by MDSCs, we cultured MDSCs in vitro for 48 h. The culture supernatants were collected, and the levels of IL-10, IL-12, TGF-β and TNF-α were detected by ELISA. The levels of IL-10 and TGF-β in higher-risk MDS were higher than those in lower-risk MDS and NCs (IL-10: 122.3 ± 46.11 pg/ml vs. 5.08 ± 0.32 pg/ml vs. 5.98 ± 0.53 pg/ml, respectively; P = 0.0065; TGF-β: 462.3 ± 128.2 pg/ml vs. 149.8 ± 22.67 pg/ml vs. 88.97 ± 24.05 pg/ml, respectively; P = 0.0169; Figure 3a and c). There was no difference in levels of IL-12 and TNF-α between higher-risk MDS, lower-risk MDS and NC (IL-12: 27.62 ± 2.39 pg/ml vs. 22.44 ± 0.46 pg/ml vs. 26.88 ± 2.91 pg/ml, respectively; P = 0.2668; TNF-α: 55.89 (12.51–781.6) pg/ml vs. 17.81 (6.60–99.94) pg/ml vs. 26.05 (18.99–47.38) pg/ml, respectively; P = 0.4914; Figure 3b and d). The ratio of IL-10/IL-12 in higher-risk MDS was higher than that in lower-risk MDS and NC (4.06 ± 1.50 vs. 0.23 ± 0.02 vs. 0.22 ± 0.01, respectively; P = 0.0060; Figure 3e). The ratio of TGF-β/TNF-α level in higher-risk MDS and lower-risk MDS had an increasing trend compared to the NC group, but there was no significant difference (4.21 (0.66–21.52) vs. 7.26 (1.46–27.37) vs. 3.30 (1.54–3.74), respectively; P = 0.2569; Figure 3f).
Figure 3.
Levels of IL-10 (a), IL-12 (b), TGF-β (c), and TNF-α (d) and the ratio of IL-10/IL-12 (e) and TGF-β/TNF-α (f) levels in MDSCs culture supernatants from NCs, lower-risk MDS and higher-risk MDS determined by ELISA. *P < 0.05.
Correlation analysis between the ratio of IL-10/IL-12 mRNA, TGF-β/TNF-α mRNA in MDSCs and clinical parameters in MDS patients
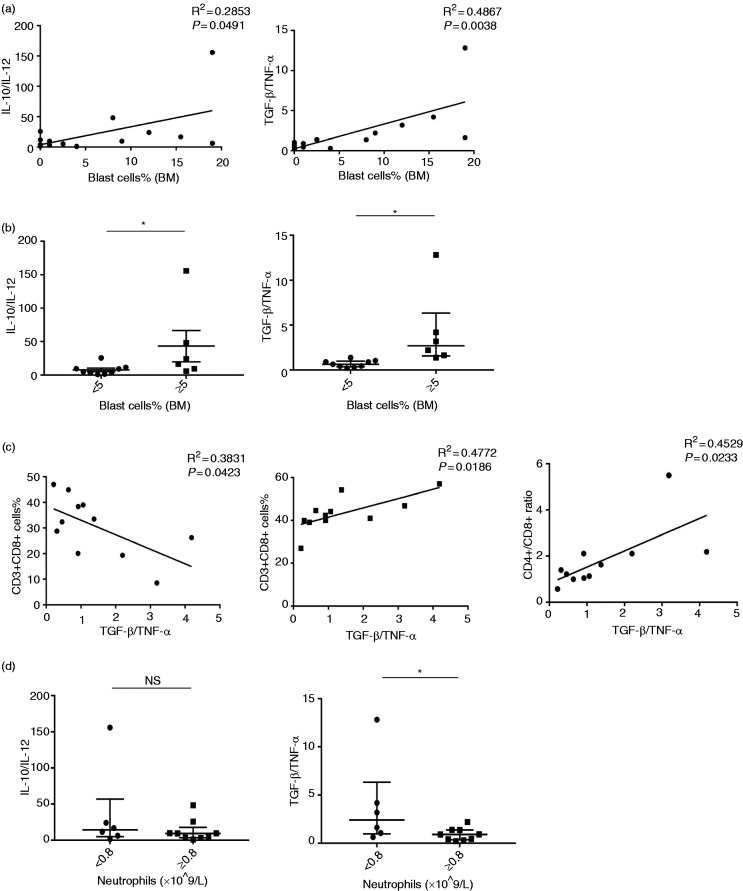
First, we made the correlation between the ratio of IL-10/IL-12 mRNA, TGF-β/TNF-α mRNA in MDSCs and the percentage of blast cells in BM from MDS patients (including both the lower-risk MDS group and the higher-risk MDS group). The ratio of IL-10/IL-12 mRNA and TGF-β/TNF-α mRNA in MDSCs was positively correlated with the percentage of blast cells in BM from MDS patients (IL-10/IL-12: R2 = 0.2853, P = 0.0491; TGF-β/TNF-α: R2 = 0.4867, P = 0.0038; Figure 4a). Moreover, the ratio of IL-10/IL-12 mRNA and TGF-β/TNF-α mRNA relative expression in MDSC was higher in MDS patients whose percentage of blasts in BM was >5% than in those with blasts <5% (IL-10/IL-12: 20.2 (8.54–75.12) vs. 5.13 (2.22–10.57), P = 0.0360; TGF-β/TNF-α: 4.23 ± 1.77 vs. 0.70 ± 0.13, P = 0.0279; Figure 4b).
Figure 4.
Correlation analysis between the ratios of IL-10/IL-12 mRNA and TGF-β/TNF-α mRNA in MDSCs and clinical parameters in MDS patients. (a) Percentage of blast cells in bone marrow was positively correlated with the ratio of IL-10/IL-12 mRNA and TGF-β/TNF-α mRNA in MDSCs of MDS patients. (b) Dot diagrams present the ratio of IL-10/IL-12 mRNA relative expression in patients with bone marrow blasts < 5% and blasts ≥ 5% MDS. (c) Correlation analysis between the ratio of TGF-β/TNF-α mRNA in MDSCs and peripheral blood T lymphocyte subsets (CD3+CD8+ cells %; CD3+CD4+ cells %; CD4+/CD8+ ratio) of MDS patients. (d) Ratio of IL-10/IL-12 mRNA relative expression in patients with an absolute neutrophil count (ANC) < 0.8 × 10⁹/l and patients with an ANC of ≥ 0.8 × 10⁹/l. *P < 0.05.
Immune disorders might contribute to the pathogenesis of MDS, and MDSCs could inhibit an anti-tumour immune response. So, we looked at the correlation between the ratio of TGF-β/TNF-α mRNA in MDSCs and peripheral blood T lymphocyte subsets of MDS (Table 3). We found that the ratio of TGF-β/TNF-α mRNA in MDSCs was negatively correlated with the percentage of CD3+CD8+ T lymphocytes (R2 = 0.3831, P = 0.0423), and positively correlated with the percentage of CD3+CD4+ T lymphocytes (R2 = 0.4747, P = 0.0132) and CD4+/CD8+ ratio (R2 = 0.4529, P = 0.0233; Figure 4c) in MDS patients.
We also analysed the relationship between blood routine and MDSC polarisation from MDS and found that TGF-β/TNF-α was higher in patients with an absolute neutrophil count (ANC) <0.8 × 10⁹/l than in patients with an ANC of ≥ 0.8 × 10⁹/l (2.41 (0.96–12.83) vs. 0.91 (0.37–1.38), P = 0.0360). However, the ratio of IL-10/IL-12 was not significant (14.08 (4.88–56.87) vs. 9.22 (3.35–17.59), P = 0.3884; Figure 4d).
Percentage of Treg (CD4+CD25+Foxp3+) cells in CD4+ T cells increased in PBMC from NCs co-cultured with MDSCs from MDS
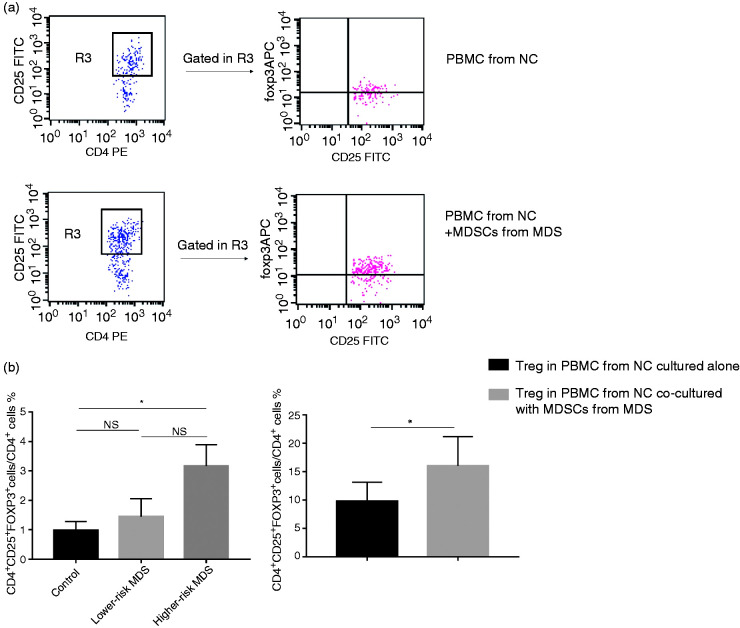
The percentage of Tregs (CD4+CD25+Foxp3+) in CD4+ T cells from higher-risk MDS was higher than from NCs and lower-risk MDS, but there was no significant difference between higher-risk MDS and lower-risk MDS due to the fewer cases (3.17 ± 0.73 vs. 0.98 ± 0.30 vs. 1.44 ± 0.62, respectively; P = 0.0374; Figure 5b). Due to the ratio of TGF-β/TNF-α, mRNA in MDSCs was positively correlated with the percentage of CD3+CD4+ T lymphocytes and increased Treg % in higher-risk MDS. We co-cultured PBMC from NCs with MDSCs from MDS to research the effect of MDSCs on Tregs. We found that the percentage of Tregs (CD4+CD25+Foxp3+) in CD4+ T cells from NC-PBMCs co-cultured with MDS-MDSCs was higher than from NC-PBMCs cultured alone (16.03 ± 5.15 vs. 9.79 ± 3.36, P = 0.0305; Figure 5a and c).
Figure 5.
Percentage of Tregs (CD4+CD25+Foxp3+ cells) in CD4+ T cells from NCs in vitro. PBMC were cultured with 10% FBS (containing 1 µg/ml anti-CD3 and 1 µg/ml anti-CD28). (a) Representative flow cytometer scatter diagrams of the proportion of Tregs in CD4+ T cells were shown in PBMC from NC cultured alone, and PBMC from NC co-cultured with MDSCs from MDS. The rectangle R3 presents the percentage of CD4+CD25+ T cells in CD4+ T cells, and the upper-right quadrant represent the percentage of CD25+Foxp3+ cells in CD4+CD25+ T cells. (b) The histogram represents the percentage of CD4+CD25+Foxp3+ cells in CD4+ T cells from NCs, lower-risk MDS and higher-risk MDS. (c) The histogram represents the percentage of CD4+CD25+Foxp3+ cells in CD4+ T cells from PBMC from NCs cultured alone and PBMCs from NCs co-cultured with MDSCs from MDS. *P < 0.05. Treg: regulatory T cells.
Discussion
MDSCs have been confirmed to be a major regulator of immunosuppression in tumours and other pathological conditions. They exert inhibition in various ways, such as expression inhibitory ligand (PD-L1) and immunosuppressive molecules (ROS, VEGF, IL-10, TGF-β), and deplete the extracellular microenvironment of essential nutrients for T cells.26 MDSCs were significantly increased in the BM of MDS patients.7 Chen et al.28 found that MDSCs might promote ineffective haematopoiesis of BM, and inhibited the proliferation and function of T cells in MDS. The interaction between pro-inflammatory cytokine S100A9 and CD33 drives the proliferation of MDSCs, which induces the secretion of inhibitory cytokines IL-10 and TGF-β by immature myeloid cells.29
Macrophages can be polarised into two forms – classically activated or M1 macrophages and alternatively activated or M2 macrophages – with different functions in the tumour micro-environment.30,31 M1 or M2 macrophages express their specific markers such as CD80, CD86, CD68, CD206 and CD163.32 CD66b is highly expressed on tumour-associated neutrophils.33 We selected those markers to mark MDSCs, but there was no difference in expression of those different markers between higher-risk MDS, lower-risk MDS and NCs. This result suggests that these markers of macrophages may not be suitable for MDSCs. MDSCs are a heterogeneous population of immature myeloid cells group. Different markers of MDSCs in different polarisation directions may need to be evaluated by detecting gene profiles. According to the type and stage of the disease, MDSCs contains immature and mature differentiation stages of myeloid cells. There is still a lack of unique phenotypic markers for MDSC. Therefore, it is essential to analyse the function of MDSCs and to help to evaluate the characteristics of MDSCs. Here, we detected IL-10, IL-12, TGF-β and TNF-α mRNA expression in MDSCs and the levels of IL-10, IL-12, TGF-β and TNF-α in the MDSC culture supernatants from MDS, and analysed the functional status of MDSCs based on the mRNA level. The mean of IL-10 and TGF-β mRNA relative expression in MDS was higher than that in NCs, and the mean of IL-12 and TNF-α mRNA relative expression was lower than in NCs. The ratios of IL-10/IL-12 mRNA and TGF-β/TNF-α mRNA were significantly higher in higher-risk MDS than that in lower-risk MDS and the NC group (Figure 2a and b). The difference between higher-risk and lower-risk MDS indicated that MDSCs might manifest a stronger inhibitory effect as the disease progresses. The levels of IL-10, IL-12, TGF-β and TNF-α in the MDSC culture supernatants gave similar results, but we still need to expand the number of samples to improve the data. The ratio of IL-10/IL-12 level in MDSC culture supernatants was consistent with the result of mRNA, which further illustrated that MDSCs expressed higher levels of suppressive cytokines and had a stronger immunosuppressive effect in higher-risk MDS.
Kittang et al.7 found that the number of MDSCs was significantly higher in higher-risk MDS than in lower-risk MDS, and that the BM micro-environment of MDS changes to an immunosuppressive environment as the disease progresses. We found that the ratios of IL-10/IL-12 mRNA and TGF-β/TNF-α mRNA in MDSCs were positively correlated with the percentage of BM blasts from MDS patients, and the ratios of IL-10/IL-12 mRNA and TGF-β/TNF-α mRNA relative expression were higher in patients with BM blast cells of ≥ 5% than blast cells < 5%. This suggests that MDSCs might enhance immunosuppression during disease progression. Studies have found that drugs that inhibit tumour proliferation, such as curcumin and docetaxel, might affect the functional status of MDSCs.34 Accurate assessing the functional status of MDSC and reducing the secretion of suppressive cytokines in MDSC might contribute to disease treatment.
MDS is characterised by ineffective haematopoiesis and cytopenia.35 ANC is also included in the IPSS-R scoring system, but there are fewer studies on ANC reduction. Our research found that TGF-β/TNF-α was higher in patients with an ANC < 0.8 × 10⁹/l than in patients with an ANC of ≥ 0.8 × 10⁹/l, suggesting that MDSCs which secrete higher TGF-β might promote the ineffective haematopoiesis of MDS, especially the impact on neutrophils. Further research on the specific impact mechanisms is needed.
The immune status of MDS is severely imbalanced. CD8+ T cell ‘exhaustion’, the imbalance of the Th1/Th2 ratio and expanded Tregs exist in MDS.3,6 Our previous research found that MDSCs from MDS have obvious inhibition on CD8+ T cells in vitro.36 Here, we found that the number of CD8+ T cells decreased, and the number of CD4+ T cells increased in MDS when MDSC expressed a higher TGF-β/TNF-α mRNA ratio. This result further demonstrated that MDSC had an inhibitory effect on CD8+ T cells, and the inhibition of MDSCs might depend on the TGF-β/TNF-α ratio. Th1/Th2 imbalance and Treg expansion in higher-risk MDS induces a CD4+/CD8+ T cell imbalance.6,37 The ratio of TGF-β/TNF-α mRNA in MDSCs was positively correlated with the percentage of CD3+CD4+ T lymphocytes, and the CD4+/CD8+ ratio might indicate that MDSCs promoted the proliferation of Th2 cells or Tregs, especially MDSCs with a higher TGF-β/TNF-α mRNA ratio. After PBMCs from NCs were co-cultured with MDSCs from MDS, Treg cells were amplified. It is suggested that MDS-MDSCs might induce Tregs from CD4+ conventional T cells, and then destroy the immune balance.
In conclusion, IL-10/IL-12 mRNA and TGF-β/TNF-α mRNA ratios were higher in MDSCs from higher-risk MDS than those in the lower-risk MDS and NC groups. MDSCs might be related to a poor prognosis and have a stronger immunosuppressive effect, especially MDSCs with higher IL-10/IL-12 and TGF-β/TNF-α ratios. Detection of the secretion of cytokines in MDSCs might help to evaluate the inhibition of MDSCs and the prognosis of MDS. The ratio of IL-10/IL-12 and TGF-β/TNF-α might quantify the functional status of MDSCs, which provides a new method for evaluating immune imbalance in MDS patients. A clearer way to differentiate MDSCs based on their function is needed in the future.
Footnotes
Declaration of conflicting interests: The author(s) declared no potential conflicts of interest with respect to the research, authorship and/or publication of this article.
Funding: The author(s) disclosed receipt of the following financial support for the research, authorship and/or publication of this article: This study was sponsored by the National Science Foundation for Young Scientists of China (Grant Number: 81500101), the National Natural Science Foundation of China (Grant Number: 81570111), the Natural Science Foundation of Tianjin City (Grant Number: 16JCZDJC35300).
ORCID iD: Zonghong Shao https://orcid.org/0000-0002-8283-8020
References
- 1.Nimer SD. Myelodysplastic syndromes. Blood 2008; 111: 4841–4851. [DOI] [PubMed] [Google Scholar]
- 2.Arber DA, Orazi A, Hasserjian R, et al. The 2016 revision to the World Health Organization classification of myeloid neoplasms and acute leukemia. Blood 2016; 127: 2391–2405. [DOI] [PubMed] [Google Scholar]
- 3.Tao J, Li L, Wang Y, et al. Increased TIM3+CD8+T cells in myelodysplastic syndrome patients displayed less perforin and granzyme B secretion and higher CD95 expression. Leuk Res 2016; 51: 49–55. [DOI] [PubMed] [Google Scholar]
- 4.Jiang H, Fu R, Wang H, et al. CD47 is expressed abnormally on hematopoietic cells in myelodysplastic syndrome. Leuk Res 2013; 37: 907–910. [DOI] [PubMed] [Google Scholar]
- 5.Aanei CM, Catafal LC. Evaluation of bone marrow microenvironment could change how myelodysplastic syndromes are diagnosed and treated. Cytometry A 2018; 93: 916–928. [DOI] [PubMed] [Google Scholar]
- 6.Hamdi W, Ogawara H, Handa H, et al. Clinical significance of Th1/Th2 ratio in patients with myelodysplastic syndrome. Int J Lab Hematol 2009; 31: 630–638. [DOI] [PubMed] [Google Scholar]
- 7.Kittang AO, Kordasti S, Sand KE, et al. Expansion of myeloid derived suppressor cells correlates with number of T regulatory cells and disease progression in myelodysplastic syndrome. Oncoimmunology 2016; 5: e1062208. [DOI] [PMC free article] [PubMed] [Google Scholar]
- 8.Ostrand-Rosenberg S, Fenselau C. Myeloid-derived suppressor cells: immune-suppressive cells that impair antitumor immunity and are sculpted by their environment. J Immunol 2018; 200: 422–431. [DOI] [PMC free article] [PubMed] [Google Scholar]
- 9.Tian X, Shen H, Li Z, et al. Tumor-derived exosomes, myeloid-derived suppressor cells, and tumor microenvironment. J Hematol Oncol 2019; 12: 84. [DOI] [PMC free article] [PubMed] [Google Scholar]
- 10.Gabrilovich DI. Myeloid-derived suppressor cells. Cancer Immunol Res 2017; 5: 3–8. [DOI] [PMC free article] [PubMed] [Google Scholar]
- 11.Koehn BH, Saha A, McDonald-Hyman C, et al. Danger-associated extracellular ATP counters MDSC therapeutic efficacy in acute GvHD. Blood 2019; 134: 1670–1682. [DOI] [PMC free article] [PubMed] [Google Scholar]
- 12.Hoechst B, Gamrekelashvili J, Manns MP, et al. Plasticity of human Th17 cells and iTregs is orchestrated by different subsets of myeloid cells. Blood 2011; 117: 6532–6541. [DOI] [PubMed] [Google Scholar]
- 13.Lee-Chang C, Rashidi A, Miska J, et al. Myeloid-derived suppressive cells promote B cell-mediated immunosuppression via transfer of PD-L1 in glioblastoma. Cancer Immunol Res 2019; 7: 1928–1943, [DOI] [PMC free article] [PubMed] [Google Scholar]
- 14.Trovato R, Fiore A, Sartori S, et al. Immunosuppression by monocytic myeloid-derived suppressor cells in patients with pancreatic ductal carcinoma is orchestrated by STAT3. J Immunother Cancer 2019; 7: 255. [DOI] [PMC free article] [PubMed] [Google Scholar]
- 15.Banerjee P, Zhang R, Ivan C, et al. Trabectedin reveals a strategy of immunomodulation in chronic lymphocytic leukemia. Cancer Immunol Res 2019; 7: 2036–2051. [DOI] [PMC free article] [PubMed] [Google Scholar]
- 16.Pyzer AR, Stroopinsky D, Rajabi H, et al. MUC1-mediated induction of myeloid-derived suppressor cells in patients with acute myeloid leukemia. Blood 2017; 129: 1791–1801. [DOI] [PMC free article] [PubMed] [Google Scholar]
- 17.Panni RZ, Sanford DE, Belt BA, et al. Tumor-induced STAT3 activation in monocytic myeloid-derived suppressor cells enhances stemness and mesenchymal properties in human pancreatic cancer. Cancer Immunol Immunother 2014; 63: 513–528. [DOI] [PMC free article] [PubMed] [Google Scholar]
- 18.Movahedi K, Guilliams M, Van Den Bossche J, et al. Identification of discrete tumor-induced myeloid-derived suppressor cell subpopulations with distinct T cell-suppressive activity. Blood 2008; 111: 4233–4244. [DOI] [PubMed] [Google Scholar]
- 19.Gabrilovich DI, Ostrand-Rosenberg S, Bronte V. Coordinated regulation of myeloid cells by tumours. Nat Rev Immunol 2012; 12: 253–268. [DOI] [PMC free article] [PubMed] [Google Scholar]
- 20.Peranzoni E, Zilio S, Marigo I, et al. Myeloid-derived suppressor cell heterogeneity and subset definition. Curr Opin Immunol 2010; 22: 238–244. [DOI] [PubMed] [Google Scholar]
- 21.Mandruzzato S, Brandau S, Britten CM, et al. Toward harmonized phenotyping of human myeloid-derived suppressor cells by flow cytometry: results from an interim study. Cancer Immunol Immunother 2016; 65: 161–169. [DOI] [PMC free article] [PubMed] [Google Scholar]
- 22.Bronte V, Brandau S, Chen SH, et al. Recommendations for myeloid-derived suppressor cell nomenclature and characterization standards. Nat Commun 2016; 7: 12150. [DOI] [PMC free article] [PubMed] [Google Scholar]
- 23.Weber R, Fleming V, Hu X, et al. Myeloid-derived suppressor cells hinder the anti-cancer activity of immune checkpoint inhibitors. Front Immunol 2018; 9: 1310. [DOI] [PMC free article] [PubMed] [Google Scholar]
- 24.Noman MZ, Desantis G, Janji B, et al. PD-L1 is a novel direct target of HIF-1alpha, and its blockade under hypoxia enhanced MDSC-mediated T cell activation. J Exp Med 2014; 211: 781–790. [DOI] [PMC free article] [PubMed] [Google Scholar]
- 25.Hayashi Y, Zhang Y, Yokota A, et al. Pathobiological pseudohypoxia as a putative mechanism underlying myelodysplastic syndromes. Cancer Discov 2018; 8: 1438–1457. [DOI] [PMC free article] [PubMed] [Google Scholar]
- 26.Consonni FM, Porta C, Marino A, et al. Myeloid-derived suppressor cells: ductile targets in disease. Front Immunol 2019; 10: 949. [DOI] [PMC free article] [PubMed] [Google Scholar]
- 27.Ochando JC, Chen SH. Myeloid-derived suppressor cells in transplantation and cancer. Immunol Res 2012; 54: 275–285. [DOI] [PMC free article] [PubMed] [Google Scholar]
- 28.Chen X, Eksioglu EA, Zhou J, et al. Induction of myelodysplasia by myeloid-derived suppressor cells. J Clin Invest 2013; 123: 4595–4611. [DOI] [PMC free article] [PubMed] [Google Scholar]
- 29.Lechner MG, Liebertz DJ, Epstein AL. Characterization of cytokine-induced myeloid-derived suppressor cells from normal human peripheral blood mononuclear cells. J Immunol 2010; 185: 2273–2284. [DOI] [PMC free article] [PubMed] [Google Scholar]
- 30.Murray PJ, Wynn TA. Protective and pathogenic functions of macrophage subsets. Nat Rev Immunol 2011; 11: 723–737. [DOI] [PMC free article] [PubMed] [Google Scholar]
- 31.Shapouri-Moghaddam A, Mohammadian S, Vazini H, et al. Macrophage plasticity, polarization, and function in health and disease. J Cell Physiol 2018; 233: 6425–6440. [DOI] [PubMed] [Google Scholar]
- 32.Rhee I. Diverse macrophages polarization in tumor microenvironment. Arch Pharml Res 2016; 39: 1588–1596. [DOI] [PubMed] [Google Scholar]
- 33.Huang X, Pan Y, Ma J, et al. Prognostic significance of the infiltration of CD163(+) macrophages combined with CD66b(+) neutrophils in gastric cancer. Cancer Med 2018; 7: 1731–1741. [DOI] [PMC free article] [PubMed] [Google Scholar]
- 34.Zhou J, Donatelli SS, Gilvary DL, et al. Therapeutic targeting of myeloid-derived suppressor cells involves a novel mechanism mediated by clusterin. Sci Rep 2016; 6: 29521. [DOI] [PMC free article] [PubMed] [Google Scholar]
- 35.Boutault R, Peterlin P, Boubaya M, et al. A novel complete blood count-based score to screen for myelodysplastic syndrome in cytopenic patients. Br J Haematol 2018; 183: 736–746. [DOI] [PubMed] [Google Scholar]
- 36.Tao JL, Han D, Gao S, et al. CD8(+) T cells exhaustion induced by myeloid-derived suppressor cells in myelodysplastic syndromes patients might be through TIM3/Gal-9 pathway. J Cell Mol Med 2020; 24: 1046–1058. [DOI] [PMC free article] [PubMed] [Google Scholar]
- 37.Mailloux AW, Sugimori C, Komrokji RS, et al. Expansion of effector memory regulatory T cells represents a novel prognostic factor in lower risk myelodysplastic syndrome. J Immunol 2012; 189: 3198–3208. [DOI] [PMC free article] [PubMed] [Google Scholar]


