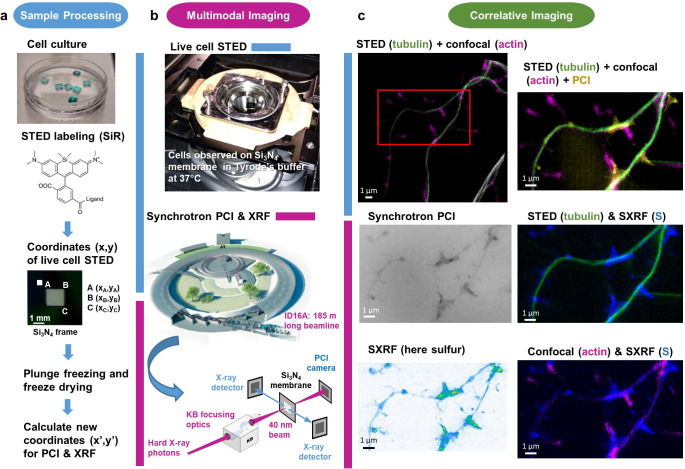
Figure 1. Workflow for correlative STED and synchrotron multimodal nano-imaging.
(a) Sample processing. Primary neurons are cultured on silicon nitride membranes and labeled with fluorescent probes designed for STED microscopy such as SiR-tubulin or SiR700-actin. STED microscopy is performed on living cells and orthonormal coordinates (x,y) of regions of interest are recorded. Immediately after STED microscopy cells are plunge-frozen and freeze-dried. New coordinates (x’,y’) of the regions of interest are calculated to perform XRF and PCI imaging on the synchrotron microscope. (b) Multi-modal imaging. Live-cell STED and confocal microscopy are performed within a thermalized chamber. Synchrotron XRF and PCI are carried out on freeze-dried samples. The KB optics are 185 m away from the X-ray source enabling to focus hard X-rays at 40 nm beam size. (c) Correlative imaging. Overlay images of STED, confocal, synchrotron PCI and XRF are produced on areas of few tens of µm large with a spatial resolution of 40 nm for STED, 30 nm for PCI and 40 nm for SXRF. Several elemental maps (here sulfur) can be super-imposed with protein distributions (i.e. actin or tubulin) in dendrites and spines at 40 nm spatial resolution.


