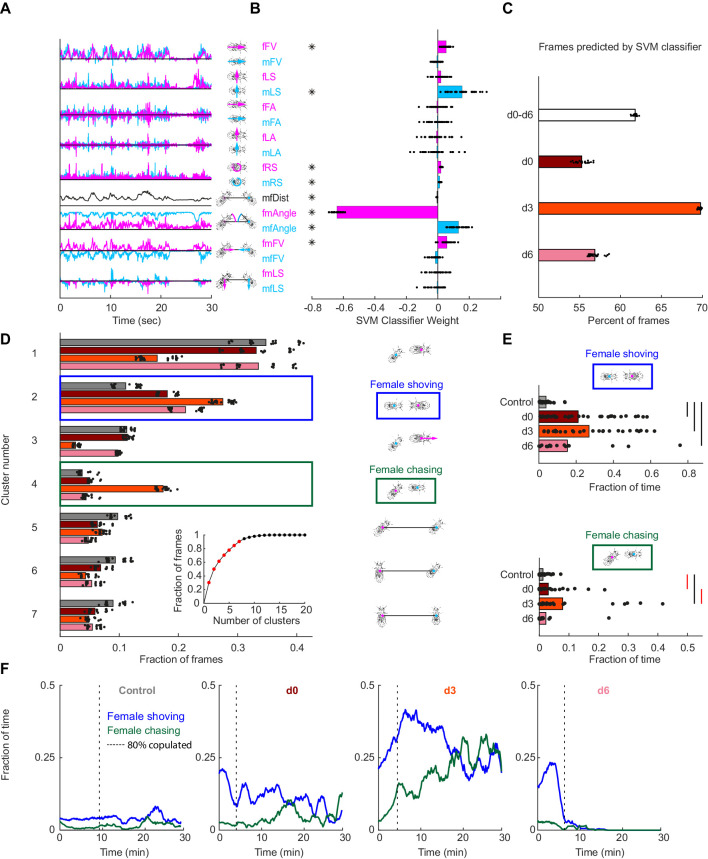
Figure 2. Automated identification of persistent female behaviors following pC1-Int activation.
(A) For each video frame, 17 parameters were extracted based on tracking of male/female position and heading (see Materials and methods for parameter definition). An example trace (30 s) is shown for each parameter. (B) 30 independent (using non-overlapping sets of video frames) Support Vector Machine (SVM) classifiers were trained to classify frames (each frame represented by 17 values) as belonging to control or experimental group (all delays d0-d6 considered together; see Materials and methods). Each classifier is represented by 17 points - one for each parameter. Each point is the weight associated with a given parameter for one classifier, and the bar height represents the mean over classifiers (*p<10−4, one-sample t-test with Bonferonni correction for multiple comparisons; see Materials and methods). (C) The percent of frames correctly classified using the SVM classifier. Each dot is the prediction of a single SVM classifier, trained to classify frames as belonging to control or experimental group (d0, d3, d6, or d0-d6 together) – 30 classifiers and their mean plotted for each group. (D) K-means was used to cluster frames based on the eight most significant parameters (marked with asterisks in (B)). The largest 7 clusters include 90.4% of the frames (see inset). Clustering was performed 30 times (black dots; bars = mean), using different but overlapping sets of frames. The same number of frames was taken from each group (see Materials and methods). Cluster 2 (blue box - ‘female shoving’) is more probable following pC1-Int activation (in d0, d3 and d6 conditions) compared to control, while cluster 4 (green box- ‘female chasing’) is more probable in the d3 condition only compared to control. At right, schematic describing the male-female interaction in each cluster, based on the mean values of the weights. (E) JAABA-based classification of shoving (top) and chasing (bottom) behaviors. Each dot represents a single pair of flies. The fraction of time the male-female pair spent shoving (0.037/0.21/0.27/0.15 for control/d0/d3/d6) or chasing (0.013/0.030/0.079/0.022) are shown. Black lines represent significant differences with p<0.05 after Bonferroni correction for multiple comparison. Red lines - significant before, but not after correction for multiple comparisons. (F) Fraction of time females spent chasing or shoving (moving average with a 2-min window), based on JAABA classification in each condition (control, d0, d3, d6). T = 0 is the time the male was introduced (see Figure 1E), and the vertical dashed line indicates the time, for each condition, when 80% of the pairs copulated. Behaviors are not scored after copulation.


