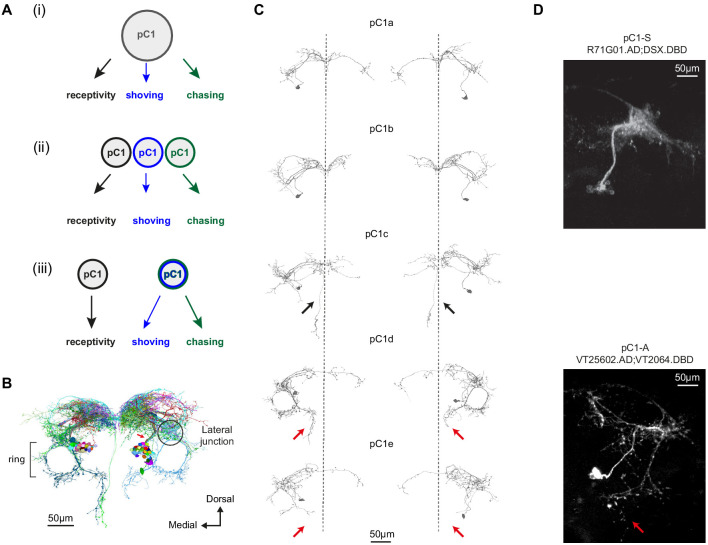
Figure 3. Defining pC1 cell types.
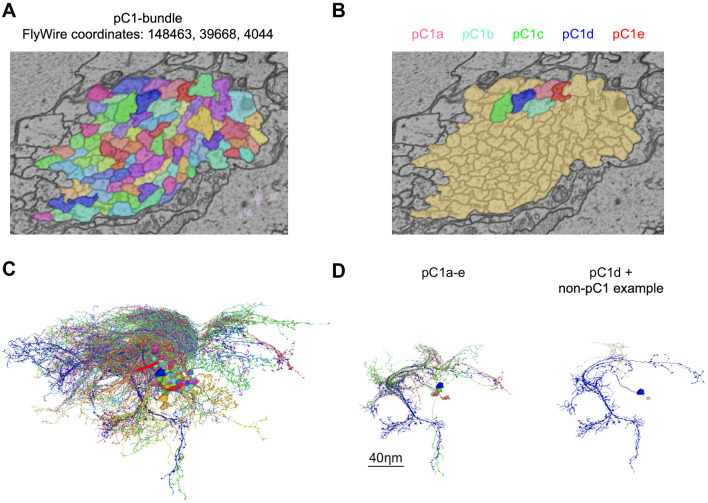
(A) Models of how pC1 cell types control female receptivity, shoving, and chasing. In (i), a homogenous pC1 population drives three distinct behaviors, and in (ii) and (iii) pC1 is a heterogenous group, with different behaviors controlled by different pC1 subsets. (B) EM reconstruction of pC1 cells and other example neurons that pass through a cross section in the pC1 bundle. See Figure 3—figure supplement 1 for all the cells that pass through the pC1 bundle, including neurons that project to the lateral junction (considered pC1 cells), and neurons that do not project to the junction (not considered pC1 cells). (C) Five pC1 cell types identified in FlyWire, mostly consistent with (Wang et al., 2020a). The medial projection in pC1c (see black arrows) is ipsilateral to the soma in one cell and contralateral in the other, likely reflecting variability between individual cells. Both pC1d and pC1e share a horizontal projection from the ring, but only pC1d cells have an extra vertical projection (red arrows indicate difference between pC1d and pC1e projections). The right pC1e cell is also missing part of the ring. (D) (top) Split GAL4 line pC1-S (R71G01.AD∩DSX.DBD; n = 8, 7.7 ± 5 cells per hemisphere) and (bottom) Split GAL4 line pC1-A (VT25602.AD∩VT2064.DBD; n = 7, 2 ± 0 cells per hemisphere). Neurons express GFP and are labeled with anti-GFP, see Key Resources Table for full genotype. pC1-A has a medial projection (red arrow), similar to pC1d neurons found in EM (C); the medial projection was found in 7/7 imaged pC1-A female brains, in both hemispheres. The pC1d and pC1e projections were not found in pC1-S imaged female brains (8/8 brains). The medial projection that is unique to the pC1c subtype was missing in all the 8 pC1-S flies we imaged - therefore, it is likely that pC1-S includes only pC1a and/or pC1b cells.


