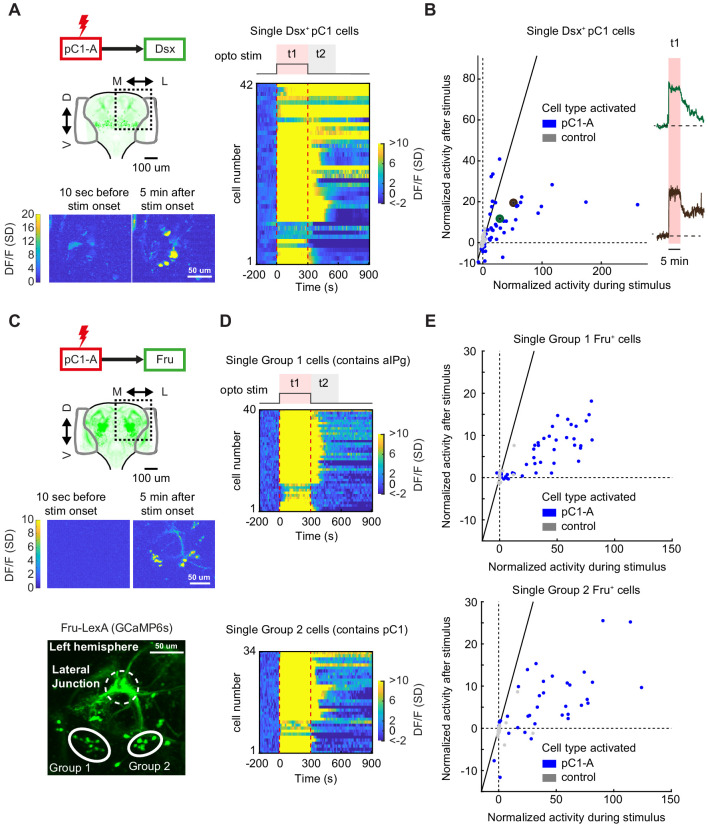
Figure 8. pC1d/e neurons drive persistent neural activity in Dsx+ and Fru+ cells.
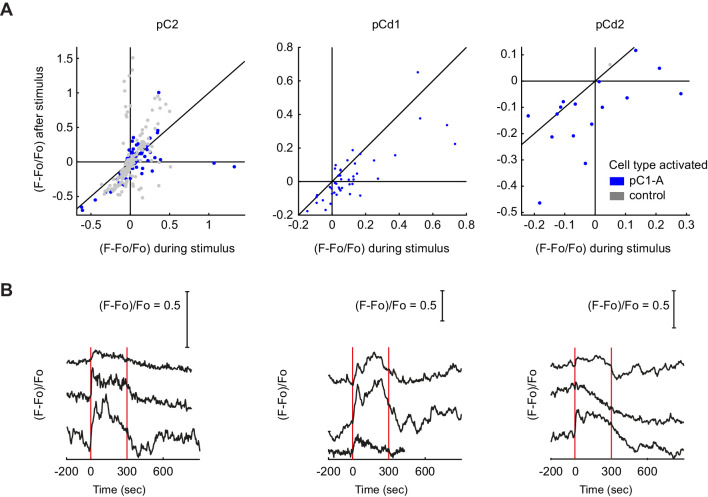
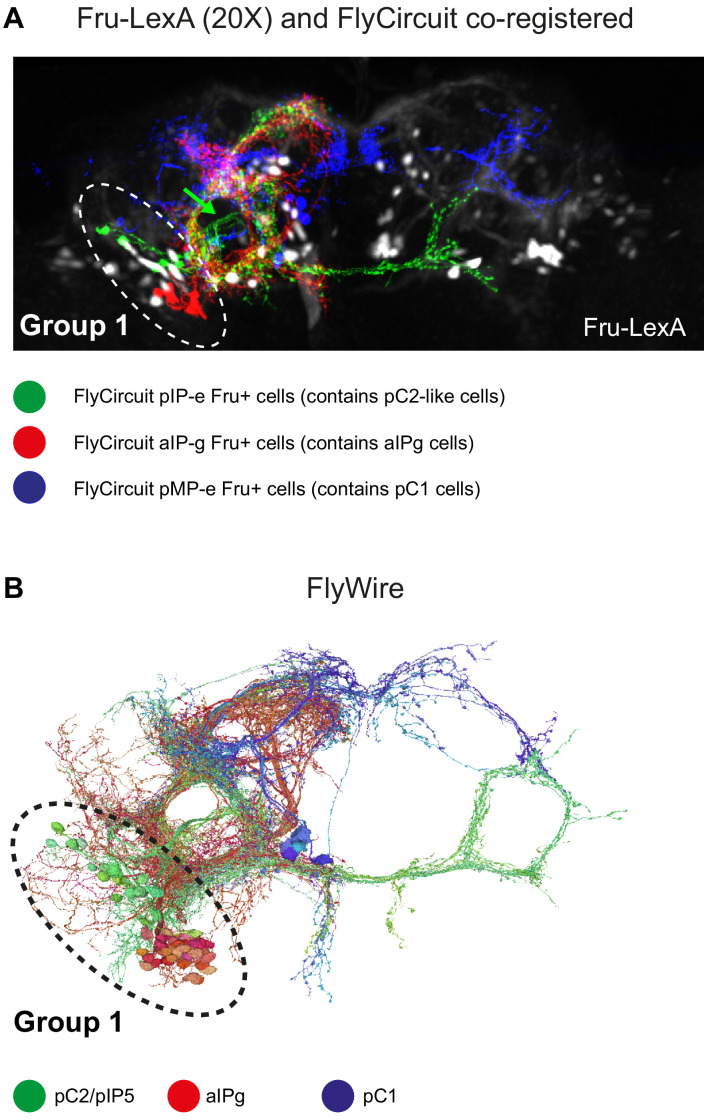
(A) Left: Activation of neurons in the pC1-A line and imaging of neural activity in all Dsx+ cell bodies. Activity in Dsx+ pC1 somas is shown 10 s before stimulus onset and 5 min after stimulus onset for an example experiment. Right: Normalized activity of Dsx+ pC1 somas ((F(t) - F0)/σo; F0 and F(t) are mean Fluorescence during baseline and fluorescence over time, respectively). Chrimson and TdTomato are expressed in pC1-A cells. GCaMP6s is expressed in Dsx+ cells. pC1 somas imaged following pC1-A activation (along with controls) are both shown if Ft1 > 3σo (σo - standard deviation during baseline, Ft1 is the mean fluorescence during t1) (see (B) for full set of imaged pC1 neurons). (B) Left: Mean Calcium response in Dsx+ pC1 somas during t1 (x-axis) versus during t2 (y-axis) for pC1-A activation and control. Normalized activity is defined as (F - Fo)/σo, where Fo is the mean activity during baseline, σo is the standard deviation during baseline, and F is the mean activity during t1 for x and t2 for y. Each dot represents a single segmented soma. Dots above the dashed line represent persistent responses following activation. All imaged pC1 neurons are shown (n = 8 flies, 58 ROIs for pC1-A, n = 5 flies, 25 ROIs for controls). Right: Example traces of (F - Fo)/Fo from two individual pC1 cells, showing different response decays after stimulus offset (matching the results from Figure 7D). Corresponding points are enlarged and marked in green and purple in B (left). (C) Top: Activation of neurons in the pC1-A line and imaging of neural activity in Fru+ cell bodies. Bottom: Spatial pattern of Fru+ cell bodies imaged (here, a left hemibrain is shown (Z-projection of Fru+ neurons expressing GCaMP6s)). Fru+ cell body groups 1 and 2 are defined based on their spatial location - group 1 likely contains Fru+ pC2 and aIPg neuronal cell bodies, whereas group 2 likely contains Fru+ pC1 cell bodies (Figure 8—figure supplement 2). (D) Normalized activity of Fru+ somas from group 1 (Top) or group 2 (Bottom). (E) Mean activity in Fru+ cell bodies from group 1 (left, n = 9 flies, 46 ROIs for pC1-A, n = 5 flies, 13 ROIs for control) and group 2 (right, n = 9 flies, 37 ROIs for pC1-A, n = 5 flies, 24 ROIs for control) during t1 (x-axis) versus during t2 (y-axis) following pC1-A activation and in controls (see Key Resources Table for full genotypes). Data were analyzed and plotted as in (B). Dots above the dashed line represent persistent responses following activation.


