Abstract
Background
Head and neck squamous cell carcinoma (HNSCC) is a common malignancy that emanates from the lips, mouth, paranasal sinuses, oropharynx, larynx, nasopharynx, and from other pharyngeal cancers. The availability of high-throughput expression data has made it possible to use global gene expression data to analyze the relationship between metabolic-related gene expression and clinical outcomes in HNSCC patients.
Method
In this study, we used RNA sequencing (RNA-seq) data from the cancer genome atlas (TCGA), with validation in the GEO dataset to profile the metabolic microenvironment and define potential biomarkers for metabolic therapy.
Results
We extracted data for 529 patients and 327 metabolic genes (198 upregulated and 129 downregulated genes) in the TCGA database. Carbonic anhydrase 9 (CA9) and CA6 had the largest logFCs in the upregulated and downregulated genes, respectively. Our Cox regression model data showed 51 prognostic-related genes with lysocardiolipin acyltransferase 1 (LCLAT1) and choline dehydrogenase (CHDH) being associated with the highest risk (HR = 1.144, 95% CI = 1.044 ~ 1.251) and the lowest risk (HR = 0.580, 95% CI = 0.400 ~ 0.839) in HNSCC, respectively. We next used the ROC curve to evaluate whether the differentially expressed metabolic-related genes could serve as early predictors of HNSCC. The findings showed an AUC of 0.745 and 0.618 in the TCGA and GEO analysis, respectively. Besides, the ability for the genes to predict clinicopathological HNSCC status was analyzed and the data showed that the AUC for age, gender, grade, stage, T, M, and N was 0.520, 0.495, 0.568, 0.606, 0.577, 0.476, and 0.673, respectively, in the TCGA dataset. On the other hand, the AUC for age, gender, stage, T, M, N, smoking, and HPV16-pos was 0.599, 0.531, 0.622, 0.606, 0.616, 0.550, 0.614, 0.519, and 0.397, respectively, in the GEO dataset.
Conclusion
Taken together, our study unearths a novel metabolic gene signature for the prediction of HNSCC prognosis based on the TCGA dataset. Our signature might point out the metabolic microenvironment disorders and provides potential treatment targets and prognostic biomarkers.
1. Background
Head and neck squamous cell carcinoma (HNSCC) is a malignancy that originates from the lips, mouth, paranasal sinuses, larynx, nasopharynx, and from other pharyngeal cancers [1]. The HNSCC is the sixth most common type of malignant tumors, with more than 655,000 new cases and 90,000 deaths every year [2]. Smoking, drinking, and human papillomavirus (HPV) infections are considered risk factors for the occurrence and development of HNSCC [3]. Worryingly, due to the lack of early manifestation of symptoms or diagnosis, local recurrence, and metastasis, the 5-year survival rate still lags at below 50% [4]. The occurrence and development of HNSCC are complex processes that are mediated by multiple molecules and pathways. Kim et al. reported the mechanistic and functional roles of CXCR7 as a key regulator of oncogenic TGF-β1/Smad2/3 signaling in HNSCC [5]. In addition, Hsu et al. defined the oncogenic driver role of atypical cadherin 1 (FAT1) in the mediation of proliferation, cell-death evasion, and chemoresistance in oral squamous cell carcinoma (OSCC) [6]. Moreover, another study revealed that the expression of E6 and E7, the HPV virus oncogenes, inactivates p53 and retinoblastoma (RB), respectively [7]. However, there is a wide spectrum of histological tumor markers for HNSCC and multiple anatomical sites. Therefore, it is possible to identify more valuable HNSCC drug targets by screening for changes in gene function networks linked to tumor formation and progression.
The activation of oncogenes and lack of tumor suppressors contribute to metabolic reprogramming in cancer, leading to improved nutrient uptake that feed biosynthetic pathways [8]. In the 1920s, Otto Warburg first reported that tumors took up distinctly more levels of glucose compared with normal tissues, indicating that these cells were biased towards shuttling glucose via the glycolytic pathway [9]. Recent studies have shown that immune cells have unique metabolic characteristics that affect their immune function. For example, macrophage polarization is associated with unique metabolic characteristics related to iron, energy, and lipid metabolism [10, 11]. Whereas a number of studies have investigated that the prognostic role of these metabolic genes in cancer, data on the role, and mechanism of metabolism still remains scant. In their studies, Hu et al. found that mutationally activated KRAS robustly increased the glutathione biosynthesis and intracellular cystine level in lung adenocarcinoma [12]. On the other hand, Yoo et al. found that the SLC1A5 variant is a mitochondrial glutamine transporter used for metabolic reprogramming of pancreatic cancer, and the knockout or overexpression of the SLC1A5 variant alters the growth of cancer cells and tumors, thus, supporting carcinogenesis [13]. There is, however, no data on systematic assessment of the metabolic-related genes that could reliably predict the overall survival (OS) in HNSCC patients or characterize the patient response to immunotherapy. The availability of high-throughput expression data has made it feasible to utilize global gene expression data to analyze the relationships between the metabolic-related gene expression and clinical outcomes in HNSCC patients. In this study, we used RNA sequencing (RNA-seq) data from The Cancer Genome Atlas (TCGA) with validation from the Gene Expression Omnibus (GEO) dataset to profile the metabolic molecular microenvironment and assess their importance as biomarkers for metabolic therapy.
2. Methods
2.1. Data Collection
We extracted RNA-seq data for HNSCC patients from TCGA (http://www.cancergenome.nih.gov), a web-based resource that provides a user-friendly interface and depository for mRNA expression data. We validated all the data from the GSE65858 data set obtained from the GEO database and then extracted all the metabolic-related genes contained in the Gene set enrichment analysis (GSEA) database. One millionth transcript normalization and log2 transformation were used for expression profiling. The selection of metabolic-related genes for prognostic analysis was not only consistent with the expression patterns in the TCGA cohort but also listed in the GSE65858 data set.
2.2. Development of the Metabolic-Related Prognostic Gene Signature
Lasso-penalized Cox regression and Univariate Cox regression analyses were used to build the metabolic-related prognostic gene signature [14]. The signature was defined as risk score = (coefficientmRNA1 × expression of mRNA1) + (coefficientmRNA2 × expression of mRNA2) + ⋯+(coefficientmRNAn × expression mRNAn). The related clinical data for HNSCC patients were also downloaded and evaluated. Based on the median, we denoted the data as either low-risk (<median number) or high-risk (≥median number) group. We used Kaplan–Meier survival analysis to analyze the survival rate for both the study and control groups.
2.3. Building and Validating a Predictive Nomogram
Here, we developed a nomogram [15] for the prediction of the occurrence of cancer events, such as recurrence or death. We then used the time-dependent receiver operating characteristic (ROC) curve to assess the predictive accuracy of the developed prognostic signatures for patients with HNSCC. Univariate and multivariate Cox regression analyses were employed to analyze the relationship between immune-related genes and clinicopathological manifestations.
2.4. External Validation of the Prognostic Gene Signatures
We downloaded the validated GSE65858 dataset in the GEO database. Following the assessment of the risk scores for the patients with genetic characteristics and carrying out the ROC analysis as well as the Kaplan-Meier analysis, we robustly demonstrated the similarity between the constructed nomogram and the TCGA-HNSCC cohort. To understand the mechanisms underlying defining the gene signatures in the Kyoto Encyclopedia of Genes and Genomes (KEGG), we used GSEA to search for rich terms in C2 in the TCGA-HNSCC or GSE65858 cohort. A P < 0.05 and a false discovery rate q < 0.25 were considered to be statistically significant. The mRNA expression level (Oncomine and TIMER database) and protein expression profile (The Human Protein Atlas database) further verified the expression of the genes included in the prognostic signatures. We then used CBioportal to study genetic alterations in the gene signatures.
2.5. Statistical Analysis
We filtered the data to ensure the complete exclusion of any sample with missing values. We used the Benjamini–Hochberg's method to convert the P values to FDR. Data were analyzed using R (version 3.5.3) and R Bioconductor software packages. We used Perl language for data matrix and data processing. A P value of 0.05 was considered significant.
3. Results
3.1. Development and Verification of the Prognostic Metabolic Gene Signatures
A total of 529 patients in the TCGA database and 327 metabolic genes (198 upregulated genes with the largest logFC of CA9 and 129 downregulated genes with the largest logFC of CA6; Table S1) were used to model the prognostic signature for the HNSCC. The validating GSE65858 dataset contained 270 HNSCC tissue samples. Our Univariate Cox regression analysis showed 51 survival-related genes, with LCLAT1 being associated with the highest risk (HR = 1.144, 95% CI = 1.044 ~ 1.251) and CHDH denoting the lowest risk (HR = 0.580, 95% CI = 0.400 ~ 0.839) (Table 1). The Lasso-penalized Cox analysis filtered 30 genes (HEXB, ACAT1, GNPDA1, POLE2, SMS, AGPS, PYGL, ACAA1, MTHFD2, PLCB3, POLD2, KYNU, ENTPD1, LCLAT1, DNMT1, ADK, ADA, PAFAH1B2, PLA2G2D, DGKQ, ADH7, ACOX3, ASNS, HPRT1, ATIC, PRPS1, NADSYN1, RDH11, HADHB, and PIP4K2A) used to build the prognostic model, and then we calculated the risk scores (Table 2). The samples were then divided into high- and low-risk groups using the median risk score value as a cut-off.
Table 1.
Prognostic related metabolic genes, HR > 1 is a high-risk gene, and HR < 1 is a low-risk gene.
| Id | HR | HR.95L | HR.95H | P value |
|---|---|---|---|---|
| HEXB | 1.038 | 1.006 | 1.071 | 0.019 |
| ACAT1 | 1.087 | 1.034 | 1.143 | 0.001 |
| P4HA1 | 1.019 | 1.007 | 1.030 | 0.001 |
| GNPDA1 | 1.065 | 1.013 | 1.119 | 0.013 |
| POLE2 | 0.882 | 0.791 | 0.982 | 0.023 |
| ACACB | 0.649 | 0.445 | 0.945 | 0.024 |
| SMS | 1.007 | 1.002 | 1.011 | 0.001 |
| AGPS | 1.053 | 1.010 | 1.097 | 0.014 |
| PYGL | 1.009 | 1.003 | 1.014 | 0.003 |
| ACAA1 | 0.890 | 0.802 | 0.988 | 0.029 |
| MTHFD2 | 1.035 | 1.017 | 1.052 | 4.745 |
| PLCB3 | 1.027 | 1.008 | 1.045 | 0.005 |
| POLE | 0.857 | 0.764 | 0.960 | 0.008 |
| POLD2 | 1.013 | 1.003 | 1.022 | 0.006 |
| MINPP1 | 1.082 | 1.015 | 1.153 | 0.016 |
| KYNU | 1.074 | 1.014 | 1.136 | 0.013 |
| PIK3C2B | 0.825 | 0.729 | 0.932 | 0.002 |
| CHDH | 0.580 | 0.400 | 0.839 | 0.003 |
| G6PD | 1.003 | 1.000 | 1.006 | 0.033 |
| POLD1 | 0.959 | 0.924 | 0.994 | 0.025 |
| PTDSS1 | 1.016 | 1.001 | 1.030 | 0.031 |
| ENTPD1 | 0.813 | 0.710 | 0.930 | 0.002 |
| LCLAT1 | 1.144 | 1.044 | 1.251 | 0.003 |
| PFKP | 1.012 | 1.001 | 1.021 | 0.024 |
| PIP4K2A | 0.927 | 0.859 | 0.998 | 0.046 |
| DNMT1 | 0.959 | 0.932 | 0.986 | 0.003 |
| ADK | 1.040 | 1.017 | 1.061 | 0.001 |
| NEU1 | 1.033 | 1.001 | 1.066 | 0.041 |
| GATM | 0.897 | 0.827 | 0.972 | 0.008 |
| TXNDC12 | 1.022 | 1.000 | 1.043 | 0.046 |
| ADA | 1.036 | 1.019 | 1.053 | 2.829e-05 |
| PAFAH1B2 | 1.043 | 1.013 | 1.074 | 0.004 |
| PLA2G2D | 0.864 | 0.778 | 0.958 | 0.005 |
| DGKQ | 0.908 | 0.845 | 0.974 | 0.007 |
| NAGK | 0.922 | 0.869 | 0.976 | 0.005 |
| FTH1 | 1.002 | 1.000 | 1.002 | 0.010 |
| ADH7 | 1.006 | 1.000 | 1.010 | 0.030 |
| ACOX3 | 0.897 | 0.830 | 0.969 | 0.005 |
| SHMT1 | 0.923 | 0.861 | 0.988 | 0.022 |
| ASNS | 1.030 | 1.011 | 1.049 | 0.001 |
| HPRT1 | 1.029 | 1.016 | 1.041 | 5.217e-06 |
| ATIC | 1.038 | 1.016 | 1.061 | 0.001 |
| LDHA | 1.002 | 1.000 | 1.003 | 0.007 |
| PRPS1 | 1.035 | 1.014 | 1.055 | 0.001 |
| NADSYN1 | 1.037 | 1.001 | 1.074 | 0.040 |
| GSTO1 | 1.003 | 1.000 | 1.006 | 0.049 |
| TXNRD1 | 1.005 | 1.000 | 1.010 | 0.034 |
| RDH11 | 1.029 | 1.006 | 1.052 | 0.012 |
| PAICS | 1.024 | 1.005 | 1.043 | 0.010 |
Table 2.
Then Lasso-penalized Cox analysis found 30 genes to build the prognostic model.
| Gene | Coef | Gene | Coef |
|---|---|---|---|
| HEXB | 0.01247 | DNMT1 | -0.01837 |
| ACAT1 | 0.01996 | ADK | 0.00435 |
| GNPDA1 | 0.02995 | ADA | 0.01480 |
| POLE2 | -0.17051 | PAFAH1B2 | 0.00517 |
| SMS | 0.00156 | PLA2G2D | -0.03567 |
| AGPS | 0.00050 | DGKQ | -0.03222 |
| PYGL | 0.00442 | ADH7 | 0.00527 |
| ACAA1 | -0.00201 | ACOX3 | -0.00481 |
| MTHFD2 | 0.00689 | ASNS | 0.00862 |
| PLCB3 | 0.02056 | HPRT1 | 0.00982 |
| POLD2 | 0.00170 | ATIC | 0.00835 |
| KYNU | 0.03766 | PRPS1 | 0.01487 |
| ENTPD1 | -0.01556 | NADSYN1 | 0.01067 |
| LCLAT1 | 0.02843 | RDH11 | 0.00258 |
| PIP4K2A | -0.00409 | HADHB | 0.01222 |
3.2. Survival Results and Multivariate Examination
Our OS analysis demonstrated that, unlike the low-risk group, the high-risk HNSCC group was associated with a worse prognosis (P < 0.01) (Figure 1). We showed that the mortality rate was higher in the high-risk HNSCC patients, and the increase in the patients' risk score was proportional to the death rate (Figure 2). Next, we used the univariate and multivariate COX analyses to determine the risk factors which defined the prognostic model based on thirty metabolic-related genes. We demonstrate that the 30 metabolic-related gene signatures could robustly and independently predict prognosis and OS (Figure 3). On the other hand, we evaluated whether the metabolic-related gene patterns could serve as an early predictor of incidence in HNSCC. The ROC curve and the model demonstrated an AUC of 0.745 in the TCGA and 0.618 in the GEO datasets. Taken together, these data indicated that the constructed prognostic tool has moderate sensitivity and specificity. In addition, analysis of the clinicopathological factors in HNSCC showed that the AUC for age, gender, grade, stage, T, M, and N was 0.520, 0.495, 0.568, 0.606, 0.577, 0.476, and 0.673, respectively, in the TCGA dataset, and the AUC for age, gender, stage, T, M, N, smoking, and HPV16-pos was 0.599, 0.531, 0.622, 0.606, 0.616, 0.550, 0.614, 0.519, and 0.397, respectively, in the GEO dataset (Figure 4).
Figure 1.
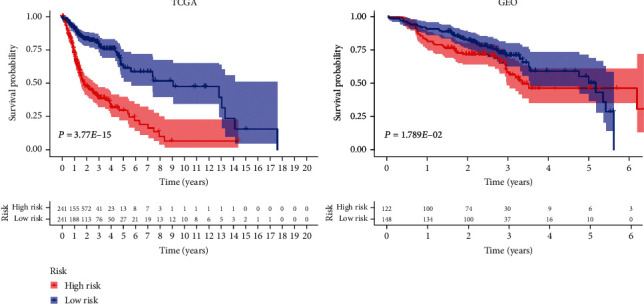
Overall survival (OS) analysis demonstrated that HNSCC with high-risk group had a more terrible prognosis than that with low-risk group (P < 0.01).
Figure 2.
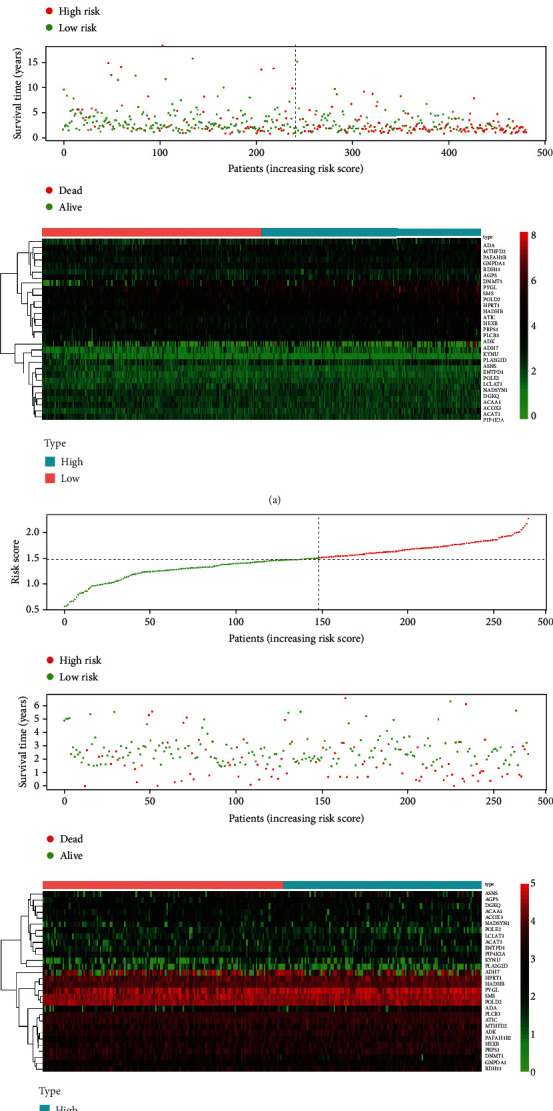
Detailed prognostic signature information of HNSCC groups is visualized.
Figure 3.
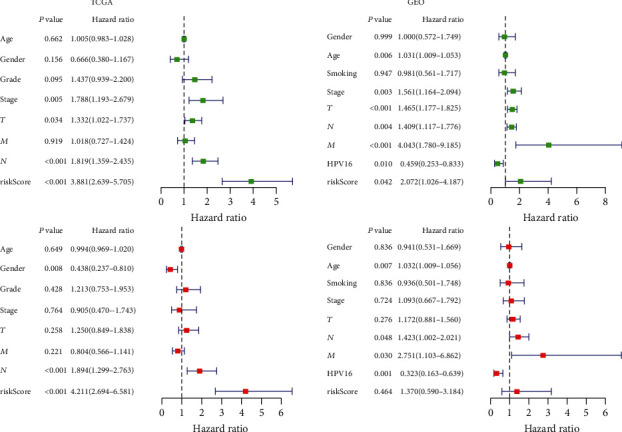
The result of univariate and multivariate Cox regression analysis showed that our prognostic model is an independent prognostic factor for OS.
Figure 4.
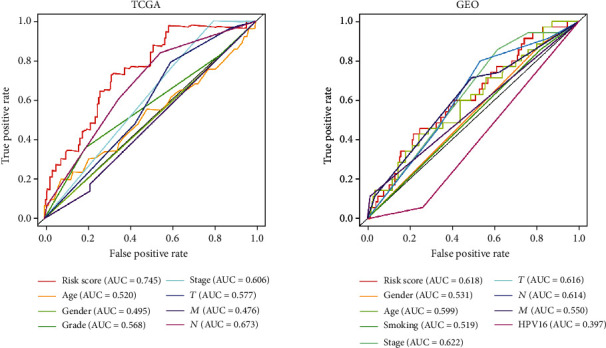
The predictor of clinicopathological in HNSCC was also analyzed, and we found the AUC for age, gender, grade, stage, T, M, and N was 0.520, 0.495, 0.568, 0.606, 0.577, 0.476, and 0.673, respectively, in TCGA, and the AUC for age, gender, stage, T, M, N, smoking, and HPV16-pos was 0.599, 0.531, 0.622, 0.606, 0.616, 0.550, 0.614, 0.519, and 0.397, respectively, in GEO.
3.3. Construction and Validation of the Predictive Nomogram in the TCGA and GEO Cohorts
The nomogram was constructed from the clinicopathological data as well as the developed prognostic model. Through the LASSO logistic regression algorithm, the most important prediction markers were selected in the training data set, which reflected the final prediction model. The model included 7 features in TCGA: age, gender, grade, stage, T, M, and N as well as 8 features in GEO: age, gender, stage, T, M, N, smoking, and HPV16-pos (Figure 5). Integrating our prognostic model with clinicopathological analysis fortified the forecasting sensitivity and specificity for 1-, 2-, and 3-year OS, thus, increasing the usefulness in the clinical management of patients.
Figure 5.
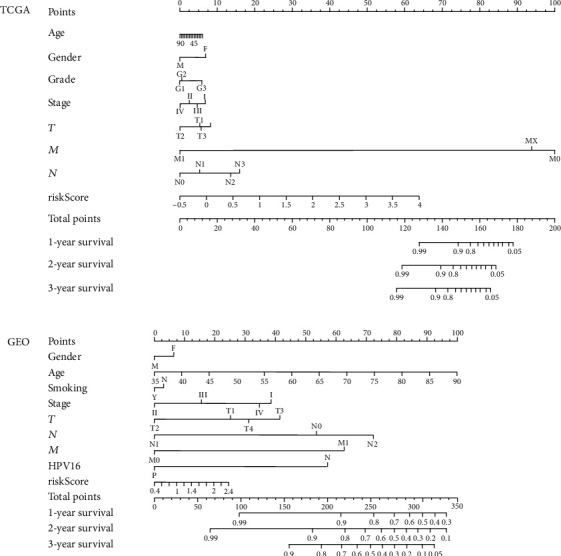
The model ultimately included 7 features in TCGA: age, gender, grade, stage, T, M, and N and 8 features in TCGA: age, gender, stage, T, M, N, smoking, and HPV16-pos.
3.4. Gene Set Enrichment Analyses
Here, we split the samples into high- and low-risk groups to distinguish the potential functions and elucidate the significant survival differences in the GSEA. Annotated gene set c2.cp.kegg.v6.0.symbols.gmt was selected as the reference gene sets, which included terms with NOM < 0.05. Gene set permutations were executed multiple times for every examination. A great majority of the metabolic-related pathways such as galactose metabolism, nicotinate/nicotinamide, and pantothenate/COA biosynthesis or metabolic disease-related perturbations were enriched in the high-risk group. On the other hand, most of the nonmetabolic-related pathways such as base excision repair, spliceosome, homologous recombination, nucleotide excision, and DNA replication were enriched in the low-risk group (Figure 6 and Table 3).
Figure 6.
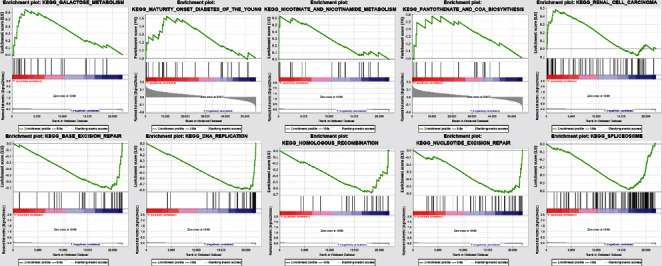
Then samples were divided into high- and low-risk groups as training set to distinguish the potential function and elucidate the significant survival difference utilizing GSEA.
Table 3.
Gene sets enriched in phenotype high and low.
| Gene set name | Size | NES | NOM P value |
|---|---|---|---|
| KEGG_GALACTOSE_METABOLISM | 23 | 1.62 | 0.010 |
| KEGG_NICOTINATE_AND_NICOTINAMIDE_METABOLISM | 19 | 1.45 | 0.034 |
| KEGG_RENAL_CELL_CARCINOMA | 64 | 1.41 | 0.046 |
| KEGG_PANTOTHENATE_AND_COA_BIOSYNTHESIS | 16 | 1.59 | 0.031 |
| KEGG_MATURITY_ONSET_DIABETES_OF_THE_YOUNG | 25 | 1.53 | 0.033 |
| KEGG_BASE_EXCISION_REPAIR | 33 | -1.88 | 0.000 |
| KEGG_SPLICEOSOME | 109 | -1.82 | 0.002 |
| KEGG_HOMOLOGOUS_RECOMBINATION | 24 | -1.65 | 0.020 |
| KEGG_NUCLEOTIDE_EXCISION_REPAIR | 44 | -1.64 | 0.022 |
| KEGG_DNA_REPLICATION | 36 | -1.63 | 0.013 |
NES: normalized enrichment score; NOM: nominal; Gene sets with NOM P value < 0.05 are considered as significant.
3.5. Online Database Analysis
To provide new insights into the potential functions, expression patterns, molecular mechanisms, and distinct prognostic value, we used multidimensional survey techniques to explore CA6, CA9, LCLAT1, and CHDH based on variations in the copy numbers or gene expression profile in the HNSCC patients. In agreement with our findings, data from both the TIMER database and Oncomine showed that CA6 was significantly downregulated, while CA9 was significantly overexpressed in HNSCC patients (Figures 7 and 8). Despite the limited data in the Oncomine, the LCLAT1 mRNA expression was overexpressed while the CHDH expression was downregulated in HNSCC in the TIMER database. Representative protein expression levels for CA9, LCLAT1, and CHDH were explored in the HPA database as shown in Figure 9. We showed that CA9 has the most frequent genetic variations (10%), and the most pronounced changes were amplification of mutations (Figure 10). In summary, we verified the abnormal expression profiles for these genes in HNSCC, and the genetic changes might explain the abnormal expression.
Figure 7.
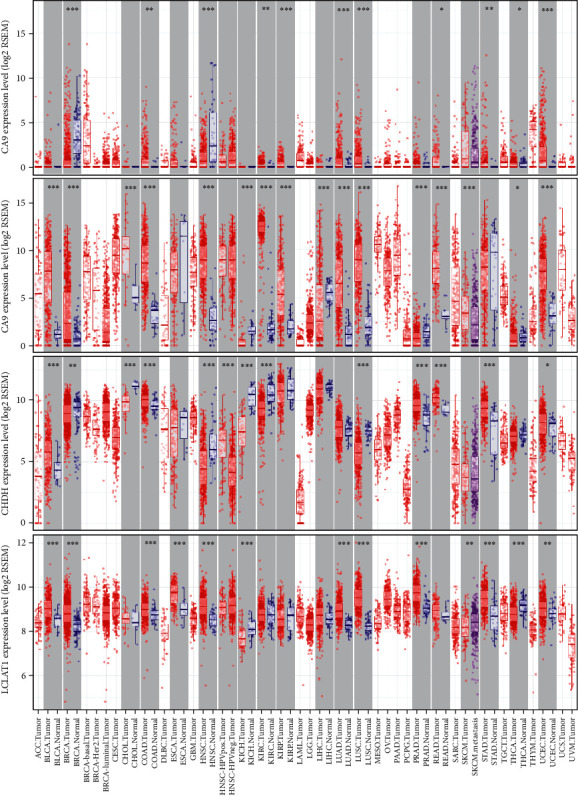
Differential expression of CA6, CA9, LCLAT1, and CHDH between tumors and normal tissues based on TIMER database.
Figure 8.
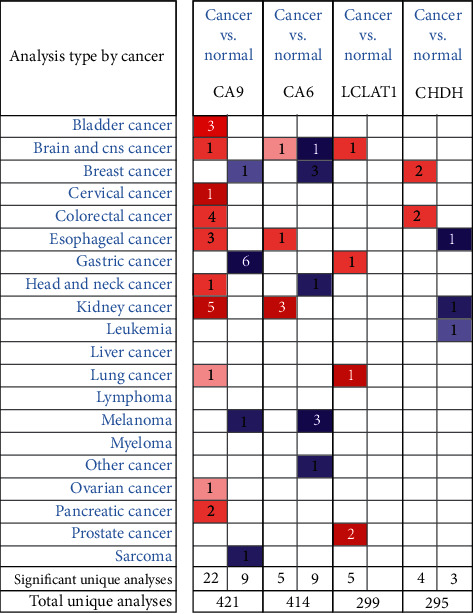
The transcriptional levels of CA6, CA9, LCLAT1, and CHDH in cancers and normal samples. Redder means higher expression and bluer means lower expression. (ONCOMINE Database).
Figure 9.
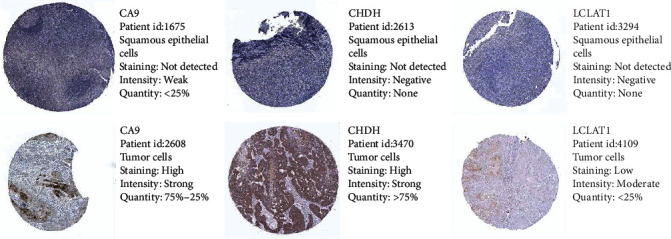
Representative protein expressions of CA9, LCLAT1, and CHDH were explored in the HPA database.
Figure 10.

CA6, CA9, LCLAT1, and CHDH gene expression and mutation analysis.
4. Discussion
Proliferating cancer cells must maintain sufficient energy and a library of metabolic intermediates to build the macromolecules required for growth. The molecules include DNA, proteins, and lipids [16]. Because the metabolic profile could distinguish the tumor cells from the normal cells, metabolic signaling pathways have become ideal targets for therapeutic intervention for cancer patients. In this study, we identified a novel and effective metabolic-related prognostic gene signature based on the TCGA dataset and validated it in the GSE65858 dataset. Our constructed signature had a strong prognostic value and may represent the metabolic status of patients with HNSCC. Therefore, the signature could be used as a potential biomarker and therapeutic target in the metabolic signaling pathways.
In our study, we downloaded transcriptome data from the TCGA database and verified it using the GEO dataset as well as the metabolic-related genes extract from the GSEA metabolic signaling pathways. We first evaluated the relationship between the differentially expressed RNA, immune-related genes, and transcription factors in HNSCC patients. Univariate Cox regression model found 51 survival-related genes, whereby LCLAT1 was associated with the highest risk while CHDH denoted the least risk. Cardiolipin (CL) types of polyunsaturated fatty acids, especially DHA (C22: 6n3), increased in ALCAT1-expressing cells, while C16-C18 fatty acids significantly decreased [17]. A recent study showed that ALCAT1 is critical for coupling mitochondrial respiration and metabolic plasticity [18]. Wang et al. reported that forced expression of ALCAT1 in primary hepatocytes led to multiple defects including steatosis, defective autophagy, and mitochondrial dysfunction [19]. Meanwhile, ALCAT1 can promote ROS production and is critical for coupling mitochondrial respiration and metabolic plasticity [20]. However, there was limited data on the role of ALCAT1 in tumors. Here, we hypothesize that the ALCAT1 might play a regulatory role in cardiolipin remodeling in response to oxidative stress and stimulate mitochondrial activity in HNSCC cancers. Choline dehydrogenase (CHDH) localizes to the mitochondrion, and variations in this gene can affect susceptibility to choline deficiency. CHDH strongly predicted clinical outcome in breast cancer patients receiving tamoxifen monotherapy [21]. Choline is an essential nutrient required for methyl group metabolism, and CHDH is associated with an increased risk of breast cancer [22]. There is no available data on the role of CHDH in HNSCC.
By the use of ROC curves, we next interrogated whether the metabolic-related gene patterns could serve as an early predictor for the incidence of HNSCC. Our model demonstrated an AUC of 0.745 and 0.618 in the TCGA and GEO datasets. Integrating our prognostic model with the clinicopathological indicators enhanced the prediction sensitivity and specificity for the 1-, 2-, and 3-year OS, thus, better clinical management. Our further analysis of the survival difference using the GSEA showed that the majority of the metabolic-related pathways such as galactose and nicotinamide metabolism were enriched in the high-risk group while most of the nonmetabolic-related pathways were enriched in the low-risk group. Galactose is an essential molecule and plays a pivotal role in energy transfer and galactosylation of complex molecules. On the other hand, nicotinamide adenine dinucleotide (NAD) plays a central role in energy metabolism and integrates cell metabolism with signaling and gene expression [23]. NAD biosynthesis is dependent on nicotinamide/nicotinate single-nucleotide adenylate transferase [24]. Therefore, high-risk patients may benefit from metabolic therapy, while low-risk patients may benefit from nonmetabolism-targeted therapy. However, there is a need for more studies on the relationship between gene signatures, metabolic microenvironment, and metabolic therapies. Our data provide a promising direction in elucidating the underlying molecular mechanisms for the interrogated signatures. In conclusion, our signatures may reflect metabolic microenvironment disorders and provide potential biomarkers for metabolic therapy and prediction of prognosis after treatment.
Our analysis of the 327 metabolic genes in the TCGA database showed that the CA9 had the largest logFC in the upregulated category, while CA6 was downregulated. Carbonic anhydrases (CAs) are a large class of zinc metal enzymes that catalyze the reversible hydration of carbon dioxide. They are involved in various biological processes, including bone resorption, respiration, calcification, and acid-base balance. A previous study showed that pancreatic ductal adenocarcinoma (PDACs) cells that express an activated KRAS increase the expression of CA9, via stabilization of hypoxia-inducible factor 1 subunit alpha (HIF1A) and HIF2A, which eventually regulates the pH and glycolysis [25]. Similarly, CA9 is an independent prognostic factor for OSCC patients and therefore a potential therapeutic target [26]. CA6 encodes several isoenzymes which are only found in salivary glands. Saliva and proteins may play a role in the reversible hydration of carbon dioxide. CA6 is a specific marker for salivary gland serous acinar cells and acinar cell carcinoma (AciCC). CA6 has the same sensitivity and specificity as DOG1 in the differential diagnosis of AciCC and breast analogs (MASC) [27]. However, data on the role of CA9 and CA6 in the prognosis of human HNSCC remains scant. Our study identified a novel metabolic gene signature for the prediction of HNSCC prognosis based on the TCGA data set. Our signatures might reflect the disorders in the metabolic microenvironment and provide potential biomarkers for metabolic therapy and monitoring of the treatment response. However, the metabolic gene signatures for prediction must be verified in more independent cohorts and functional experiments. It is, however, important to mention that our study was limited by the relatively small sample size and the fact that our results were not verified in clinical samples.
5. Conclusion
Taken together, our data defined a novel metabolic gene signature for the prediction of HNSCC prognosis based on the TCGA dataset. Our signatures reflect the metabolic microenvironment disorders and provide useful biomarkers for metabolic therapy and prediction of the response to the treatment.
Abbreviations
- HNSCC:
Head and neck squamous cell carcinoma
- TCGA:
The Cancer Genome Atlas
- HPV:
Human papillomavirus
- ROC:
Receiver operating characteristic
- GSEA:
Gene set enrichment analysis
- GEO:
Gene Expression Omnibus
- OS:
Overall survival.
Data Availability
Data sharing is not applicable to this article as no datasets were generated or analyzed during the current study.
Conflicts of Interest
The authors declare that they have no competing interests.
Authors' Contributions
W.Z.H. designed and analyzed the research study; W.Z.H. and T.Y. wrote and revised the manuscript, W.Z.H. and Z.Y. collected the data, and all authors have read and approved the manuscript. Zeng-Hong Wu and Yun Tang are co-first authors.
Supplementary Materials
Supplementary Table 1: the expression of included consistent altered metabolic genes in TCGA-HNSCC.
References
- 1.Fang X.-N., Yin M., Li H., et al. Comprehensive analysis of competitive endogenous RNAs network associated with head and neck squamous cell carcinoma. Scientific Reports. 2018;8(1) doi: 10.1038/s41598-018-28957-y. [DOI] [PMC free article] [PubMed] [Google Scholar]
- 2.Ferlay J., Soerjomataram I., Dikshit R., et al. Cancer incidence and mortality worldwide: sources, methods and major patterns in GLOBOCAN 2012. International Journal of Cancer. 2012;136:E359–E386. doi: 10.1002/ijc.29210. [DOI] [PubMed] [Google Scholar]
- 3.Castellsagué X., Alemany L., Quer M., et al. HPV involvement in head and neck cancers: comprehensive assessment of biomarkers in 3680 patients. Journal of the National Cancer Institute. 2016;108(6) doi: 10.1093/jnci/djv403. [DOI] [PubMed] [Google Scholar]
- 4.Posner M., Vermorken J. B. Induction therapy in the modern era of combined-modality therapy for locally advanced head and neck cancer. Seminars in Oncology. 2008;35(3):221–228. doi: 10.1053/j.seminoncol.2008.03.007. [DOI] [PubMed] [Google Scholar]
- 5.Kim N., Ryu H., Kim S., et al. CXCR7 promotes migration and invasion in head and neck squamous cell carcinoma by upregulating TGF-β1/Smad2/3 signaling. Scientific Reports. 2019;9(1) doi: 10.1038/s41598-019-54705-x. [DOI] [PMC free article] [PubMed] [Google Scholar]
- 6.Hsu T.-N., Huang C.-M., Huang C.-S., et al. Targeting FAT1 inhibits carcinogenesis, induces oxidative stress and enhances cisplatin sensitivity through deregulation of LRP5/WNT2/GSS signaling axis in oral squamous cell carcinoma. Cancers. 2019;11(12)) doi: 10.3390/cancers11121883. [DOI] [PMC free article] [PubMed] [Google Scholar]
- 7.Leemans C. R., Braakhuis B. J., Brakenhoff R. H. The molecular biology of head and neck cancer. Nature Reviews. Cancer. 2011;11(1):9–22. doi: 10.1038/nrc2982. [DOI] [PubMed] [Google Scholar]
- 8.Boroughs L. K., DeBerardinis R. J. Metabolic pathways promoting cancer cell survival and growth. Nature Cell Biology. 2015;17(4):351–359. doi: 10.1038/ncb3124. [DOI] [PMC free article] [PubMed] [Google Scholar]
- 9.Hanahan D., Weinberg R. A. Hallmarks of cancer: the next generation. Cell. 2011;144(5):646–674. doi: 10.1016/j.cell.2011.02.013. [DOI] [PubMed] [Google Scholar]
- 10.Jha A. K., Huang S. C.-C., Sergushichev A., et al. Network integration of parallel metabolic and transcriptional data reveals metabolic modules that regulate macrophage polarization. Immunity. 2015;42:419–430. doi: 10.1016/j.immuni.2015.02.005. [DOI] [PubMed] [Google Scholar]
- 11.Biswas S. K., Mantovani A. Macrophage plasticity and interaction with lymphocyte subsets: cancer as a paradigm. Nature Immunology. 2015;11:889–896. doi: 10.1038/ni.1937. [DOI] [PubMed] [Google Scholar]
- 12.Hu K., Li K., Lv J., et al. Suppression of the SLC7A11/glutathione axis causes synthetic lethality in KRAS-mutant lung adenocarcinoma. Journal of Clinical Investigation. 2019;2019, article 124049 doi: 10.1172/jci124049. [DOI] [PMC free article] [PubMed] [Google Scholar]
- 13.Yoo H. C., Park S. J., Nam M., et al. A variant of SLC1A5 is a mitochondrial glutamine transporter for metabolic reprogramming in cancer cells. Cell Metabolism. 2019;2019 doi: 10.1016/j.cmet.2019.11.020. [DOI] [PubMed] [Google Scholar]
- 14.Tibshirani R. The lasso method for variable selection in the Cox model. Statistics in Medicine. 1997;16(4):385–395. doi: 10.1002/(SICI)1097-0258(19970228)16:4<385::AID-SIM380>3.0.CO;2-3. [DOI] [PubMed] [Google Scholar]
- 15.Iasonos A., Schrag D., Raj G. V., Panageas K. S. How to build and interpret a nomogram for cancer prognosis. Journal of Clinical Oncology. 2008;26(8):1364–1370. doi: 10.1200/JCO.2007.12.9791. [DOI] [PubMed] [Google Scholar]
- 16.Weyandt J. D., Thompson C. B., Giaccia A. J., Rathmell W. K. Metabolic alterations in cancer and their potential as therapeutic targets. American Society of Clinical Oncology - Educational Book. 2017;37:825–832. doi: 10.14694/EDBK_175561. [DOI] [PMC free article] [PubMed] [Google Scholar]
- 17.Cao J., Liu Y., Lockwood J., Burn P., Shi Y. A novel cardiolipin-remodeling pathway revealed by a gene encoding an endoplasmic reticulum-associated acyl-CoA:lysocardiolipin acyltransferase (ALCAT1) in mouse. Journal of Biological Chemistry. 2004;279(30):31727–31734. doi: 10.1074/jbc.M402930200. [DOI] [PubMed] [Google Scholar]
- 18.Li J., Romestaing C., Han X., et al. Cardiolipin remodeling by ALCAT1 links oxidative stress and mitochondrial dysfunction to obesity. Cell Metabolism. 2010;12(2):154–165. doi: 10.1016/j.cmet.2010.07.003. [DOI] [PMC free article] [PubMed] [Google Scholar]
- 19.Wang L., Liu X., Nie J., et al. ALCAT1 controls mitochondrial etiology of fatty liver diseases, linking defective mitophagy to steatosis. Hepatology. 2015;61(2):486–496. doi: 10.1002/hep.27420. [DOI] [PMC free article] [PubMed] [Google Scholar]
- 20.Rieger B., Krajčová A., Duwe P., Busch K. B. ALCAT1 overexpression affects supercomplex formation and increases ROS in respiring mitochondria. Oxidative Medicine and Cellular Longevity. 2019;2019 doi: 10.1155/2019/9186469.9186469 [DOI] [PMC free article] [PubMed] [Google Scholar]
- 21.Ma X.-J., Hilsenbeck S. G., Wang W., et al. The HOXB13:IL17BR expression index is a prognostic factor in early-stage breast cancer. Journal of Clinical Oncology Official Journal of the American Society of Clinical Oncology. 2006;24(28):4611–4619. doi: 10.1200/jco.2006.06.6944. [DOI] [PubMed] [Google Scholar]
- 22.Xu X., Gammon M. D., Zeisel S. H., et al. Choline metabolism and risk of breast cancer in a population-based study. The FASEB Journal. 2008;22(6):2045–2052. doi: 10.1096/fj.07-101279. [DOI] [PMC free article] [PubMed] [Google Scholar]
- 23.Coelho A. I., Berry G. T., Rubio-Gozalbo M. E. Galactose metabolism and health. Current Opinion in Clinical Nutrition & Metabolic Care. 2015;18(4):422–427. doi: 10.1097/MCO.0000000000000189. [DOI] [PubMed] [Google Scholar]
- 24.Ortiz-Joya L., Contreras-Rodríguez L. E., Ramírez-Hernández M. H. Protein-protein interactions of the nicotinamide/nicotinate mononucleotide adenylyltransferase of Leishmania braziliensis. Mem Inst Oswaldo Cruz. 2019;2019, article 114:e180506 doi: 10.1590/0074-02760180506. [DOI] [PMC free article] [PubMed] [Google Scholar]
- 25.McDonald P. C., Chafe S. C., Brown W. S., et al. Regulation of pH by carbonic anhydrase 9 mediates survival of pancreatic cancer cells with activated KRAS in response to hypoxia. Gastroenterology. 2019;157(3):823–837. doi: 10.1053/j.gastro.2019.05.004. [DOI] [PubMed] [Google Scholar]
- 26.Eckert A. W., Horter S., Bethmann D., et al. Investigation of the prognostic role of carbonic anhydrase 9 (CAIX) of the cellular mRNA/protein level or soluble CAIX protein in patients with oral squamous cell carcinoma. International Journal of Molecular Sciences. 2019;20(2) doi: 10.3390/ijms20020375. [DOI] [PMC free article] [PubMed] [Google Scholar]
- 27.Hsieh M.-S., Jeng Y.-M., Jhuang Y.-L., Chou Y.-H., Lin C.-Y. Carbonic anhydrase VI: a novel marker for salivary serous acinar differentiation and its application to discriminate acinic cell carcinoma from mammary analogue secretory carcinoma of the salivary gland. Histopathology. 2016;68(5):641–647. doi: 10.1111/his.12792. [DOI] [PubMed] [Google Scholar]
Associated Data
This section collects any data citations, data availability statements, or supplementary materials included in this article.
Supplementary Materials
Supplementary Table 1: the expression of included consistent altered metabolic genes in TCGA-HNSCC.
Data Availability Statement
Data sharing is not applicable to this article as no datasets were generated or analyzed during the current study.


