

Abstract
In this research, single-factor and response surface experiments were conducted in the fed-batch fermentation process to improve the yield of iturin A. The effect of adding various concentrations of precursor amino acids l-asparagine (Asn), l-aspartic acid (Asp), l-glutamic acid (Glu), l-glutamine (Gln), l-Serine (Ser) and l-proline (Pro) at different adding times (3 and 12 h) on iturin A production and cell growth was studied. The respective addition of amino acids (Asp 0.28 g/L; Asn 0.36 g/L; Glu 0.20, 0.28 and 0.360 g/L; Gln 0.20, 0.28 and 0.36 g/L; Pro 0.12, 0.20, 0.28 and 0.36 g/L) at 3 h was shown to improve cell growth but did not affect the yield of iturin A. Meanwhile, the individual addition of the same amino acids at 12 h improved cell growth and increased the yield of iturin A. Excellent correlation was obtained between the predicted and measured values, suggesting that the regression model was accurate and reliable; highly significant (P < 0.0001), and the determination coefficient (R2 = 0.975). When 0.0752 g/L Asn; 0.1992 g/L Gln and 0.1464 g/L Pro were added at 12 h, the yield of iturin A reached 0.85 g/L, which is 32.81%-fold higher than that of the initial process. Therefore, this study obtained optimal parameters for iturin A production by the experimental method, and process validation gave high iturin A yields (0.85 g/L) during a 60 h fermentation. These findings could guide an up-scaling of the fermentation process.
Electronic Supplementary Material
The online version of this article (10.1007/s13205-020-02540-7) contains supplementary material, which is available to authorized users.
Keywords: Bacillus subtilis, Iturin A, Precursor amino acids, Response surface methodology
Introduction
Chemical pesticides are traditionally used to control plant pests and pathogens. However, the side effects associated with the use of these chemical agents, including environmental pollution, drug resistance by pathogens, and the accumulation of pesticide residues, have become of great concern (Martinez 2009; Larsson 2014). Therefore, the development of biological control methods to replace chemical pesticides has been encouraged to ensure healthier food supply and a safer and more effective disease and pest control (Fravel 2005; Perez-Garcia et al. 2011). Recent studies have shown that biological control agents as alternatives to chemical pesticides are more environmentally friendly (Jin et al. 2015; Liao et al. 2016). Besides, the use of lipopeptides in biological control has received considerable attention (Ongena and Jacques 2008; Meena and Kanwar 2015; Li et al. 2016). Bacillus subtilis, one of the most commonly used and thoroughly studied microbial species (Stein 2005), could produce more than two dozen structurally diverse compounds with a broad antimicrobial inhibitory spectrum and high viability.
The iturin class of lipopeptides is mainly produced by two strains of the Bacillus sp., B. subtilis and B. amyloliquefaciens (Peypoux et al. 1978; Yu et al. 2002; Cho et al. 2003; Phister et al. 2004), and has both antifungal and antibacterial activity. Iturin A is a cyclic heptapeptide linked to a β-amino fatty-acid chain consisting of 14–17 carbon atoms (Ongena and Jacques 2008). This unique amphipathic structure endows iturin A with potent broad-spectrum antifungal activities, including potency against Penicillium, Rhizoctonia, Aspergillus, Fusarium, and Pyricularia spp (Besson et al. 1978; Klich et al. 1991; Yu et al. 2002; Gong et al. 2006; Kim et al. 2010). Research shows that as a fungicide, iturin A interacts with sterol components in the fungal membrane to change the membrane permeability, thereby facilitating potassium ion leakage and subsequent cell damage (Magetdana et al. 1985, 1989). Yao et al. reported an 89.6% biocontrol effect of B. subtilis 3–10 on watermelon fusarium wilt, and electron spray ionization mass spectrometry detected the presence of iturin A (Yao et al. 2012). Although lipopeptide antibiotics have great potential for environmental, commercial, agricultural, and food safety applications, the production of iturin A at an industrial scale has not been realized because of low natural yields and productivities (Das et al. 2008).
Until now, research on iturin A fermentation has mainly focused on the optimization of culture conditions and medium: carbon, nitrogen sources, and inorganic salts. Using untreated rapeseed meal as a nitrogen source in submerged fermentation and a stepwise two-stage glucose feeding strategy, Jin et al. achieved a twofold increase in iturin A production from B. subtilis (from 0.60 to 1.12 g/L: the productivity was from 0.21 to 0.24 g/L/day) (Jin et al. 2014, 2015). Metal ions are essential components for the synthesis of lipopeptide antibiotics and could enhance the metabolism of Bacillus. For instance, manganese, ferrous, and magnesium ions could improve surfactin production (Wei and Chu 1998, 2002). Lin et al. improved the production of iturin A by Bacillus amyloliquefaciens B128 by adding ferrous ions (Lin et al. 2008).
Specific amino acids are direct precursors for many peptide antibiotics detected in the fermentation broth of various Bacillus species. As stimulatory additives, these amino acids could improve the production of antibiotics (Aharonowitz 1980). Since iturin A consists of a cyclic heptapeptide (l-Asn_d-Tyr_d-Asn_l-Gln_l-Pro_d-Asn_l-Ser) and a β-amino fatty-acid chain, its yield could be enhanced by adding precursor amino acids in the submerge fermentation. Peng et al. used the uniform design-based artificial neural network approach to optimize conditions for the fed-batch fermentation system by adding various concentrations of Asn, Glu, and Pro. Subsequently, the titer for iturin A increased by 34.6% (Peng et al. 2014). Wu et al. optimized initial concentration of precursor amino acids for iturin A production and reported that. l-Ser exhibited the highest saturation level at 1.2% (12 g/L). Consequently, an iturin A yield of 0.914 g/L was obtained over a 7 days fermentation (the productivity was 0.13 g/L/day) (Wu et al. 2018). By optimizing the concentrations of the added amino acids (Asn, Glu, and Pro: 0.14562, 0.25478, and 0.05 g/L, respectively), Xu et al. increased the iturin A titer by 28.6% (Tan et al. 2012). In that research, however, the protocol adopted for the preparation of the nitrogen source (soybean protein hydrolysate) was very complicated. Besides, the bacterial delay period was too long (up to12 h).
Although research on enhancement of iturin A production by the addition of precursors has been reported, most studies have focused on the initial concentration in the medium. Meanwhile, reports of systematic research on the addition of precursor amino acids during fermentation are lacking. In our lab, A novel strain capable of producing iturin A was separated and mutated in our laboratory and identified as B. subtilis ZK-H2. The objective of this study was to establish and optimize the addition strategy of precursor amino acids during fermentation to achieve a maximal yield of iturin A.
Materials and methods
Microorganism
The iturin A producing B. subtilis ZK-H2 strain was previously separated and mutated in our laboratory and maintained at −20 °C.
Medium
The slant culture medium used for activation and storage of Bacillus subtilis ZK-H2 strain had the following composition (in g/L, unless otherwise specified): glycerin 10, peptone from fish 20, K2HPO4 1.5, MgSO4·7H2O 1.8, and agar 18. The seed culture medium contained (g/L) glucose 20, peptone from fish 30, KH2PO4 4, and MgSO4·7H2O 3. The initial pH of the seed culture medium was adjusted to 7.0 and autoclaved at 121 °C for 30 min. The fermentation culture medium was composed of (in g/L) glucose 21, soy protein total nitrogen 4, MgSO4·7H2O 3.8, KH2PO4 1.5, and yeast extract 0.4. The initial pH of the fermentation broth was adjusted to 8.0 and autoclaved at 121 °C for 30 min.
Fermentation conditions
Strain ZK-H2 was activated in the slant culture medium at 30 °C for 24 h. For the preparation of seed culture, the activated strain was inoculated into 100 mL seed medium in 500 mL flasks and cultured in a rotary shaker (150 rpm) at 30 °C for 20 h. Then, the seed fermentation broth was added on to 60 mL fermentation culture medium in 250 mL flasks by 10% of the inoculum and incubated on a rotary shaker (150 rpm) for 60 h at 30 °C.
Optimization of nitrogen and carbon source in shake flasks
The specified nitrogen sources (soy protein, peptone from fish and tryptone) were study at an initial total nitrogen concentration of 4.0 g/L. The other components of the production medium were the same as the fermentation culture medium. The carbon source was glucose. The initial concentrations of glucose were 11, 16, 21, 26, 31 g/L. The other components of the medium were the same as the fermentation culture medium. The fermentation conditions were as follows: 150 rpm, 60 h and 30 °C.
Batch fermentation of iturin A in shake flasks
The fermentation of iturin A by strain ZK-H2 was conducted based on the optimized nitrogen and carbon sources. The fermentation conditions were as follows: 150 rpm, 60 h and 30 °C. The fermentation broth samples were taken at 0, 3, 6, 9, 12, 15, 18, 21, 24, 28, 32, 36, 42, 48, 54 and 60 h, and stored at −20 °C until use for the various analyses.
Optimization of iturin A production by single-factor experiments
Iturin A production was optimized using single-factor experiments. Six independent variables, including Asn, Asp, Glu, Gln, Pro, and Ser concentrations (g/L), were the parameters used to optimize iturin A production rates. The concentrations of each amino acid ranged from 0.04 to 0.36 g/L (0.04, 0.12, 0.20, 0.28, 0.36 g/L). Each of the six amino acids was added in the fed-batch fermentation at 3 h or 12 h, respectively. The control fermentation medium (g/L): glucose 21, soy protein total nitrogen 4, MgSO4·7H2O 3.8, KH2PO4 1.5, yeast extract 0.4, the initial pH of the fermentation broth was adjusted to 8.0 and autoclaved at 121 °C for 30 min. And the fermentation conditions: 150 rpm for 60 h at 30 °C.
Optimization of iturin A production by response surface methodology (RSM)
The optimization of iturin A production was performed using the response surface methodology (RSM) based on single-factor experiments. A 3-level-3-factor design was employed to elucidate the influence of Asn, Gln, and Pro concentrations (g/L) on iturin A production. The levels and codes of independent variables are presented in Table 1. Statistical analyses of the data were performed by the Design-Expert software package 8.0.
Table 1.
Level of variables chosen for experimental design
| Symbol | Variable | Coded level | Unit | ||
|---|---|---|---|---|---|
| −1 | 0 | 1 | |||
| A | Pro | 0.04 | 0.12 | 0.20 | g/L |
| B | Gln | 0.04 | 0.12 | 0.20 | g/L |
| C | Pro | 0.04 | 0.12 | 0.20 | g/L |
Determination of cell concentration
Cell concentration was monitored intermittently by measuring the cell density of the culture broth by a hemocytometer.
Measurement of reducing sugar concentrations
The concentrations of reducing sugars were determined by the 3,5-dinitrosalicylic acid (DNS) method described by (Miller et al. 1960).
Determination of amino acids
The amino acids were quantitatively analyzed by high-performance liquid chromatography (Agilent, USA) equipped with a Venusil AA column (250 mm × 4.6 mm, Agela Technologies, USA) according to the directions in the Venusil AA analysis kit (Agela Technologies, USA).
Extraction and quantification of iturin A
An aliquot of ZK-H2 culture (1 mL) was centrifuged at 9300 RCF for 10 min, and the supernatant precipitated in a microtube containing 80 μL of 15% HCl. The mixture was left standing at 4 °C for 12 h, then centrifuged again at 9300 RCF for 10 min. The precipitate was recovered and mixed with 500 μL of methanol. After 30-min extraction, the mixture was centrifuged again at 9300 RCF for 10 min, and the supernatant filtered through a 0.22-μm pore-size hydrophobic polytetrafluoroethylene (PTFE) syringe filter unit (the diameter is13 mm). Samples of the supernatant were analyzed by reverse-phase, high-performance liquid chromatography (RP-HPLC) using an HC-C18(2) column (4.6 mm × 150 mm, Agilent, USA) in a 1260 Infinity HPLC system (Agilent, USA) operated at a flow rate of 0.8 mL/min. A mixture of acetonitrile and 10 mM ammonium acetate (3:4, v/v) was used as the eluent (pH 7.16), and the column outflow was monitored by measuring the absorbance at 214 nm. The concentrations of iturin A and measurement deviations at different sampling times were determined from triplicate samples.
Results and discussion
Influence of soy protein and initial glucose concentrations on iturin A production in shake flasks
Soy protein was processed from soybean meal, which releases nitrogen during industrial fermentation. The nutrients released during fermentation can act as precursors for other steps in the same process. Previous research in our laboratory has shown that the optimal concentration of soy protein for iturin A production is 4.0 g/L (soy protein total nitrogen). Therefore, an initial soy protein total nitrogen concentration of 4.0 g/L was adopted to ensure a similar nitrogen content with peptone from fish and tryptone. As shown in Fig. 1, the optimal nitrogen source was soy protein. After 60 h fermentation by B. subtilis ZK-H2 using soy protein as a nitrogen source, the highest iturin A production was 0.64 g/L, which was 42% and 23% higher than that attained when peptone from fish and tryptone were used as nitrogen sources, respectively.
Fig. 1.
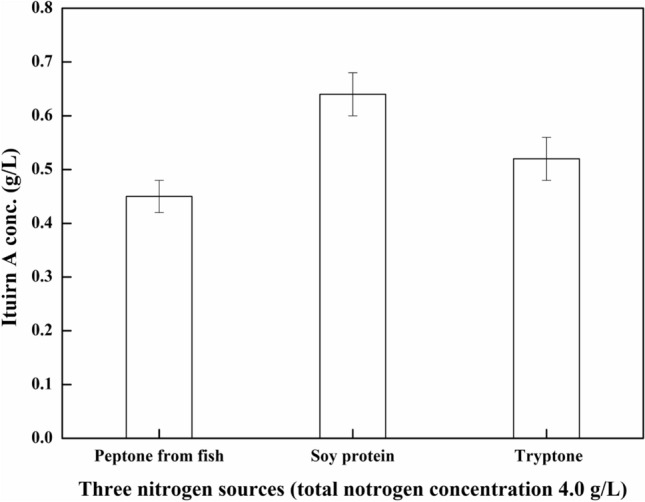
Effect of different nitrogen sources on iturin A production. Three nitrogen sources (the total nitrogen concentration was 4.0 g/L) was added in fermentation medium. The culture condition: initial pH 8.0, temperature 30 °C, rotating speed 150 rpm, fermentation time 60 h
The influence of different initial glucose concentrations, ranging from 11 to 31 g/L, on iturin A production is shown in Fig. 2. The iturin A production gradually increased with an increase in the initial glucose concentration from 11 to 26 g/L. The optimal initial glucose concentration for producing iturin A was found to be 26 g/L, while the corresponding iturin A production was 0.66 g/L (which was higher than that of 0.64 g/L when initial glucose concentration was 21 g/L, but not significant). However, the continued increase in initial glucose concentration from 26 to 31 g/L reduced iturin A production, implying that higher initial glucose concentrations might not be suitable for iturin A production. An initial glucose concentration of 21 g/L was chosen to ensure maximal yield while maintaining a low cost of industrial iturin A production.
Fig. 2.

Influence of different initial glucose concentrations on iturin A production at 60 h in shake flasks. The effect of different initial glucose concentrations ranging from 11 to 31 g/L on iturin A production. The culture condition: initial pH 8.0, temperature 30 °C, rotating speed 150 rpm, fermentation time 60 h
Growth of B. subtilis ZK-H2 strain and iturin A production
The fermentation of iturin A by B. subtilis ZK-H2 was conducted in shake flasks, using the optimized glucose concentration (21 g/L) and nitrogen source (soy protein). Figure 3 shows changes in the cell concentration of B. subtilis ZK-H2, reducing sugar consumption, and iturin A production with time. Cell growth began immediately after the transfer of the seed culture on to the shaking flask. The logarithmic phase occurred for a short period (3–15 h), in which glucose concentration first increased (3–6 h) then declined gradually until the end of fermentation. During the entire flask fermentation period, iturin A production was continuous, and the maximum iturin A concentration reached 0.64 g/L at 60 h.
Fig.3.
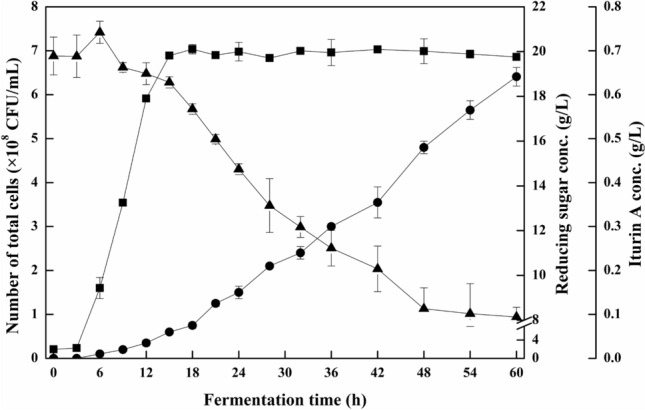
Batch fermentation of iturin A from B. subtilis ZK-H2 with time in shake flasks. Filled square: cell concentration; filled circle: iturin A concentration; filled triangle: reducing sugar concentration. The initial glucose concentration was 21 g/L and the nitrogen
source was soybean protein (total nitrogen concentration 4.0 g/L). The fermentation conditions were as follows: initial pH 8.0, temperature 30 °C, rotating speed 150 rpm, fermentation time 60 h. The samples were taken at 0, 3, 6, 9, 12, 15, 18, 21, 24, 28, 32, 36, 42, 48, 54 and 60 h, and stored at −20 °C
The consumption rates of the five amino acids in shake flasks are shown in Fig. 4. In batch fermentation using soy protein as a nitrogen source, l-aspartic acid, l-glutamic acid, and l-serine concentrations declined during the early (0–9 h) and middle stages (9–24 h) of fermentation, and then remained low till the end of fermentation. l-serine concentration decreased from 2.894 × 10⁻² to 1.93 × 10⁻² g/L during the early stage then remained at 1.85 × 10⁻³–3.13 × 10⁻³ g/L until 60 h. l-aspartic acid and l- glutamic acid concentrations gradually decreased during the early and middle stages from 4.782 × 10⁻² and 8.744 × 10⁻² g/L to 1.54 × 10⁻² and 4.51 × 10⁻³ g/L, respectively. The concentrations of these two amino acids then remained at a lower level of 7.3 × 10⁻⁴–1.74 × 10⁻³ g/L and 4.36 × 10⁻³–5.45 × 10⁻³ g/L till the end of fermentation, respectively. During the entire fermentation process, l-tyrosine concentration could be maintained at a stable level of 5.507 × 10⁻²–6.356 × 10⁻² g/L, while l-proline concentration rose from 3.11 × 10⁻³ to 4.106 × 10⁻² g/L. Thus, based on Figs. 3 and 4, precursor amino acids may significantly enhance iturin A production, and the changing patterns of precursor amino acids could reflect the metabolic characteristics of B. subtilis ZK-H2 and thus provide crucial information on iturin A industrial production.
Fig. 4.
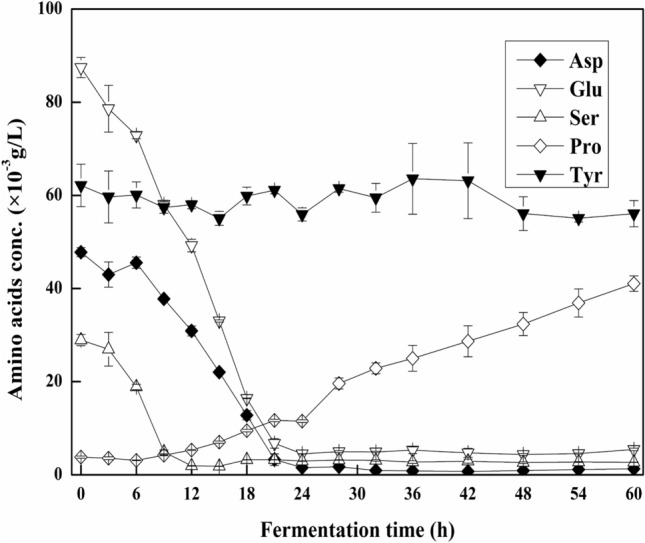
The consumption of amino acids with time in shake flasks. Filled diamond: Asp; opened inverted triangle: Glu; opened triangle: Ser; opened diamond: Pro; filled inverted triangle: Tyr. The initial glucose concentration was 21 g/L and the nitrogen
source was soybean protein (total nitrogen concentration 4.0 g/L). The fermentation conditions were as follows: initial pH 8.0, temperature 30℃, rotating speed 150 rpm, fermentation time 60 h. The samples were taken at 0, 3, 6, 9, 12, 15, 18, 21, 24, 28, 32, 36, 42, 48, 54 and 60 h, and stored at −20 °C
Effect of precursor amino acids
Amino acids were added to the fermentation because the structure of iturin A contains seven amino acids. Specifically, amino acids as precursors might promote the formation of iturin A. Wu et al. reported that l-tyrosine negatively affected iturin A production, leading to lower iturin A yields in shake flasks (Wu et al. 2018). Also, Besson et al. also reported that the addition of tyrosine during B.subtilis cultivation reduces the production of iturin A (Besson et al. 1987). In addition, aspartic acid could be converted to asparagine via transamination, and glutamic acid could be condensed to glutamine by glutamine synthetase. Thus l-aspartic acid, l-asparagine, l-glutamic acid, l-glutamine, l-serine, and l-proline were added to determine their effect on iturin A production and to optimize the fermentation. The impact of amino acid addition at 3 h on iturin A production was also determined, and the results are presented in Fig. 5. As shown in Fig. 5A, the addition of l-proline could increase the yield of iturin A significantly, with the maximum output (0.76 ± 0.03 g/L) obtained at an l-proline concentration of 0.12 g/L. However, the addition of the other amino acids did not significantly influence the formation of iturin A.
Fig. 5.

Effects of adding amino acids (40, 120, 200, 280, 360 × 10–3 g/L) at 3 h on the production of iturin A in shake flasks. a Pro; b Asp; c Asn; d Glu; e Gln; f Ser. The culture condition: initial pH 8.0, temperature 30 °C, rotating speed 150 rpm, fermentation time 60 h
Moreover, cell growth could be enhanced by the addition of appropriate concentrations of amino acids (Asp, Asn, Glu, Gln, and Pro), as shown in Table 2. The number of cells increased with an increase in amino acid concentration. When l-glutamine concentration was 0.36 g/L, the number of cells reached the maximum, 7.70 × 10⁸ CFU/mL. These findings suggest that apart from l-serine, all the tested amino acids could increase the cell concentration, but had no significant effect on the yield of iturin A.
Table 2.
Effects of adding amino acids at 3 h on the cell growth of ZK-H2 in shake flasks
| AA | Asp | Asn | Glu | Gln | Pro | Ser |
|---|---|---|---|---|---|---|
| CC | ||||||
| Level | ||||||
| CK | 6.48 ± 0.10 | 6.53 ± 0.43 | 6.41 ± 0.14 | 6.50 ± 0.12 | 6.50 ± 0.16 | 7.58 ± 0.03 |
| 0.04 | 6.67 ± 0.12 | 6.68 ± 0.01 | 6.53 ± 0.05 | 6.50 ± 0.44 | 6.72 ± 0.15 | 7.59 ± 0.02 |
| 0.12 | 6.74 ± 0.24 | 6.72 ± 0.18 | 6.56 ± 0.25 | 6.73 ± 0.24 | 6.85 ± 0.12* | 7.58 ± 0.02 |
| 0.20 | 6.84 ± 0.17 | 6.73 ± 0.27 | 6.96 ± 0.15* | 6.81 ± 0.12* | 7.04 ± 0.15* | 7.58 ± 0.02 |
| 0.28 | 6.91 ± 0.07* | 6.86 ± 0.19 | 7.01 ± 0.06* | 7.17 ± 0.19* | 7.10 ± 0.22* | 7.58 ± 0.03 |
| 0.36 | 6.96 ± 0.25 | 7.15 ± 0.12* | 7.10 ± 0.1* | 7.70 ± 0.34* | 6.96 ± 0.09* | 7.61 ± 0.61 |
AA amino acid; CC cell concentration (× 108 CFU/mL)
*Significant at 0.05 level; level: g/L; fermentation time: 60 h; CK: 0 g/L
However, the addition of optimal amino acid concentrations (Asp, Asn, Glu, Gln, and Pro) at 12 h promoted both the yield of iturin A and the number of cells (Fig. 6).
Fig. 6.

Effects of adding amino acids (40, 120, 200, 280, 360 × 10–3 g/L) at 12 h on the production of iturin A in shake flasks. A: Pro; B: Asp; C: Asn; D: Glu; E: Gln; F: Ser. The culture condition: initial pH 8.0, temperature 30 °C, rotating speed 150 rpm, fermentation time 60 h
The addition of different concentrations of l-serine at 12 h did not significantly affect iturin A production. In this test, each amino acid was separately added at 12 h in subsequent experiments to determine the effect on the yield of iturin A (shown in Fig. 6). Relative to the yield of the control (0.64 g/L), the addition of each amino acid (l-Asn, l-Glu, l-Gln, and l-Pro) at concentrations of 0.12 g/L increased the yield of iturin A to a maximum (0.75, 0.73, 0.77, and 0.76 g/L, respectively)). Further, increasing the concentration of l-aspartic acid to 0.04 g/L significantly improved the yield to 0.76 g/L. However, l-serine had no significant effect on iturin A production. It was found that the addition of amino acids at 3 h and 12 h in subsequent experiments positively affected the number of cells (Tables 2 and 3). Meanwhile, the addition of amino acids at 12 h in subsequent experiments significantly increased the yield of iturin A. Although iturin A could be obtained during the logarithmic phase, the amino acids added at 3 h mainly promoted cell multiplication. As shown in Fig. 4, the concentrations of free amino acids in the medium, except l-Tyr, were significantly low at the end of the logarithmic phase. Thus, the addition of amino acids at 12 h did not only provide the nutritional components for cell growth but also provided the required precursor amino acids for iturin A synthesis. Therefore, the addition of aspartic acid, asparagine, glutamic acid, glutamine, and proline at 12 h had a positive effect on the yield of iturin A. Finally Asn, Gln and Pro (added at 12 h) were chosen to optimize the yield by RSM.
Table 3.
Effects of adding amino acids at 12 h on cell growth of ZK-H2 in shake flasks
| AA | Asp | Asn | Glu | Gln | Pro | Ser |
|---|---|---|---|---|---|---|
| CC | ||||||
| Level | ||||||
| CK | 6.67 ± 0.10 | 6.58 ± 0.30 | 6.51 ± 0.13 | 6.68 ± 0.08 | 6.48 ± 0.33 | 6.50 ± 0.19 |
| 0.04 | 6.77 ± 0.12 | 6.79 ± 0.41 | 6.45 ± 0.4 | 7.48 ± 0.30* | 6.72 ± 0.07* | 6.56 ± 0.12 |
| 0.12 | 6.88 ± 0.13 | 6.72 ± 0.23 | 6.50 ± 0.11 | 7.44 ± 0.18* | 6.96 ± 0.09* | 6.61 ± 0.16 |
| 0.20 | 6.86 ± 0.31 | 6.89 ± 0.12* | 6.65 ± 0.19 | 6.96 ± 0.06* | 6.89 ± 0.19 | 6.80 ± 0.14 |
| 0.28 | 7.09 ± 0.23 | 6.96 ± 0.08* | 6.87 ± 0.09* | 6.84 ± 0.14 | 7.04 ± 0.18* | 7.02 ± 0.19* |
| 0.36 | 7.07 ± 0.09* | 7.11 ± 0.13* | 6.97 ± 0.1 | 6.77 ± 0.38 | 7.13 ± 0.11* | 7.00 ± 0.02* |
AA amino acid, CC cell concentration (× 108 CFU/mL)
*Significant at 0.05 level; level: g/L; fermentation time: 60 h; CK: 0 g/L
Optimization of iturin A production by the Box–Behnken design (BBD)
The response surface method can quickly and effectively determine the optimal conditions of multi-factor systems by analyzing the factors and interactions of the parameters that need optimization (Ambati and Ayyanna 2001; Ratnam et al. 2003; Trupkin et al. 2003). The results of the RSM experiment are shown in Table 4. According to the analysis of variances and regression analysis of the results shown in Table 5, the fitted quadratic model can be represented by:
| 1 |
where Y is the predicted yield of iturin A, while A, B, and C are the coded values of Asn, Gln, and Pro, respectively.
Table 4.
Results of RSM experiment
| Run | Asn (g/L) | Gln (g/L) | Pro (g/L) | R (g/L) |
|---|---|---|---|---|
| 1 | 0.20 | 0.12 | 0.20 | 0.77 |
| 2 | 0.12 | 0.04 | 0.20 | 0.74 |
| 3 | 0.04 | 0.12 | 0.04 | 0.74 |
| 4 | 0.20 | 0.04 | 0.12 | 0.77 |
| 5 | 0.20 | 0.12 | 0.04 | 0.75 |
| 6 | 0.04 | 0.20 | 0.12 | 0.81 |
| 7 | 0.12 | 0.04 | 0.20 | 0.77 |
| 8 | 0.20 | 0.20 | 0.12 | 0.82 |
| 9 | 0.12 | 0.20 | 0.04 | 0.82 |
| 10 | 0.12 | 0.20 | 0.20 | 0.81 |
| 11 | 0.12 | 0.12 | 0.12 | 0.78 |
| 12 | 0.12 | 0.12 | 0.12 | 0.79 |
| 13 | 0.12 | 0.12 | 0.12 | 0.80 |
| 14 | 0.04 | 0.04 | 0.12 | 0.73 |
| 15 | 0.12 | 0.12 | 0.12 | 0.78 |
| 16 | 0.04 | 0.12 | 0.20 | 0.72 |
| 17 | 0.12 | 0.12 | 0.12 | 0.78 |
Table 5.
Analysis of variance for response surface quadratic model
| Source | Sum of squares | df | Mean square | F value | p value Prob > F | Significance |
|---|---|---|---|---|---|---|
| Model | 1.52E-02 | 9 | 1.69E-03 | 29.99 | < 0.0001 | Significant |
| A-Asn | 1.51E-03 | 1 | 1.51E-03 | 26.80 | 0.0013 | |
| B-Gln | 7.81E-03 | 1 | 7.81E-03 | 138.45 | < 0.0001 | |
| C-Ser | 5.00E-05 | 1 | 5.00E-05 | 0.89 | 0.3779 | |
| AB | 2.25E-04 | 1 | 2.25E-04 | 3.99 | 0.0860 | |
| AC | 4.00E-04 | 1 | 4.00E-04 | 7.09 | 0.0324 | |
| BC | 4.00E-04 | 1 | 4.00E-04 | 7.09 | 0.0324 | |
| A^2 | 1.99E-03 | 1 | 1.99E-03 | 35.30 | 0.0006 | |
| B^2 | 1.40E-03 | 1 | 1.40E-03 | 24.85 | 0.0016 | |
| C^2 | 1.56E-03 | 1 | 1.56E-03 | 27.65 | 0.0012 | |
| Residual | 3.95E-04 | 7 | 5.64E-05 | |||
| Lack of Fit | 7.50E-05 | 3 | 2.50E-05 | 0.31 | 0.8167 | Not significant |
| Pure error | 3.20E-04 | 4 | 8.00E-05 | |||
| Cor total | 1.56E-02 | 16 |
The analysis of variance results demonstrates that the regression model was highly significant (P < 0.0001), with an F value of 29.99 (shown in Table 5). The ″Lack of Fit F value" of 0.31 implies that the lack of fit was not significant relative to the pure error. The determination coefficient (R2 = 0.975) indicates that the model could explain 97.5% of the variability in the response. On the other hand, the equation fitted well with the experimental data. The contour graphs (Fig. 7) were plotted to illustrate the interaction of the parameters and the optimum level of tested components on the production of iturin A, by maintaining the other two factors constant their middle levels. According to Xu et al. (2008), elliptical contours are formed in the contour graphs when there is a significant interaction between the examined variables (Xu et al. 2008). As shown in Table 5, Asn (A) (P = 0.0013) and Gln (B) (P < 0.0001) had highly significant effects on the yield of iturin A. The impact of the interaction between Asn (A) and Gln (B) was not significant (P = 0.086) at the 95% confidence level. Meanwhile, quadratic effects on the yield of iturin A were highly significant. The optimal values of Asn, Gln, and Pro were 0.0752, 0.1992, and 0.1464 g/L, respectively. The maximum predicted yield of iturin A was 0.82 g/L.
Fig. 7.

Contour graphs for production of iturin A at varying concentrations. A: interaction of Asn and Gln concentration; B: interaction of Asn and Pro concentration; C: interaction of Gln and Pro concentration
To validate this prediction, three independent experiments were performed using the following optimized conditions: 0.075.2 g/L Asn; 0.1992 g/L Gln, and 0.1464 g/L Pro. The average yield of iturin A obtained using the optimized medium was 0.85 ± 0.06 g/L (had no significant difference from the predicted value), which was 32.81% higher than that obtained using the initial medium (0.64 g/L). This excellent correlation between predicted and measured values validates the accuracy and reliability of the model.
Conclusions
In the present work, the initial glucose concentrations and the nitrogen source have been optimized. And the optimized initial glucose concentration was 21 g/L, the optimized nitrogen source was soy protein. Single-factor experiments were also conducted to evaluate the types of amino acids (Asn, Gln, and Pro) and adding time (12 h) suitable for the maximal yield of iturin A. Subsequently, the response surface methodology (RSM) was used to evaluate the optimal amino acid addition process: 0.0752 g/L Asn; 0.1992 g/L Gln; 0.1464 g/L Pro and addition time 12 h. Under these optimized conditions, the yield of iturin A was 0.85 g/L (the productivity was 0.34 g/L/day), which is 32.81% higher than that obtained using the control medium. The optimal process parameters obtained via this strategy were found reliable and valid. Besides, the process could guide the scale-up of iturin A production, solve the problem of amino acid deficiency during the fermentation, and increase the yield of iturin A from B. subtilis ZK-H2 in a submerge fermentation.
Electronic supplementary material
Below is the link to the electronic supplementary material.
Acknowledgements
The authors thank the Chinese Academy of Sciences (CAS) Light of West China Program (Grant No. 2017XBZG_XBQNXZ_B_006), the Key Laboratory of Environmental and Applied Microbiology of the Chengdu Institute of Biology CAS (grant No. KLCAS-2018-3) and Innovation Academy for Seed Design CAS for financial support of this work.
Authors contributions
HY carried out the experiments. HY and JZ established the feeding method. HY, JY, DL and JZ participated in the Separation and extraction of iturin A. HY, ZL, DS and HW participated in the statistical analysis. HT conceived of the study, and participated in the design and coordination and helped to draft the manuscript. All authors read and approved the final manuscript.
Compliance with ethical standards
Conflict of interest
The authors declare that they have no conflict of interest.
Contributor Information
Hua Yue, Email: arnold_yue@126.com.
Juan Zhong, Email: zjuan6@126.com.
Zhemin Li, Email: lizml@cib.ac.cn.
Jinyan Zhou, Email: zhoujy@cib.ac.cn.
Jie Yang, Email: yangjie197151@126.com.
Hongfei Wei, Email: hong.fei.wei@163.com.
Dan Shu, Email: whosecats@163.com.
Di Luo, Email: lddd24@163.com.
Hong Tan, Email: tanhong@cib.ac.cn, Email: abath@cib.ac.cn.
References
- Aharonowitz Y. Nitrogen metabolite regulation of antibiotic biosynthesis. Annu Rev Microbiol. 1980;34:209. doi: 10.1146/annurev.mi.34.100180.001233. [DOI] [PubMed] [Google Scholar]
- Ambati P, Ayyanna C. Optimizing medium constituents and fermentation conditions for citric acid production from palmyra jaggery using response surface method. World J Microb Biot. 2001;17:331–335. doi: 10.1023/A:1016613322396. [DOI] [Google Scholar]
- Besson F, Peypoux F, Michel G, Delcambe L. Identification of antibiotics of iturin group in various strains of Bacillus subtilis. J Antibiot. 1978;31:284–288. doi: 10.7164/antibiotics.31.284. [DOI] [PubMed] [Google Scholar]
- Besson F, Chevanet C, Michel G. Influence of the culture medium on the production of iturin A by Bacillus subtilis. J Gen Microbiol. 1987;133:767–772. doi: 10.1099/00221287-133-3-767. [DOI] [PubMed] [Google Scholar]
- Cho SJ, Lee SK, Cha BJ, Kim YH, Shin KS. Detection and characterization of the Gloeosporium gloeosporioides growth inhibitory compound iturin A from Bacillus subtilis strain KS03. FEMS Microbiol Lett. 2003;223:47–51. doi: 10.1016/S0378-1097(03)00329-X. [DOI] [PubMed] [Google Scholar]
- Das P, Mukherjee S, Sen R. Genetic regulations of the biosynthesis of microbial surfactants: an overview. Biotechnol Genet Eng. 2008;25:165–185. doi: 10.5661/bger-25-165. [DOI] [PubMed] [Google Scholar]
- Fravel DR. Commercialization and implementation of biocontrol. Annu Rev Phytopathol. 2005;43:337–359. doi: 10.1146/annurev.phyto.43.032904.092924. [DOI] [PubMed] [Google Scholar]
- Gong M, Wang JD, Zhang J, Yang H, Lu XF, Pei Y, Cheng JQ. Study of the antifungal ability of Bacillus subtilis strain PY-1 in vitro and identification of its antifungal substance (iturin A) Acta Biochem Biophys Sin. 2006;38:233–240. doi: 10.1111/j.1745-7270.2006.00157.x. [DOI] [PubMed] [Google Scholar]
- Jin H, et al. Direct bio-utilization of untreated rapeseed meal for effective Iturin A production by Bacillus subtilis in submerged fermentation. PLoS ONE. 2014;9:e111171. doi: 10.1371/journal.pone.0111171. [DOI] [PMC free article] [PubMed] [Google Scholar]
- Jin H, Li KP, Niu YX, Guo MA, Hu CJ, Chen SW, Huang FH. Continuous enhancement of iturin A production by Bacillus subtilis with a stepwise two-stage glucose feeding strategy. BMC Biotechnol. 2015;15:53. doi: 10.1186/s12896-015-0172-6. [DOI] [PMC free article] [PubMed] [Google Scholar]
- Kim PI, Ryu J, Kim YH, Chl YT. Production of biosurfactant lipopeptides Iturin A, Fengycin, and Surfactin A from Bacillus subtilis CMB32 for control of Colletotrichum gloeosporioides. J Microbiol Biotechn. 2010;20:138–145. doi: 10.4014/jmb.0905.05007. [DOI] [PubMed] [Google Scholar]
- Klich MA, Lax AR, Bland JM. Inhibition of some mycotoxigenic fungi by Iturin-A, a peptidolipid produced by Bacillus subtilis. Mycopathologia. 1991;116:77–80. doi: 10.1007/Bf00436368. [DOI] [PubMed] [Google Scholar]
- Larsson DGJ. Antibiotics in the environment Upsala. J Med Sci. 2014;119:108–112. doi: 10.3109/03009734.2014.896438. [DOI] [PMC free article] [PubMed] [Google Scholar]
- Li XH, Zhang YZ, Wei ZW, Guan ZB, Cai YJ, Liao XR. Antifungal activity of isolated Bacillus amyloliquefaciens SYBC H47 for the biocontrol of Peach Gummosis. PLoS ONE. 2016;11:e0162125. doi: 10.1371/journal.pone.0162125. [DOI] [PMC free article] [PubMed] [Google Scholar]
- Liao JH, Chen PY, Yang YL, Kan SC, Hsieh FC, Liu YC. Clarification of the antagonistic effect of the lipopeptides produced by Bacillus amyloliquefaciens BPD1 against Pyricularia oryzae via in situ MALDI-TOF IMS analysis. Molecules. 2016;21:1670. doi: 10.3390/molecules21121670. [DOI] [PMC free article] [PubMed] [Google Scholar]
- Lin HY, Rao YK, Wu WS, Tzeng YM. Ferrous ion enhanced lipopeptide antibiotic iturin A production from Bacillus amyloliquefaciens B128. Int J Appl Sci Eng. 2008;5:123–132. [Google Scholar]
- Magetdana R, Ptak M, Peypoux F, Michel G. Pore-forming properties of Iturin-A, a lipopeptide antibiotic. Biochim BiophysActa. 1985;815:405–409. doi: 10.1016/0005-2736(85)90367-0. [DOI] [PubMed] [Google Scholar]
- Magetdana R, Harnois I, Ptak M. Interactions of the lipopeptide antifungal Iturin-A with lipids in mixed monolayers. Biochem Biophys Acta. 1989;981:309–314. doi: 10.1016/0005-2736(89)90042-4. [DOI] [PubMed] [Google Scholar]
- Martinez JL. Environmental pollution by antibiotics and by antibiotic resistance determinants. Environ Pollut. 2009;157:2893–2902. doi: 10.1016/j.envpol.2009.05.051. [DOI] [PubMed] [Google Scholar]
- Meena KR, Kanwar SS. Lipopeptides as the antifungal and antibacterial agents: applications in food safety and therapeutics. Biomed Res Int. 2015 doi: 10.1155/2015/473050. [DOI] [PMC free article] [PubMed] [Google Scholar]
- Miller GL, Blum R, Glennon WE, Burton AL. Measurement of carboxymethylcellulase activity. Anal Biochem. 1960;1:127–132. doi: 10.1016/0003-2697(60)90004-X. [DOI] [Google Scholar]
- Ongena M, Jacques P. Bacillus lipopeptides: versatile weapons for plant disease biocontrol. Trends Microbiol. 2008;16:115–125. doi: 10.1016/j.tim.2007.12.009. [DOI] [PubMed] [Google Scholar]
- Peng WJ, et al. The artificial neural network approach based on uniform design to optimize the fed-batch fermentation condition: application to the production of iturin A. Microb Cell Fact. 2014 doi: 10.1186/1475-2859-13-54. [DOI] [PMC free article] [PubMed] [Google Scholar]
- Perez-Garcia A, Romero D, de Vicente A. Plant protection and growth stimulation by microorganisms: biotechnological applications of Bacilli in agriculture. Curr Opin Biotechnol. 2011;22:187–193. doi: 10.1016/j.copbio.2010.12.003. [DOI] [PubMed] [Google Scholar]
- Peypoux F, Guinand M, Michel G, Delcambe L, Das BC, Lederer E. Structure Of Iturine-A, a peptidolipid antibiotic from Bacillus subtilis. Biochemistry. 1978;17:3992–3996. doi: 10.1021/bi00612a018. [DOI] [PubMed] [Google Scholar]
- Phister TG, O'Sullivan DJ, McKay LL. Identification of bacilysin, chlorotetaine, and iturin A produced by Bacillus sp. strain CS93 isolated from pozol, a Mexican fermented maize dough. Appl Environ Microb. 2004;70:631–634. doi: 10.1128/Aem.70.1.631-634.2004. [DOI] [PMC free article] [PubMed] [Google Scholar]
- Ratnam BVV, Rao MN, Rao MD, Rao SS, Ayyanna C. Optimization of fermentation conditions for the production of ethanol from sago starch using response surface methodology. World J Microb Biot. 2003;19:523–526. doi: 10.1023/A:1025174731814. [DOI] [Google Scholar]
- Stein T. Bacillus subtilis antibiotics: structures, syntheses and specific functions. Mol Microbiol. 2005;56:845–857. doi: 10.1111/j.1365-2958.2005.04587.x. [DOI] [PubMed] [Google Scholar]
- Tan XU, Ren YL, Zhong J, Tan H. Influence of amino acid addition on Jiean-peptide fermentation. Guangdong Agric Sci. 2012;11:109–113. [Google Scholar]
- Trupkin S, Levin L, Forchiassin F, Viale A. Optimization of a culture medium for ligninolytic enzyme production and synthetic dye decolorization using response surface methodology. J Ind Microbiol Biot. 2003;30:682–690. doi: 10.1007/s10295-003-0099-0. [DOI] [PubMed] [Google Scholar]
- Wei YH, Chu IM. Enhancement of surfactin production in iron-enriched media by Bacillus subtilis ATCC 21332. Enzyme Microb Tech. 1998;22:724–728. doi: 10.1016/S0141-0229(98)00016-7. [DOI] [Google Scholar]
- Wei YH, Chu IM. Mn2+ improves surfactin production by Bacillus subtilis. Biotechnol Lett. 2002;24:479–482. doi: 10.1023/A:1014534021276. [DOI] [Google Scholar]
- Wu JY, Liao JH, Shieh CJ, Hsieh FC, Liu YC. Kinetic analysis on precursors for iturin A production from Bacillus amyloliquefaciens BPD1. J Biosci Bioeng. 2018;126:630–635. doi: 10.1016/j.jbiosc.2018.05.002. [DOI] [PubMed] [Google Scholar]
- Xu H, Sun LP, Shi YZ, Wu YH, Zhang B, Zhao DQ. Optimization of cultivation conditions for extracellular polysaccharide and mycelium biomass by Morchella esculenta As51620. Biochem Eng J. 2008;39:66–73. doi: 10.1016/j.bej.2007.08.013. [DOI] [Google Scholar]
- Yao DH, Ji ZX, Wang CJ, Qi GF, Zhang LL, Ma X, Chen SW. Co-producing iturin A and poly-gamma-glutamic acid from rapeseed meal under solid state fermentation by the newly isolated Bacillus subtilis strain 3–10. World J Microb Biot. 2012;28:985–991. doi: 10.1007/s11274-011-0896-y. [DOI] [PubMed] [Google Scholar]
- Yu GY, Sinclair JB, Hartman GL, Bertagnolli BL. Production of iturin A by Bacillus amyloliquefaciens suppressing Rhizoctonia solani. Soil Biol Biochem. 2002;34:955–963. doi: 10.1016/S0038-0717(02)00027-5. [DOI] [Google Scholar]
Associated Data
This section collects any data citations, data availability statements, or supplementary materials included in this article.