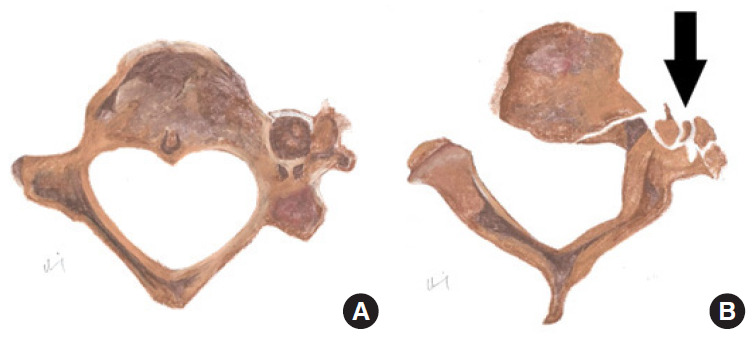
Fig. 13.

Diagrammatic representation of normal transverse foramen (A) in comparison to vertebral artery injury (B) secondary to displaced fracture > 1 mm into the left transverse foramen in axial view. Black arrow indicates the fracture fragments with disruption of the left transverse foramen.
