

Abstract
AMP‐activated protein kinase (AMPK) is a multifunctional kinase that regulates microtubule (MT) dynamic instability through CLIP‐170 phosphorylation; however, its physiological relevance in vivo remains to be elucidated. In this study, we identified an active form of AMPK localized at the intercalated disks in the heart, a specific cell–cell junction present between cardiomyocytes. A contractile inhibitor, MYK‐461, prevented the localization of AMPK at the intercalated disks, and the effect was reversed by the removal of MYK‐461, suggesting that the localization of AMPK is regulated by mechanical stress. Time‐lapse imaging analysis revealed that the inhibition of CLIP‐170 Ser‐311 phosphorylation by AMPK leads to the accumulation of MTs at the intercalated disks. Interestingly, MYK‐461 increased the individual cell area of cardiomyocytes in CLIP‐170 phosphorylation‐dependent manner. Moreover, heart‐specific CLIP‐170 S311A transgenic mice demonstrated elongation of cardiomyocytes along with accumulated MTs, leading to progressive decline in cardiac contraction. In conclusion, these findings suggest that AMPK regulates the cell shape and aspect ratio of cardiomyocytes by modulating the turnover of MTs through homeostatic phosphorylation of CLIP‐170 at the intercalated disks.
Keywords: AMPK, CLIP‐170, intercalated disk, microtubule
Subject Categories: Cardiovascular System; Cell Adhesion, Polarity & Cytoskeleton; Molecular Biology of Disease
Mechanical stress elicited by the heart contractility promotes AMPK localization to the intercalated discs, where AMPK regulates microtubule dynamics and cardiomyocyte function.
Introduction
Adenosine monophosphate‐activated protein kinase (AMPK), a key regulating enzyme for the cellular energy homeostasis, can sense an increase in the intracellular levels of adenosine monophosphate (AMP) or adenosine diphosphate (ADP). The enzyme is fully activated by the phosphorylation of the conserved threonine (Thr) residue in the activation loop by upstream protein kinases, such as liver kinase B1 (LKB1) or calcium/calmodulin‐activated protein kinase kinase 2 (CaMKK2) (Steinberg & Kemp, 2009; Viollet et al, 2010; Hardie et al, 2012). The role of AMPK in activating the downstream signaling pathways involved in ATP production and switching off the anabolic pathways could be explained by the canonical activation of AMPK by energetic stress stimulation. However, AMPK can be activated by various other stimuli, such as an increase in the calcium (Ca2+) levels (Jensen et al, 2007a, 2007b), oxidative stress (Zmijewski et al, 2010), or genotoxic stress (Fu et al, 2008; Ji et ; al, 2010; Sanli et al, 2010). The downstream effects of AMPK activation are not restricted to regulation of metabolism (Hardie & Lin, 2019). AMPK is a multifunctional kinase that regulates cell cycle, polarity, membrane excitability, and a variety of cellular functions by phosphorylating specific sets of substrates, presumably in a spatiotemporal manner (Williams & Brenman, 2008; Hardie, 2011; Hardie et al, 2012).
As such, we previously demonstrated that AMPK controls directional cell migration by modulating the dynamic instability of the microtubule (MT). In Vero cells, AMPK directly phosphorylates the MT cytoplasmic linker protein 170 (CLIP‐170) at residue Ser‐311 (Nakano et al, 2010). MTs, one of the major constituents of the cytoskeleton, are noncovalent polymers made up of tubulin heterodimers. Although involvement of the MT in cytoskeleton suggests it to be a static structure, MTs are highly dynamic. The plus ends of MTs exhibit dynamic instability and individual MT ends fluctuate between the polymerization and depolymerization phases (Desai & Mitchison, 1997). CLIP‐170 is one of the MT plus‐end tracking proteins (+TIPs) that binds to the plus end of MT to protect from depolymerizing factors. As a result, MT polymerization is accelerated. Conversely, removal of CLIP‐170 from the plus end promotes MT depolymerization (Vaart et al, 2009; Lakshmi et al, 2018). This dissociation of CLIP‐170 is regulated by the AMPK‐mediated phosphorylation of CLIP‐170 at residue Ser‐311 (Nakano & Takashima, 2012; Kakeno et al, 2014). In migrating Vero cells, the inhibition of AMPK or the expression of CLIP‐170 Ser‐311‐Ala mutant (CLIP‐170 S311A), which cannot be phosphorylated, leads to an increase in the amount of stable MTs and disturbed cell polarity, thereby impairing the free or directional migration of cells (Nakano et al, 2010). We originally found CLIP‐170 as a novel substrate of AMPK from the tissue homogenates of the mouse heart; the relevance of AMPK‐CLIP‐170 on MT dynamic instability, however, remains to be elucidated in vivo.
One of the most important findings regarding cardiac MTs is that density of MTs increases during end stage of heart failure regardless of the etiology (Zile et al, 2001; Chen et al, 2018; Caporizzo et al, 2020). In a mouse pressure‐overload heart failure model, the expression of MTs increased within the heart (Tsutsui et al, 1993). Interestingly, treatment with colchicine, an MT depolymerizer, reversed MT accumulation and improved cardiac function and survival rate (Zhang et al, 2014). Conversely, paclitaxel, an anti‐cancer drug, which has been shown to stabilize MTs, was reported to induce cardiac dysfunction as a side effect (Yeh et al, 2004). Moreover, increasing MT stability induces human heart failure by impairing contraction (Robison et al, 2016). These findings suggest that effective reversal of cardiac MT stability has a therapeutic potential for the treatment of heart failure (Chen et al, 2018; Caporizzo et al, 2019). However, upstream and downstream mechanisms of MT stabilization in heart are still not well understood in vivo.
As an integral component of the cytoskeleton, cardiac MTs are also important for the maintenance of cell shape, i.e., aspect ratio (length/width ratio). Cardiomyocytes adapt to the elasticity of the extracellular matrix and modulate their aspect ratio to maximize the systolic performance. When a cardiomyocyte changes its aspect ratio on stiff gels, MT polymerization increases. However, the other cytoskeleton components are not involved in changing the cell shape (McCain et al, 2014).
Cardiomyocytes exhibit unique cellular polarity through which they are connected to the neighboring cardiomyocytes only at the short side of the cells, known as the intercalated disk. The intercalated disk in cardiomyocytes is a special type of cell–cell junction, which consists of three types of cell–cell junctions, namely adherence junctions, gap junctions, and desmosomes. They cooperatively reinforce the synchronized cardiac contraction by producing mechanical stability, transmission of forces generated by the myofibrils, and electrical coupling (Perriard et al, 2003; Noorman et al, 2009; Vermij et al, 2017).
Furthermore, it has been demonstrated that a transient receptor potential vanilloid family type 2 (TRPV2) cation channel localizes at the intercalated disks and serves as a mechanoreceptor to maintain the cardiac structure and function (Katanosaka et al, 2014). The structure of intercalated disks undergoes modulation in response to the hemodynamic stress; therefore, mechano‐signaling is compulsory in such feedback systems (Perriard et al, 2003; Noorman et al, 2009). Although the intercalated disks play an important role in cardiac homeostasis and pathophysiology, the mechanism that governs their maintenance in cardiomyocytes and the details of mechano‐signaling that initiates from the intercalated disks are largely unknown.
In this study, we revealed that AMPK localized within the intercalated disk of the heart regulates the MT dynamics through CLIP‐170 phosphorylation. Mechanical stress regulated the localization of AMPK. Inhibition of CLIP‐170 phosphorylation resulted in the accumulation of MTs and an increase in the individual cell area. Our data also revealed the important association between mechano‐signaling and regulation of cell shape through MT dynamics, which is regulated by AMPK at the intercalated disks.
Results
AMPK and phosphorylated CLIP‐170 are localized at the intercalated disks in murine heart
To gain an insight into the relevance of AMPK and CLIP‐170 in the heart, we first assessed and compared the phosphorylation levels of AMPK and CLIP‐170 in both heart and liver during different developmental stages, starting from embryonic day 15 to 8 weeks after the birth of the mouse (Fig 1A–H). In the liver, the phosphorylation levels of AMPK and acetyl‐CoA carboxylase (ACC), which is a crucial substrate of AMPK known to be involved in the regulation of metabolism, increased simultaneously with mouse development, implying an important role of AMPK in the regulation of systemic metabolism. Conversely, phosphorylation levels of CLIP‐170 in liver did not change throughout the mouse development (Fig 1B and F–H). On the contrary, in heart, the phosphorylation levels of both AMPK and CLIP‐170 were significantly elevated at 8 weeks after birth. The phosphorylation level of ACC in the heart did not correlate with the increase in AMPK phosphorylation levels after birth (Fig 1A and C–E). These data suggest that AMPK in the heart might have a distinct role other than metabolism, especially after birth.
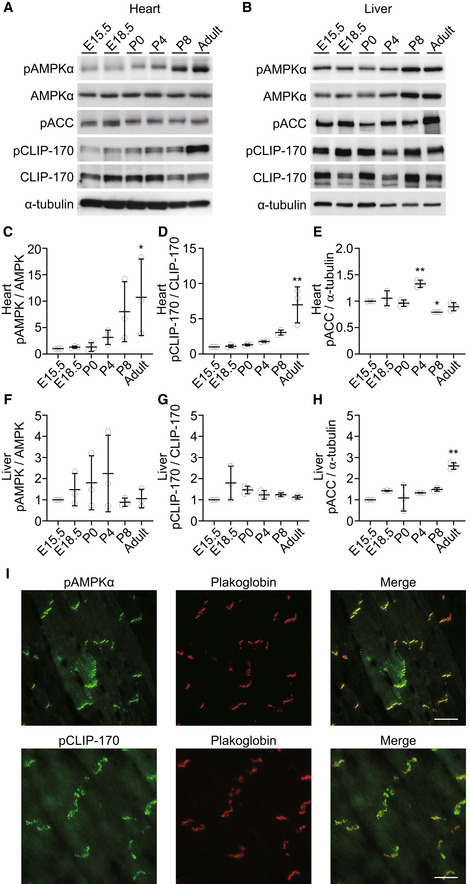
Figure 1. Phosphorylation levels of AMPK significantly increased at the intercalated disks in adult mouse heart together with its substrate CLIP‐170.
-
A, BImmunoblot analysis of the phosphorylation level of CLIP‐170, AMPK, and ACC in heart (A) and liver (B) along with the developmental stages. α‐Tubulin was used as a loading control.
-
C–EQuantitative analysis of Western blotting shown in (A). Multiple tissues from each stage were collected and mixed to minimize variation. The data represent three independent sample collections for the heart and liver. *P < 0.05, **P < 0.01 vs E15.5. One‐way ANOVA followed by Dunnett post hoc test.
-
F–HQuantitative analysis of Western blotting shown in (B). Multiple tissues from each stage were collected and mixed to minimize variation. The data represent three independent sample collections for the heart and liver. **P < 0.01 vs E15.5. One‐way ANOVA followed by Dunnett post hoc test.
-
IImmunostained images of adult mouse heart tissue. These were stained with a phosphorylated AMPK antibody (I, upper), a phosphorylated CLIP‐170 antibody (I, lower), and a plakoglobin antibody (middle). The representative images from more than five analyzed tissues were shown.
Data information: Scale bar, 20 μm (I).
Next, we examined the localization of AMPK through immunohistostaining in an adult murine heart. Surprisingly, majority of phosphorylated AMPK was localized at the intercalated disks, which was confirmed through its co‐localization with plakoglobin (Fig 1I). AMPK is a holoenzyme consisting of three subunits: α, β, and γ. Catalytic domain exists in the α subunit, while the β and γ are regulatory subunits. Further, there are two isoforms for each α and β subunit and three for the γ subunit. The heart expresses α1 and α2, β1 and β2, and γ1 and γ2 isoforms (Bairwa et al, 2016). A subunit‐specific antibody test confirmed the localization of β2 subunit of AMPK within the intercalated disks (Fig EV1A). To eliminate the non‐specific signals in immunohistostaining, we confirmed the localization of AMPK at the cell–cell junctions using mCherry fused the α2 subunits of AMPKs expressed in cultured cardiomyocytes (Fig EV1B). Next, we assessed the activity of AMPK at the plasma membrane in cardiomyocytes by using previously described organelle‐specific AMPK activity probe, ABKAR (Miyamoto et al, 2015). Cardiomyocytes demonstrated significantly higher AMPK activity at the cell–cell junctions compared with HeLa cells (Fig EV1C and D). Moreover, the majority of phosphorylated CLIP‐170 (Fig 1I) and LKB1 (Fig EV1A), an upstream kinase of AMPK, were localized within the intercalated disks. We verified the localization of pAMPK and pCLIP‐170 using lambda phosphatase treatment on the slide (Fig EV1E and F). Intercalated disks are absent during the embryonic developmental stages and are eventually formed by 7–8 weeks after birth (Perriard et al, 2003). Western blot analysis revealed that the levels of phosphorylation of AMPK and CLIP‐170 were upregulated following a time course similar to that of intercalated disk formation (Fig 1A). Altogether, these findings indicate that AMPK, localized within the intercalated disks of heart, phosphorylates its potential substrate CLIP‐170.
Figure EV1. AMPK and its upstream kinase, LKB1, localized at the intercalated disks in adult mouse heart.
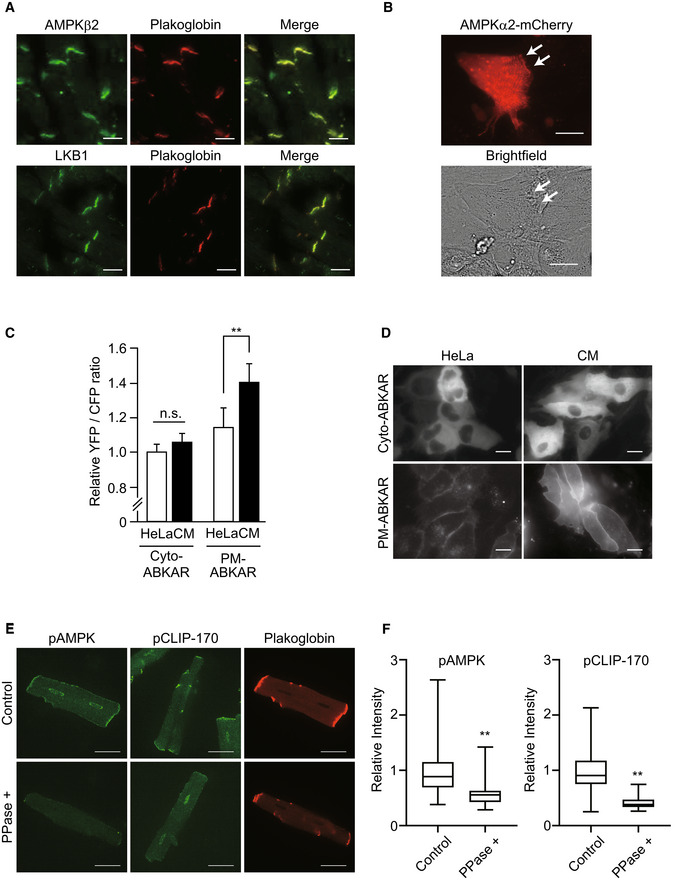
- Immunostained images of adult mouse heart tissue. These were stained with an AMPKβ2 antibody (upper, left), an LKB1 antibody (bottom, left), and a plakoglobin antibody (center). The representative images from more than three analyzed tissues were shown.
- Cardiomyocytes transfected with adenovirus vector encoding AMPKβ2‐mCherry were observed by a fluorescent (mCherry; red) and bright‐field microscope. White arrows indicate that AMPKβ2 localized at the cell–cell junction site of the cardiomyocytes. The data represent two independent experiments.
- Quantitative analysis of FRET signal (YFP/CFP) from organelle‐specific ABKAR. Number of cells analyzed: Cyto‐ABKAR in HeLa (n = 117), Cyto‐ABKAR in cardiomyocytes (n = 112), PM‐ABKAR in HeLa (n = 27), PM‐ABKAR in cardiomyocytes (n = 94). Data means ± SD. All measurements were normalized to the average of Cyto‐ABKAR in HeLa cells. Statistical analysis was done by ANOVA followed by post hoc analysis (Turkey). CM: cardiomyocytes. **P < 0.01.
- Organelle‐specific expression of Cyto‐ or PM‐ABKAR was confirmed by fluorescent microscope.
- Immunostained images of adult cardiomyocytes obtained by Langendorff method. PPase+; lambda phosphatase treatment.
- Quantitative analysis of intensity of pAMPK or CLIP‐170 in (E). Box and whisker plots showed the 25th percentile (bottom line of each box), median (middle line of each box), 75th percentile (top line of each box), maximum and minimum (each whisker). Number of cells analyzed, pAMPK; Control, n = 29, PPase+, n = 28, pCLIP‐170; Control, n = 29, PPase+, n = 26. **P < 0.01 vs Control.
Data information: Scale bar, 20 μm (A, B), 10 μm (D), 20 μm (E).
The localization of AMPK is regulated by contraction of cardiomyocytes
In the heart, proper mechanical stress is essential for maintaining homeostasis, development, and cellular function. An individual cardiomyocyte always undergoes mechanical stress due to spontaneous beating, and thus, protracted decrease in the mechanical stress induces atrophy and cell death in the cardiomyocytes (Perriard et al, 2003). Cardiomyocytes or cells, in general, possess a sensing system that detects mechanical stress or strain. Although the precise molecular mechanism remains unclear, there are several cellular components, including cell membrane and the sarcomere, which are supposedly involved in the mechanical stress sensing phenomenon (Buyandelger et al, 2014). The intercalated disk is one such component. It is critical for detecting the mechanical stress generated through myocyte contraction (Katanosaka et al, 2014).
Therefore, to examine whether contraction of cardiomyocytes influences the activity of AMPK at the cell–cell junctions, we performed immunostaining with anti‐phosphorylated AMPKα antibody, an indicator of activated AMPK in rat primary cardiomyocytes. On day 3 after plating, spontaneous beating of cardiomyocytes was about 60 beats per minute. Addition of 2 μM mavacamten (MYK‐461), a myosin adenosine triphosphatase (ATPase) inhibitor, immediately stopped the heartbeat to zero until removal of the same. After 2 h of treatment with MYK‐461, pAMPKα signals at the cell–cell junctions were significantly reduced. However, the levels of N‐cadherin, an adherens junction component, remained unaltered. After 2 h of MYK‐461 treatment, replacement of the medium with a fresh one without MYK‐461 quickly restored the heartbeat. Four hours after the removal of MYK‐461, the pAMPKα signal reappeared at the cell–cell junctions and cardiac beating resumed (Fig 2A and E). The signal for the β2 subunit of AMPK at the cell–cell junctions was depleted within 2 h of MYK‐461 treatment. However, no difference was observed in the signal corresponding to the sarcomere. Similar to pAMPKα, AMPKβ2 reappeared upon removal of MYK‐461 (Fig 2B and E). MYK‐461 treatment did not alter the localization of connexin 43 or plakoglobin, components of the cell–cell junctions (Fig 2C and E). LKB1 also localized at the cell–cell junctions was not influenced by the MYK‐461 treatment (Fig 2D and E).
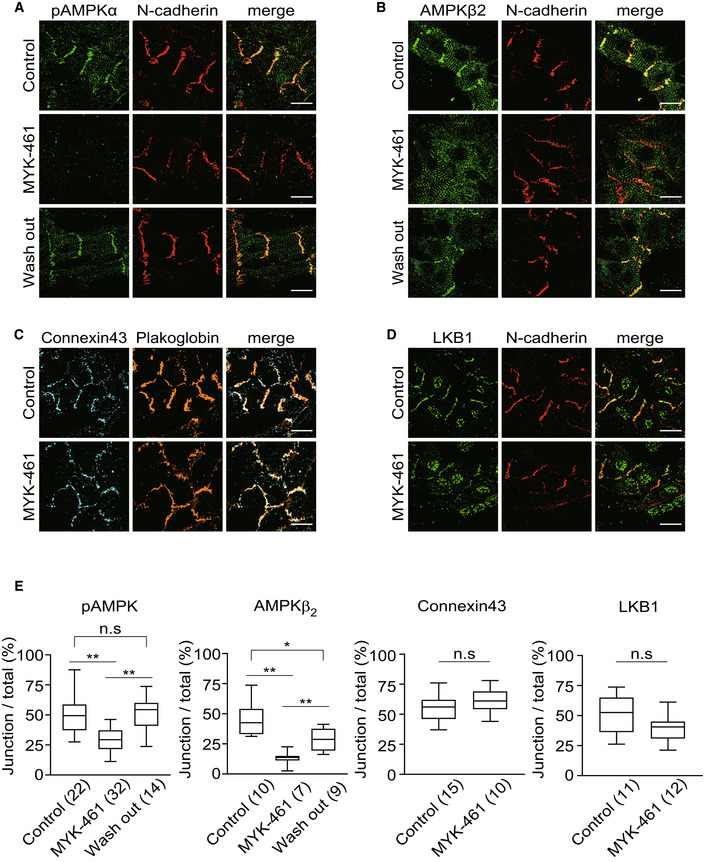
Figure 2. The localization of AMPK was regulated by contraction of the cardiomyocytes.
-
A, BImmunostained images of neonatal rat cardiomyocytes 2 h after treatment with 0.01% DMSO (Control, upper row) or 2 μM MYK‐461(MYK‐461, middle row) and 4 h after washing out of MYK‐461 (Wash out, bottom row). These cells were stained with a phosphorylated AMPK antibody, an AMPKβ2 antibody, and a N‐cadherin antibody.
-
C, DImmunostained images of neonatal rat cardiomyocytes 2 h after treatment with 0.01% DMSO (Control, upper row) or 2 μM MYK‐461(MYK‐461, bottom row) and stained with a connexin 43 antibody, a plakoglobin antibody, an LKB‐1 antibody, and an N‐cadherin antibody. The representative images from four independent experiments were shown.
-
EQuantification of pAMPK, AMPKβ2, Connexin 43, or LKB1 that was localized with a cell–cell junction marker (N‐cadherin or Plakoglobin). Box and whisker plots showed the 25th percentile (bottom line of each box), median (middle line of each box), 75th percentile (top line of each box), maximum and minimum (each whisker). Numbers in the brackets indicate the cells that were analyzed for quantification. Differences among multiple groups were compared by one‐way ANOVA, followed by a post hoc comparison using the Tukey method. Two‐tailed Student's t‐test was used to analyze differences between two groups. *P < 0.05, **P < 0.01. n.s., not significant.
Data information: Scale bar, 20 μm (A‐D).
These data indicate that the localization of AMPK in cardiomyocytes is regulated in response to the contraction or mechanical stress of cardiomyocytes.
AMPK regulates MT plus end dynamics through CLIP‐170 phosphorylation in cardiomyocytes
We have previously demonstrated that AMPK regulates the dynamic instability of MT in migrating Vero cells (Nakano et al, 2010). However, in this study, we assessed the MT dynamics, focusing at the intercalated disks in cardiomyocytes. After 3 days, the cardiomyocytes in the primary culture cells isolated from the rat neonatal heart were connected with the neighboring cardiomyocytes, forming a cell–cell junction. The junction comprised of gap junction proteins, desmosomal proteins, and adherens junction proteins, which are the basic constituents of the intercalated disk. The absence of junction proteins in free plasma membranes without intercellular connections suggests that the heart‐specific polarity was established in these primary cultured cells prior to complete maturation. A time‐lapse image analysis of the rat neonatal cardiomyocytes helped assess the intracellular dynamics of CLIP‐170. In enhanced green fluorescent protein (EGFP)‐tagged CLIP‐170 wild‐type (WT; EGFP‐CLIP‐170 WT) transfected cardiomyocytes, CLIP‐170 migrated from the cell's interior toward the plus end of MTs at the periphery, as visible by the short comet shape observed. In cardiomyocytes with rectangular‐like shape, the majority of CLIP‐170 migrated longitudinally toward the cell–cell junctions (Fig 3A and Movie EV1). These results are distinct from the previously published results that reported CLIP‐170, in migrating cells, radially moved from the microtubule organizing center to the periphery (Nakano et al, 2010). After addition of compound C, an AMPK inhibitor that accumulates specifically at the cell–cell junctions, EGFP‐CLIP‐170 WT signals became elongated and formed lines (Fig 3A and Movie EV1). To exclude the possibility that the observed change was mediated by non‐specific inhibition of other kinases by compound C, we examined the EGFP‐CLIP‐170 WT dynamics in AMPKα1α 2 knockdown (KD) cardiomyocytes using siRNAs. CLIP‐170 comets, on treatment with compound C, became elongated and accumulated at the cell–cell junctions in AMPKα1α2 KD cardiomyocytes (Figs 3C and D and EV2). Moreover, in cardiomyocytes transfected with EGFP‐CLIP‐170 S311A, a non‐phosphorylatable mutant (Nakano et al, 2010), CLIP‐170 accumulated at the cell–cell junctions as elongated comet, similar to compound C‐treated cells or AMPKα1α2 KD cells (Fig 3A and B and Movie EV2).
Figure 3. AMPK regulated longitudinal microtubule dynamics through the phosphorylation of CLIP‐170 in cardiomyocytes.
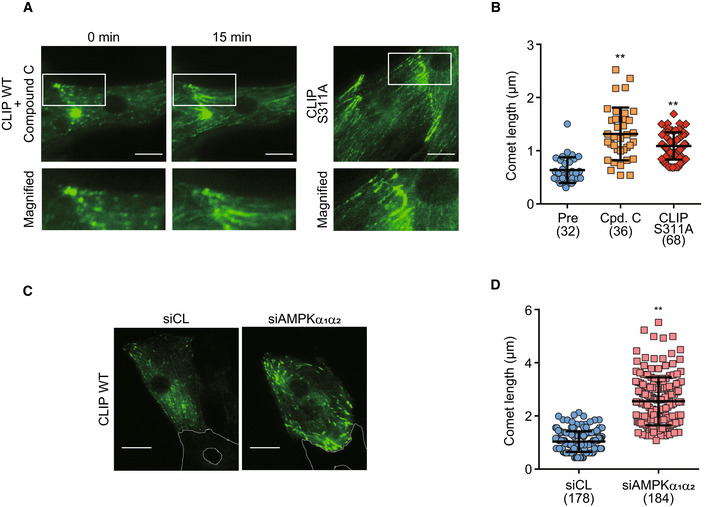
- GFP time‐lapse images of neonatal rat cardiomyocytes expressing EGFP‐CLIP‐170 WT 0 and 15 min after treatment with 20 μM compound C (left side panel) and expressing EGFP‐CLIP‐170 S311A (right side panel). Higher magnification of white square (upper row) showing CLIP‐170 migrated longitudinally toward the cell–cell junctions.
- Beeswarm plots of comet length of EGFP‐CLIP‐170. The comet length from multiple cells in different fields was analyzed. Number of comets analyzed, Pre: n = 32, Cpd. C: n = 36, CLIP S311A: n = 68. Data means ± SD. Differences among multiple groups were compared by one‐way ANOVA, followed by a post hoc comparison using the Tukey method. **P < 0.01 vs Pre.
- GFP time‐lapse images of neonatal rat cardiomyocytes expressing EGFP‐CLIP‐170 WT treated with control siRNA (siCL, left) or siRNA targeting both AMPKα1 and α2 (siAMPKα1α2, right). White dotted lines in the images showed the connected cardiomyocyte not expressing EGFP‐CLIP‐170 WT.
- Beeswarm plots of comet length of EGFP‐CLIP‐170. The comet length from multiple cells from different fields was analyzed. Number of comets analyzed, siCL: n = 178, siAMPKα1α2: n = 184. Data means ± SD. Two‐tailed Student's t‐test was used to analyze differences between two groups. **P < 0.01 vs siCL.
Data information: Scale bar, 10 μm (A, C).
Figure EV2. Knockdown of AMPKα1α2 .

- (A, B) Knockdown by siRNA was confirmed by real‐time PCR (A) and Western blotting (B). The data were confirmed by three independent experiments. Student's t‐tests, **P < 0.01 vs siControl.
These results suggest that MT turnover at the cell–cell junctions is regulated by AMPK led phosphorylation of CLIP‐170 Ser 311 in cardiomyocytes.
AMPK controls cell size and shape by regulating MT dynamics through CLIP‐170 phosphorylation in cardiomyocytes
We noticed that a fraction of cardiomyocytes treated with MYK‐461 became elongated in the same direction as that of MT migration during the time‐lapse image analysis (Fig 4A). These results directed us to measure the individual cell size of cardiomyocytes treated with MYK‐461. Analysis of the imaging data using IN Cell Analyzer revealed a significant increase in the cell area of cardiomyocytes after 2 h of MYK‐461 treatment (Fig 4B and C). To further elucidate the specific role of CLIP‐170 Ser 311 phosphorylation by AMPK, we compared the phenotypes of cardiomyocytes transiently transfected with CLIP‐170 WT and two CLIP‐170 Ser 311 mutants, namely, CLIP‐170 S311A and CLIP‐170 S311D (a phosphomimetic mutant) (Nakano et al, 2010). The expression of CLIP‐170 S311A led to the cell area expansion of the cardiomyocytes at baseline, while CLIP‐170 S311D mutant had no effect (Fig 4C). Addition of MYK‐461 had no further effect on the cell size in CLIP‐170 S311A expressing cardiomyocytes (Fig 4C). Conversely, CLIP‐170 S311D expressing cardiomyocytes were refractory to the action of MYK‐461 (Fig 4C). These data suggest that MT dynamics regulated by CLIP‐170 phosphorylation are critical for the maintenance of cell size and shape of the beating cardiomyocytes.
Figure 4. AMPK‐CLIP‐170 signal at the intercalated disk controlled the cell shape in cardiomyocytes.
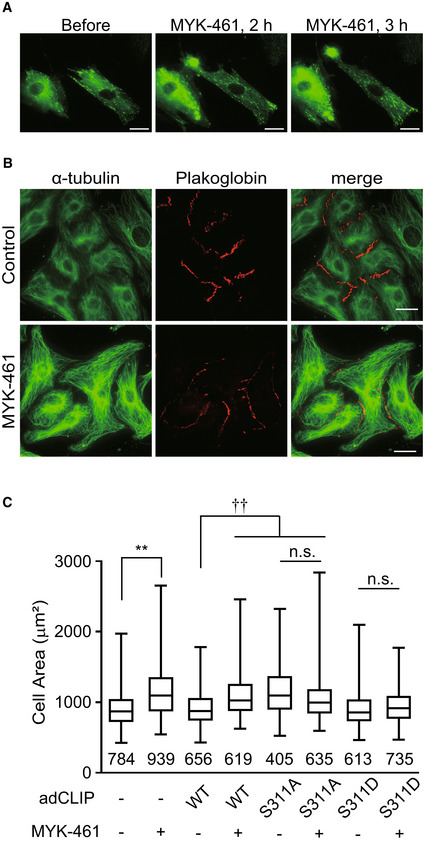
- GFP time‐lapse images of neonatal rat cardiomyocytes expressing EGFP‐CLIP‐170 WT 0, 2 and 3 h after treatment with 2 μM MYK‐461.
- Immunostained images of neonatal rat cardiomyocytes 4 h after treatment with 0.01% DMSO (Control, upper row) or 2 μM MYK‐461(MYK‐461, bottom row). These cells were stained with an α‐tubulin (green) and a plakoglobin (red) antibody.
- Box and whisker plots of the cell size of a cardiomyocyte 2 h after treatment with or without 2 μM MYK‐461, showing the 25th percentile (bottom line of each box), median (middle line of each box), 75th percentile (top line of each box), and maximum and minimum (each whisker). Adenovirus expressing EGFP‐CLIP‐170 (adCLIP) mutant was used (WT, S311A, S311D). Numbers in the graph indicate n number of the cells from 2 independent experiments. Control (−/−): n = 784, MYK‐461: n = 939, CLIP WT: n = 656, CLIP WT + MYK‐461: n = 619, CLIP S311A: n = 405, CLIP S311A + MYK‐461: n = 635, CLIP S311D: n = 613, CLIP S311D + MYK‐461: n = 735. Data means ± SD. Differences among multiple groups were compared by one‐way ANOVA, followed by a post hoc comparison using the Tukey method. **P < 0.01 vs Control, †† P < 0.01 vs CLIP WT, n.s., not significant.
Data information: Scale bar, 10 μm (A, B).
Inducible heart‐specific CLIP‐170 S311A overexpressing transgenic mice exhibit cardiac dysfunction
To investigate the physiological relevance of AMPK‐CLIP‐170 in vivo, we generated tamoxifen‐inducible cardiomyocyte‐specific CLIP‐170 S311A overexpressing transgenic (TG) mice. In adult CLIP‐170 S311Aflox /+ ; α‐MHC‐MerCreMer +/− mice, we successfully confirmed the expression of CLIP‐170 S311A protein in the cardiac muscle, 2 weeks after the initiation of tamoxifen administration. We established two lines of CLIP‐170 S311A TG mice (Line 3 and 9, Fig EV3). Hereafter, majority of the data is from line 3 as line 9 exhibited similar phenotype. To check the influence of overexpression of CLIP‐170 S311A in cardiac function, we performed serial echocardiography measurements. Eight weeks after tamoxifen induction, CLIP‐170 S311A TG mice showed a mild, but significant, decline in the ejection fraction (an indicator of cardiac function) compared with Cre control mice (CLIP‐170 S311A +/+ ; α‐MHC‐MerCreMer +/−) and the floxed control mice (CLIP‐170 S311Aflox /+ ; α‐MHC‐MerCreMer −/−). Over 1 year after tamoxifen administration, CLIP‐170 S311A TG mice exhibited enhanced cardiac dysfunction and chamber dilatation, but no wall thickening was observed (Figs 5A and EV4A and C). CLIP‐170 S311A TG line 9 also showed cardiac dysfunction 52 weeks after TG induction (Figs 5B and EV4B). Therefore, we exclude the possibility that the cardiac phenotype found in CLIP‐170 S311A TG mice attributed to the position effect of transgene insertion. To analyze both the ventricles of CLIP‐170 S311A TG mice, we performed cardiac magnetic resonance imaging (MRI). Both left and right ventricles were dilated with significantly reduced contraction in CLIP‐170 S311A TG mice (Figs 5C and D, and EV4D). To verify that the cardiac dysfunction in CLIP‐170 S311A TG mice resulted from the inhibition of phosphorylation, we generated CLIP‐170 S311D (a phosphomimetic mutant) mutant TG mice. In contrast to the CLIP‐170 S311A TG mice, there was no difference in the parameters assessed by echocardiography in CLIP‐170 S311D TG mice compared with the control (Figs 5E and EV4E).
Figure EV3. Generation of cardiomyocytes‐specific CLIP‐170 S311A‐overexpressing TG mice and S311D TG mice.
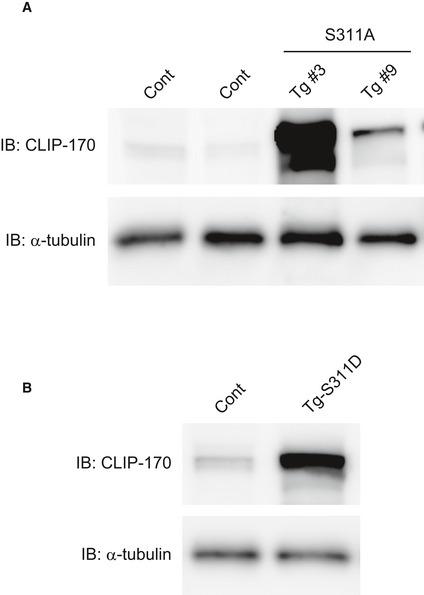
- Immunoblot analysis of the CLIP‐170 in control (Cont) and two lines of S311A TG heart (Tg #3 and #9).
- Immunoblot analysis of the CLIP‐170 in control (Cont) and S311D TG heart. α‐Tubulin was used as a loading control. Tissues were collected 1 week after tamoxifen induction.
Figure 5. Inducible heart‐specific CLIP‐170 S311A overexpressing transgenic mouse shows cardiac dysfunction.
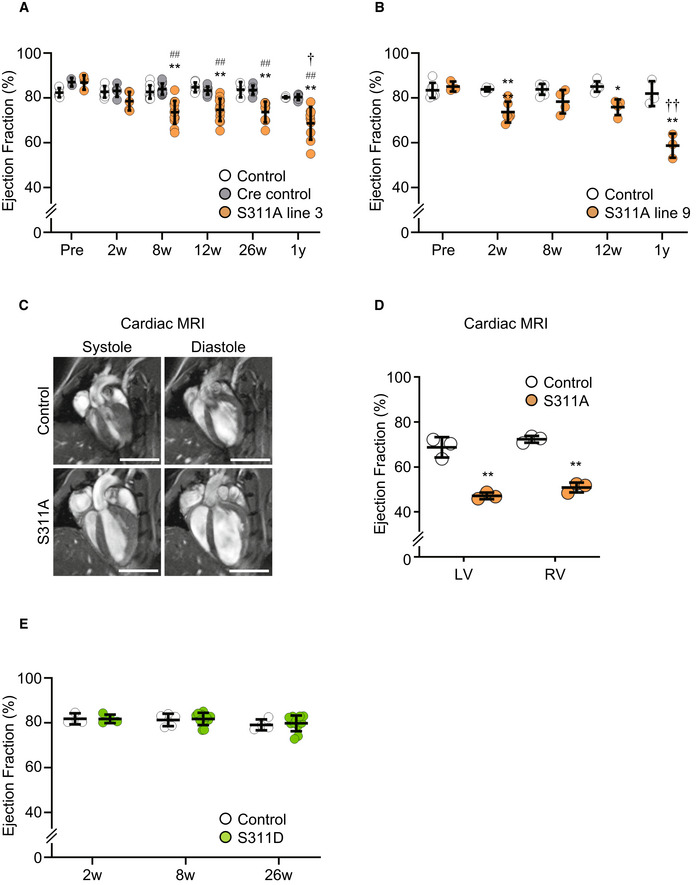
- Beeswarm plots of the echocardiographic parameter (ejection fraction) of individual Cre control (CLIP‐170 S311A +/+ ; α‐MHC‐MerCreMer +/−), Control mice (CLIP‐170 S311Aflox /+ ; α‐MHC‐MerCreMer −/−), and CLIP‐170 S311A overexpressing mice (CLIP‐170 S311 Aflox /+ ; α‐MHC‐MerCreMer +/−), before (Pre), 2 weeks (Tx2w), 8 weeks (Tx8w), 26 weeks (Tx26w), and over 1 year (Tx1y) after tamoxifen induction. Number of mice (Cre control, Control, S311A), Pre (6, 2, 3), Tx2w (9, 5, 5), Tx8w (9, 10, 14), Tx12w (7, 10, 14), Tx26w (3, 7, 8), Tx52w (3, 7, 9).
- Beeswarm plots of another line of CLIP‐170 S311A overexpressing mice (line 9). Number of mice (Control, S311A), Pre (7, 3), Tx2w (4, 7), Tx8w (6, 4), Tx12w (5, 4), Tx52w (3, 3). Data means ± SD. Statistical significance was determined by two‐way ANOVA followed by post hoc Tukey's multiple comparison test. ## P < 0.01 vs duration‐matched Cre Control, *P < 0.05, **P < 0.01 vs duration‐matched Control; † P < 0.05, †† P < 0.01, S311A TG mice 12 vs 52 weeks.
- Representative long‐axis four‐chamber cardiac magnetic resonance images of CLIP‐170 S311A TG mice and control mice over 1 year after tamoxifen induction. Left column showed systole images, and right column represented diastole images. Three mice from each group were analyzed for cardiac MRI. The representative images were shown.
- Beeswarm plots showed the ejection fraction from cardiac MRI. LV, left ventricular, RV, right ventricular. Number of mice, (Control, S311A), 1y (3, 3). Data means ± SD. Two‐tailed Student's t‐test was used to analyze differences between two groups. **P < 0.01 vs Control.
- Beeswarm plots of the echocardiographic parameter (ejection fraction) from CLIP‐170 S311D overexpressing mice and the control. Number of mice (Control, S311D), Tx2w (3, 4), Tx8w (5, 11), Tx26w (4, 11). Data means ± SD. There was no significant difference.
Data information: Scale bar, 5 mm (C).
Figure EV4. Cardiac functional assessment of cardiomyocyte‐specific CLIP‐170 S311A TG mice and S311D TG mice.
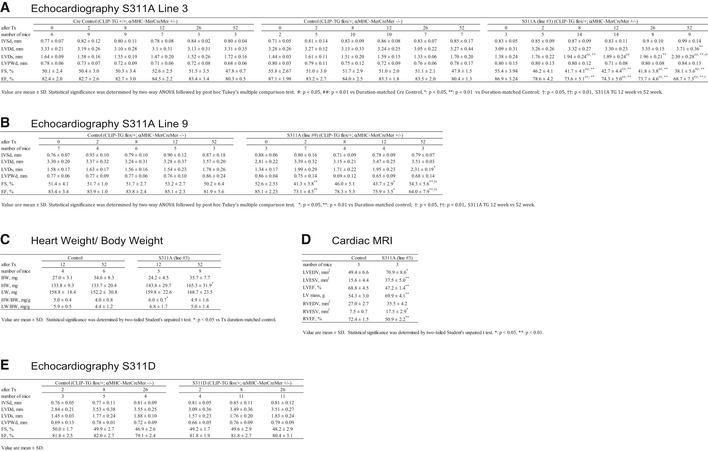
- Echocardiographic measurements of S311A TG mice line 3, control and Cre control.
- Echocardiographic measurements of S311A TG mice line 9 and control.
- Heart, lung, and body weight of S311A TG mice and its control.
- Cardiac MRI measurements of S311A line 3 over 1 year after the tamoxifen induction.
- Echocardiographic measurements of S311D TG mice and control.
Data information: Number of mice are shown in the table. Two‐tailed Student's t‐test was used to analyze differences between two groups. Differences among multiple groups were compared by two‐way ANOVA, followed by a post hoc comparison using the Tukey method.
The histological assessment of CLIP‐170 S311A TG mice after 3 months of tamoxifen treatment showed no tissue degeneration. However, the cardiac function was impaired (Figs 6B and EV4A and B). More than 1 year of tamoxifen treatment showed exacerbated cardiac dysfunction with significant tissue fibrosis in the CLIP‐170 S311A TG mice compared with the control (Fig 6A and B, and EV4A and B). Immunohistostaining revealed enhanced accumulation of α‐tubulin in CLIP‐170 S311A TG mice (Fig 6C–F). Next, we checked the individual cell size in the heart of CLIP‐170 S311A TG mice using wheat germ agglutinin (WGA) staining, a lectin that stains the cell membrane. The length of individual cells in CLIP‐170 S311 A TG mice was significantly elongated in a long‐axis direction compared with the control (Fig 6G and H).
Figure 6. CLIP‐170 S311A overexpressing transgenic mice showed elongation of the cardiomyocytes with MT accumulation.
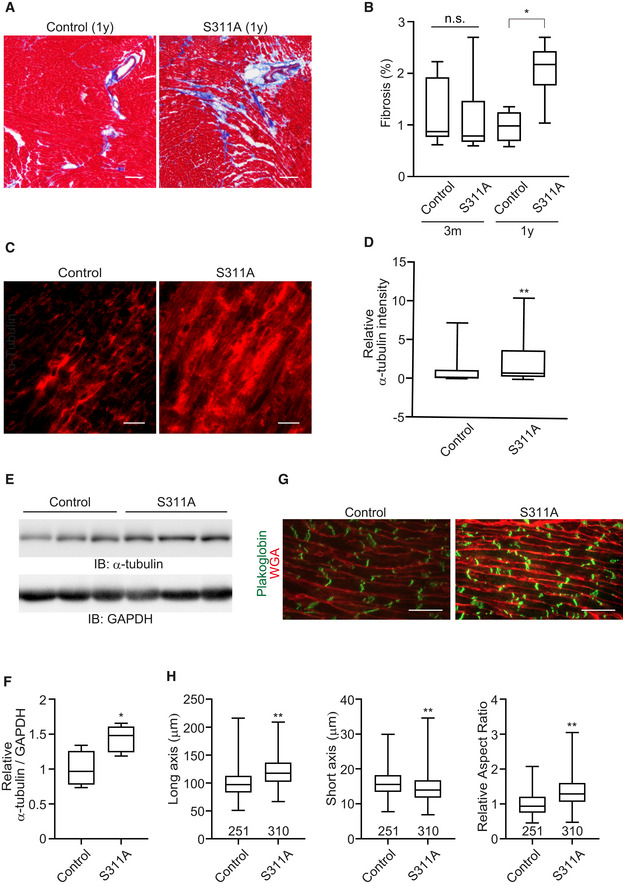
- Masson's trichrome staining of the heart of CLIP‐170 S311A overexpressing mice and the control mice from 3 months and 1 year after tamoxifen treatment.
- Quantitative analysis of cardiac fibrosis. Quantification was made as percentage of fibrosis area (in blue) in the left ventricle. Number of mice, (Control, S311A), 3 months (7, 6), 1 year (5, 6). *P < 0.05 vs Control.
- Representative immunostained images with an α‐tubulin antibody of CLIP‐170 S311A overexpressing mice heart and control mice heart over 1 year after tamoxifen treatment.
- Quantitative analysis of intensity of α‐tubulin in (C). Number of mice (Control: n = 7, S311A: n = 8). Average of 5 sections per animal was analyzed. **P < 0.01 vs Control.
- Representative images of Western blot for an α‐tubulin antibody. GAPDH was used as a loading control.
- Quantitative analysis of intensity of α‐tubulin in (E). Number of mice (Control: n = 4, S311A: n = 5). *P < 0.05 vs Control.
- Representative immunostained images of CLIP‐170 S311A overexpressing mice heart and the control mice heart over 1 year after tamoxifen treatment. These were stained with WGA (red) and a plakoglobin antibody (green).
- Quantitative analysis of (G) cell width, length, and aspect ratio (length/width) were measured. Number of cells analyzed, control, n = 251, S311A, n = 310, **P < 0.01 vs Control.
Data information: Box and whisker plots show the 25th percentile (bottom line of each box), median (middle line of each box), 75th percentile (top line of each box), maximum and minimum (each whisker). Two‐tailed Student's t‐test was used to analyze differences between two groups. Differences among multiple groups were compared by one‐way ANOVA, followed by a post hoc comparison using the Tukey method. Scale bar, 100 μm (A), 20 μm (C and G).
These data indicate that the physiological CLIP‐170 phosphorylation by AMPK at the cell–cell junctions is important for homeostatic MT dynamics, thereby maintaining the cell shape and cardiac function of cardiomyocytes.
Discussion
In this study, time‐lapse image analysis demonstrated that cardiac MTs are dynamic and undergo constant turnover at the intercellular junctions. Most of the AMPK in beating cardiomyocytes is localized at the cell–cell junctions, where it phosphorylates CLIP‐170, thereby regulating the MT turnover. It is noteworthy that the myosin ATPase inhibitor, MYK‐461, prevents the localization of AMPK at the cell–cell junctions, and the effect is reversed on removal of MYK‐461. The inhibition of CLIP‐170 phosphorylation on MYK‐461 treatment results in an increase in the cell area of cardiomyocytes. Moreover, the heart‐specific CLIP‐170 S311A overexpressing TG mice exhibited elongation of the cardiomyocytes with accumulated MTs, which ultimately resulted in a progressive decline in the cardiac contractile function.
Cardiac MTs have drawn attention in cardiovascular research as a modulator of intracellular stiffness. Accumulation of MTs has been associated with human heart failure and rodent models of hypertrophy, myocardial ischemia‐reperfusion, catecholamine‐induced myocardial injury, and heart failure (Tsutsui et al, 1993; Koide et al, 2000; Robison et al, 2016; Chen et al, 2018; Caporizzo et al, 2019). Recently, data from Prosser lab revealed that tubulins with increased post‐translational modification (PTM) conferred mechanical resistance to contraction and regulate the viscoelastic properties of myocyte (Robison et al, 2016). The enhanced levels of α‐tubulins and detyrosinated MTs in human or rodent heart failure models suggest that PTM of cardiac MTs is related to the pathology of heart diseases (Robison et al, 2016; Caporizzo et al, 2019). Suppression of detyrosinated MTs has been previously proposed as a novel treatment for heart failure (Chen et al, 2018). However, the mechanisms underlying the accumulation of α‐tubulins or PTM in heart diseases are yet to be deciphered.
Cardiac MTs have been recognized as a static constituent of the cellular cytoskeleton, especially in highly differentiated cells, such as cardiomyocytes. Our findings suggest that MTs in cardiomyocytes are rather dynamic and their turnover is regulated by CLIP‐170 phosphorylation, which is further mediated by the specially localized AMPK in the intercalated disks. CLIP‐170 is a +TIP, responsible for maintaining the equilibrium of MT dynamics toward extension rather than catastrophe. Once CLIP‐170 is phosphorylated by the upstream kinases, such as AMPKs, its affinity toward the MT decreases (Kakeno et al, 2014). Therefore, it is reasonable to expect that the affinity of CLIP‐170 to MTs would decrease upon phosphorylation at the intercalated disks, where MT polymerization is supposed to terminate. We have previously demonstrated that the inhibition of CLIP‐170 phosphorylation by AMPK increases the level of detyrosinated MTs, resulting in accumulation of MTs (Nakano et al, 2010). In this study, CLIP‐170 S311A TG mice showed decreased cardiac function with accumulation of MTs (Fig 6C–F), a situation often found in heart failure models, and importantly, in cases involving humans (Robison et al, 2016; Chen et al, 2018; Caporizzo et al, 2019). Perturbation of CLIP‐170 phosphorylation or inhibition of AMPK in the intercalated disks of cardiomyocytes, mediated by the increase in the levels of detyrosinated MTs, could be involved in the pathogenesis of heart diseases (Caporizzo et al, 2019). It has been shown that AMPK remains activated in rodent and human heart failure samples (Tian et al, 2001; Kim et al, 2012). However, another study reported decreased activity of AMPK in a rat spontaneous hypertensive model (Dolinsky et al, 2009). Considering the fact that we revealed the specific subcellular localization of AMPK within intercalated disks of the adult murine heart, it will be interesting for future studies to assess AMPK activity in each subcellular compartment, using heart failure models.
Inhibition of cardiac contraction by MYK‐461 or inhibition of phosphorylation, in the CLIP‐170 S311A mutant, surprisingly led to increase in the cell size. Cardiomyocytes in the CLIP‐170 S311A TG mice became elongated and showed an increase in the aspect ratio of individual cells. A previous report demonstrated that cardiomyocytes adapt to the elasticity of the extracellular matrix and modulate their cell shape and length in order to maximize their systolic performance, and MT is a key component for this type of change (McCain et al, 2014). In other words, cardiomyocytes have an intrinsic mechanism to adjust their cell shape or aspect ratio through change in MT polymerization. Therefore, it is likely that perturbation in MT dynamics leads to failure in maintaining the optimal aspect ratio of the cardiomyocytes. This may result in decreased contraction, as observed in CLIP‐170 S311A TG mice. Elongation of cardiomyocytes is often observed in heart failure models or human end‐stage heart failure models (Gerdes & Capasso, 1995; Gerdes, 2002; McCain et al, 2014; Nomura et al, 2018). It is considered as a part of the vicious cycles in the pathogenesis of heart failure. Thus, maladaptation of cardiomyocyte cell shape through altered MT dynamics necessitates further consideration in future cardiovascular research. Several reports suggest MTs to be endogenous factors that modulate intracellular stiffness, and thus, to play an important role in regulating the contractile force of the cardiomyocytes (Robison et al, 2016; Caporizzo et al, 2019). Therefore, the accumulation of MTs itself may explain the reduced contractility observed in CLIP‐170 S311 A TG mice.
The pathological relevance of desmosomal proteins including plakophilin 2 (PKP2), desmoplakin (DSP), and desmoglein 2 (DSG2) has been well established. Mutations in these intercalated disk proteins are frequent among patients not only with arrhythmogenic right ventricular cardiomyopathy, but also with dilated cardiomyopathy with left ventricular dysfunction (Rosenbaum et al, 2020). In these patients, the structure of intercalated disk including desmosomes is irregular or not well formed (Posch et al, 2008). The ill‐structured intercalated disk could alter the regulation of AMPK‐CLIP‐170, suggesting a possibility that alteration of CLIP‐170 phosphorylation may modulate the disease course.
Increased levels of pAMPK and pCLIP‐170 in the heart, 8 weeks after birth, did not match with the levels of pACC that were almost unchanged in the heart (Fig 1A). ACC is a crucial substrate in the regulation of metabolism. It is of note that specific localization of AMPK at the intercalated disks in the heart was regulated by mechanical stress (Fig 2A, B and E). Although the localization of AMPK in other tissues is yet to be examined completely, it has been reported that AMPK activity is involved in cell–cell junctions in lung epithelium and alveolar development, in response to repeated respiration‐induced physical stretching (Kennedy et al, 2016). In fact, AMPK and its upstream LKB1 ortholog have been reported to exist in animals lower than mammalian order; however, no report claims the involvement of these enzymes in energy metabolism (Nakano & Takashima, 2012). In budding yeast, the sucrose non‐fermenting 1 (Snf1) protein kinase corresponding to the AMPK ortholog is activated upon glucose starvation but is not allosterically activated by AMP (Wilson et al, 1996). The AMP/ADP‐sensing property of AMPK is considered to have been acquired, at least in mammals (Hardie, 2007), suggesting that the ancestral regulation and/or function of AMPK might be different. Certainly, it has been reported that fructose‐1,6‐diphosphate and aldolase mediate glucose sensing, via the AMPKs localized in lysosomes, occurs without being activated by AMP/ADP (Zhang et al, 2017). The mechanosensing property of AMPK is possibly an evolutionary descendant of the ancestral AMPK, and it may be present in other tissues in mammals and other organisms.
In this study, we demonstrated that AMPK localization is dynamically regulated by the beating cardiomyocytes, thus suggesting the involvement of mechanical stress. LKB1 is one of the upstream kinases of AMPK, which is constitutively active. Interestingly, we found that LKB1 was co‐localized at the cell–cell junctions, along with AMPK; however, MYK‐461 treatment did not influence its localization (Fig 2D). Therefore, it seems that subcellular localization of AMPK is crucial for its mechanical signal sensing. AMPK is a multifunctional kinase with multiple substrates and cellular outcomes (Miyamoto et al, 2015). Thus, it is conceivable that specific subcellular localization enables AMPK to play distinct roles in different cell types. Mechanical stretch has been reported to activate AMPK in skeletal muscle cells (Nakai et al, 2015) or in the lung epithelial cells (Budinger et al, 2008). Additionally, in response to force, LKB1 has been shown to be recruited to the cadherin adhesion complex, thereby activating AMPK in epithelial cells (Sebbagh et al, 2009; Bays et al, 2017). From these reports and our findings, it is possible that AMPK is involved in mechanotransduction; however, LKB1‐AMPK regulation in response to mechanical stress could depend on the type of cells or stimulation. We were unable to reveal the molecular mechanism involved in the translocation of AMPK in response to mechanical signaling in cardiomyocytes; thus, further investigation is required in future studies.
Given the significant rise in the number of patients with chronic heart failure, there is an urgent need to develop effective treatment strategies with novel mechanisms of action. Previous studies have provided strong evidences that cardiac MTs play a crucial role in the pathogenesis of heart failure (Caporizzo et al, 2019). Thus, it is extremely important to understand the molecular mechanism that regulates MT dynamics in the physiological and pathological heart conditions, so that the molecular targets can be identified to establish effective treatment strategies.
Materials and Methods
Plasmids and viral constructs
To create adenoviral vectors expressing full‐length mouse CLIP‐170 WT/S311A/S311D fused with enhanced green fluorescent protein (EGFP) (Fukata et al, 2002; Nakano et al, 2010), the corresponding cDNAs were subcloned into pENTR for further Gateway recombination in adenoviral expression plasmids, pAdCMV/V5/DEST (Invitrogen). Recombinant adenoviral vectors were produced and purified using HEK293A cells according to manufacturer's protocol (ViraPower Adenoviral Expression System; Invitrogen, AdenoPACK 20, Vivapure; Sartorius AG).
Generation of rabbit polyclonal antibodies specific for the phosphorylated S311 of CLIP‐170.
A phospho‐specific polyclonal antibody to CLIP‐170 (Ser 311) was generated by Scrum Inc. as follows. Ser‐phosphorylated or non‐phosphorylated peptides surrounding S311 (amino acids 305–316, SLKRSP(pS)ASSLS) were synthesized. Rabbits were immunized 5 times with the keyhole limpet hemocyanin–phosphopeptide conjugates mixed with Freund's complete adjuvant, and bled 7 days after the last immunization. Phosphopeptide‐reactive antibody was captured and eluted by a column containing phosphopeptide‐conjugated sepharose. Then, non‐specific fraction was removed using a column containing non‐phosphorylated peptides. Specific reactivity with the targeted phosphoserine sequence was confirmed by an ELISA in which phosphorylated or non‐phosphorylated peptides were coated.
Cell culture, plasmid transfection, and siRNA
Primary cultures of neonatal cardiomyocytes were prepared from 1‐ to 3‐day‐old Wistar rats as described previously (Seguchi et al, 2007; Shintani et al, 2013). Briefly, harvested hearts were incubated in 0.25% trypsin/EDTA (Sigma) at 4°C overnight and then digested with collagenase type II (Worthington). The cardiomyocyte fraction was collected after differential plating for 70 min at 37°C, counted, and seeded onto plates or collagen‐coated glass‐bottom dishes. Cardiomyocytes were cultured in DMEM (Sigma‐Aldrich) supplemented with 10% FBS (Sigma‐Aldrich), penicillin and streptomycin (Gibco) at 37°C in a 5% CO2 atmosphere at constant humidity.
For MYK‐461 experiment, cardiomyocytes were plated on the glass‐bottom dish (12 mm, IWAKI). On the next day after plating, the cells were washed twice with medium. On day 3 after plating, spontaneous beating of cardiomyocytes was about 60 beats per minute. A MYK‐461, myosin ATPase inhibitor, was added at 2 μM, and the heartbeat was immediately stopped until removal of MYK‐461. After 2 h of MYK‐461 treatment, the medium was replaced with the fresh one without MYK‐461, and the heartbeat restores quickly after the replacement.
For the time‐lapse imaging, cardiomyocytes seeded on collagen‐coated 35‐mm glass dishes were transfected with adenovirus expressing EGFP‐CLIP‐170 WT/S311A/S311D at 48 h after isolation and observed at 24 h after transfection.
To knockdown AMPKα1 and α2, cardiomyocytes were transfected with siRNAs (Silencer® Select siRNA; AMPKα1 siRNA ID: s134808 (30 nM), AMPKα2 siRNA ID: s134962 (10 nM), Thermo Fisher Scientific) using Lipofectamine RNAi MAX (Invitrogen) at 3 h after isolation.
As a negative control, cells were transfected with siControl Non‐Targeting siRNA#1 (B‐bridge).
Isolation of mRNA and protein experiments were performed at 72 h after transfection. For immunostaining, the same procedures of siRNA transfection were performed in one‐fifth scale on Lab‐Tek Chamber Slides (nunc).
Immunoblotting
Protein concentration was determined using the BCA protein assay kit (Thermo Fisher Scientific). Equal amounts were fractionated by SDS–PAGE, transferred to a PVDF membrane by electroblotting, and processed for Immunoblotting, as described elsewhere (Nakano et al, 2010). Blots were probed with the appropriate specific antibodies (Anti‐AMPKα, 1:1,000; Anti‐pAMPK, 1:1,000; Anti‐pACC, 1:1,000; Anti‐CLIP‐170, 1:1,000; Anti‐pCLIP‐170, 1:1,000; Anti‐α‐tubulin, 1:5,000 dilution), followed by secondary antibodies, and developed by ECL chemiluminescence (GE Healthcare).
Immunostaining and immunohistology
Cardiomyocytes were seeded on a collagen‐coated 35‐mm glass dish (Iwaki). After cells firmly attached to the dish, they were washed once with warm PBS and fixed with methanol for 15 min at 20°C. Next, the cells were permeabilized with 0.1% Triton X‐100 in PBS for 5 min at room temperature and then blocked with 1% BSA and 5% goat serum for 15 min at room temperature. Samples were immunostained with primary antibodies (1:200 in 1% BSA and 5% goat serum, overnight). The next day, for secondary reactions, species‐matched Alexa Fluor 488‐ or Alexa Fluor 568‐ or Alexa Fluor 647‐labeled secondary antibody was used (1:400 in 1% BSA, 30 min). Fluorescence images of EGFP, Alexa Fluor 488, Alexa Fluor 546, Alexa Fluor 568, and Alexa Fluor 647 were recorded using an Olympus FV1000‐D confocal laser scanning microscope (Olympus Corporation) equipped with a cooled charge‐coupled device CoolSNAP‐HQ camera (Roper Scientific, Tucson, AZ, USA) and a PLAPO 60× oil‐immersion objective lens.
The mouse heart was perfused with ice‐cold PBS, then removed, cut, and embedded in O.C.T. compound and frozen in isopentane chilled in liquid nitrogen. The frozen tissue sections (7–10 μm thick) were fixed with MeOH at −20°C for 10 min. After permeabilization with PBS containing 0.1% of Triton X‐100 for 5 min at the room temperature, the non‐specific antibody‐binding sites were pre‐blocked with the blocking buffer (PBS plus 5% of goat serum and 1% of bovine serum albumin). The primary antibodies were applied overnight at 4°C. After rinsing three times for 5 min in PBS, the sections were next incubated with appropriate fluorophore‐conjugated secondary antibodies and 4′,6‐diamidino‐2‐phenylindole (DAPI) in the blocking buffer for 30 min at room temperature. The primary antibodies used in this study are as follows:
| Primary antibodies | Host | Dilution | |
| Phosphorylated AMPKα | Rabbit | 1/100 | Cell signaling |
| Connexin 43 | Rabbit | 1/200 | Abcam |
| Plakoglobin | Guinea pig | 1/400 | PROGEN |
| AMPKβ2 | Rabbit | 1/100 | HPA |
| N‐cadherin | Mouse | 1/200 | Santa Cruz |
| α‐Actinin | Mouse | 1/200 | Abcam |
| AMPKα | Rabbit | 1/500 | Cell Signaling |
| CLIP‐170 | Mouse | 1/500 | HPA |
| α‐Tubulin | Rabbit | 1/1,000 | Cell Signaling |
| Phosphorylated CLIP | Rabbit | 1/500 | Custom made |
| Phosphorylated ACC | Rabbit | 1/1,000 | Cell Signaling |
| LKB1 | Rabbit | 1/200 | Cell signaling |
Time‐lapse imaging and tracking
The time‐lapse imaging was performed as described previously (Nakano et al, 2010). Briefly, fluorescence images were recorded by using the same experimental equipment and software described in the section above. An EGFP image was obtained every second through a U‐MNIBA2 filter (Olympus), which had a 470–495 excitation filter and a 510–550 emission filter. To achieve high temporal resolution, we had to limit the exposure time to 200 ms. CLIP‐170 kinetics were analyzed on 16‐bit depth images after subtraction of the external background. To measure comet length in cardiomyocytes, it was important to acquire images from still cardiomyocytes. For spontaneous beating, one cardiac cycle was about 1sec each. We set the exposure time for 200 ms; thus, we believe that there was enough margin to acquire image from the diastolic phase (cardiomyocytes with minimum movement). In addition, we eliminated images which had motion artifact from measurement. We measured the fluorescence intensity values within the line of one pixel in width along the CLIP‐170–EGFP tracks over time. We determined the beginning of a comet as the point at which fluorescence intensity showed a rapid rise and the end of a comet as the point at which fluorescence intensity reached baseline. MetaMorph was used to convert a series of time‐lapse images to video format and obtain tracking images in this analysis.
The quantitative evaluation of the surface area, cell width, and length of cardiomyocytes
We performed the quantitative evaluation of the surface area of cardiomyocytes by using IN Cell Analyzer (GE healthcare). α‐Actinin‐positive cardiomyocytes with nuclei (Hoechst) were selected, and cell bodies were decided on the basis of intensity. The mean cell surface area of each cardiomyocyte was calculated as a numerical value.
For cell length and width measurements from immunohistology, 10 images were randomly picked from one heart, and 5–10 cells from each image were analyzed. Thus, about 100 cells from one heart were analyzed.
Animals
All animal experiments were approved by the Animal Research Committee of Osaka University and were performed in accordance with institutional guidelines. No randomization, sample size estimation, or blinding was done.
Generation of cardiomyocytes specifically CLIP‐170 S311A‐overexpressing mice
CLIP‐170 S311A was subcloned into CAG‐loxp‐CAT‐loxp vector, and transgenic strain by pronuclear injection in mouse zygotes of C57BL/6J background. Mice bearing the CLIP‐170 S311Aflox /+ allele were crossed with a transgenic line expressing Cre recombinase under the control of the α‐myosin heavy chain promoter (α‐MHC‐MerCreMer: provided by Dr Molkentin) in a tamoxifen‐inducible cardiomyocyte‐specific manner to produce CLIP‐170 S311Aflox /+ ; α‐MHC‐MerCreMer +/− mice (Sohal et al, 2001). CLIP‐170 S311Aflox /+ ; α‐MHC‐MerCreMer −/− littermates were used as age‐matched controls. The CLIP‐170flox /+ ; α‐MHC‐MerCreMer+ /− mice were genotyped by PCR using primers for CAT gene and Cre recombinase. In adult CLIP‐170 S311Aflox /+ ; α‐MHC‐MerCreMer +/− mice treated with tamoxifen for 6 days (daily dose of 20 mg kg−1), Cre recombination was confirmed by checking CLIP‐170 S311A protein levels in cardiac muscle from these mice 14 days after the onset of tamoxifen treatment. We established and analyzed 2 lines of S311A mice (Fig EV3). We presented the data of line 3; their phenotypes were basically similar.
Cardiac MRI
Serial MRI was conducted using a horizontal 7.0 T Bruker scanner (BioSpec 70/30 USR, Bruker Biospin). All MRI experiments were performed under general anesthesia using 1%–2% isoflurane administered via a mask covering the nose and mouth of the animals. Respiratory signals, body temperature, and heart rate were monitored using a physiological monitoring system (SA Instruments, Inc.). Body temperatures were continuously maintained at 36.0 ± 0.5°C by circulating water through heating pads throughout all experiments (Saito et al, 2019). The center of the imaging slice was carefully positioned at the mouse hearts. First, a three‐plane sequence was performed for the definition of slice orientation using self‐gated cine imaging with navigator echo. Next, six consecutive scans of the short axis from the apex to the base of hearts were obtained in the long‐axis four‐chamber and long‐axis two‐chamber views. These eight scans were used for fast low‐angle shots with navigator echo (IntraGate, Bruker) using the following parameters: repetition time/echo time = 6.0/2.2 ms, flip angle = 10 degrees, field of view = 2.56 × 2.56 cm, matrix = 256 × 256, slice thickness = 1.0 mm, number of repetitions = 300, four concomitant slices covering the whole heart from the apex to base, 10 phases per cardiac cycle, expected heart rate = 400 beats per minute (bpm), expected respiratory rate = 60 bpm, in‐plane resolution per pixel = 100 μm, acquisition time = 3 min 50 s per scan, total acquisition time = approximately 35 min, and a total anesthesia time = approximately 40 min.
MRI data analysis
In short‐axis images, end‐diastolic and end‐systolic frames were selected according to maximal and minimal ventricular diameter. The epicardial border was manually outlined, and the LV cavity was segmented in both frames using software ImageJ. The respective volumes were calculated as the area of each compartment multiplied by the slice thickness (1.0 mm). Based on end‐systolic and end‐diastolic volumes (ESV [μl] and EDV [μl], respectively), all parameters characterizing cardiac function, such as stroke volume (SV [μl] = EDV – ESV) and ejection fraction (EF [%] = SV/EDV), were calculated.
FRET‐based measurement of organelle‐specific AMPK activity
ABKAR constructs were obtained from Addgene (#61056 and 61510) and subcloned to pENTR vectors followed by adenovirus construction as described in the Method section. Mouse AMPKβ2‐mCherry was also subcloned to pENTR vector as well. Cardiomyocytes were infected with adenovirus encoding FRET‐based organelle‐specific ABKAR. PM‐ or Cyto‐ABKAR measure changes in PM‐ or cytosolic AMPK activity, respectively. Wide‐field observations of the cells were performed on an Olympus IX‐81 inverted fluorescence microscope (Olympus) using a PLAPO 60×, 1.35 NA, oil‐immersion objective lens (Olympus). Fluorescence emission from ABKAR was imaged by using a dual‐cooled CCD camera (ORCA‐D2; Hamamatsu Photonics) with a dichroic mirror (510 nm) and two emission filters (483/32 nm for CFP and 542/27 nm for YFP; A11400‐03; Hamamatsu Photonics). Cells were illuminated using the CoolLED pE‐1 excitation system (CoolLED) with a wavelength of 425 nm. Cells were maintained on a microscope at 37°C using a stage‐top incubator (Tokai Hit). A laser‐based Z drift compensator (IX81‐ZDC; Olympus) was used to minimize the focus drift during the time‐lapse imaging. Image analysis was performed using MetaMorph (Molecular Devices). The YFP/CFP emission ratio was calculated by dividing pixel by pixel a YFP image with a CFP image after background subtraction.
Immunostaining of adult cardiomyocytes and lambda phosphatase treatment
Adult cardiomyocytes isolation from rat heart was performed by the Langendorff method as previously reported. Isolated cardiomyocytes were plated on laminin‐coated glass‐bottom dish, fixed with acetone for 10 min at −20°C. After fixation, lambda phosphatase (NEB) treatment was performed according to the manufacturer's recommendation.
Statistical analyses
Data are expressed as means ± SD. Two‐tailed Student's t‐test was used to analyze differences between two groups. Differences among multiple groups were compared by one‐ or two‐way ANOVA, followed by a post hoc comparison using the Tukey method with Prism 8 (GraphPad). For Fig 1, one‐way ANOVA followed by Dunnett post hoc test was used. P < 0.05 was considered statistically significant.
Author contributions
YS conceived the research and organized the project. SYash conducted most of the experiments in this study. YT, TQ, TK, TN, YN, TSM, SS, HKi, YM, IY, and KY contributed data collection. TN and YN contributed data analysis and figure preparation including revision. HU and OY provided the resources and experimental advice. YN, TK, OT, SYam, HKa, KY, and ST discussed the data from expert knowledge; SYash, SYam, TN, YN, and YS wrote the manuscript.
Conflict of interests
The authors declare that they have no conflict of interest.
Supporting information
Expanded View Figures PDF
Movie EV1
Movie EV2
Review Process File
Acknowledgements
We would like to thank Dr. Atsushi Nakano for thoughtful discussion. We also thank Ms Gion, Shingu, Takata, Ogai, and Kobayashi for their technical assistance. This study was supported by grants from the Ministry of Education, Culture, Sports, Science and Technology of Japan (15K08271, 18K08105), Mochida Memorial Foundation for medical and pharmaceutical research, and Suzuken Memorial Foundation.
EMBO Reports (2021) 22: e50949.
Data availability
No data have been deposited to public databases.
References
- Bairwa SC, Parajuli N, Dyck JRB (2016) The role of AMPK in cardiomyocyte health and survival. Biochim Biophys Acta Mol Basis Dis 1862: 2199–2210. [DOI] [PubMed] [Google Scholar]
- Bays JL, Campbell HK, Heidema C, Sebbagh M, Demali KA (2017) Linking E‐cadherin mechanotransduction to cell metabolism through force‐mediated activation of AMPK. Nat Cell Biol 19: 724–731 [DOI] [PMC free article] [PubMed] [Google Scholar]
- Budinger GRS, Urich D, DeBiase PJ, Chiarella SE, Burgess ZO, Baker CM, Soberanes S, Mutlu GM, Jones JCR (2008) Stretch‐induced activation of AMP kinase in the lung requires dystroglycan. Am J Respir Cell Mol Biol 39: 666–672 [DOI] [PMC free article] [PubMed] [Google Scholar]
- Buyandelger B, Mansfield C, Knöll R (2014) Mechano‐signaling in heart failure. Pflügers Arch Eur J Physiol 466: 1093–1099 [DOI] [PMC free article] [PubMed] [Google Scholar]
- Caporizzo MA, Chen CY, Prosser BL (2019) Cardiac microtubules in health and heart disease. Exp Biol Med 244: 1255–1272 [DOI] [PMC free article] [PubMed] [Google Scholar]
- Caporizzo MA, Chen CY, Bedi K, Margulies KB, Prosser BL (2020) Microtubules increase diastolic stiffness in failing human cardiomyocytes and myocardium. Circulation 141: 902–915 [DOI] [PMC free article] [PubMed] [Google Scholar]
- Chen CY, Caporizzo MA, Bedi K, Vite A, Bogush AI, Robison P, Heffler JG, Salomon AK, Kelly NA, Babu A et al (2018) Suppression of detyrosinated microtubules improves cardiomyocyte function in human heart failure. Nat Med 24: 1–15 [DOI] [PMC free article] [PubMed] [Google Scholar]
- Desai A, Mitchison TJ (1997) Microtubule polymerization dynamics. Annu Rev Cell Dev Biol 13: 83–117 [DOI] [PubMed] [Google Scholar]
- Dolinsky VW, Chan AYM, Frayne IR, Light PE, Des RC, Dyck JRB (2009) Resveratrol prevents the prohypertrophic effects of oxidative stress on lkb1. Circulation 119: 1643–1652 [DOI] [PubMed] [Google Scholar]
- Fu X, Wan S, Lyu YL, Liu LF, Qi H (2008) Etoposide induces ATM‐dependent mitochondrial biogenesis through AMPK activation. PLoS One 3: 1–10 [DOI] [PMC free article] [PubMed] [Google Scholar]
- Fukata M, Watanabe T, Noritake J, Nakagawa M, Yamaga M, Kuroda S, Matsuura Y, Iwamatsu A, Perez F, Kaibuchi K (2002) Rac1 and Cdc42 capture microtubules through IQGAP1 and CLIP‐170. Cell 109: 873–885 [DOI] [PubMed] [Google Scholar]
- Gerdes AM, Capasso JM (1995) Structural remodeling and mechanical dysfunction of cardiac myocytes in heart failure. J Mol Cell Cardiol 27: 849–856. [DOI] [PubMed] [Google Scholar]
- Gerdes AM (2002) Cardiac myocyte remodeling in hypertrophy and progression to failure. J Card Fail 8: S264–S268 [DOI] [PubMed] [Google Scholar]
- Hardie DG (2007) Role of AMP‐activated protein kinase in the metabolic syndrome and in heart disease. FEBS Lett 582: 81–89 [DOI] [PubMed] [Google Scholar]
- Hardie DG (2011) AMP‐activated protein kinase–an energy sensor that regulates all aspects of cell function. Genes Dev 25: 1895–1908 [DOI] [PMC free article] [PubMed] [Google Scholar]
- Hardie DG, Ross FA, Hawley SA (2012) AMPK: a nutrient and energy sensor that maintains energy homeostasis. Nat Publ Gr 13: 251–262 [DOI] [PMC free article] [PubMed] [Google Scholar]
- Hardie DG, Lin S (2019) AMP‐activated protein kinase – not just an energy sensor [version 1; peer review: 3 approved ]. David Grahame Hardie 6: 1–12 [DOI] [PMC free article] [PubMed] [Google Scholar]
- Jensen TE, Rose AJ, Hellsten Y, Wojtaszewski JFP, Richter EA (2007a) Caffeine‐induced Ca2+ release increases AMPK‐dependent glucose uptake in rodent soleus muscle. Am J Physiol Endocrinol Metab 293: 286–292 [DOI] [PubMed] [Google Scholar]
- Jensen TE, Rose AJ, Jørgensen SB, Brandt N, Schjerling P, Wojtaszewski JFP, Richter EA (2007b) Possible CaMKK‐dependent regulation of AMPK phosphorylation and glucose uptake at the onset of mild tetanic skeletal muscle contraction. Am J Physiol Endocrinol Metab 292: 1308–1317 [DOI] [PubMed] [Google Scholar]
- Ji C, Yang B, Yang YL, He SH, Miao DS, He L, Bi ZG (2010) Exogenous cell‐permeable C6 ceramide sensitizes multiple cancer cell lines to Doxorubicin‐induced apoptosis by promoting AMPK activation and mTORC1 inhibition. Oncogene 29: 6557–6568 [DOI] [PubMed] [Google Scholar]
- Joijcjut F, Hmvdpofphfoftjt I, Njdf JO, Pg J, Wjb Q, Jo BE, Foretz M, Hébrard S, Leclerc J, Zarrinpashneh E et al (2010) JCI metfolmin. Changes 120: 2355–2369 [DOI] [PMC free article] [PubMed] [Google Scholar]
- Kakeno M, Matsuzawa K, Matsui T, Akita H, Sugiyama I, Ishidate F, Nakano A, Takashima S, Goto H, Inagaki M et al (2014) Plk1 phosphorylates CLIP‐170 and regulates its binding to microtubules for chromosome alignment. Cell Struct Funct 39: 45–59 [DOI] [PubMed] [Google Scholar]
- Katanosaka Y, Iwasaki K, Ujihara Y, Takatsu S, Nishitsuji K, Kanagawa M, Sudo A, Toda T, Katanosaka K, Mohri S et al (2014) TRPV2 is critical for the maintenance of cardiac structure and function in mice. Nat Commun 5: 1–14 [DOI] [PMC free article] [PubMed] [Google Scholar]
- Kennedy JC, Khabibullin D, Henske EP (2016) Mechanisms of pulmonary cyst pathogenesis in Birt–Hogg–Dube syndrome: the stretch hypothesis. Semin Cell Dev Biol 52: 47–52 [DOI] [PubMed] [Google Scholar]
- Kim M, Shen M, Ngoy S, Karamanlidis G, Liao R, Tian R (2012) AMPK isoform expression in the normal and failing hearts. J Mol Cell Cardiol 52: 1066–1073 [DOI] [PMC free article] [PubMed] [Google Scholar]
- Koide M, Hamawaki M, Narishige T, Sato H, Nemoto S, DeFreyte G, Zile MR, Cooper G IV, Carabello BA (2000) Microtubule depolymerization normalizes in vivo myocardial contractile function in dogs with pressure‐overload left ventricular hypertrophy. Circulation 102: 1045–1052 [DOI] [PubMed] [Google Scholar]
- Lakshmi RB, Nair VM, Manna TK (2018) Regulators of spindle microtubules and their mechanisms: Living together matters. IUBMB Life 70: 101–111. [DOI] [PubMed] [Google Scholar]
- McCain ML, Yuan H, Pasqualini FS, Campbell PH, Parker KK (2014) Matrix elasticity regulates the optimal cardiac myocyte shape for contractility. Am J Physiol Hear Circ Physiol 306: H1525–H1539 [DOI] [PMC free article] [PubMed] [Google Scholar]
- Miyamoto T, Rho E, Sample V, Akano H, Magari M, Ueno T, Gorshkov K, Chen M, Tokumitsu H, Zhang J et al (2015) Compartmentalized AMPK signaling illuminated by genetically encoded molecular sensors and actuators. Cell Rep 11: 657–670 [DOI] [PMC free article] [PubMed] [Google Scholar]
- Nakai N, Kawano F, Nakata K (2015) Mechanical stretch activates mammalian target of rapamycin and AMP‐activated protein kinase pathways in skeletal muscle cells. Mol Cell Biochem 406: 1–8 [DOI] [PubMed] [Google Scholar]
- Nakano A, Kato H, Watanabe T, Min KD, Yamazaki S, Asano Y, Seguchi O, Higo S, Shintani Y, Asanuma H et al (2010) AMPK controls the speed of microtubule polymerization and directional cell migration through CLIP‐170 phosphorylation. Nat Cell Biol 12: 583–590 [DOI] [PubMed] [Google Scholar]
- Nakano A, Takashima S (2012) LKB1 and AMP‐activated protein kinase: regulators of cell polarity. Genes Cells 17: 737–747 [DOI] [PMC free article] [PubMed] [Google Scholar]
- Nomura S, Satoh M, Fujita T, Higo T, Sumida T, Ko T, Yamaguchi T, Tobita T, Naito AT, Ito M et al (2018) Cardiomyocyte gene programs encoding morphological and functional signatures in cardiac hypertrophy and failure. Nat Commun 9: 1–17 [DOI] [PMC free article] [PubMed] [Google Scholar]
- Noorman M, van der Heyden MAG, van Veen TAB, Cox MGPJ, Hauer RNW, de Bakker JMT, van Rijen HVM (2009) Cardiac cell–cell junctions in health and disease: Electrical versus mechanical coupling. J Mol Cell Cardiol 47: 23–31 [DOI] [PubMed] [Google Scholar]
- Perriard J‐C, Hirschy A, Ehler E (2003) Dilated cardiomyopathy: a disease of the intercalated disc? Trends Cardiovasc Med 13: 30–38 [DOI] [PubMed] [Google Scholar]
- Posch MG, Posch MJ, Geier C, Erdmann B, Mueller W, Richter A, Ruppert V, Pankuweit S, Maisch B, Perrot A et al (2008) A missense variant in desmoglein‐2 predisposes to dilated cardiomyopathy. Mol Genet Metab 95: 74–80 [DOI] [PubMed] [Google Scholar]
- Robison P, Caporizzo MA, Ahmadzadeh H, Bogush AI, Chen CY, Margulies KB, Shenoy VB, Prosser BL (2016) Detyrosinated microtubules buckle and bear load in contracting cardiomyocytes. Science (80‐ ) 352: aaf0659 [DOI] [PMC free article] [PubMed] [Google Scholar]
- Rosenbaum AN, Agre KE, Pereira NL (2020) Genetics of dilated cardiomyopathy: practical implications for heart failure management. Nat Rev Cardiol 17: 286–297 [DOI] [PubMed] [Google Scholar]
- Saito S, Takahashi Y, Ohki A, Shintani Y, Higuchi T (2019) Early detection of elevated lactate levels in a mitochondrial disease model using chemical exchange saturation transfer (CEST) and magnetic resonance spectroscopy (MRS) at 7T‐MRI. Radiol Phys Technol 12: 46–54 [DOI] [PubMed] [Google Scholar]
- Sanli T, Rashid A, Liu C, Harding S, Bristow RG, Cutz JC, Singh G, Wright J, Tsakiridis T (2010) Ionizing radiation activates AMP‐activated kinase (AMPK): a target for radiosensitization of human cancer cells. Int J Radiat Oncol Biol Phys 78: 221–229 [DOI] [PubMed] [Google Scholar]
- Sebbagh M, Santoni MJ, Hall B, Borg JP, Schwartz MA (2009) Regulation of LKB1/STRAD Localization and Function by E‐Cadherin. Curr Biol 19: 37–42 [DOI] [PMC free article] [PubMed] [Google Scholar]
- Seguchi O, Takashima S, Yamazaki S, Asakura M, Asano Y, Shintani Y, Wakeno M, Minamino T, Kondo H, Furukawa H et al (2007) A cardiac myosin light chain kinase regulates sarcomere assembly in the vertebrate heart. J Clin Invest 117: 2812–2824 [DOI] [PMC free article] [PubMed] [Google Scholar]
- Shintani Y, Kapoor A, Kaneko M, Smolenski RT, D'Acquisto F, Coppen SR, Harada‐Shoji N, Lee HJ, Thiemermann C, Takashima S et al (2013) TLR9 mediates cellular protection by modulating energy metabolism in cardiomyocytes and neurons. Proc Natl Acad Sci USA 110: 5109–5114 [DOI] [PMC free article] [PubMed] [Google Scholar]
- Sohal DS, Nghiem M, Crackower MA, Witt SA, Kimball TR, Tymitz KM, Penninger JM, Molkentin JD (2001) Temporally regulated and tissue‐specific gene manipulations in the adult and embryonic heart using a tamoxifen‐inducible Cre protein. Circ Res 89: 20–25 [DOI] [PubMed] [Google Scholar]
- Steinberg GR, Kemp BE (2009) AMPK in health and disease. Physiol Rev 89: 1025–1078 [DOI] [PubMed] [Google Scholar]
- Tian R, Musi N, D'Agostino J, Hirshman MF, Goodyear LJ (2001) Increased adenosine monophosphate‐activated protein kinase activity in rat hearts with pressure‐overload hypertrophy. Circulation 104: 1664–1669 [DOI] [PubMed] [Google Scholar]
- Tsutsui H, Ishihara K, Cooper G IV (1993) Cytoskeletal role in the contractile dysfunction of hypertrophied myocardium. Science (80‐ ) 260: 682–687 [DOI] [PubMed] [Google Scholar]
- van der Vaart B, Akhmanova A, Straube A (2009) Regulation of microtubule dynamic instability. Biochem Soc Trans 37: 1007–1013 [DOI] [PubMed] [Google Scholar]
- Vermij SH, Abriel H, van Veen TAB (2017) Refining the molecular organization of the cardiac intercalated disc. Cardiovasc Res 113: 259–275 [DOI] [PubMed] [Google Scholar]
- Viollet B, Horman S, Leclerc J, Lantier L, Foretz M, Billaud M, Giri S, Andreelli F (2010) AMPK inhibition in health and disease. Crit Rev Biochem Mol Biol 45: 276–295 [DOI] [PMC free article] [PubMed] [Google Scholar]
- Williams T, Brenman JE (2008) LKB1 and AMPK in cell polarity and division. Trends Cell Biol 18: 193–198 [DOI] [PubMed] [Google Scholar]
- Wilson WA, Hawley SA, Hardie DG (1996) Glucose repression/derepression in budding yeast: SNF1 protein kinase is activated by phosphorylation under derepressing conditions, and this correlates with a high AMP:ATP ratio. Curr Biol 6: 1426–1434 [DOI] [PubMed] [Google Scholar]
- Yeh ETH, Tong AT, Lenihan DJ, Yusuf SW, Swafford J, Champion C, Durand J‐B, Gibbs H, Zafarmand AA, Ewer MS (2004) Cardiovascular complications of cancer therapy. Circulation 109: 3122–3131 [DOI] [PubMed] [Google Scholar]
- Zhang C, Chen B, Guo A, Zhu Y, Miller JD, Gao S, Yuan C, Kutschke W, Zimmerman K, Weiss RM et al (2014) Microtubule‐mediated defects in junctophilin‐2 trafficking contribute to myocyte transverse‐tubule remodeling and Ca2+ handling dysfunction in heart failure. Circulation 129: 1742–1750 [DOI] [PMC free article] [PubMed] [Google Scholar]
- Zhang C‐S, Hawley SA, Zong Y, Li M, Wang Z, Gray A, Ma T, Cui J, Feng J‐W, Zhu M et al (2017) Fructose‐1,6‐bisphosphate and aldolase mediate glucose sensing by AMPK. Nature 548: 112–116 [DOI] [PMC free article] [PubMed] [Google Scholar]
- Zile MR, Green GR, Schuyler GT, Aurigemma GP, Miller DC, Cooper G (2001) Cardiocyte cytoskeleton in patients with left ventricular pressure overload hypertrophy. J Am Coll Cardiol 37: 1080–1084 [DOI] [PubMed] [Google Scholar]
- Zmijewski JW, Banerjee S, Bae H, Friggeri A, Lazarowski ER, Abraham E (2010) Exposure to hydrogen peroxide induces oxidation and activation of AMP‐activated protein kinase. J Biol Chem 285: 33154–33164 [DOI] [PMC free article] [PubMed] [Google Scholar]
Associated Data
This section collects any data citations, data availability statements, or supplementary materials included in this article.
Supplementary Materials
Expanded View Figures PDF
Movie EV1
Movie EV2
Review Process File
Data Availability Statement
No data have been deposited to public databases.