

Abstract
Many cancer cells maintain enhanced aerobic glycolysis due to irreversible defective mitochondrial oxidative phosphorylation (OXPHOS). This phenomenon, known as the Warburg effect, is recently challenged because most cancer cells maintain OXPHOS. However, how cancer cells coordinate glycolysis and OXPHOS remains largely unknown. Here, we demonstrate that OMA1, a stress‐activated mitochondrial protease, promotes colorectal cancer development by driving metabolic reprogramming. OMA1 knockout suppresses colorectal cancer development in AOM/DSS and xenograft mice models of colorectal cancer. OMA1‐OPA1 axis is activated by hypoxia, increasing mitochondrial ROS to stabilize HIF‐1α, thereby promoting glycolysis in colorectal cancer cells. On the other hand, under hypoxia, OMA1 depletion promotes accumulation of NDUFB5, NDUFB6, NDUFA4, and COX4L1, supporting that OMA1 suppresses OXPHOS in colorectal cancer. Therefore, our findings support a role for OMA1 in coordination of glycolysis and OXPHOS to promote colorectal cancer development and highlight OMA1 as a potential target for colorectal cancer therapy.
Keywords: colorectal cancer, glycolysis, hypoxia, OMA1, oxidative phosphorylation
Subject Categories: Cancer, Membrane & Intracellular Transport, Metabolism
Mitochondrial stress sensor OMA1 promotes colorectal cancer development by driving metabolic reprogramming under hypoxia. Therefore, OMA1 may be a potential target for colorectal cancer therapy.
Introduction
Alteration of cellular metabolisms, particularly of energy metabolism, is considered to be a core hallmark of cancer (Ward & Thompson, 2012). Under aerobic conditions, most normal differentiated cells generate energy by mitochondrial oxidative phosphorylation (OXPHOS) and metabolize glucose to carbon dioxide through the mitochondrial tricarboxylic acid (TCA) cycle (Matthew et al, 2009). In contrast, most cancer cells rely on aerobic glycolysis to produce energy and glycolytic intermediates for the synthesis of lipids, amino acids, nucleic acids, and so on, even in the presence of enough oxygen; meanwhile, mitochondrial OXPHOS is suppressed in cancer cells due to mitochondrial dysfunction. This energy metabolic reprogramming is known as “the Warburg effect” (Matthew et al, 2009), which contributes to tumorigenesis and progression in a variety of cancers. However, recent studies have revealed that mitochondrial bioenergetic and biosynthetic states are frequently variable in cancers rather than absolutely dysfunctional (Wallace, 2012), which depends on environmental, genetic, and tissue‐of‐origin differences among tumors (Vyas et al, 2016). In addition, hypoxic tumor microenvironments induced the glycolytic phenotype in many cancer cells. Therefore, mitochondrial OXPHOS and glycolysis collaborate to maintain the balance of energy metabolism in cancer cells. Colorectal cancer is the third most prevalent cancer and the second most lethal malignancy in the world (Arnold et al, 2017; Bray et al, 2018). Dysfunctional mitochondria with reduced electron transport chain activity, decreased mitochondrial ATP level, increased reactive oxygen species (ROS) generation and mtDNA mutation are reported to contribute to the pathogenesis of intestinal inflammation and colorectal tumorigenesis (Polyak et al, 1998; Cunningham et al, 2016; Heller et al, 2017; Xue et al, 2017). However, functional mitochondria are also required for the transformation of colorectal cancer (Vyas et al, 2016; Baker et al, 2019). Therefore, how mitochondria coordinate glycolysis and oxidative phosphorylation is critical for colorectal tumor development, but the mechanism remains largely unknown.
Hypoxia is a typical feature in the development of colorectal cancer (Wang & Semenza, 1993; Biddlestone et al, 2015). Hypoxia can stabilize the transcription factor HIF1α, which activates the expression of lots of genes involved in the inflammatory response, tumor vascularization, metastasis, and radio‐ or chemo‐resistance (Semenza, 2004; Baba et al, 2010; Biddlestone et al, 2015; Ioannou et al, 2015; Balamurugan, 2016). HIF1α also transcriptionally regulates cell metabolism to meet the demands for ATP and macromolecule anabolism during colorectal cancer development (Ioannou et al, 2015). Hypoxia‐induced ROS has been reported to play an important role in stabilizing and activating HIF1α (Niecknig et al, 2012; Movafagh et al, 2015). In mammalian cells, the major site of ROS production is mitochondrial electron transport chain (Liu et al, 2002). Therefore, mitochondria are highly associated with HIF‐1α stability.
OMA1 is an ATP‐independent zinc metalloprotease located at the mitochondrial inner membrane(Käser et al, 2003), and it is a stress‐sensitive mitochondrial protease, which plays a key role in mitochondrial protein quality control and metabolic homeostasis (Ehses et al, 2009; Baker et al, 2014; Bohovych et al, 2016). OMA1 is activated by self‐cleavage upon mitochondrial membrane depolarization and other cellular stress. Meanwhile, activated OMA1 also leads to degradation of itself (Baker et al, 2014; Zhang et al, 2014). Moreover, OMA1 cooperates with i‐AAA protease Yme1L (Yme1 like 1 ATPase) to mediate the processing and degradation of OPA1, a dynamin‐like GTPase that mediates inner mitochondrial membrane fusion, cristae formation, and resistance to apoptosis (Anand et al, 2014; Varanita et al, 2015; Wai et al, 2015; Rainbolt et al, 2016). Notably, OMA1 deficiency in mouse models exhibits defective thermogenesis, diet‐induced obesity (Quirós et al, 2012), yet protects against heart failure (Wai et al, 2015; Acin‐Perez et al, 2018), neurodegeneration (Korwitz et al, 2016), and ischemic kidney injury (Xiao et al, 2014). Interestingly, recent studies revealed another piece of evidence that stress‐activated OMA1 mediates the cleavage of DELE1, which then relays mitochondrial stress to the cytosol (Fessler et al, 2020; Guo et al, 2020). So far, the role of OMA1 in cancer is complicated, depending on the type of cancer, the disease stage, the treatment, and many other factors (Jiang et al, 2014; Alavi, 2019; Amini et al, 2019; Daverey et al, 2019), and the underlying mechanism of OMA1 in regulating tumorigenesis and progression remains largely unknown.
In this study, we report that OMA1 facilitates the development of colorectal cancer by promoting the Warburg effect. We show that OMA1 knockout (KO) protects mice from colorectal cancer induced by the azoxymethane/dextran sodium sulfate (AOM/DSS) model. Our findings also suggest that OMA1‐OPA1 axis promotes glycolysis by increasing ROS generation and enhancing the stability of HIF‐1α in colorectal cancer cells under hypoxia. In addition, we show that OMA1 inhibits mitochondrial oxidative phosphorylation by impairing the assembly of mitochondrial respiratory chain complexes through promoting the degradations of NDUFB5, NDUFB6, NDUFA4, and COX4L1 in colorectal cancer cells in vivo and in vitro. Therefore, our study demonstrates a role of OMA1 in coordination of glycolysis and oxidative phosphorylation to promote the Warburg effect, which facilitates colorectal cancer progression.
Results
OMA1 is upregulated in human colorectal cancer and is activated by hypoxia
It is known that mitochondrial dysfunction contributes to the development and progression of colorectal cancer (Sanchez‐Pino et al, 2007). Mitochondrial protease OMA1, a mitochondrial stresses sensor, regulates mitochondrial functions and homeostasis (Ehses et al, 2009; Baker et al, 2014; Bohovych et al, 2016). Based on that, we decided to explore the relationship between OMA1 and colorectal cancer. We firstly investigated the role of OMA1 in patients with colorectal cancer. We performed bioinformatics analysis on public datasets of human colorectal cancer samples. Results indicated that the mRNA expression of OMA1 was significantly elevated in tumor samples compared with normal samples (using datasets from NCBI’s Gene Expression Omnibus: GSE21510) (Fig 1A). Next, we analyzed the correlation between OMA1 expression and patient survival using public databases (from NCBI’s Gene Expression Omnibus: GSE17537). Consistently, high level of OMA1 mRNA expression was significantly correlated with shorter survival time (P = 0.0180) (Fig 1B). Since OPA1 can be degraded or cleaved at the S1 site by OMA1, we performed Western blotting to analyze the processing of OPA1 in colorectal cancer specimens. Compared with the adjacent normal tissues, the colorectal tumors displayed remarkably increased OPA1 degradation or processing (bands “c” and “e” are products of OPA1 cleavage by OMA1) (Fig 1C), suggesting that OMA1 is activated in colorectal tumors (Fig 1C) and probably influenced by the tumor microenvironments. And since one of the most pervasive element of solid tumor microenvironments is hypoxia (Harris, 2002), we later tested whether OMA1 is activated by hypoxia. Control and OMA1 KO HCT116 cells were treated with or without hypoxia (1% O2) for the indicated time. Consistent with previous works that OPA1 processing is enhanced in hypoxia (An et al, 2013; MacVicar et al, 2019), our Western blotting data showed that OPA1 was processed and degraded in control cells; however, this was inhibited in OMA1 KO cells (Fig 1D), suggesting that OMA1 is activated by hypoxia to regulate OPA1 processing and degradation. Along with that, OPA1 KO MEFs stably expressing OPA1 isoform 1, which can only be processed by OMA1, displayed increased cleavage of OPA1 isform1 after hypoxia (Fig 1E), further confirming that OMA1 is activated by hypoxia. Moreover, our RT–PCR assays revealed that hypoxia induced a distinct increased expression of GLUT1, but did not affect OMA1, YME1L, and OPA1 in all three cell lines we used, i.e., HCT116, HT29, and SW48 cells (Appendix Fig S1A–C), which indicates that OMA1 is activated post‐translationally. In addition, hypoxia can lead to the reduction of mitochondrial membrane potential (Solaini et al, 2010), which also contribute to the activation of OMA1.
Figure 1. OMA1 is upregulated in human colorectal cancer and is activated by hypoxia.
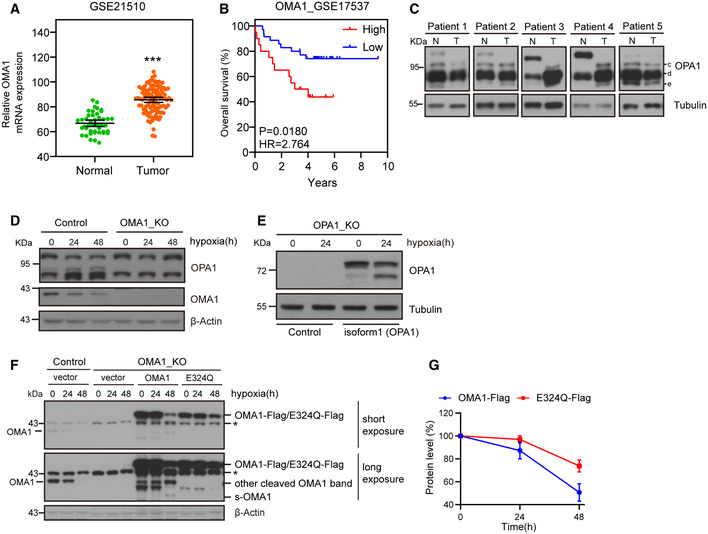
- Relative levels of OMA1 mRNA in colorectal cancer tissues (n = 105) compared with adjacent normal tissues (n = 43) from colorectal cancer patients were shown (using the GEO dataset GSE21510). The data are presented as mean ± SEM, and statistical significance was determined by a Mann–Whitney test. ***P < 0.001.
- Kaplan–Meier curves were constructed to analyze and compare between patients with high and low levels of OMA1 in colorectal cancer samples from the GEO dataset GSE17537. “Low” indicates patients with OMA1 mRNA levels less than the median. “High” indicates patients with OMA1 mRNA levels greater than the median. Statistical analysis was performed using log‐rank tests, n = 55, P = 0.0180.
- The lysates of tumors (T) and adjacent normal (N) tissues from colorectal cancer patients were analyzed by Western blotting with antibodies against OPA1 or Tubulin. The “c, d and e” bands of OPA1 indicate cleaved OPA1 bands. Tubulin was used as a loading control.
- Control and OMA1 KO HCT116 cells were cultured in hypoxia (1% O2) for 0 (normoxia), 24, or 48 h. Cell lysates were then assessed by Western blotting with antibodies against OPA1, OMA1, or β‐Actin. β‐Actin was used as a loading control. Representative immunoblots were from n = 3 independent experiments.
- OPA1‐null mouse embryonic fibroblasts (MEFs) expressing control (empty vector) or OPA1 isoform 1 were cultured in normoxia or hypoxia (1% O2) for 24 h. Cell lysates were analyzed by Western blotting with anti‐OPA1 or anti‐Tubulin antibody. Representative immunoblots were from n = 3 independent experiments.
- WT, OMA1 KO, and OMA1 KO HCT116 cells expressing WT‐OMA1(OMA1‐Flag) or proteolytic inactive OMA1(E324Q‐Flag) were cultured in hypoxia (1% O2) for 0, 24, or 48 h, and the cell lysates were assessed by Western blot with antibodies against OMA1, and β‐Actin. β‐Actin was used as a loading control (representative data from three independent experiments). The asterisk indicates a nonspecific band.
- The relative protein levels were evaluated by densitometry analysis using ImageJ software and were quantified for the ratio of OMA1‐Flag/β‐Actin or E324Q‐Flag/β‐Actin in hypoxia for 0, 24 or 48 h (n = 3 independent experiments). The data are presented as mean ± SD.
Additionally, our studies showed that hypoxia‐activated OMA1 may in turn lead to the degradation and cleavage of OMA1 (Fig 1D, F, and G). Nevertheless, the degradation of OMA1‐E324Q (proteolytic inactive OMA1) was largely inhibited in OMA1 KO HCT116 cells stably expressing OMA1‐E324Q under hypoxia, indicating that OMA1 may undergo auto‐proteolytic cleavage and auto‐degradation, consisting with the previous reports (Baker et al, 2014; Jiang et al, 2014; Zhang et al, 2014; Simula et al, 2020), but further experiments are needed to prove this. Furthermore, OMA1‐E324Q was still mildly reduced in hypoxia (48 h) (Fig 1F and G), suggesting that OMA1 can be degraded or cleaved by some other proteases in hypoxia. Our findings are consistent with the recent report that OMA1 is degraded by Yme1L in hypoxia (MacVicar et al, 2019). Therefore, OMA1 may cooperate with Yme1L to degrade OMA1 in hypoxia. These results suggest that OMA1 degradation may also act as a stop signal to prevent unlimited OMA1 activation under hypoxia, which may be a critical negative feedback to regulate OMA1 activity.
Overall, our data suggest a causal link between OMA1 activation and colorectal cancer.
Loss of OMA1 inhibits the development of AOM/DSS‐induced colorectal cancer in mice
To investigate the role of OMA1 in colorectal cancer, we generated the OMA1 knockout (KO) mouse model by deleting exon 3 of the mouse OMA1 genomic DNA (Appendix Fig S2A). The genomic DNA of WT, Oma1 −/− or Oma1 +/− mice were analyzed by PCR, and expression of OMA1 in different tissues was analyzed by Western blotting (Appendix Fig S2B and C). The mice were then injected intraperitoneally with 10 mg/kg AOM, followed by three cycles of 1.5% DSS treatment to induce colorectal cancer (Fig 2A). The AOM/DSS model utilizes chemical induction of DNA damage followed by repeated cycles of colonic inflammation (Thaker et al, 2012). After induction of tumorigenesis, all mice were euthanized on day 105, and intestines were removed and collected from each mouse. Compared with WT mice, OMA1 KO mice exhibited less body weight loss during DSS treatment (Fig 2B), and the length of colorectum in OMA1 KO mice was longer than that in WT mice (Fig 2C and D), indicating that OMA1 KO mice were less susceptible to DSS‐induced colitis than WT mice. And as shown in Fig 2E and F, most tumors located at the distal and middle region of the intestine, and the number of colorectal tumors in OMA1 KO mice was significantly reduced compared with that of tumors in WT mice. In addition, the pathological quantification verified that the number of different tumor sizes was markedly reduced in the intestine of OMA1 KO mice (Fig 2G). These data suggest that OMA1 KO inhibits colorectal carcinogenesis. Interestingly, OMA1 KO mice intestines had a lower frequency of large tumors than control mice (Fig 2H), indicating that OMA1 KO blocked the progression of colorectal cancer. Consistently, histological analysis revealed that the adenomas in the intestines of WT mice were high‐grade dysplasia and infiltrated with a greater extent of inflammation, while most of the adenomas in the intestine of OMA1 KO mice were low‐grade dysplasia (Fig 2I). Moreover, after AOM/DSS treatment, OMA1 deficiency attenuates the mRNA levels of the pro‐inflammatory factors including Tnfα, Il6, Cox2, and Ccl2 compared with the control mice (Fig 2J), suggesting that OMA1 regulates AOM/DSS‐induced inflammation, which is associated with AOM/DSS‐induced colorectal cancer. Consistently, there was a significant decrease in the proliferation rates of colorectal tumors of OMA1 KO mice, as detected by Ki‐67 nuclear staining (Fig 2K). Taken together, our findings demonstrate that OMA1 deficiency suppresses colorectal cancer development in the AOM/DSS mouse model.
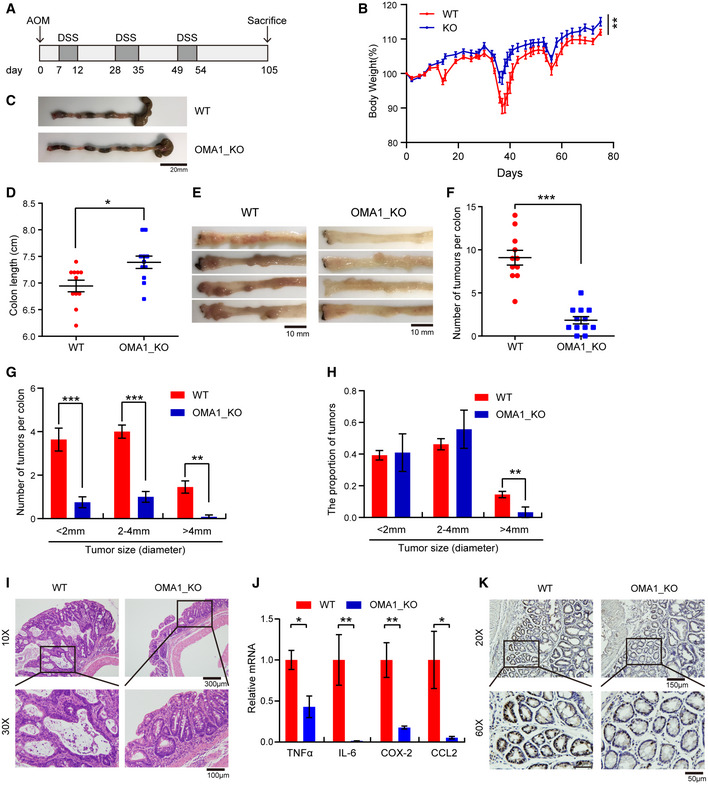
Figure 2. Loss of OMA1 inhibits the development of AOM/DSS‐induced colorectal cancer in mice.
-
ASchematic representation of the AOM/DSS procedure. To develop colitis‐associated cancer (CAC), WT (n = 11) and Oma1 −/− (n = 12) mice were injected intraperitoneally with AOM (10 mg/kg) on day 0. Then, three cycles of feeding water with 1.5% DSS treatment were administered. Mice were euthanized on day 105 and all intestinal tissues, tumors, and serum were collected. After mice were euthanized, intestines were removed and flushed with cold PBS. All experiments were repeated with three independent biological replicates.
-
BBody weight changes of WT (n = 11) and Oma1 −/− (n = 12) mice during AOM/DSS treatment. Data are presented as mean ± SEM. Statistical significance was assessed by a two‐way ANOVA, **P < 0.01.
-
CTypical intestine images on day 105 after mice were euthanized.
-
DColorectal lengths (C) of WT (n = 11 biological replicates) and Oma1 −/− (n = 12 biological replicates) mice were measured. Data with error bars are presented as mean ± SEM. Statistical significance was assessed by unpaired Student’s t‐test, *P < 0.05.
-
ERepresentative images of colorectal tumors from WT (left) and Oma1 −/− (right) mice.
-
FThe number of tumors in WT (n = 11) and Oma1 −/− (n = 12) mice was measured. Each dot represents the tumor number of one individual mouse. Data with error bars are presented as mean ± SEM. Statistical significance was assessed by unpaired Student’s t‐test, ***P < 0.001.
-
G, HThe number of tumors of different sizes (diameter) in each mouse (G) and the distribution of different tumor sizes (H) were shown (WT n = 11 biological replicates, and Oma1 −/− n = 12 biological replicates). Results are shown as mean ± SEM. P‐values were calculated by unpaired Student’s t‐test, **P < 0.01, ***P < 0.001.
-
IHistological analysis of colorectal tumors of WT and Oma1 −/− mice was shown by hematoxylin and eosin (H&E) staining.
-
JRelative mRNA expression levels of pro‐inflammatory genes (Tnfα, Il6, Cox2, and Ccl2) in colorectal homogenates of WT and OMA1_KO mice treated with AOM/DSS (n = 4–5 per genotype). The data represent the mean ± SEM, n = 3 independent experiments, and statistical significance was determined by a two‐tailed Student’s t‐test. *P < 0.05, **P < 0.01.
-
KThe colorectal tissues of WT and Oma1 −/− mice were stained with Ki67.
Then, we evaluated the role of OMA1 in colorectal tumor growth in nude mice. We developed a mouse xenograft model by subcutaneously injecting control, OMA1 KO HCT116 cells into nude mice, respectively. Consistent with AOM/DSS‐induced colorectal cancer mouse model, OMA1 KO significantly suppressed HCT116 xenograft tumor growth (Fig EV1A and B), and the tumor weight of OMA1 KO HCT116 at the endpoint was also significantly reduced compared with that of control (Fig EV1C), suggesting that OMA1 depletion suppresses HCT116 xenograft tumor development in nude mice.
Figure EV1. Loss of OMA1 significantly reduced colorectal tumor growth in nude mice and OPA1 deficiency makes cells more dependent on glycolysis for survival.

-
A–CControl or OMA1 KO HCT116 cells (5 × 10⁶) were injected into the flanks of nude mice. Mice were euthanized and photographed at day 16 (A). Representative photographs of tumors in nude mice were performed (A) and tumor weights were analyzed (C). The tumor sizes were measured at an interval of 6 days after injection and calculated as = width2 × length/2. Xenograft tumor growths of control or OMA1 KO HCT116 tumors in nude mice were shown (B). Data are presented as the mean ± SEM, n = 5 biological replicates. Scale bars, 2 cm. P‐values were calculated by two‐way ANOVA of variance; *P < 0.05, **P < 0.01. All experiments were repeated with three independent biological replicates.
-
DControl and OPA1 KO HCT116 cells were treated with glucose deprivation (galactose) or the glycolytic inhibitor (2‐Deoxy‐D‐glucose, 2‐DG, 10 mM) for 24 h. Cell deaths were quantified by cell counting with trypan blue exclusion. Error bars represent the mean ± SD (n = 3, 300 cells per independent experiment), statistical significance was assessed by a two‐way ANOVA of variance, ***P < 0.001.
-
EOPA1‐null MEFs expressing control (empty vector) or OPA1 isoform 1 were cultured with galactose or 2‐DG for 48 h. Cell death was quantified by cell counting with trypan blue exclusion. Error bars represent the mean ± SD (n = 3, 300 cells per independent experiment), statistical significance was assessed by a two‐way ANOVA of variance, ***P < 0.001.
In a summary, our findings show that OMA1 promotes colorectal cancer development in mice.
OMA1‐OPA1 axis promotes glycolysis under hypoxia
Metabolic reprogramming plays a critical role in tumorigenesis, while glycolysis, but not OXPHOS, contributes mainly to ATP production in cancer cells (Matthew et al, 2009; Ward & Thompson, 2012). Based on that, we later investigated the role of OMA1 in energy metabolism. Technologically, we evaluated the effect of OMA1 depletion on the energy metabolism of colorectal cancer cells under normoxic and hypoxic conditions. Results showed that no significant differences of glycolytic metabolism between control and OMA1 KO HCT116 cells exposed to normoxia (Fig 3A and B), and consistent with previous studies, hypoxia promoted glycolysis in all HCT116 cells, characterized by increased glucose uptake and lactate production (Fig 3A and B). However, compared with control cells, OMA1 KO showed significantly decreased levels of glucose uptake and lactate production under hypoxic conditions, while expression of OMA1‐Flag in OMA1 KO cells recovered the levels of glucose uptake and lactate production (Fig 3A and B), suggesting that OMA1 promotes glycolysis under hypoxia. Considering that OMA1 may be involved in tumor bioenergetics, we analyzed the glycolytic activity of these cells by performing real‐time analysis of the extracellular acidification rate (ECAR) with or without treatment using Dimethyloxalylglycine (DMOG), which is an inducer of HIF‐1α expression that inhibits the activity of hydroxylase. Representative curves revealed that DMOG led to a significant increase of basal glycolysis in control HCT116 cells but not in OMA1 KO cells (Fig 3C), and quantitative analysis showed that control HCT116 cells exhibited a higher maximal glycolytic capacity compared with OMA1 KO HCT116 cells (Fig 3D). These data suggest that OMA1 deficiency inhibits glycolytic metabolism under hypoxia.
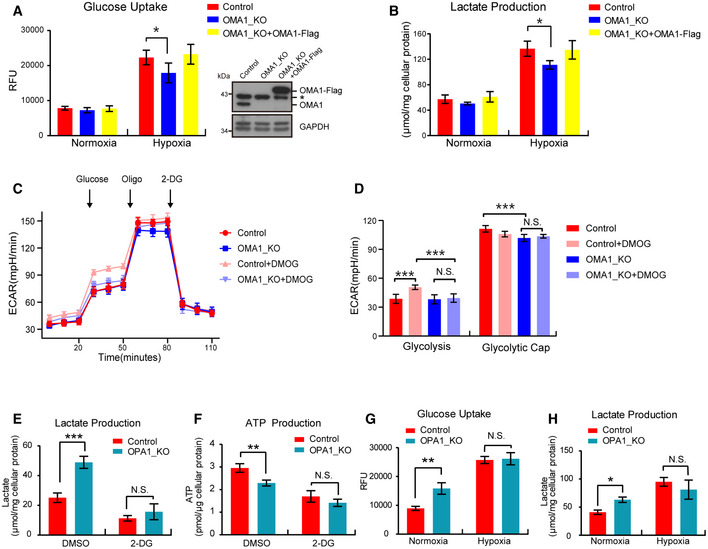
Figure 3. OMA1‐OPA1 axis promotes glycolysis under hypoxic conditions.
-
A, BControl or OMA1 KO HCT116 cells expressing control (empty vector) or OMA1‐Flag were maintained in normoxia or hypoxia (1% O2) for 24 h. The glucose uptake (A) and lactate production (B) were measured by using microplate reader, and the values were normalized to the protein concentration. Error bars indicate the mean ± SD of three independent experiments, statistical significance was assessed by a two‐way ANOVA, *P < 0.05. Cells were lysed and assessed by Western blot with antibodies against OMA1 and GAPDH (A). The asterisk indicates a nonspecific band.
-
CControl and OMA1 KO HCT116 cells were treated with DMSO or 1mM DMOG in fresh medium for 12 h. Subsequent injections of glucose, oligomycin (Oligo), and 2‐deoxy‐glucose (2‐DG) were performed as indicated. The extracellular acidification rates (ECAR) were measured with a Seahorse Extracellular Flux Analyzer XF96. The data are presented as mean ± SD (n = 3 independent experiments).
-
DQuantitative analysis of basal and maximal glycolytic capacity. Error bars are presented as mean ± SD (n = 3 independent experiments), statistical significance was assessed by a two‐way ANOVA. N.S., not significant, ***P < 0.001.
-
E, FLactate production (E) and ATP production (F) were measured in control or OPA1 KO HCT116 cells upon DMSO or 2‐DG treatment. Error bars are presented as mean ± SD by a two‐way ANOVA (n = 3 independent experiments). N.S., not significant, **P < 0.01, ***P < 0.001.
-
G, HControl or OPA1 KO HCT116 cells were maintained in normoxia or hypoxia (1% O2) for 24 h. The glucose uptake (G) and lactate production (H) were measured, and the values were normalized to the protein concentration. Statistical significance was assessed by a two‐way ANOVA; error bars are presented as mean ± SD of three independent experiments; N.S., not significant, *P < 0.05, **P < 0.01.
Based on the results that OPA1 is processed or degraded by OMA1 under hypoxia (Fig 1D and E), we investigated the role of the OMA1‐OPA1 axis in metabolic reprogramming in colorectal cancer cells. We cultured HCT116 cells or MEFs in medium with galactose or 2‐Deoxy‐D‐glucose (2‐DG) for 24 h, which all block glycolytic flux and forces cells to rely on mitochondrial oxidative phosphorylation. We found that OPA1 KO rendered HCT116 cells or MEFs exquisitely vulnerable to glucose deprivation or 2‐DG treatment (Fig EV1D and E), suggesting that OPA1 deficiency makes cells more dependent on glycolysis for survival. Along with that, OPA1 depletion also promoted lactate production, glucose uptake and reduced ATP production under normal conditions but not 2‐DG or hypoxia treatment (Fig 3E–H). These results demonstrate that OMA1 may promote glycolysis of colorectal cancer cells by regulating OPA1. Collectively, the OMA1‐OPA1 axis may promote glycolysis in colorectal cancer cells under hypoxia.
Thus, OMA1 loss may be contributing to enhanced tumorigenesis through the metabolic mechanism described herein, though additional OMA1 effects may also play key roles.
OMA1 stabilizes HIF‐1α by increasing ROS generation in mitochondria under hypoxia
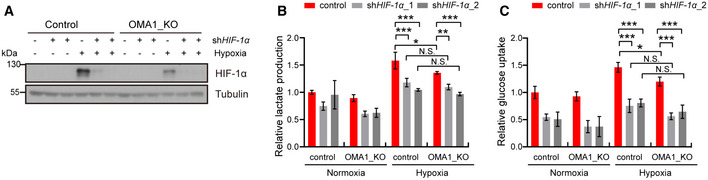
Since HIF‐1α is a master transcription factor regulated in an O2‐dependent manner and a key regulator of glycolysis in cancer (Semenza, 2003), we wondered whether OMA1 regulates HIF‐1α under hypoxia. Results indicated that hypoxia induced a remarkably increased level of HIF‐1α in control HCT116 cells; however, the upregulation of HIF‐1α by hypoxia was significantly inhibited in OMA1 KO HCT116 cells (Fig 4A). Similarly, OMA1 KO impaired the stability of HIF‐1α in cells treated with CoCl2 (Fig 4B), which is a mimic of hypoxia and stabilizes HIF‐1α protein by inhibiting PHD enzymes (the oxygen sensors). In addition, under hypoxic conditions, the protein levels of HK2, LDHA, PKM2, and GPI, which are involved in the glycolytic pathway and directly regulated by HIF‐1α (Semenza, 2003; Lunt & Vander Heiden, 2011), were significantly lower than that in control cells (Fig 4A). These data further suggest that OMA1 promotes glycolysis probably by stabilizing HIF‐1α protein under hypoxia.
Figure 4. OMA1 stabilizes HIF‐1α by increasing mitochondrial ROS generation under hypoxia.

-
AControl and OMA1 KO HCT116 cells were cultured in normoxia or in hypoxia (1% O2) for 24 or 48 h. The whole cell lysates were analyzed by Western blotting with antibodies against HIF‐1α, HK2, LDHA, PKM2, GPI, OMA1, or β‐Actin. The relative protein levels were further evaluated by densitometry analysis using ImageJ software and were presented as bar graphs in the right panels. Error bars are presented as mean ± SD by a two‐way ANOVA (n = 3 independent experiments). *P < 0.05, **P < 0.01, ***P < 0.001.
-
BControl or OMA1 KO Hela cells were untreated (−) or CoCl2‐treated (+) for 24 h with 10 mM Mg132 or vehicle added for the last 4 h. Cell lysates were assessed by Western blotting with antibodies against HIF‐1α or β‐Actin. Relative protein levels were further evaluated by densitometry analysis. Error bars indicate the mean ± SD by a two‐way ANOVA (n = 3 independent experiments). *P < 0.05, **P < 0.01.
-
CDihydroethidium (DHE) staining of optimum cutting temperature (OCT) covered tissues from the colons of WT and Oma1 −/− mice; DAPI was used as counterstain. DHE was shown in red color, while DAPI in blue color (representative data from three independent experiments).
-
DQuantification of DHE staining. Error bars are presented as mean ± SD (n = 3 biological replicates), statistical significance was assessed by a two‐way ANOVA, **P < 0.01, ***P < 0.001.
-
EControl or OMA1 KO HCT116 cells cultured in normoxia or hypoxia (1% O2) for 12 h were stained with mitoSOX and then analyzed by confocal microscopy (representative data from three independent experiments).
-
FThe fluorescence intensity of mitoSOX was further analyzed by ImageJ software. Bars indicate the mean ± SD of three independent experiments by a two‐way ANOVA, ***P < 0.001.
-
G–IControl or OMA1_KO HCT116 cells were cultured in normoxia or hypoxia for 12 h, and were treated with DMSO, NAC (10 mM) or Rotenone (1 μM) for 12 h at the same time. The whole cell lysates were analyzed by Western blotting with antibodies against HIF‐1α, and Tubulin (G). The glucose uptake (H) and lactate production (I) were measured using microplate reader, and the values were normalized to the protein concentration. Error bars indicate the mean ± SD (n = 3 independent experiments), statistical significance was assessed by two‐way ANOVA. N.S., not significant, *P < 0.05, ***P < 0.001.
Next, we planned to investigate the mechanism of OMA1 in regulating HIF‐1α, which is stabilized and activated by ROS under hypoxia (Semenza, 2004). Therefore, we examined the effect of OMA1 on ROS production. To analyze ROS levels of the mice intestines, we stained the tumors and adjacent normal tissues with the ROS‐responsive dye dihydroethidium (DHE). Results showed a significantly decreased ROS level in tumors or adjacent normal tissues of OMA1 KO mice intestines compared with that of WT mice intestines (Fig 4C and D). In parallel, we also detected the mitochondrial ROS (mtROS) in HCT116 cells under normoxic and hypoxic conditions. Consistently, both in normoxia and hypoxia, the mitochondrial ROS level of OMA1 KO HCT116 cells was significantly lower than that of control cells (Fig 4E and F). These data demonstrate that OMA1 depletion significantly decreases mtROS generation in the colorectal tumor. Then, we investigated the role of OMA1‐regulated mtROS in HIF‐1α stability. Under hypoxia, compared with DMSO treatment, Rotenone (ROS inducer) treatment remarkably increased the protein levels of HIF‐1α both in control and OMA1 KO cells, while NAC (ROS scavenger) treatment inhibited hypoxia‐induced upregulation of HIF‐1α both in control and OMA1 KO cells (Fig 4G). These data suggesting that OMA1 KO inhibits hypoxia‐induced upregulation of HIF‐1α by regulating ROS generation. Moreover, Rotenone treatment promoted lactate production and glucose uptake in OMA1 KO cells under hypoxia, but NAC treatment decreased lactate production and glucose uptake both in control and OMA1 KO cells (Fig 4H and I). These results demonstrate OMA1‐mediated ROS production in hypoxia is required for HIF‐1α upregulation and glycolysis.
Next, we determined whether OMA1‐regulated glycolysis is dependent on HIF‐1α. Compared with control, OMA1 KO led to remarkably decreased glucose uptake and lactate production under hypoxia (Fig EV2A–C). However, HIF‐1α knockdown significantly inhibited glucose uptake and lactate production both in control and OMA1 KO under hypoxia (Fig EV2A–C). These data indicate that OMA1 may regulate glycolysis in a HIF‐1α dependent manner.
Figure EV2. OMA1 regulates glycolysis in a HIF‐1α dependent manner.
-
A–CControl or OMA1_KO HCT116 cells were transfected with control, shHIF‐1α_1, or shHIF‐1α_2 (HIF‐1α knockdown) lentiviral particles. And cells were cultured in normoxia or hypoxia for 12 h. The whole cell lysates were analyzed by Western blotting with antibodies against HIF‐1α, Tubulin (representative data from three independent experiments) (A). The lactate production (B) and glucose uptake (C) were measured using microplate reader, and the values were normalized to the protein concentration. Error bars indicate the mean ± SD (n = 4 independent experiments), statistical significance was assessed by a two‐way ANOVA. N.S., not significant, *P < 0.05, ***P < 0.001.
Taken together, OMA1 promotes glycolysis by increasing mtROS generation and HIF‐1α stability in colorectal cancer cells under hypoxic conditions.
OMA1‐OPA1 axis regulates mitochondrial cristae remodeling of colorectal cancer cells in vivo
Since mitochondrial ROS is produced by the mitochondrial electron transport chain (ETC), which is composed of four supercomplexes named complex I–IV (Liu et al, 2002), and mitochondrial cristae are the main site of mitochondrial electron transport and oxidative phosphorylation, we assessed mitochondrial cristae in the tumors and adjacent normal tissues by transmission electron microscopy (TEM). TEM analysis revealed that mitochondrial cristae remained normal in normal tissues of WT or OMA1 KO mice intestines (Fig EV3A). In contrast, mitochondrial cristae were remarkably reduced in the colorectal tumors of WT mice (Fig EV3A), probably induced by tumor microenvironments (including hypoxia) in vivo, but OMA1 KO restored mitochondrial cristae in colorectal tumors (Fig EV3A), indicating that OMA1 KO inhibits the loss of mitochondrial cristae in colorectal tumors. Furthermore, the quantification of cristae number to the mitochondrial area further confirmed that OMA1 KO restores mitochondrial cristae in mice colorectal tumors (Fig EV3B). Next, we used Western blotting to analyze the level of OPA1, which is the substrate of OMA1 and critical for the formation of mitochondrial cristae (Frezza et al, 2006; Cogliati et al, 2013; Zhang et al, 2014). The protein level of OPA1 or L‐OPA1 (long form of OPA1) was markedly decreased in colorectal tumors compared with adjacent normal tissues (Fig EV3C), and OMA1 KO retarded the degradation of OPA1 or L‐OPA1 in the colorectal tumors (Fig EV3C), indicating that OMA1 is activated by hypoxic tumor microenvironments to degrade OPA1 in colorectal cancer cells in vivo. Furthermore, the protein level of OPA1 of HCT116 xenograft tumor in nude mice was remarkably decreased compared with that of cultured HCT116 cells (Fig EV3D), leading to dramatically decreased mitochondrial cristae in HCT116 xenograft tumor cells (Fig EV3E and F), which demonstrates that OPA1 is degraded by OMA1 in HCT116 xenograft tumor in nude mice. These data suggest that the OMA1‐OPA1 axis is activated by hypoxia and contributes to mitochondrial cristae loss in colorectal cancer cells in vivo.
Figure EV3. OMA1‐OPA1 axis regulates mitochondrial cristae remodeling of colorectal cancer cells in vivo .

-
ARepresentative transmission electron microscopy (TEM) analysis of the colorectal tumors or adjacent normal tissues from WT or Oma1 −/− mice.
-
BQuantitative analysis of mitochondrial cristae (the ratio of cristae number to mitochondrial area) in tumor or adjacent normal tissues from WT and Oma1 −/− mice (20 mitochondria per group, biological replicates). Statistical significance was assessed by a two‐way ANOVA; error bars are presented as mean ± SD; N.S., not significant, ***P < 0.001.
-
CThe lysates of the adjacent normal tissues or tumors from WT and Oma1 −/− mice were stained with antibodies against OPA1, OMA1, or Tubulin (representative data from three independent experiments). The asterisk indicates a nonspecific band. The bands of OPA1 and L‐OPA1 were further quantified by ImageJ software. Error bars indicate the mean ± SD (n = 3 independent experiments), statistical significance was assessed by two‐way ANOVA. N.S., not significant, *P < 0.05, ***P < 0.001.
-
DThe lysates of HCT116 cells or xenograft tumor of nude mice injected with HCT116 cells were assessed by Western blotting with anti‐OPA1, or anti‐OMA1, or anti‐Tubulin (representative data from three independent experiments).
-
ERepresentative TEM analysis of HCT116 cells or the xenograft tumors of nude mice injected with HCT116 cells.
-
FQuantitative analysis of mitochondrial cristae (the ratio of cristae number to mitochondrial area) in HCT116 cells or the xenograft tumors of nude mice injected with HCT116 cells (20 mitochondria per group, biological replicates). Statistical significance was assessed by Student’s t‐test; error bars are presented as mean ± SD; ***P < 0.001.
-
GYME1L_KO, OMA1_KO, YME1L_OMA1_Double KO (DKO), and WT HCT116 cells were maintained in normoxia or hypoxia (1% O2) for 72 h. The whole cell lysates were analyzed by Western blotting with antibody against OPA1. Tubulin was used as a loading control.
-
H, IRepresentative TEM analyzed the inside of the xenograft tumors from nude mice injected with control, OPA1_KO, shOPA1, YME1L‐OMA1‐DKO HCT116 cells (H). Quantitative analysis of mitochondrial cristae (the ratio of cristae number to mitochondrial area) was further performed (I) (20 mitochondria per group, biological replicates). Statistical significance was assessed by a two‐way ANOVA; error bars are presented as mean ± SD; N.S., not significant, ***P < 0.001.
-
JWT, YME1L_KO, OMA1_KO, and YME1L_OMA1_Double KO (DKO) HCT116 cells were analyzed by Western blotting with antibody against OMA1, YME1L, and Tubulin.
-
K, LControl and shOPA1_KO (K), Control and shOPA1 (L) HCT116 cells were analyzed by Western blotting with antibodies against OPA1 and Tubulin.
Considering that total OPA1 levels is also regulated by Yme1L under hypoxia (MacVicar et al, 2019), we analyzed OPA1 levels in OMA1 and Yme1L double knockout (DKO) cells exposed to hypoxia, in which OPA1 processing or degradation is completely inhibited. Western blotting assay revealed that OMA1 and Yme1L DKO dramatically inhibited OPA1 processing and degradation in HCT116 cells under hypoxia (Fig EV3G), suggesting that besides OMA1, Yme1L also regulates OPA1 degradation and processing under hypoxia. Furthermore, TEM analysis revealed that control (OPA1 is processed due to hypoxic environment), OPA1 KO or shOPA1 HCT116 xenograft tumor cells maintained very little mitochondrial cristae (Fig EV3H–L), but Yme1l and OMA1 DKO HCT116 xenograft tumor cells restored the loss of mitochondrial cristae (Fig EV3H–L). These data suggest that OMA1 and Yme1L‐mediated OPA1 processing and degradation directly contributes to mitochondrial cristae loss in tumor. It should be noted that some other factors may also regulate mitochondrial cristae during tumor development, because OPA1 is not the only factor regulating mitochondrial cristae biogenesis, and some other proteins, such as MICOS and dimeric F1FO‐ATP synthase, also play a key role in mitochondrial cristae formation (Cogliati et al, 2016).
Mitochondrial respiratory chain complexes components NDUFB5, NDUFB6, COX4L1 and NDUFA4 are probably proteolytic substrates of OMA1
The Warburg effect is composed of two main contents: (i) increased proportion of glycolysis and (ii) and decreased proportion of mitochondrial oxidative phosphorylation in cancer cells (Warburg, 1956). OMA1 KO suppresses the Warburg effect (Fig 3A–D) and reduces the generation of mtROS (Fig 4C–F) that is produced in mitochondrial electron transport chain, suggesting that OMA1 is related with mitochondrial oxidative phosphorylation. Therefore, we investigated the role of OMA1 in mitochondrial oxidative phosphorylation system. Mitochondrial cytochrome c oxidase activity was increased in OMA1 KO HCT116 cells compared with control cells, which was restored by expressing OMA1‐Flag in OMA1 KO cells (Appendix Fig S3A), suggesting that OMA1 regulates mitochondrial respiratory chain complexes. Since OMA1 is mitochondrial protease located at mitochondrial inner membrane, we hypothesized that certain components of mitochondrial respiratory chain complexes are proteolytic substrates of OMA1. We utilized a FLAG‐tagged variant of OMA1 in which the glutamate residue of its HEXXH motif was replaced by glutamine (E324Q) to block the OMA1 protease activity (Zhang et al, 2014), to identify novel substrates of OMA1. We overexpressed OMA1‐E324Q‐Flag in 293T cells and performed co‐immunoprecipitation (co‐IP), followed by mass spectrometry analysis. Four components of mitochondrial respiratory chain complexes were identified to interact with OMA1, including NDUFB5, NDUFB6, COX4L1, and NDUFA4 (Fig 5A–D, and Appendix Table S1). NDUFB5 and NDUFB6 are the subunits of NADH dehydrogenase (mitochondrial respiratory chain complex I), while COX4L1 and NDUFA4 are the components of the cytochrome c oxidase (mitochondrial respiratory chain complex IV) (Fukuda et al, 2007; Loublier et al, 2011; Balsa et al, 2012; Böttinger et al, 2013; Stroud et al, 2016). To examine whether NDUFB5, NDUFB6, COX4L1, and NDUFA4 are proteolytic substrates of OMA1, we treated OMA1 KO HCT116 cells expressing OMA1‐Flag with CCCP, which disrupts mitochondrial membrane potential to strongly activate OMA1. Notably, we found that overexpression of OMA1 or CCCP treatment significantly promoted the processing of COX4L1 and NDUFB6 (Fig 5E), and CCCP treatment also resulted in a markedly reduced level of NDUFB5 and NDUFA4 (Fig 5E). Consistently, OMA1 knockdown or knockout inhibited CCCP‐induced processing of COX4L1 and NDUFB6 and inhibited CCCP‐induced degradation of NDUFB5 and NDUFA4 (Fig 5E and Appendix Fig S3B). Additionally, upon cycloheximide (CHX, inhibitor of protein synthesis) plus CCCP treatment, the protein levels of NDUFB5, NDUFB6, COX4L1, and NDUFA4 were quickly reduced in control or OMA1 KO cells expressing OMA1‐Flag cells, but the reduction was remarkably inhibited in OMA1 KO cells or OMA1 KO cells stably expressing E324Q‐Flag OMA1 (Fig 5F). These results demonstrate that mitochondrial respiratory chain complexes components NDUFB5, NDUFB6, COX4L1, and NDUFA4 may be proteolytic substrates of mitochondrial protease OMA1.
Figure 5. NDUFB5, NDUFB6, COX4L1, and NDUFA4 may be proteolytic substrates of OMA1.
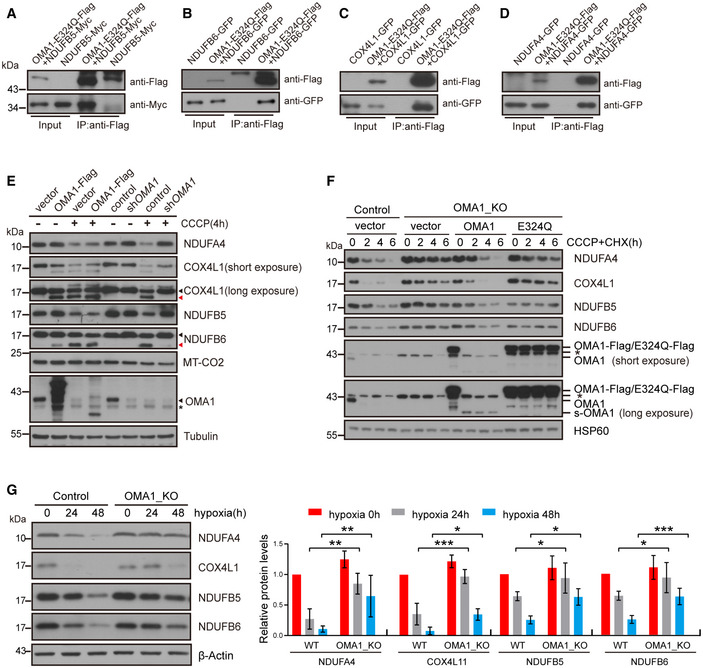
- 293T cells were transiently co‐transfected with empty vector and NDUFB5‐MYC, or OMA1‐E324Q‐Flag and NDUFB5‐MYC. Cell lysates were used for co‐immunoprecipitation with anti‐Flag M2 affinity gel at 4°C overnight, followed by Western blotting with anti‐Flag or anti‐MYC antibodies (n = 3 independent experiments).
- 293T cells were transiently co‐transfected with empty vector and NDUFB6‐GFP, or OMA1‐E324Q‐Flag and NDUFB6‐GFP. Cell lysates were used for co‐immunoprecipitation with anti‐Flag M2 affinity gel at 4°C overnight, followed by Western blotting with antibodies against Flag or GFP (n = 3 independent experiments).
- 293T cells were transiently co‐transfected with empty vector and COX4L1‐GFP, or OMA1‐E324Q‐Flag and COX4L1‐GFP. Cell lysates were used for co‐immunoprecipitation with anti‐Flag M2 affinity gel at 4°C overnight, followed by Western blotting with anti‐Flag or anti‐GFP antibodies (n = 3 independent experiments).
- 293T cells were transiently co‐transfected with empty vector and NDUFA4‐GFP, or OMA1‐E324Q‐Flag and NDUFA4‐GFP. Cell lysates were used for co‐immunoprecipitation with anti‐Flag M2 affinity gel at 4°C overnight, followed by Western blotting with antibodies against Flag or GFP (n = 3 independent experiments).
- HCT116 cells stably expressing control (empty vector) or OMA1‐Flag, and HCT116 cells infected with control or shOMA1 (OMA1 knockdown) lentiviral particles and further cultured for 5 days, were then treated with DMSO or 20 μm CCCP for 4 h. Cell lysates were analyzed by Western blotting with antibodies against NDUFA4, COX4L1, NDUFB5, DNUFB6, MT‐CO2, OMA1, or Tubulin. The black arrowhead indicated the full‐length COX4L1 or NDUFB6, and the red arrowhead pointed to the cleaved band. The asterisk indicates a nonspecific band.
- WT, OMA1 KO, and OMA1 KO HCT116 cells expressing WT‐OMA1(OMA1‐Flag) or proteolytic inactive OMA1(E324Q‐Flag) were treated with CHX (100 µg/ml) plus CCCP (20 µM) for 0, 2, 4, 6 h. The cell lysates were then assessed by western blot with antibodies against NDUFA4, COX4L1, NDUFB5, NDUFB6, OMA1, or HSP60 (representative data from three independent experiments). The asterisk indicates a nonspecific band.
- Control or OMA1 KO HCT116 cells were cultured in hypoxia (1% O2) for 0, 24, or 48 h. Cell lysates were assessed by Western blotting with anti‐NDUFB5, anti‐NDUFB6, anti‐COX4L1, anti‐NDUFA4 antibodies, or anti‐β‐Actin. The relative protein levels were further evaluated by densitometry analysis using ImageJ software and were presented as bar graphs in the right panels. Error bars are presented as mean ± SD by a two‐way ANOVA (n = 3 independent experiments). *P < 0.05, **P < 0.01, ***P < 0.001.
Then, we investigated whether OMA1 regulates the stability of these proteins in colorectal cancer cells. The protein levels of NDUFB5, NDUFB6, COX4L1, and NDUFA4 were dramatically decreased in the HCT116 cells exposed to hypoxia (Fig 5G), which indicate a destabilization of mitochondrial respiratory chain complexes under hypoxia. However, OMA1 KO rescued hypoxia‐induced reduction of these proteins (Fig 5G). In addition, compared with OMA1 KO (vector), expression of OMA1‐Flag but not OMA1‐E324Q‐Flag in OMA1 KO cells promoted the degradation or processing of NDUFB5, NDUFB6, COX4L1, and NDUFA4 under hypoxia (Appendix Fig S3C). These data indicate that OMA1 may degrade NDUFB5, NDUFB6, COX4L1, and NDUFA4 under hypoxic conditions. In a summary, these data suggest that mitochondrial respiratory complexes components NDUFB5, NDUFB6, COX4L1, and NDUFA4 may be new proteolytic substrates of mitochondrial protease OMA1.
OMA1 impairs the assembly of mitochondrial respiratory chain complexes under hypoxia
The oxidative phosphorylation system is composed of some large mitochondrial respiratory chain complexes I–IV and complex V (ATP synthase), which require the coordinated assembly of a large number of proteins encoded by the mitochondrial and nuclear genome (Acín‐Pérez et al, 2008). Since OMA1 regulates mitochondrial cytochrome c oxidase activity (Appendix Fig S3A), we further investigated the role of OMA1 in oxidative phosphorylation. Firstly, we examined whether OMA1 regulates the integrity of mitochondrial respiratory chain complexes in colorectal cancer by using blue native PAGE (BN‐PAGE). OMA1 KO significantly increased the level of mitochondrial respiratory chain complexes I, II, IV, and complex V (ATP synthase) in mouse colorectal tumors (Fig 6A), indicating that OMA1 KO may inhibit the disassembly of mitochondrial respiratory chain complexes of colorectal cancer cells in vivo. Considering hypoxic tumor microenvironments activating OMA1, we later investigated the effect of hypoxia on mitochondrial respiratory chain complexes assembly. Results showed that hypoxia reduced the assembly of mitochondrial respiratory chain complexes I, II, IV, and complex V (ATP synthase) in control HCT116 cells, and OMA1 KO inhibited the hypoxia‐induced reduction of complexes I and IV (Fig 6B). These data suggest that OMA1 may impair mitochondrial respiratory chain complexes assembly of colorectal cancer cells.
Figure 6. OMA1 impairs the assembly of mitochondrial respiratory chain complexes under hypoxia.

- Mitochondria isolated from tumors (T) or adjacent normal (N) tissues of WT and Oma1 −/− mice were subjected to blue native PAGE (BN‐PAGE), and respiratory chain complexes were analyzed by Western blotting with anti‐NDUFB8 (Complex I), anti‐SDHA (Complex II), anti‐COX4L1 (Complex IV), and anti‐ATP5A1 (Complex V, ATP synthase) antibodies. SDS–PAGE with antibody against HSP60 was used as a loading control. Relative protein levels were further evaluated by densitometry analysis using ImageJ software. Error bars are presented as mean ± SD by a two‐way ANOVA (n = 3 independent experiments). *P < 0.05, **P < 0.01, ***P < 0.001.
- Digitonin‐solubilized mitochondria were isolated from control and OMA1 KO HCT116 cells cultured in normoxia or hypoxia (1% O2) for 12 h, and then analyzed by BN‐PAGE and immunoblotting using the indicated antibodies against NDUFB8 (Complex I), SDHA (Complex II), COX4L1 (Complex IV), and ATP5A1 (Complex V). SDS–PAGE with antibody against HSP60 was used as a loading control. Relative protein levels were further evaluated by densitometry analysis using ImageJ software. Error bars are presented as mean ± SD by a two‐way ANOVA (n = 3 independent experiments). N.S., not significant, *P < 0.05.
- The lysates of adjacent normal tissues (N) or tumors (T) from WT and Oma1 −/− mice were analyzed by Western blotting with antibodies against NDUFA4, COX4L1, NDUFB5, DNUFB6, UQCRC2, or Tubulin. Relative protein levels were further evaluated using ImageJ software. Error bars indicate the mean ± SD by a two‐way ANOVA (n = 3 independent experiments). *P < 0.05, ***P < 0.001.
- A graphic model of mitochondrial stress sensor OMA1‐coordinated glycolysis and mitochondrial oxidative phosphorylation in colorectal carcinogenesis and development. Hypoxia‐induced OMA1 activation leads to the degradation of mitochondrial respiratory chain complexes (MRCC) components and OPA1, and results in cristae remodeling, all of which results in the inhibition of mitochondrial electron transport chain (ETC) and the generation of mitochondrial ROS. Elevated ROS can stabilize HIF1a, thereby promoting glycolysis. Thus, OMA1 promotes the Warburg effect by coordinating glycolysis and oxidative phosphorylation to facilitate colorectal cancer development.
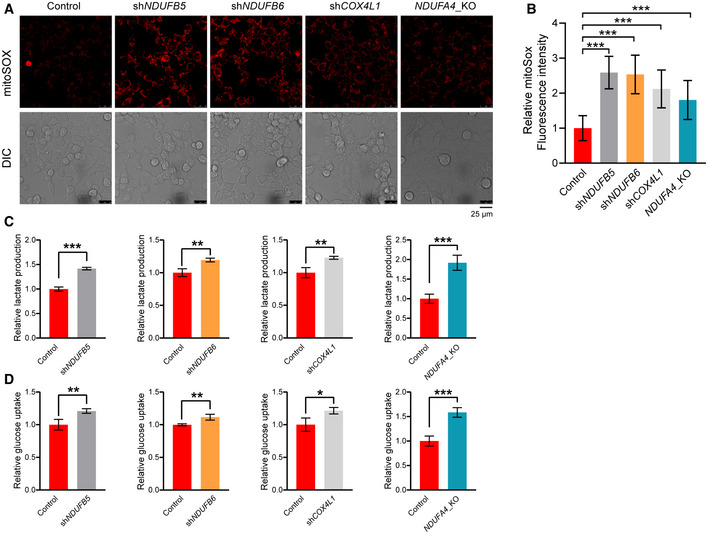
Then, we explored how OMA1 impairs mitochondrial respiratory chain complexes assembly. Since we identified that mitochondrial respiratory chain complex I components NDUFB5, NDUFB6, and complex IV components NDUFA4 and COX4L1 can be degraded by OMA1 (Fig 5), we later examined the role of NDUFB5, NDUFB6, NDUFA4, and COX4L1 in the assembly of mitochondrial respiratory chain complexes. The results showed that NDUFB5 or NDUFB6 knockdown destabilized some components (NDUFB5, NDUFB6, NDUFB8) of mitochondrial respiratory chain complex I, but did not affect complex II component SDHA and complex III component UQCRC2 (Fig EV4A and B). In addition, COX4L1 knockdown or NDUFA4 knockout led to a dramatic reduction of complex IV key component MT‐CO2 (Fig EV4C and D). Moreover, NDUFB5 or NDUFB6 knockdown impaired the assembly of mitochondrial respiratory chain complex I, and COX4L1 knockdown or NDUFA4 knockout led to the disassembly of mitochondrial respiratory chain complex IV (Fig EV4E). Next, we analyzed the protein levels of NDUFB5, NDUFB6, COX4L1, and NDUFA4 in vivo. NDUFB5, NDUFB6, COX4L1, and NDUFA4 were significantly decreased in the mouse colorectal tumors compared with that in the adjacent normal tissues (Fig 6C), indicating that NDUFB5, NDUFB6, COX4L1, and NDUFA4 are destabilized in colorectal tumors. However, OMA1 KO markedly restored the degradation of NDUFB5, NDUFB6, COX4L1, and NDUFA4 in the colorectal tumors (Fig 6C). These findings demonstrate that OMA1‐mediated degradation of NDUFB5, NDUFB6, COX4L1, and NDUFA4 may contribute to the disassembly of mitochondrial respiratory chain complexes in colorectal tumors. We next investigated the role of NDUFB5, NDUFB6, COX4L1, and NDUFA4 in mtROS production and glycolysis. Results indicated that mtROS, glucose uptake, and lactate production were remarkably increased in NDUFB5 knockdown, NDUFB6 knockdown, COX4L1 knockdown, or NDUFA4 knockout HCT116 cells (Fig EV5A–D). Therefore, under hypoxic condition, OMA1 may mediate NDUFB5, NDUFB6, COX4L1, and NDUFA4 degradation to impair mitochondrial respiratory complexes, thereby increasing mtROS generation and glycolysis.
Figure EV4. Depletion of NDUFB5, NDUFB6, COX4L1, or NDUFA4 impairs the assembly of mitochondrial respiratory chain complexes.

- HCT116 cells were transfected with control, shNDUFB5_1 or shNDUFB5_2 (NDUFB5 knockdown) lentiviral particles, and the cell lysates were assessed by Western blotting with anti‐NDUFB5, anti‐NDUFB6, anti‐NDUFB8, anti‐SDHA, anti‐UQCRC2, or anti‐β‐Actin. (representative data from three independent experiments).
- HCT116 cells infected with control or shNDUFB6 (NDUFB6 knockdown) lentiviral particles were lysed and analyzed by Western blotting with antibodies against NDUFB5, NDUFB6, NDUFB8, SDHA, UQCRC2, or β‐Actin. (representative data from three independent experiments).
- HCT116 cells were transfected with control or shCOX4L1 (COX4L1 knockdown) lentiviral particles and the cell lysates were assessed by Western blotting with anti‐COX4L1, anti‐MT‐CO2, anti‐NDUFB8, anti‐SDHA, anti‐UQCRC2, or anti‐β‐Actin. (representative data from three independent experiments).
- Western blotting analysis of HCT116 control or NDUFA4 KO (NDUFA4 knockout) cell lysates with antibodies against NDUFA4, MT‐CO2, NDUFB6, SDHA, UQCRC2, or β‐Actin. (representative data from three independent experiments).
- Mitochondria isolated from control and shCOX4L1, control and shNDUFB5, control and shNDUFB6, control and NDUFA4_KO HCT116 cells were subjected to blue native PAGE (BN‐PAGE), and respiratory chain complexes were analyzed by Western blotting with anti‐NDUFB8 (Complex I), anti‐SDHA (Complex II), anti‐MT‐CO2 (Complex IV), and anti‐ATP5A1 (Complex V, ATP synthase) antibodies. SDS–PAGE with antibody against HSP60 was used as a loading control. Relative protein levels were further evaluated by densitometry analysis using ImageJ software. Error bars are presented as mean ± SD by Student’s t‐test (n = 3 independent experiments). N.S., not significant, **P < 0.01, ***P < 0.001.
Figure EV5. Mitochondrial respiratory chain complexes component NDUFB5, NDUFB6, COX4L1, or NDUFA4 regulates mtROS generation and glycolytic metabolism.
-
A, BControl, shCOX4L1, shNDUFB5, shNDUFB6, and NDUFA4_KO HCT116 cells were stained with mitoSOX and then analyzed by confocal microscopy (A). The fluorescence intensities of mitoSOX were analyzed by ImageJ software (B). Bars indicate the mean ± SD of three independent experiments by Student’s t‐test, ***P < 0.001.
-
C, DControl and shCOX4L1, control and shNDUFB5, control and shNDUFB6, control and NDUFA4_KO HCT116 cells were cultured for 24 h. The lactate production (C) and glucose uptake (D) were measured by using microplate reader, and the values were normalized to the protein concentration. Error bars indicate the mean ± SD (n = 3 independent experiments), statistical significance was assessed by t‐test, *P < 0.05, **P < 0.01, ***P < 0.001.
Overall, these results demonstrated that OMA1 may affect mitochondrial respiratory chain complexes assembly of colorectal cancer cells in vivo by degrading or processing some components of mitochondrial respiratory chain complexes (Fig 6D). In other words, OMA1 downregulates oxidative phosphorylation in colorectal cancer cells in vivo.
Discussion
Mitochondria are important organelles that mediates tumorigenesis in multiple biological aspects, including metabolism, bioenergetics, biosynthetics, oxidative stress, signaling, and cell death regulation (Vyas et al, 2016). In this study, we demonstrated that mitochondrial stress sensor OMA1 plays an important role in colorectal carcinogenesis and development. Genetic deficiency of OMA1 suppressed colorectal tumor growth in the AOM/DSS mouse model and xenograft. We also elucidated the mechanism that OMA1 coordinates glycolysis and mitochondrial oxidative phosphorylation by regulating ROS generation, cristae remodeling, and mitochondrial respiratory chain complexes assembly under hypoxia.
OMA1, as an ATP‐dependent zinc metalloprotease located in the mitochondrial inner membrane, was previously reported to be activated by self‐cleavage during stress conditions and participate in mitochondrial protein quality control (Käser et al, 2003; Baker et al, 2014; Zhang et al, 2014; Bohovych et al, 2016), and some recent research starts to link the OMA1 expression to gastric cancer initiation and breast cancer metastasis (Amini et al, 2019; Daverey et al, 2019). In our present study, the bioinformatics analyses showed the expression of OMA1 is upregulated in the tumors from colorectal cancer patients and increased OMA1 expression correlates with poor prognosis (Fig 1A and B). Consistently, the AOM‐DSS mouse model reveals that OMA1 knockout mice displayed less and lower‐grade colorectal tumor, as well as less body weight changes, compared with WT mice (Fig 2). In addition, OMA1 knockout also suspended colorectal tumor growth in xenograft models (Fig EV1A–C), which is probably due to the metabolic and stress adaptations of cancer cells during the tumorigenesis process. Moreover, our data revealed a degradation of the canonical OMA1 substrate OPA1 in the tumor from colorectal cancer patients and mice (Figs 1C, and EV3C and D), suggesting that OMA1 is activated in colorectal cancer cells in vivo. Taken together, these findings provide insights into the role of OMA1 in colorectal cancer development.
Metabolic reprogramming has a great impact on tumor development, and tumor cells show adaptive responses to hypoxia and hypo‐nutrient conditions, resulting in changes in tumor cellular bioenergetics (Ward & Thompson, 2012). Our data suggested that OMA1 KO inhibits glycolytic metabolism under hypoxia or DMOG treatment, while there is no significant difference between control and OMA1 KO cells under normoxia (Fig 3A–D). Moreover, under hypoxia, OMA1 deficiency attenuates the levels of glycolysis‐related proteins (Fig 4A). It has been reported that OPA1 mutation or deficiency impairs mitochondrial oxidative phosphorylation (Zanna et al, 2008; Mishra et al, 2014), and activated OMA1 regulates the degradation and processing of OPA1 (Ehses et al, 2009). Based on that, we showed that OPA1 deletion makes cells more dependent on glycolysis for survival in our study (Figs 3E–H, and EV1D and E). These findings demonstrate that the OMA1‐OPA1 axis may participate in the glycolytic shift during colorectal tumor development, though additional OMA1 effects may also play key roles in this process.
Then, we investigated the mechanism of OMA1 regulating energy metabolic alteration during colorectal cancer development. Tumor environments are changing while hypoxia is a key tumor microenvironment as the tumor grows. And HIF‐1α is a key regulator of glycolysis in response to hypoxic stress, through the transcriptional regulation of genes encoding glycolytic enzymes and glucose transporters (Denko, 2008). In our study, we found that OMA1 is activated by hypoxia, thus leading to the stabilization of HIF‐1α under hypoxic conditions (Figs 1D and 4A). In addition, OMA1 promoted ROS generation both in mitochondria exposed to hypoxia (Fig 4E and F) and in the colorectal tumor (Fig 4C and D). These data suggest that OMA1 stabilizes HIF‐1α through increasing ROS generation under hypoxia, thus promoting glycolysis. Next, we explored the role of OMA1 in mitochondrial oxidative phosphorylation. Since mitochondrial respiratory chain complex and ATP synthase are localized in mitochondrial cristae, which enable mitochondria to produce sufficient ATP by oxidative phosphorylation (Acín‐Pérez et al, 2008), we examined the mitochondrial ultrastructure in the mouse colorectal tumors. Compared with adjacent normal tissues, colorectal tumors displayed dramatically reduced mitochondrial cristae, but OMA1 KO inhibited mitochondrial cristae loss in colorectal tumors (Fig EV3A and B). Additionally, Western blotting analysis showed that OPA1, a key mitochondrial cristae formation factor, was reduced in colorectal tumors compared with that in adjacent normal tissues, however, OMA1 KO attenuated the reduction of OPA1 in colorectal tumors (Fig EV3C). These data indicate that OMA1‐OPA1 axis promotes mitochondrial cristae loss to downregulate oxidative phosphorylation in response to tumor microenvironments during colorectal cancer development. Moreover, we showed NDUFB5, NDUFB6, COX4L1, and NDUFA4 (Fig 5), the components of mitochondrial respiratory complexes, may be the new substrates of OMA1. In colorectal tumor or under hypoxic conditions, NDUFB5, NDUFB6, COX4L1, and NDUFA4 were degraded by OMA1, leading to disassembly of mitochondrial respiratory complexes (Fig 6), thereby down‐regulating mitochondrial oxidative phosphorylation and promoting glycolysis (Fig EV5C and D). Taken together, OMA1 promotes the Warburg effect by coordinating glycolysis and oxidative phosphorylation.
It has been reported that hypoxia increases the expression of mitochondrial protease LonP1 by HIF‐1α (Fukuda et al, 2007) and also activates mitochondria i‐AAA protease Yme1L (MacVicar et al, 2019). Therefore, OMA1 may cooperate with Yme1L, LonP1, and some other mitochondrial proteases to regulate mitochondrial metabolism under hypoxia. But uniquely, hypoxia‐induced OMA1 activation may also lead to its degradation (Fig 1D–G) probably due to self‐cleavage and self‐degradation (Baker et al, 2014; Zhang et al, 2014); moreover, OMA1 can be degraded by Yme1L in hypoxia (MacVicar et al, 2019). Therefore, OMA1 could not be unlimitedly activated by hypoxia. And in hypoxic cells, OMA1 may act as a stop button of disrupting mitochondria by degradation, thus maintaining certain mitochondrial activity for cancer cell survival. This phenomenon is a negative feedback for modulating mitochondrial metabolism by OMA1 under hypoxia.
Mitochondrial ROS formation under hypoxia is complicated due to low oxygen (Clanton, 2007), and it is mainly generated by mitochondrial respiratory complexes I and III. Under hypoxic conditions, OMA1 may impair assembly of mitochondrial respiratory complex I by degrading NDUFB5 and NDUFB6 (Fig 6); however, the decreased mitochondrial respiratory complex I may have little effect on impairing mtROS formation due to the low oxygen. In addition, the depletion of NDUFB5, NDUFB6, COX4L1, and NDUFA4 increases mtROS production (Fig EV5A and B). Therefore, under hypoxia, the degradation of NDUFB5, NDUFB6, COX4L1, and NDUFA4 by activated OMA1 may inhibit the electron transfer chain, leading to the increase rather than inhibition of mtROS production within mitochondria.
Overall, OMA1 acts as a sensor to tumor microenvironments, particularly hypoxia, and functions as a key factor in energy metabolic reprogramming. It promotes the Warburg effect by coordinating glycolysis and oxidative phosphorylation, thus facilitating colorectal cancer development (Fig 6D). Importantly, OMA1 can act as a stop button to modulate mitochondrial metabolism in hypoxia. In addition, the mild glycolytic deficiency, reduced ROS and hypoxic signaling, and accumulation of OXPHOS substrates in OMA1 KO cells may contribute to the inhibition of colorectal cancer development. Our findings reveal that OMA1 is a potential target for the prevention or treatment of colorectal cancer.
Materials and Methods
Cell culture reagents and antibodies
HCT116, 293T, MEFs, SW48, and HT29 cell lines were cultured in Dulbecco’s modified Eagle’s medium (Thermo Fisher) supplemented with 10% fetal bovine serum (FBS, Gibco), 1% penicillin/streptomycin (Gibco), and 1% sodium pyruvate at 37°C with 5% CO2. For hypoxia experiments, cells were cultured in a sealed incubator chamber with a ProOX C21 O2/CO2 controller (BioSpherix, USA). The hypoxic conditions consisted of 1% O2, 5% CO2, and 94% N2. The oxygen concentration was kept at 1% by continuous infusion of N2. Reagents used in this paper were as follows: Carbonyl cyanide 3‐chlorophenylhydrazone (CCCP, Sigma‐Aldrich), azoxymethane (AOM, Sigma‐Aldrich), 2‐DG (Sigma‐Aldrich), dextran sulfate sodium (DSS, MP biomedicals), Lipofectamine 2000 and Opti‐MEM (Invitrogen), DMOG (Selleck), CoCl2 (Sinopharm Chemical Reagent Co.,Ltd), Rotenone (Sigma‐Aldrich), N‐Acetyl‐l‐cysteine (NAC, MedChemExpress), Mg132 (Sigma‐Aldrich), cycloheximide (CHX, Sigma‐Aldrich). Antibodies were used in this study: anti‐Flag (F1804) were obtained from Sigma‐Aldrich; anti‐OMA1 (H‐11), anti‐GFP (SC‐9996), and anti‐MYC (SC‐40) were obtained from Santa Cruz Biotechnology; anti‐NDUFA4 (AP20519b) were obtained from Abgent; anti‐Yme1L (11510‐1‐AP), anti‐NUDFB6 (16037‐1‐AP), anti‐NUDFB8 (14794‐1‐AP), anti‐COX4L1 (11242‐1‐AP), anti‐SDHA (14865‐1‐AP), anti‐MT‐CO2 (55070‐1‐AP), anti‐UQCRC2 (14742‐1‐AP), anti‐ATP5A1 (14676‐1‐AP), anti‐HK2 (22029‐1‐AP), anti‐PKM2 (15822‐1‐AP), anti‐LDHA (19987‐1‐AP), and anti‐GPI (15171‐1‐AP) were obtained from Proteintech; anti‐OPA1 (612607) and anti‐HIF‐1α (610909) were obtained from BD Biosciences; anti‐NDUFB5 (GTX111880) were obtained from Gene Tex; anti‐β‐Tubulin (GNI4110‐BT) and anti‐β‐Actin (GNI4110‐BA) were obtained from GNI.
Plasmids and RNA interference
Mouse OMA1 cDNA and its mutants were cloned into pMSCV‐puro vector with a C‐terminal 3 × Flag tag. NDUFB5‐MYC, NDUFB6‐GFP, COX4L1‐GFP, and NDUFA4‐GFP were cloned into pHAGE‐puro or pEGFP‐N3 vector. shRNA against OMA1, OPA1, NDUFB5, NDUFB6, COX4L1, or HIF‐1α was performed using a modified retroviral vector with the H1 promoter. The following target sequences for gene knockdown were:
5′‐GAAGTGCTTTGTCATCTAA‐3′ for human shOMA1;
5′‐GTTATCAGTCTGAGCCAGGTT‐3′ for human shOPA1;
5′‐CACCGCGCTCGTTATCATG‐3′ for human shCOX4L1;
5′‐GGAACTTATTGATCATTCT‐3′ for human shNDUFB5‐1;
5′‐GATGGACCCTGGTATTACT‐3′ for human shNDUFB5‐2;
5′‐GACTGGAGAAGTAATTCCA‐3′ for human shNDUFB6;
5′‐CCAGTTATGATTGTGAAGTTA‐3′ for human shHIF‐1α‐1;
5′‐GTGATGAAAGAATTACCGAAT‐3′ for human shHIF‐1α‐2.
Generation of knockout cells
HCT116 cells lacking OMA1, OPA1, or NDUFA4 were generated by CRISPR/Cas9 gene editing, as described previously (Tang et al, 2020). Briefly, sgRNA sequences were selected using the MIT CRISPR design tool (http://crispr.mit.edu/) and cloned into LentiCRISPR plasmid (Addgene 49535). The following guide sequences were used:
5′‐ACATTAGCATCCACCTCACG‐3′ for human OMA1;
5′‐GCGACTACGTCGGGCCGCTG‐3′ for human OPA1;
5′‐AACACTGTATCTCTTGCGTC‐3′ for human NDUFA4;
5′‐TGTCCAAGTGTTGGCCCCCG‐3′ for human YME1L.
Lentivirus was produced by transfecting LentiCRISPR with plasmids psPAX2 and VSV‐G in 293T cells. The medium containing lentiviral particles was collected and used for infecting HCT116 cells with 5 μg/ml polybrene (Sigma‐Aldrich). Twenty hours later, the medium was aspirated and replaced with fresh medium containing 2 μg/ml puromycin to select and establish stably transfected cells. Then, the single cells were sorted into 96‐well dishes for the screen of knockout lines. The surviving clones were expanded, selected, and analyzed by Western blotting. The genomic region flanking the targeting sequence was amplified by PCR and subjected to DNA sequencing.
Mice
Oma1 −/− mice on the C57BL/6 background were generated by the CRISPR/Cas9 method. Oma1 −/− mice bearing a 620 bp deletion in its exon‐3 were identified using primers flanking the break sites. The sequences of the primers are 5′‐AAGGTGTTAGAAAGAGCACAC‐3′ (forward), and 5′‐CTCACGCTGTCTTTAAATAGC‐3′ (reverse). All mice were housed under specific pathogen‐free conditions at the animal facilities of Wuhan University College of Life Sciences. 12–14 weeks old, age‐ and sex‐matched mice were used in all the experiments. All mouse studies were approved by the Animal Care Committees of Wuhan University College of Life Sciences.
Induction of colorectal cancer
To induce colorectal cancer model, WT and Oma1 −/− male mice (12–14 weeks old) were injected intraperitoneally with AOM (10 mg/kg) on day 0 (n = 11/12, each group). After 7 days, 1.5% DSS was added to the drinking water for 5/7 consecutive days. Three cycles of DSS treatment were used. After the induction of tumorigenesis, mice were euthanized on day 105. And all colon tissues, tumors, and serum were collected on day 105. After mice were euthanized, colons were removed and were flushed with cold PBS. Tumor numbers, tumor size, and total tumor mass (tumor load) were measured for each mouse. All experiments were repeated with three independent biological replicates.
Xenograft tumor growth analysis
For the xenograft experiments, colorectal cancer cells (5 × 10⁶ HCT116 cells) were injected subcutaneously into the axillae of 6‐ to 8‐week‐old male BALB/c nude mouse to establish the colorectal cancer xenograft model. Six days after subcutaneous inoculation, the width and length of superficial tumors were measured with a caliper at the indicated time intervals, and tumor volume was calculated according to the formula volume = width2 × length/2. After 16 days, xenograft tumors were harvested, and processed for Western blotting or ultrastructure analysis.
Quantitative real‐time PCR analysis
RNA from cells or tissues was extracted using TRIzol (Life Technologies) followed by DNase (Promega) treatment. And the cDNA was synthesized using the RevertAid Synthesis Kit (Thermo Scientific) according to the manufacturer’s instructions. Then, the cDNA samples were used as templates for quantitative real‐time quantitative PCR analysis by using SYBR Green Supermix (Roche) and the iCycler real‐time PCR Detection System (Bio‐Rad). The fold change of target mRNA expression was calculated using the 2−ΔΔ C T method. The β‐ACTIN or Gapdh housekeeping gene was used for normalization. The primers used in this study were as followed:
human GLUT1: forward, 5′‐ATTGGCTCCGGTATCGTCAAC‐3′,
and reverse, 5ʹ‐GCTCAGATAGGACATCCAGGGTA‐3′;
human OPA1: forward, 5′‐TGTGATTGAAAACATCTACCTTCCA‐3′,
and reverse, 5ʹ‐TTTAAGCTTGATATCCACTGTGGTGT‐3′;
human OMA1: forward, 5′‐TACTTCTCCACGGTTTCAAGC‐3′,
and reverse, 5′‐GATTGGACTTACTTCCAGGTGAG‐3′;
human YME1L: forward, 5′‐TTTAGGGAAGCAAAGGCGAAT‐3′,
and reverse, 5′‐CCTCTGGGAAGTTTGTGGCT‐3′;
human β‐ACTIN: forward, 5′‐GGCATGGGTCAGAAGGATT‐3′,
and reverse, 5ʹ‐CCACACGCAGCTCATTGTA‐3′.
mouse Gapdh: forward, 5′‐ACGGCCGCATCTTCTTGTGCA‐3′,
and reverse, 5′‐ACGGCCAAATCCGTTCACACC‐3′.
mouse Tnfα: forward, 5′‐GGTGCCTATGTCTCAGCCTCTT‐3′,
and reverse, 5′‐GCCATAGAACTGATGAGAGGGAG‐3′.
mouse Il6: forward, 5′‐TGATGCACTTGCAGAAAACA‐3′,
and reverse, 5′‐ACCAGAGGAAATTTTCAATAGGC‐3′.
mouse Cox2: forward, 5′‐GATGCTCTTCCGAGCTGTG‐3′,
and reverse, 5′‐GGATTGGAACAGCAAGGATTT‐3′.
mouse Ccl2: forward, 5′‐TTAAAAACCTGGATCGGAACCAA‐3′,
and reverse, 5′‐GCATTAGCTTCAGATTTACGGGT‐3′.
Western blotting and co‐immunoprecipitations
Western blotting and co‐immunoprecipitation (co‐IP) analysis were performed as previously described (Li et al, 2016). In brief, cells were lysed with RIPA buffer (50 mM Tris–HCl, 150 mM NaCl, 1% NP‐40 (Sigma‐Aldrich), 0.5% sodium deoxycholate (Sigma‐Aldrich), 1 mM EDTA (Sigma‐Aldrich), 0.1% SDS (Sigma‐Aldrich) and complete protease inhibitor (Roche). The proteins were loaded onto an SDS–polyacrylamide gel, separated by electrophoresis, and blotted onto a PVDF membrane (Merck Millipore). For the co‐IP, all steps were performed at 4°C, cells were solubilized with IP buffer (150 mM NaCl, 10% glycerol, 20 mM Tris–HCl pH = 7.4, 2 mM EDTA, 0.5% NP‐40, 0.5% Triton X‐100 and protease inhibitor mixture) for 1 h. The lysates were centrifuged at 12,000 × g for 15 min and the supernatant were subsequently incubated with anti‐Flag M2 affinity gel (Sigma‐Aldrich; A2220) with antibody at 4°C overnight. The affinity gel was washed five times with lysis buffer, and then, the proteins were recovered by boiling the beads in sample buffer and analyzed by Western blotting.
Measurement of ECAR
The extracellular acidification rate (ECAR) of cells were measured with a Seahorse Extracellular Flux Analyzer XF96 (Seahorse Bioscience), according to the manufacturer’s instructions. In brief, HCT116 cells were seeded in an XF96‐well plate at a density of 1.5 × 10⁴ per well and allowed to attach overnight. Next, cells were treated with or without 1 mM DMOG in fresh medium for 12 h. Before running the assay, cells were incubated with the unbuffered medium in a CO2‐free incubator at 37°C for 1 h. For detection of the real‐time glycolytic rate (ECAR), additional automated measurements were performed after a sequential injection of 10 mM glucose, 1 µM oligomycin, and 50 mM 2‐deoxy‐glucose. ECAR measurements were reported as mpH/min.
Measurement of ATP production
Cellular ATP levels were measured using an ATP assay kit (Celltiter‐Glo Luminescent Cell Viability Assay, Promega) according to the manufacturer’s instructions. Briefly, cells were maintained in 96‐well plates in normoxia or hypoxia for the indicated periods. Whole cell lysates were generated using the luciferase reporter lysis buffer. Luminescence was measured using the microplate reader and the values were normalized to the protein concentration.
ROS measurement
Intracellular ROS was detected by MitoSOX™ Red (Invitrogen) according to the manufacturer’s instructions. Briefly, cells were incubated with 5 uM MitoSOX with Hank’s balanced salt solution at 37°C for 25 min and then washed cells 3 times with HBSS solution with Ca2+ and Mg2+ (1.26 mM CaCl2, 0.5 mM MgCl2, 0.4 mM MgSO4, 5.33 mM KCl, 0.44 mM KH2PO4, 4.16 mM NaHCO3, 138 mM NaCl, 0.34 mM Na2HPO4, and 5.56 mM D‐Glucose). The fluorescence was measured qualitatively by confocal microscopy under excitation at 510 nm, and the emission was collected at 580 nm. The fluorescence intensity was analyzed using ImageJ software.
For the measurement of ROS in tumors or adjacent normal tissues, optimum cutting temperature (OCT) covered tissues were cut in 8 μm sections. Slides were incubated at 37°C in dihydroethidium (DHE) (1:200; Servicebio) for 30 min. Buffer containing DAPI (Servicebio) was used as counter stain. Slides were washed three times with PBS. The fluorescence intensity was analyzed by using ImageJ software.
Cell proliferation and glucose‐dependent cell death assay
Cell proliferation was measured using a Cell Counting Kit (CCK‐8) according to the manufacturer’s instructions. The absorbance of control and knockout cells under normoxia or hypoxia was measured with the microplate reader at 450 nm. For the Glucose‐Dependent Cell Death Assay, cells were cultured with no‐glucose DMEM + 10% FBS + galactose (4.5 g/l) or DMEM + 10% FBS + 2‐Deoxy‐D‐glucose (2‐DG, 10 mM) for 24 h or 48 h, and live/dead cells were quantified by cell counting with trypan blue exclusion. Cells were counted by the hemacytometer.
Metabolite measurements
The extracellular lactate in the media of cultured cells was measured using the lactate colorimetric/fluorometric assay kit (BioVison) according to the manufacturer’s protocol. In brief, cells were maintained in 12‐well plates with fresh medium in normoxia or hypoxia for 24 h, and the culture medium was centrifuged to remove insoluble material. Then, the supernatant was kept at −80°C for storage to deactivate the lactate dehydrogenase. Before running the assay, the reaction was incubated for 30 min at room temperature. Absorbance (OD 570 nm) or fluorescence (Ex/Em = 535/587 nm) was measured using the microplate reader and the values were normalized to the protein concentration.
The intracellular glucose uptake was measured in the cell lysates using the glucose uptake fluorometric assay kit (BioVision) according to the manufacturer’s instruction. In brief, cells were cultured with serum‐free DMEM in normoxia or hypoxia for 24 h and then incubated with KRPH buffer (20 mM HEPES, 5 mM KH2PO4, 1 mM MgSO4, 1 mM CaCl2, 136 mM NaCl, 4.7 mM KCl, pH 7.4) containing 2% BSA for 40 min. Then, cells were stimulated with or without insulin (1 μM) for 20 min and added 10 mM 2‐DG for 20 min. The cell lysates with the reaction mix were incubated for 40 min at 37°C. The fluorescence was measured qualitatively by microplate reader under excitation at 510 nm, and the emission was collected at 580 nm. The values were normalized to the protein concentration.
Electron microscopy
For ultrastructural analysis, mouse tissues were excised and fixed with 4.0% formaldehyde in 100 mM phosphate buffer (PB, pH = 7.4) for 0.5 h, and 2% glutaraldehyde for 1.5 h. After washing for three times in PB buffer, samples were postfixed with 2% osmium tetroxide (OsO4) for 1 h on ice, protected from light. Then, the pellets were dehydrated with graded series of cold ethanol (30, 50, 70, 80, 95, and 100%). After washed three times in epoxypropane, the samples were infiltrated sequentially in 1:1 (v:v) epoxypropane/epoxy resin (4 h), 1:2 (v:v) epoxypropane/epoxy resin (overnight), 100% fresh epoxy resin (4 h), and finally 100% fresh epoxy resin (48 h) at 60°C for polymerization. The ultrathin sections on copper grids were poststained in Sato lead, Sodium citrate for 1 min and observed using a JEM‐1400 plus electron microscope operated at 100 kV.
Isolation of mitochondria and BN‐PAGE analysis
Homogenization of cells or tissues and solubilization of mitochondria for BN‐PAGE were performed according to the protocol (Wittig et al, 2006). Briefly, cells were maintained in 10‐mm plates with fresh medium in normoxia or hypoxia for 24 h. Then, cells were collected and re‐suspended in cell homogenization buffer (83 mM sucrose, 6.6 mM imidazole/HCl, pH 7.0) and then ultrasonic disrupt cell membranes on ice. To isolate the mitochondria of tissue, a dounce homogenizer was used with the buffer (250 mM sucrose, 20 mM Imidazole, pH 7.0). And then, homogenate was centrifuged for 10 min at 700 g and the supernatant subsequently was centrifuged for 10 min at 10,000 g to collect the pellet. Isolated mitochondrial were re‐suspended in solubilization buffer A (50 mM sodium chloride, 50 mM Imidazole/HCL, 2 mM 6‐aminohexanoic acid, and 1 mM EDTA, pH = 7.0) on ice and 4% digitonin was added for 13 min. The samples were centrifuged for 10 min at 10,000 g to collect the supernatant. Then, the samples were separated on 4–13% blue native polyacrylamide gels (BN‐PAGE). The native proteins from BN gels were transferred to PVDF and immunoblotted with the anti‐NDUFB8, anti‐SDHA, anti‐COX4L1, anti‐MT‐CO2, and anti‐ATP5A antibodies, respectively.
Patient specimens
Colorectal cancer specimens and the adjacent normal tissues used in this study were collected from the First Affiliated Hospital of Anhui Medical University, with prior written informed consent. All the studies were carried out in accordance with the Declaration of Helsinki and approved by the institutional ethics review board.
Statistical analysis
Statistical analysis was performed using Prism 8 (GraphPad Software). Unless otherwise indicated, data were presented as the mean ± SD or ± SEM, and statistical significance was evaluated by unpaired Student’s t‐test. P < 0.05 was considered significant. *P < 0.05, **P < 0.01, ***P < 0.001, and N.S.: not significant. “n” represents number of biological replicates.
Author contributions
ZS and ZW conceived and designed the experimental approach. KC performed bioinformatics analysis. WH provided colorectal cancer specimens and clinical information. ZW, MZ LZ, BLi, and JD generated transgenic mice and constructed animal experiments. ZW, LZ, CY, FS, and JD conducted cellular and molecular experiments. ZW, CY, MZ, and LC performed the xenograft experiments. ZW and HH performed mass spectrometry analysis. ZW, BLu, and MZ analyzed data. ZS and ZW prepared the manuscript.
Conflict of interest
The authors declare that they have no conflict of interest.
Supporting information
Appendix
Expanded View Figures PDF
Review Process File
Acknowledgements
This work is supported by the Ministry of Science and Technology of the People’s Republic of China (2018YFA0800700), National Natural Science Foundation of China (91854107, 31970711, and 31671393), and the Fundamental Research Funds for the Central Universities.
EMBO Reports (2021) 22: e50827.
Data availability
This study includes no data deposited in external repositories.
References
- Acín‐Pérez R, Fernández‐Silva P, Peleato ML, Pérez‐Martos A, Enriquez JA (2008) Respiratory active mitochondrial supercomplexes. Mol Cell 32: 529–539 [DOI] [PubMed] [Google Scholar]
- Acin‐Perez R, Lechuga‐Vieco AV, Del Mar MM, Nieto‐Arellano R, Torroja C, Sánchez‐Cabo F, Jiménez C, González‐Guerra A, Carrascoso I, Benincá C et al (2018) Ablation of the stress protease OMA1 protects against heart failure in mice. Sci Transl Med 10: eaan4935 [DOI] [PubMed] [Google Scholar]
- Alavi MV (2019) Targeted OMA1 therapies for cancer. Int J Cancer 145: 2330–2341 [DOI] [PubMed] [Google Scholar]
- Amini MA, Karimi J, Khodadadi I, Tavilani H, Talebi SS, Afshar B (2019) Overexpression of ROMO1 and OMA1 are potentially biomarkers and predict unfavorable prognosis in gastric cancer. J Gastrointest Cancer 51: 939–946 [DOI] [PubMed] [Google Scholar]
- An HJ, Cho G, Lee JO, Paik SG, Kim YS, Lee H (2013) Higd‐1a interacts with Opa1 and is required for the morphological and functional integrity of mitochondria. Proc Natl Acad Sci USA 110: 13014–13019 [DOI] [PMC free article] [PubMed] [Google Scholar]
- Anand R, Wai T, Baker MJ, Kladt N, Schauss AC, Rugarli E, Langer T (2014) The i‐AAA protease YME1L and OMA1 cleave OPA1 to balance mitochondrial fusion and fission. J Cell Biol 204: 919–929 [DOI] [PMC free article] [PubMed] [Google Scholar]
- Arnold M, Sierra MS, Laversanne M, Soerjomataram I, Jemal A, Bray F (2017) Global patterns and trends in colorectal cancer incidence and mortality. Gut 66: 683–691 [DOI] [PubMed] [Google Scholar]
- Baba Y, Nosho K, Shima K, Irahara N, Chan AT, Meyerhardt JA, Chung DC, Giovannucci EL, Fuchs CS, Ogino S (2010) HIF1A overexpression is associated with poor prognosis in a cohort of 731 colorectal cancers. Am J Pathol 176: 2292–2301 [DOI] [PMC free article] [PubMed] [Google Scholar]
- Baker MJ, Lampe PA, Stojanovski D, Korwitz A, Anand R, Tatsuta T, Langer T (2014) Stress‐induced OMA1 activation and autocatalytic turnover regulate OPA1‐dependent mitochondrial dynamics. EMBO J 33: 578–593 [DOI] [PMC free article] [PubMed] [Google Scholar]
- Baker KT, Nachmanson D, Kumar S, Emond MJ, Ussakli C, Brentnall TA, Kennedy SR, Risques RA (2019) Mitochondrial DNA mutations are associated with ulcerative colitis preneoplasia but tend to be negatively selected in cancer. Mol Cancer Res 17: 488–498 [DOI] [PMC free article] [PubMed] [Google Scholar]
- Balamurugan K (2016) HIF‐1 at the crossroads of hypoxia, inflammation, and cancer. Int J Cancer 138: 1058–1066 [DOI] [PMC free article] [PubMed] [Google Scholar]
- Balsa E, Marco R, Perales‐Clemente E, Szklarczyk R, Calvo E, Landázuri MO, Enríquez JA (2012) NDUFA4 is a subunit of complex IV of the mammalian electron transport chain. Cell Metab 16: 378–386 [DOI] [PubMed] [Google Scholar]
- Biddlestone J, Bandarra D, Rocha S (2015) The role of hypoxia in inflammatory disease (Review). Int J Mol Med 35: 859–869 [DOI] [PMC free article] [PubMed] [Google Scholar]
- Bohovych I, Kastora S, Christianson S, Topil D, Kim H, Fangman T, Zhou YJ, Barrientos A, Lee J, Brown AJP et al (2016) Oma1 links mitochondrial protein quality control and TOR signaling to modulate physiological plasticity and cellular stress responses. Mol Cell Biol 36: 2300–2312 [DOI] [PMC free article] [PubMed] [Google Scholar]
- Böttinger L, Guiard B, Oeljeklaus S, Kulawiak B, Zufall N, Wiedemann N, Warscheid B, van der Laan M, Becker T (2013) A complex of Cox4 and mitochondrial Hsp70 plays an important role in the assembly of the cytochrome c oxidase. Mol Biol Cell 24: 2609–2619 [DOI] [PMC free article] [PubMed] [Google Scholar]
- Bray F, Ferlay J, Soerjomataram I, Siegel RL, Torre LA, Jemal A (2018) Global cancer statistics 2018: GLOBOCAN estimates of incidence and mortality worldwide for 36 cancers in 185 countries. CA Cancer J Clin 68: 394–424 [DOI] [PubMed] [Google Scholar]
- Clanton TL (2007) Hypoxia‐induced reactive oxygen species formation in skeletal muscle. J Appl Physiol 102: 2379–2388 [DOI] [PubMed] [Google Scholar]
- Cogliati S, Frezza C, Soriano ME, Varanita T, Quintana‐Cabrera R, Corrado M, Cipolat S, Costa V, Casarin A, Gomes LC et al (2013) Mitochondrial cristae shape determines respiratory chain supercomplexes assembly and respiratory efficiency. Cell 155: 160–171 [DOI] [PMC free article] [PubMed] [Google Scholar]
- Cogliati S, Enriquez JA, Scorrano L (2016) Mitochondrial cristae: where beauty meets functionality. Trends Biochem Sci 41: 261–273 [DOI] [PubMed] [Google Scholar]
- Cunningham KE, Vincent G, Sodhi CP, Novak EA, Ranganathan S, Egan CE, Stolz DB, Rogers MB, Firek B, Morowitz MJ et al (2016) Peroxisome Proliferator‐Activated Receptor‐γ Coactivator 1‐α (PGC1α) protects against experimental murine colitis. J Biol Chem 291: 10184–10200 [DOI] [PMC free article] [PubMed] [Google Scholar]
- Daverey A, Levytskyy RM, Stanke KM, Viana MP, Swenson S, Hayward SL, Narasimhan M, Khalimonchuk O, Kidambi S (2019) Depletion of mitochondrial protease OMA1 alters proliferative properties and promotes metastatic growth of breast cancer cells. Sci Rep 9: 14746 [DOI] [PMC free article] [PubMed] [Google Scholar]
- Denko NC (2008) Hypoxia, HIF1 and glucose metabolism in the solid tumour. Nat Rev Cancer 8: 705–713 [DOI] [PubMed] [Google Scholar]
- Ehses S, Raschke I, Mancuso G, Bernacchia A, Geimer S, Tondera D, Martinou J‐C, Westermann B, Rugarli EI, Langer T (2009) Regulation of OPA1 processing and mitochondrial fusion by m‐AAA protease isoenzymes and OMA1. J Cell Biol 187: 1023–1036 [DOI] [PMC free article] [PubMed] [Google Scholar]
- Fessler E, Eckl E‐M, Schmitt S, Mancilla IA, Meyer‐Bender MF, Hanf M, Philippou‐Massier J, Krebs S, Zischka H, Jae LT (2020) A pathway coordinated by DELE1 relays mitochondrial stress to the cytosol. Nature 579: 433–437 [DOI] [PMC free article] [PubMed] [Google Scholar]
- Frezza C, Cipolat S, Martins De Brito O, Micaroni M, Beznoussenko GV, Rudka T, Bartoli D, Polishuck RS, Danial NN, De Strooper B et al (2006) OPA1 controls apoptotic cristae remodeling independently from mitochondrial fusion. Cell 126: 177–189 [DOI] [PubMed] [Google Scholar]
- Fukuda R, Zhang H, Kim J‐w, Shimoda L, Dang CV, Semenza GL (2007) HIF‐1 regulates cytochrome oxidase subunits to optimize efficiency of respiration in hypoxic cells. Cell 129: 111–122 [DOI] [PubMed] [Google Scholar]
- Guo X, Aviles G, Liu Y, Tian R, Unger BA, Lin Y‐HT, Wiita AP, Xu K, Correia MA, Kampmann M (2020) Mitochondrial stress is relayed to the cytosol by an OMA1–DELE1–HRI pathway. Nature 579: 427–432 [DOI] [PMC free article] [PubMed] [Google Scholar]
- Harris AL (2002) Hypoxia–a key regulatory factor in tumour growth. Nat Rev Cancer 2: 38–47 [DOI] [PubMed] [Google Scholar]
- Heller S, Penrose HM, Cable C, Biswas D, Nakhoul H, Baddoo M, Flemington E, Crawford SE, Savkovic SD (2017) Reduced mitochondrial activity in colonocytes facilitates AMPKα2‐dependent inflammation. FASEB J 31: 2013–2025 [DOI] [PMC free article] [PubMed] [Google Scholar]
- Ioannou M, Paraskeva E, Baxevanidou K, Simos G, Papamichali R, Papacharalambous C, Samara M, Koukoulis G (2015) HIF‐1α in colorectal carcinoma: review of the literature. J BUON 20: 680 [PubMed] [Google Scholar]
- Jiang X, Jiang H, Shen Z, Wang X (2014) Activation of mitochondrial protease OMA1 by Bax and Bak promotes cytochrome c release during apoptosis. Proc Natl Acad Sci USA 111: 14782–14787 [DOI] [PMC free article] [PubMed] [Google Scholar]
- Käser M, Kambacheld M, Kisters‐Woike B, Langer T (2003) Oma1, a novel membrane‐bound metallopeptidase in mitochondria with activities overlapping with the m‐AAA protease. J Biol Chem 278: 46414–46423 [DOI] [PubMed] [Google Scholar]
- Korwitz A, Merkwirth C, Richter‐Dennerlein R, Tröder SE, Sprenger H‐G, Quirós PM, López‐Otín C, Rugarli EI, Langer T (2016) Loss of OMA1 delays neurodegeneration by preventing stress‐induced OPA1 processing in mitochondria. J Cell Biol 2: 157–166 [DOI] [PMC free article] [PubMed] [Google Scholar]
- Li H, Ruan Y, Zhang K, Jian F, Hu C, Miao L, Gong L, Sun L, Zhang X, Chen S et al (2016) Mic60/Mitofilin determines MICOS assembly essential for mitochondrial dynamics and mtDNA nucleoid organization. Cell Death Differ 23: 380–392 [DOI] [PMC free article] [PubMed] [Google Scholar]
- Liu Y, Fiskum G, Schubert D (2002) Generation of reactive oxygen species by the mitochondrial electron transport chain. J Neurochem 80: 780–787 [DOI] [PubMed] [Google Scholar]
- Loublier S, Bayot A, Rak M, El‐Khoury R, Bénit P, Rustin P (2011) The NDUFB6 subunit of the mitochondrial respiratory chain complex I is required for electron transfer activity: a proof of principle study on stable and controlled RNA interference in human cell lines. Biochem Biophys Res Comm 414: 367–372 [DOI] [PubMed] [Google Scholar]
- Lunt SY, Vander Heiden MG (2011) Aerobic glycolysis: meeting the metabolic requirements of cell proliferation. Annu Rev Cell Dev Biol 27: 441–464 [DOI] [PubMed] [Google Scholar]
- MacVicar T, Ohba Y, Nolte H, Mayer FC, Tatsuta T, Sprenger HG, Lindner B, Zhao Y, Li J, Bruns C et al (2019) Lipid signalling drives proteolytic rewiring of mitochondria by YME1L. Nature 575: 361–365 [DOI] [PubMed] [Google Scholar]
- Matthew GVH, Cantley LC, Thompson CB (2009) Understanding the warburg effect: the metabolic requirements of cell proliferation. Science 324: 1029–1033 [DOI] [PMC free article] [PubMed] [Google Scholar]
- Mishra P, Carelli V, Manfredi G, Chan DC (2014) Proteolytic cleavage of Opa1 stimulates mitochondrial inner membrane fusion and couples fusion to oxidative phosphorylation. Cell Metab 19: 630–641 [DOI] [PMC free article] [PubMed] [Google Scholar]
- Movafagh S, Crook S, Vo K (2015) Regulation of hypoxia‐inducible factor‐1a by reactive oxygen species: new developments in an old debate. J Cell Biochem 116: 696–703 [DOI] [PubMed] [Google Scholar]
- Niecknig H, Tug S, Reyes BD, Kirsch M, Fandrey J, Berchner‐Pfannschmidt U (2012) Role of reactive oxygen species in the regulation of HIF‐1 by prolyl hydroxylase 2 under mild hypoxia. Free Radical Res 46: 705–717 [DOI] [PubMed] [Google Scholar]
- Polyak K, Li Y, Zhu H, Lengauer C, Willson JK, Markowitz SD, Trush MA, Kinzler KW, Vogelstein B (1998) Somatic mutations of the mitochondrial genome in human colorectal tumours. Nat Genet 20: 291–293 [DOI] [PubMed] [Google Scholar]
- Quirós PM, Ramsay AJ, Sala D, Fernández‐Vizarra E, Rodríguez F, Peinado JR, Fernández‐García MS, Vega JA, Enríquez JA, Zorzano A et al (2012) Loss of mitochondrial protease OMA1 alters processing of the GTPase OPA1 and causes obesity and defective thermogenesis in mice. EMBO J 31: 2117–2133 [DOI] [PMC free article] [PubMed] [Google Scholar]
- Rainbolt TK, Lebeau J, Puchades C, Wiseman RL (2016) Reciprocal degradation of YME1L and OMA1 adapts mitochondrial proteolytic activity during stress. Cell Rep 14: 2041–2049 [DOI] [PMC free article] [PubMed] [Google Scholar]
- Sanchez‐Pino MJ, Moreno P, Navarro A (2007) Mitochondrial dysfunction in human colorectal cancer progression. Front Biosci 12: 1190–1199 [DOI] [PubMed] [Google Scholar]
- Semenza GL (2003) Targeting HIF‐1 for cancer therapy. Nat Rev Cancer 3: 721–732 [DOI] [PubMed] [Google Scholar]
- Semenza GL (2004) Intratumoral hypoxia, radiation resistance, and HIF‐1. Cancer Cell 5: 405–406 [DOI] [PubMed] [Google Scholar]
- Simula L, Corrado M, Accordi B, Di Rita A, Nazio F, Antonucci Y, Di Daniele A, Caicci F, Caruana I, Soriano ME et al (2020) JNK1 and ERK1/2 modulate lymphocyte homeostasis via BIM and DRP1 upon AICD induction. Cell Death Diff 27: 2749–2767 [DOI] [PMC free article] [PubMed] [Google Scholar]
- Solaini G, Baracca A, Lenaz G, Sgarbi G (2010) Hypoxia and mitochondrial oxidative metabolism. Biochem Biophys Acta 1797: 1171–1177 [DOI] [PubMed] [Google Scholar]
- Stroud DA, Surgenor EE, Formosa LE, Reljic B, Frazier AE, Dibley MG, Osellame LD, Stait T, Beilharz TH, Thorburn DR et al (2016) Accessory subunits are integral for assembly and function of human mitochondrial complex I. Nature 538: 123–126 [DOI] [PubMed] [Google Scholar]
- Tang J, Zhang K, Dong J, Yan C, Hu C, Ji H, Chen L, Chen S, Zhao H, Song Z (2020) Sam50–Mic19–Mic60 axis determines mitochondrial cristae architecture by mediating mitochondrial outer and inner membrane contact. Cell Death Differ 27: 146–160 [DOI] [PMC free article] [PubMed] [Google Scholar]
- Thaker AI, Shaker A, Rao MS, Ciorba MA (2012) Modeling colitis‐associated cancer with azoxymethane (AOM) and dextran sulfate sodium (DSS). J Vis Exp 67: 4100 [DOI] [PMC free article] [PubMed] [Google Scholar]
- Varanita T, Soriano ME, Romanello V, Zaglia T, Quintana‐Cabrera R, Semenzato M, Menabò R, Costa V, Civiletto G, Pesce P et al (2015) The Opa1‐dependent mitochondrial cristae remodeling pathway controls atrophic, apoptotic, and ischemic tissue damage. Cell Metab 21: 834–844 [DOI] [PMC free article] [PubMed] [Google Scholar]
- Vyas S, Zaganjor E, Haigis MC (2016) Mitochondria and cancer. Cell 166: 555–566 [DOI] [PMC free article] [PubMed] [Google Scholar]
- Wai T, Garcia‐Prieto J, Baker MJ, Merkwirth C, Benit P, Rustin P, Ruperez FJ, Barbas C, Ibanez B, Langer T (2015) Imbalanced OPA1 processing and mitochondrial fragmentation cause heart failure in mice. Science 350: aad0116 [DOI] [PubMed] [Google Scholar]
- Wallace DC (2012) Mitochondria and cancer. Nat Rev Cancer 12: 685–698 [DOI] [PMC free article] [PubMed] [Google Scholar]
- Wang GL, Semenza GL (1993) General involvement of hypoxia‐inducible factor 1 in transcriptional response to hypoxia. Proc Natl Acad Sci USA 90: 4304–4308 [DOI] [PMC free article] [PubMed] [Google Scholar]
- Warburg O (1956) On the origin of cancer cells. Science 123: 309–314 [DOI] [PubMed] [Google Scholar]
- Ward PS, Thompson CB (2012) Metabolic reprogramming: a cancer hallmark even warburg did not anticipate. Cancer Cell 21: 297–308 [DOI] [PMC free article] [PubMed] [Google Scholar]
- Wittig I, Braun HP, Schagger H (2006) Blue native PAGE. Nat Protoc 1: 418‐428 [DOI] [PubMed] [Google Scholar]
- Xiao X, Hu Y, Quirós PM, Wei Q, López‐Otín C, Dong Z (2014) OMA1 mediates OPA1 proteolysis and mitochondrial fragmentation in experimental models of ischemic kidney injury. Am J Physiol Renal Physiol 306: F1318–F1326 [DOI] [PMC free article] [PubMed] [Google Scholar]
- Xue X, Bredell BX, Anderson ER, Martin A, Mays C, Nagao‐Kitamoto H, Huang S, Győrffy B, Greenson JK, Hardiman K et al (2017) Quantitative proteomics identifies STEAP4 as a critical regulator of mitochondrial dysfunction linking inflammation and colon cancer. Proc Natl Acad Sci USA 114: E9608–E9617 [DOI] [PMC free article] [PubMed] [Google Scholar]
- Zanna C, Ghelli A, Porcelli AM, Karbowski M, Youle RJ, Schimpf S, Wissinger B, Pinti M, Cossarizza A, Vidoni S et al (2008) OPA1 mutations associated with dominant optic atrophy impair oxidative phosphorylation and mitochondrial fusion. Brain 131: 352–367 [DOI] [PubMed] [Google Scholar]
- Zhang K, Li H, Song Z (2014) Membrane depolarization activates the mitochondrial protease OMA1 by stimulating self‐cleavage. EMBO Rep 15: 576–585 [DOI] [PMC free article] [PubMed] [Google Scholar]
Associated Data
This section collects any data citations, data availability statements, or supplementary materials included in this article.
Supplementary Materials
Appendix
Expanded View Figures PDF
Review Process File
Data Availability Statement
This study includes no data deposited in external repositories.