

Abstract
Polyploidy can provide adaptive advantages and drive evolution. Amitotic division of the polyploid macronucleus (MAC) in ciliates acts as a nonsexual genetic mechanism to enhance adaptation to stress conditions and thus provides a unique model to investigate the evolutionary role of polyploidy. Mutation is the primary source of the variation responsible for evolution and adaptation; however, to date, de novo mutations that occur in ciliate MAC genomes during these processes have not been characterized and their biological impacts are undefined. Here, we carried out long-term evolution experiments to directly explore de novo MAC mutations and their molecular features in the model ciliate, Tetrahymena thermophila. A simple but effective method was established to detect base-substitution mutations in evolving populations whereas filtering out most of the false positive base-substitutions caused by repetitive sequences and the programmed genome rearrangements. The detected mutations were rigorously validated using the MassARRAY system. Validated mutations showed a strong G/C→A/T bias, consistent with observations in other species. Moreover, a progressive increase in growth rate of the evolving populations suggested that some of these mutations might be responsible for cell fitness. The established mutation identification and validation methods will be an invaluable resource to make ciliates an important model system to study the role of polyploidy in evolution.
Keywords: ciliated protozoa, polyploidy, somatic mutation, genome evolution, MassARRAY
Significance
Mutation is the ultimate source of the genetic variation responsible for evolution and adaptation; however, the characteristics of de novo mutations in the polyploid MAC genomes of ciliates have not yet been determined. This study represents the first attempt to explore de novo MAC mutations in the model ciliate Tetrahymena thermophila, using the sensitive MassARRAY system to validate low frequency mutations. We found that MAC mutations show a strong G/C→A/T bias and that some of these mutations may be responsible for the increased fitness of evolved populations.
Introduction
Polyploidization is common strategy for adaptation to numerous environmental stresses that are not well tolerated in the diploid state in diverse organisms (Schoenfelder and Fox 2015; Van De Peer et al. 2017). For example, polyploidization often occurs as an adaptation to injury in both invertebrates and mammals (Duncan et al. 2012; Losick et al. 2013). Polyploid state also drives evolution by allowing cells to accumulate gross genomic mutations that would otherwise be lethal. Ciliates are a large group of unicellular eukaryotes characterized by nuclear dimorphism: Each cell contains a germline diploid micronucleus (MIC) and a somatic polyploid macronucleus (MAC) (Prescott 1994). During sexual conjugation, the MAC genome develops from the MIC genome and undergoes massive rearrangements. During asexual growth, the MIC is transcriptionally silent and divides by mitosis; in contrast, the MAC is actively expressed and divides by amitosis. Amitosis is an imprecise mechanism that enables the differential partitioning of chromosomes, which generates variation among individuals in the number of alleles at a given locus. This mechanism can facilitate selection to favor those individuals harboring more beneficial alleles and accelerate ciliate adaptation to stress conditions. Therefore, the ciliate MAC is a unique model to study the role of polyploidy in evolution and adaptation.
The model ciliate, Tetrahymena thermophila, contains an average of 45 copies per cell of each MAC chromosome (Doerder and Debault 1975; Doerder et al. 1992), and both its MIC and MAC genomes have been sequenced (Eisen et al. 2006; Hamilton et al. 2016). Most ciliates undergo senescence in culture in the absence of periodic sex. In contrast, clonal populations of T. thermophila can be maintained in culture for decades without loss of vigor (Weindruch and Doerder 1975), which enables the accumulation of extremely rare mutational events in the MAC genome. Tetrahymena thermophila is therefore a suitable model to study the nature of MAC mutations that accumulate during long-term experimental evolution (Barrick and Lenski 2013; Lynch et al. 2016). In addition, in amicronucleate Tetrahymena species (which may have evolved millions of years ago [Doerder 2014; Xiong et al. 2019]), detecting MAC mutations and tracking their evolutionary dynamics may reveal how these species can persist in the absence of sex. Moreover, comparison of the accumulated MAC mutations in different Tetrahymena species (i.e., with or without MICs) can provide an important insight into the evolution of soma-germ line differentiation (Brito et al. 2010).
As mutation is the primary source of all variation (both beneficial and deleterious), knowledge of its molecular features and phenotypic effects is the basis for understanding the evolutionary process. However, a de novo mutation is expected to occur in only one of the many copies of the MAC chromosome within a cell and any methodology to reliably identify such a rare allele by whole-genome sequencing (WGS) has not been established in ciliates. Therefore, the nature and biological impact of de novo mutations in the MAC genome have been poorly explored. To make ciliates a useful model to study the role of polyploidy in evolution, in this study, we aimed to identify and characterize de novo MAC mutations by establishing an optimized computational pipeline and a method to validate detected mutations.
Materials and Methods
Strains and Experimental Evolution
Cells used for evolution experiments were derived from a common ancestor cell homozygous in both MAC and MIC genomes that was generated by genomic exclusion crosses (Allen 1963) between T. thermophila strains SB210 and B* VII (obtained from the Tetrahymena Stock Center at Cornell University). After progeny cells of the genomic exclusion crosses had been grown for ∼60 cell divisions, a single cell was isolated for use as the ancestor cell. Evolution experiments were initiated when the ancestor cell had undergone ∼20 cell divisions in culture to form the ancestor population. Thus, mutations from DNA replication errors in the ancestor population can be ignored, in accordance with previous reports (Long et al. 2013). Two subpopulations (populations A and B), each containing ∼40,000 cells, were isolated from the ancestor cell population and grown asexually for 1,000 cell divisions by daily passage of ∼40,000 cells into 5 ml fresh super proteose peptone medium (Gorovsky et al. 1975) for ∼200 days. Prior to each transfer, cell density after 24 h of culture was measured using a Beckman Coulter (San Diego, CA) and the number of cell divisions between passages was calculated as approximately five cell divisions per day. During the experiment, we also calculated the change in fitness (defined as the growth rate) using the formula (Kishimoto et al. 2010): . Growth rate data were pooled into 100-generation intervals (generation 100 = 0–100, generation 200 = 100–200, etc.) and the mean growth rate within each interval (∼20 data points) was calculated for each population. In addition, cells from each evolving population were cryopreserved in liquid nitrogen (Cassidy-Hanley 2012) every 100 generations.
DNA Isolation and WGS
MACs were purified from the ancestral clonal population at the start of the experiment and from populations A and B at generation 1,000 by differential sedimentation, and DNA was extracted as previously described (Gorovsky et al. 1975). To avoid possible changes in the genetic structure of populations resulting from long-term storage, MAC samples were regularly collected from each population during experimental evolution. To obtain enough MACs for DNA isolation, ∼40,000 cells from each population were added to 500-ml fresh super proteose peptone medium and cultured until a cell density of 4 × 10⁵ cells/ml was reached. DNA libraries with an insert size of ∼300 bp were prepared using a TruSeq Nano DNA Library Prep Kit (Illumina, San Diego, CA) according to the manufacturer’s protocol and then sequenced with 2 × 150 bp paired-end reads on a HiSeq X instrument (Illumina, San Diego, CA). The raw sequencing data for each population were ∼10 Gb.
Data Processing and De Novo Base-Substitution Mutation Detection
Raw sequencing reads were adapter and quality trimmed using Trim Galore V0.4.1 (http://www.bioinformatics.babraham.ac.uk/projects/trim_galore) with default parameters. Trimmed reads were then mapped to the MAC reference genome (Eisen et al. 2006) using novoalign V3.09.00 (http://www.novocraft.com/products/novoalign). To reduce false positive sequencing artifacts, library amplification errors and read mismapping, only uniquely mapped reads with a mapping/sequencing quality score at least 30 were used. PCR duplicate reads were marked using Picard V1.114 (http://broadinstitute.github.io/picard) and removed using Samtools V1.4 (Li et al. 2009). After processing, the mean sequencing depth was ∼60× (supplementary fig. S1, Supplementary Material online).
To detect mutations, mapped data from all three sequenced populations were merged (total depth of ∼180×) and “Samtools mpileup” was used to determine the coverage of each base type at each genomic site. Nonreference mutant bases were required to be supported by at least three reads and were regarded as putative de novo mutations when they occurred in only one of the progeny populations. Therefore, this pipeline enabled us to detect MAC mutations occurring at frequencies of as low as ∼5%. The frequency of each mutation was defined as the ratio of mutant reads to the total number of reads at the respective mutation site. Putative indels were identified in the same way, except that only two reads were required to support them because the indel error rate is much lower than the mismatch rate in Illumina sequencing (Huse et al. 2007; Dohm et al. 2008).
Identification of Genome-Wide Repetitive Sequences
To identify repetitive sequences at the genome-wide level, the MAC genome sequences were divided into 300-bp overlapping bins (equal to the DNA library size) with a 30-bp step size. The bins were then aligned to the MAC reference genome using BLAST (Altschul et al. 1990). Bins with more than one hit with an identity of ≥95% and coverage of ≥90% were regarded as repetitive sequences and merged. In this way, we identified 8.5 Mb MAC repetitive sequences. Since the ancestor cell we used may have inherited different repetitive sequences from the MIC genome during genomic exclusion, we also aligned all bins to the MIC reference genome and obtained an additional 0.4-Mb repetitive sequence. Therefore, a total of 8.9-Mb repetitive sequences were used for the analysis.
Validation of Putative Mutations
All putative de novo mutations were tested by both Sanger sequencing and the MassARRAY system (Agena Bioscience, San Diego, CA). For assays with the MassARRAY system, PCR amplification and single base extension primers for each mutation were designed using Assay Design Suite software (Agena Bioscience), and PCR amplification and single base extension reactions were performed using reagents supplied in the iPLEX Gold reagent kit (Agena Bioscience). To evaluate background noise, PCR reactions containing no template DNA were also performed. MassARRAY data were analyzed using a Typer Analyzer (Agena Bioscience), which facilitates visualization of the raw spectra and determines the degree of confidence for wild-type and mutant peak signals. A true mutant was defined as having a peak probability of at least 0.95. For assays with Sanger sequencing, the same PCR amplification primers for MassARRAY assays were used. The Sanger sequencing chromatograms were visualized using Chromas V2.6.6 (https://technelysium.com.au/wp/). The presence or absence of a mutation was determined manually by whether there is a mutant peak at the target site.
Annotation of Mutations
The functional annotation of validated mutations was performed using SnpEff (Cingolani et al. 2012) and the June 2014 release of the T. thermophila macronuclear genome annotation file from the Tetrahymena Genome Database (Stover 2006).
Results
Identification of De Novo Mutations in the MAC Genome
To explore accumulated mutations in the MAC genome, T. thermophila populations A and B (derived from a single whole-genome homozygous ancestor cell) were grown for ∼1,000 asexual divisions. Then, the MACs of the ancestor and the two evolved cell populations were purified and the sequences obtained by short-read high-throughput sequencing were mapped to the reference MAC genome sequence. In this study, we focused on base substitutions because it is difficult to distinguish insertion–deletion mutations (indels) from indels caused by imprecise IESs eliminations (Hamilton et al. 2016).
The initial pipeline we developed identified a total of 64,313 base substitutions in the sequencing data supported by at least three reads. As the ancestor cell was generated by a genomic exclusion cross, genetic variation in the ancestor cell population should be neglectable. However, we found that 92.6% of base substitutions (n = 59,538) were also detected in the ancestor population. In addition, frequency distributions of the base substitutions were similar in all three populations were (fig. 1). Furthermore, as the average sequencing error rate in this study was estimated at 2.5 × 10⁻⁴ (based on the average Phred score), at most only ∼1,500 of the base substitutions could have resulted from sequencing errors. Thus, we suspect that most of the detected base substitutions were caused by systematic errors or other variables rather than by DNA replication errors.
Fig. 1.

Overlapping and frequency distribution of the initially identified base substitutions in ancestor and progeny populations. (A) Overlapping distribution of the identified base substitutions in the ancestor and progeny populations. (B) Similar frequency distributions of the identified base substitutions in the ancestor and progeny populations.
Closer inspection revealed that many of the detected base substitutions were located in at least one of the following contexts (fig. 2): occurring 1) as clusters in which distances between two adjacent mutations are mostly within 50 bp; 2) in close proximity to detected indels; or 3) within or near repetitive sequences. All three of these sequence contexts were reported to be associated with false positives (Li 2014; Yu et al. 2014; Hamilton et al. 2016). We predicted that mutations occurring as clusters or near indels were caused by imprecise excision of internal eliminated sequences (IESs) in the newly developing MAC during conjugation and those located in or near to repetitive sequences were caused by mapping errors due to repetitive sequences, as observed in other systems (Shen et al. 2010; Li 2014).
Fig. 2.

False positive mutations were found in three sequence contexts. False positives tended to occur in clusters (A) or close to indels (B) and repetitive sequences (C). Note that false positives located within repetitive sequences (46,492 mutations) are not shown in panel C. nt, nucleotide. Red lines represent locally estimated scatterplot smoothing (LOESS) fits to the data using R 3.4.1 (http://www.r-project.org/; last accessed July 8, 2017).
Therefore, we optimized the pipeline by adding a filter step to exclude potential false positives if the distance between a base substitution and the nearest mutation, indel, or repetitive sequence were <50, <300, or <600 bp, respectively. This led to the removal of 99.8% base substitutions (n = 64,195), most of which fell into two or three of the above-mentioned sequence contexts (fig. 3A). Accordingly, a total of 15-Mb sequences (14.6% of the reference genome) were excluded from further de novo mutation analysis, including clustered mutation sites, indel sites (with 300-bp flanking sequences), and repetitive sequences (with 600-bp flanking sequences); 31.6% of the excluded sequences were in coding regions, compared with 52.3% of the analyzed sequences. After filtering, 62 mutations were still present in the ancestor population (fig. 3B). By visually inspecting each mutation using Integrative Genomics Viewer (Thorvaldsdóttir et al. 2012), we found that additional mutations were present in the 50-bp flanking regions of 82% of mutations and in the 100-bp flanking regions of all mutations. Because the flanking mutations were supported by only one or two reads and were not identified in the initial pipeline, the group of 62 mutations could not be discarded based on distance from an adjacent mutation. In addition, we found that most of the 62 mutations were present at very low frequencies (supplementary fig. S2, Supplementary Material online). Therefore, we speculate that unfiltered mutations in the ancestor population are false positives caused by the three aforementioned sequence contexts or sequencing errors rather than by replication errors. Of the remaining 56 base substitutions, 29 and 23 were specific for the population A and B, respectively, and considered putative de novo mutations (fig. 3B).
Fig. 3.

Screening of putative de novo mutations. (A) Overlapping distribution between the three different sequence contexts of false positive mutations. (B) Overlapping distribution between screened mutations in the ancestor and progeny populations. Specific mutations in the two progeny populations were considered to be putative de novo mutations that had accumulated over the 1,000 asexual divisions.
MassARRAY Can Reliably Validate Base Substitutions Detected by WGS
All putative mutations were validated using the MassARRAY system, which consists of an initial locus-specific PCR reaction followed by single base extension using mass-modified dideoxynucleotide terminators, leading to different amplicon masses (depending on the mutational status) that are detected by mass spectrometry (supplementary fig. S3, Supplementary Material online) (Gabriel et al. 2009). Several reports indicate that the MassARRAY system has a detection limit of 1–5% mutant alleles (Fumagalli et al. 2010; Kriegsmann et al. 2015), which is below the minimum detection level of our newly developed mutation identification pipeline (see Materials and Methods). Therefore, we consider the sensitivity of the MassARRAY system sufficient to rigorously validate the putative de novo mutations.
Using the MassARRAY system, 16 de novo mutations were confirmed in population A and nine in population B (fig. 4A; supplementary table S1, Supplementary Material online). Of the remaining 27 putative mutations, nine were also detected in the ancestor cell with the MassARRAY system, suggesting that these represented genetic variations within the ancestor cell. Another three were likely to be caused by technical errors because they were also detected in the negative control. The other 15 were classified as low confidence mutations (peak probability <0.6) by the MassARRAY system. Although these might be de novo mutations, we excluded them from further investigations.
Fig. 4.

Validation of putative de novo mutations in the two evolving populations. (A) Overlapping distribution of mutations validated by Sanger sequencing and the MassARRAY system. (B) Frequency distribution of all validated mutations.
We further examined all the putative mutations by Sanger sequencing. We failed to detect most of the mutations that showed lower frequency (<0.2; according to WGS data) and were confirmed by the MassARRAY system; in contrast, all of the mutations with higher frequency (>0.2) and confirmed by the MassARRAY system were also confirmed by Sanger sequencing (fig. 4B). In addition, no specific mutations confirmed by Sanger sequencing were found (fig. 4A). Therefore, we conclude that the MassARRAY system can reliably confirm de novo mutations detected by WGS and is more sensitive than Sanger sequencing.
Distribution and Molecular Features of MAC Mutations
We further investigated the 25 de novo mutations confirmed by the MassARRAY system. The validated mutations were widely distributed across the whole genome on different scaffolds (supplementary table S1, Supplementary Material online). Of these, 21 mutations occurred in coding regions; this was significantly different from the random expectation based on the overall genome composition (χ2 test, P = 0.0016, 1 df). We postulate that the significant bias of mutation sites toward coding regions can be explained by the fact that transcription generally enhances mutagenesis (Kim and Jinks-Robertson 2012).
Further inspection revealed that the accumulated mutations comprised 2.8 times more G/C→A/T than A/T→G/C base substitutions (table 1). Given the high A/T genome composition (78%) in this species, this suggests that G/C→A/T base substitutions are ∼10 times more frequent per target site compared with A/T→G/C base substitutions. This mutational bias is consistent with observations in other species (Long et al. 2018). However, the spectrum of mutations might also have been influenced by selection during experimental evolution. To investigate this possibility, we compared low-frequency mutations (<0.1) at generation 1,000, which are likely to be neutral or nearly neutral, with all mutations and found no significant difference between the two data sets (χ2 test, P = 0.82, 1 df). Therefore, we conclude that the T. thermophila MAC genome exhibits a strong G/C→A/T mutational bias. Moreover, classification of both the 59,538 mutations filtered based on sequence context and the unfiltered 62 mutations in the ancestor population differed significantly from that of the confirmed mutations (shown in table 1; χ2 test, P = 0.00049 and P = 0.015, respectively, 5 df), further supporting the suggestion that these mutations were not replication errors.
Table 1.
Classification of Base-Substitution Mutations in the Two Evolving Populations
| Transitions |
Transversions |
|||||
|---|---|---|---|---|---|---|
| A:T → G:C | G:C → A:T | A:T → T:A | G:C → T:A | A:T → C:G | G:C → C:G | |
| Population A | 2 | 3 | 2 | 8 | 1 | 0 |
| Population B | 3 | 4 | 0 | 2 | 0 | 0 |
| Total | 5 | 7 | 2 | 10 | 1 | 0 |
De Novo Mutations May Be Responsible for Cell Fitness
Of the 21 mutations that occurred in coding regions, 86% caused amino acid changes, consistent with a random expectation (χ2 test, P = 0.20, 1 df). In particular, a single nonsynonymous mutation was fixed in each evolved population (supplementary table S1, Supplementary Material online). Functional annotation showed that the fixed mutation in population A results in a premature stop codon in a gene encoding a putative dicer-related RNase III protein and the fixed mutation in population B causes an amino acid change in a response regulator receiver domain protein previously shown to be a critical regulator of bacterial growth and cell cycle progression (Skerker et al. 2005). We therefore speculate that these two fixed nonsynonymous mutations may drive the increased population fitness in these populations, although this needs to be confirmed. Consistent with this, analysis of growth rate trajectories showed that the fitness of both evolving populations gradually increased, reaching a plateau at around generation 700 (fig. 5).
Fig. 5.
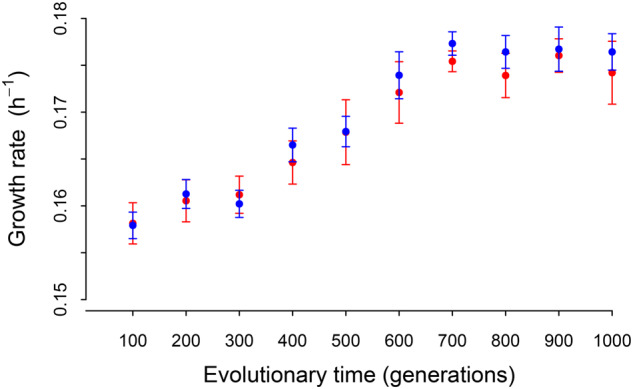
Growth fitness trajectories during experimental evolution. Filled red and blue circles indicate the mean growth rate within every 100 generations of populations A and population B, respectively, and error bars show the standard error of mean.
In traditional mutation accumulation experiments, cell lines are passed through single-cell bottlenecks to minimize the selection efficiency for spontaneous mutations, and fitness often declines as deleterious mutations accumulate in the genomes (Lynch et al. 2008; Long et al. 2016). In contrast, in our experimental procedures ∼40,000 cells were transferred per day for 1,000 cell divisions. During this period, natural selection seemed to operate on mutations arising in the MAC because the evolving populations gained in fitness. Therefore, the mutations observed in our experiment may not reflect the mutation process alone, but rather the combined processes of mutation and selection.
Discussion
Long-term experimental evolution combined with WGS is a powerful approach to detect newly arising mutations in evolving lineages or populations (Barrick and Lenski 2013). This study represents the first attempt to use this approach to explore the accumulation of de novo mutation in the polyploid MAC genome of the model ciliate, T. thermophila. To detect low-frequency mutations while eliminating random sequencing errors, candidate mutations were required to be supported by at least three reads. Since the average sequencing depth of each evolved population was 60×, the lowest mutation frequency that we could detected by WGS was ∼5%. To validate low-frequency mutations, we used the MassARRAY system, the sensitivity of which is greater than traditional Sanger sequencing and sufficient to rigorously validate the detected mutations (Fumagalli et al. 2010; Kriegsmann et al. 2015). Therefore, to detect lower frequency de novo mutations and resolve the complete mutation spectrum of T. thermophila MAC genomes, future studies should use a greater sequencing depth and more sensitive mutation validation techniques, such as the droplet digital PCR system (Hindson et al. 2011).
Using our established mutation detection method, we succeeded in filtering out most false positive mutations. These were found to occur 1) in clusters or near to or within 2) repetitive sequences and 3) indels (fig. 2), with most mutations falling into at least two of these categories (fig. 3A). Repetitive sequences are a recognized source of false positive base substitutions and indels (Shen et al. 2010; Li 2014). In addition, it is found that the imprecise excision of IESs in the newly developing MAC during conjugation can lead to the formation of many single nucleotide polymorphisms or indels around IES junction sites (Hamilton et al. 2016; Chen et al. 2019). Consistent with the fact that imprecise excision of an IES can produce multiple rearranged forms in the polyploid MAC, we found that most of the detected indels occurred closely to the other indels (supplementary fig. S4, Supplementary Material online). Furthermore, alignment of the identified repetitive sequences associated with false positive mutations to the MIC reference genome revealed that 54% of these repetitive sequences were derived from flanking sequences of the 7,551 reported high confidence IESs (Hamilton et al. 2016). Given that the current MIC reference genome is very incomplete and at least 5,000 IESs have not yet been precisely identified (Hamilton et al. 2016), many more repetitive sequences are likely to be associated with IESs. Therefore, common false positive mutations related to both repetitive sequences and indels are probably caused by imprecise IES excision. Our results highlight that repetitive sequences and genome rearrangement events, such as IES elimination, must be considered in mutation analysis in ciliates.
We observed a strong G/C→A/T mutational bias in the T. thermophila MAC genome, consistent with observations made in a variety of organisms (Long et al. 2018), possibly as a result of spontaneous cytosine deamination and the conversion of guanine to 8-oxo-guanine (Duncan and Miller 1980). This result suggests that nucleotide composition of the ciliate MAC genome is also heavily influenced by mutations, and this may have particular consequences for amicronucleate ciliate species because their MACs cannot be reset from the MIC by sexual conjugation. However, the molecular features of T. thermophila MIC genome mutations are not yet resolved because too few spontaneous de novo mutations have been identified in evolving cell lines (Long et al. 2016). Therefore, whether the germline MIC and somatic MAC genomes experience different mutational processes (due to, for example, different DNA polymerase or repair machinery) should be determined by further investigating de novo mutations of the MIC genome and by directly comparing the mutation features between the two genomes.
The mutation identification and validation methods established in this study could be used for mutation analysis of both MAC and MIC genomes in other ciliate species to facilitate research into ciliate genome evolution. Based on these methods, ciliates have the potential to become an important model system to investigate the evolutionary role of polyploidy.
Supplementary Material
Acknowledgments
We thank Dr Zhixian Qiao at The Analysis and Testing Center of Institute of Hydrobiology, Chinese Academy of Sciences for her help with the MassARRAY system. This study was supported by the National Natural Science Foundation of China (Grant Nos. 31900316, 31525021); the Bureau of Frontier Sciences and Education, Chinese Academy of Sciences (Grant No. ZDBS-LY-SM026); and the Wuhan Branch, Supercomputing Center, Chinese Academy of Science, China.
Data Availability
Raw sequencing data are available from the National Center for Biotechnology Information Sequence Read Archive database under a BioProject with accession number PRJNA635246.
Literature Cited
- Allen SL. 1963. Genomic exclusion in Tetrahymena—genetic basis. J Protozool. 10(4):413–420. [DOI] [PubMed] [Google Scholar]
- Altschul SF, Gish W, Miller W, Myers EW, Lipman DJ. 1990. Basic local alignment search tool. J Mol Biol. 215(3):403–410. [DOI] [PubMed] [Google Scholar]
- Barrick JE, Lenski RE. 2013. Genome dynamics during experimental evolution. Nat Rev Genet. 14(12):827–839. [DOI] [PMC free article] [PubMed] [Google Scholar]
- Brito PH, Guilherme E, Soares H, Gordo I. 2010. Mutation accumulation in Tetrahymena. BMC Evol Biol. 10(1):354. [DOI] [PMC free article] [PubMed] [Google Scholar]
- Cassidy-Hanley DM. 2012. Tetrahymena in the laboratory: strain resources, methods for culture, maintenance, and storage. Methods Cell Biol. 109:237–276. [DOI] [PMC free article] [PubMed] [Google Scholar]
- Chen K, Wang GY, Xiong J, Jiang CQ, Miao W. 2019. Exploration of genetic variations through single-cell whole-genome sequencing in the model ciliate Tetrahymena thermophila. J Eukaryot Microbiol. 66(6):954–965. [DOI] [PubMed] [Google Scholar]
- Cingolani P, et al. 2012. A program for annotating and predicting the effects of single nucleotide polymorphisms, SnpEff: SNPs in the genome of Drosophila melanogaster strain w(1118); iso-2; iso-3. Fly 6(2):80–92. [DOI] [PMC free article] [PubMed] [Google Scholar]
- Doerder FP. 2014. Abandoning sex: multiple origins of asexuality in the ciliate Tetrahymena. BMC Evol Biol. 14(1):112. [DOI] [PMC free article] [PubMed] [Google Scholar]
- Doerder FP, Deak JC, Lief JH. 1992. Rate of phenotypic assortment in Tetrahymena Thermophila. Dev Genet. 13(2):126–132. [DOI] [PubMed] [Google Scholar]
- Doerder FP, Debault LE. 1975. Cytofluorimetric analysis of nuclear DNA during meiosis, fertilization and macronuclear development in ciliate Tetrahymena Pyriformis, Syngen 1. J Cell Sci. 17(3):471–493. [DOI] [PubMed] [Google Scholar]
- Dohm JC, Lottaz C, Borodina T, Himmelbauer H. 2008. Substantial biases in ultra-short read data sets from high-throughput DNA sequencing. Nucleic Acids Res. 36(16):e105. [DOI] [PMC free article] [PubMed] [Google Scholar]
- Duncan AW, et al. 2012. Aneuploidy as a mechanism for stress-induced liver adaptation. J Clin Invest. 122(9):3307–3315. [DOI] [PMC free article] [PubMed] [Google Scholar]
- Duncan BK, Miller JH. 1980. Mutagenic deamination of cytosine residues In DNA. Nature 287(5782):560–561. [DOI] [PubMed] [Google Scholar]
- Eisen JA, et al. 2006. Macronuclear genome sequence of the ciliate Tetrahymena thermophila, a model eukaryote. PLoS Biol. 4(9):e286. [DOI] [PMC free article] [PubMed] [Google Scholar]
- Fumagalli D, et al. 2010. A rapid, sensitive, reproducible and cost-effective method for mutation profiling of colon cancer and metastatic lymph nodes. BMC Cancer 10(1):101. [DOI] [PMC free article] [PubMed] [Google Scholar]
- Gabriel S, Ziaugra L, Tabbaa D. 2009. SNP genotyping using the Sequenom MassARRAY iPLEX platform. Curr Protoc Hum Genet. 60(1):2.12.11–12.12.18. [DOI] [PubMed] [Google Scholar]
- Gorovsky MA, Yao MC, Keevert JB, Pleger GL. 1975. Isolation of micro- and macronuclei of Tetrahymena pyriformis. Methods Cell Biol. 9(0):311–327. [DOI] [PubMed] [Google Scholar]
- Hamilton EP, et al. 2016. Structure of the germline genome of Tetrahymena thermophila and relationship to the massively rearranged somatic genome. eLife 5:e19090. [DOI] [PMC free article] [PubMed] [Google Scholar]
- Hindson BJ, et al. 2011. High-throughput droplet digital PCR system for absolute quantitation of DNA copy number. Anal Chem. 83(22):8604–8610. [DOI] [PMC free article] [PubMed] [Google Scholar]
- Huse SM, Huber JA, Morrison HG, Sogin ML, Welch D. 2007. Accuracy and quality of massively parallel DNA pyrosequencing. Genome Biol. 8(7):R143. [DOI] [PMC free article] [PubMed] [Google Scholar]
- Kim N, Jinks-Robertson S. 2012. Transcription as a source of genome instability. Nat Rev Genet. 13(3):204–214. [DOI] [PMC free article] [PubMed] [Google Scholar]
- Kishimoto T, et al. 2010. Transition from positive to neutral in mutation fixation along with continuing rising fitness in thermal adaptive evolution. PLoS Genet. 6(10):e1001164. [DOI] [PMC free article] [PubMed] [Google Scholar]
- Kriegsmann M, Arens N, Endris V, Weichert W, Kriegsmann J. 2015. Detection of KRAS, NRAS and BRAF bymass spectrometry—a sensitive, reliable, fast and cost-effective technique. Diagn Pathol. 10(1):132. [DOI] [PMC free article] [PubMed] [Google Scholar]
- Li H. 2014. Toward better understanding of artifacts in variant calling from high-coverage samples. Bioinformatics 30(20):2843–2851. [DOI] [PMC free article] [PubMed] [Google Scholar]
- Li H, et al. 2009. The Sequence Alignment/Map format and SAMtools. Bioinformatics 25(16):2078–2079. [DOI] [PMC free article] [PubMed] [Google Scholar]
- Long HA, et al. 2016. Low base-substitution mutation rate in the germline genome of the ciliate Tetrahymena thermophila. Genome Biol Evol. 8(12):3629–3639. [DOI] [PMC free article] [PubMed] [Google Scholar]
- Long HA, et al. 2018. Evolutionary determinants of genome-wide nucleotide composition. Nat Ecol Evol. 2(2):237–240. [DOI] [PMC free article] [PubMed] [Google Scholar]
- Long HA, Paixao TG, Azevedo RBR, Zufall RA. 2013. Accumulation of spontaneous mutations in the ciliate Tetrahymena thermophila. Genetics 195(2):527–540. [DOI] [PMC free article] [PubMed] [Google Scholar]
- Losick VP, Fox DT, Spradling AC. 2013. Polyploidization and cell fusion contribute to wound healing in the adult Drosophila epithelium. Curr Biol. 23(22):2224–2232. [DOI] [PMC free article] [PubMed] [Google Scholar]
- Lynch M, et al. 2016. Genetic drift, selection and the evolution of the mutation rate. Nat Rev Genet. 17(11):704–714. [DOI] [PubMed] [Google Scholar]
- Lynch M, et al. 2008. A genome-wide view of the spectrum of spontaneous mutations in yeast. Proc Natl Acad Sci USA. 105(27):9272–9277. [DOI] [PMC free article] [PubMed] [Google Scholar]
- Prescott DM. 1994. The DNA of ciliated protozoa. Microbiol Rev. 58(2):233–267. [DOI] [PMC free article] [PubMed] [Google Scholar]
- Schoenfelder KP, Fox DT. 2015. The expanding implications of polyploidy. J Cell Biol. 209(4):485–491. [DOI] [PMC free article] [PubMed] [Google Scholar]
- Shen YF, et al. 2010. A SNP discovery method to assess variant allele probability from next-generation resequencing data. Genome Res. 20(2):273–280. [DOI] [PMC free article] [PubMed] [Google Scholar]
- Skerker JM, Prasol MS, Perchuk BS, Biondi EG, Laub MT. 2005. Two-component signal transduction pathways regulating growth and cell cycle progression in a bacterium: a system-level analysis. PLoS Biol. 3(10):e334. [DOI] [PMC free article] [PubMed] [Google Scholar]
- Stover NA. 2006. Tetrahymena Genome Database (TGD): a new genomic resource for Tetrahymena thermophila research. Nucleic Acids Res. 34(90001):D500–D503. [DOI] [PMC free article] [PubMed] [Google Scholar]
- Thorvaldsdóttir H, Robinson JT, Mesirov JP. 2012. Integrative Genomics Viewer (IGV): high-performance genomics data visualization and exploration. Brief Bioinform. 14(2):178–192. [DOI] [PMC free article] [PubMed] [Google Scholar]
- Van De Peer Y, Mizrachi E, Marchal K. 2017. The evolutionary significance of polyploidy. Nat Rev Genet. 18(7):411–424. [DOI] [PubMed] [Google Scholar]
- Weindruch RH, Doerder FP. 1975. Age-dependent micronuclear deterioration in tetrahymena-pyriformis, syngen-1. Mech Ageing Dev. 4:263–279. [DOI] [PubMed] [Google Scholar]
- Xiong J, et al. 2019. Hidden genomic evolution in a morphospecies—the landscape of rapidly evolving genes in Tetrahymena. PLoS Biol. 17(6):e3000294. [DOI] [PMC free article] [PubMed] [Google Scholar]
- Yu HH, Xie WB, Li J, Zhou FS, Zhang QF. 2014. A whole-genome SNP array (RICE6K) for genomic breeding in rice. Plant Biotechnol J. 12(1):28–37. [DOI] [PubMed] [Google Scholar]
Associated Data
This section collects any data citations, data availability statements, or supplementary materials included in this article.
Supplementary Materials
Data Availability Statement
Raw sequencing data are available from the National Center for Biotechnology Information Sequence Read Archive database under a BioProject with accession number PRJNA635246.