Abstract
Background:
Carbonic anhydrase IX (CA-IX) is a potential imaging biomarker of clear cell renal cell carcinoma (ccRCC). Here, we report the results of a phase II clinical trial of a small molecule radiotracer targeting CA-IX (18F-VM4-037) in ccRCC.
11 patients with kidney masses underwent 18F-VM4-037 PET/CT prior to surgery. Dynamic imaging was per-formed for the first 45 min post injection and whole-body imaging was obtained at 60 min post injection. Tumors were surgically excised or biopsied within 4 weeks of imaging.
Results:
All patients tolerated the radiotracer well with no adverse events. Ten of the 11 patients had histologically confirmed malignancy. One patient had a Bosniak Type 3 cyst with no tumor found at surgery. Two patients had extrarenal disease and 9 had tumors only in the kidney. Primary ccRCC lesions were difficult to visualize on PET alone due to high uptake of the tracer in the adjacent normal kidney parenchyma, however when viewed in conjunction with CT, the tumors were easily localized.
Metastatic lesions were clearly visible on PET. Mean SUV for primary kidney lesions was 2.55 in all patients; in patients with histologically confirmed ccRCC, the mean SUV was 3.16. The time-activity curves (TAC) are consistent with reversible ligand binding with peak activity concentration at 8 min post injection followed by washout. Distribution Volume Ratio (DVR) of the lesions was measured using the Logan graphical analysis method. The mean DVR value across the 9 kidney lesions was 5.2 ± 2.8, (range 0.68–10.34).
Conclusion:
18F-VM4-037 is a well-tolerated PET agent that allows same day imaging of CA-IX expression. The agent demonstrated moderate signal uptake in primary tumors and excellent visualization of CA-IX positive metastases. While the evaluation of primary ccRCC lesions is challenging due to high background activity in the normal kidney parenchyma, 18F-VM4-037 may be most useful in the evaluation of metastatic ccRCC lesions.
Keywords: Renal cell carcinoma, Carbonic anhydrase IX, 18F-VM4-037, Positron emission tomography (PET)
Renal cell carcinoma (RCC) constitutes 3–4% of new cancers each year in the United States. The American Cancer Society estimates that 63,920 new cases will be diagnosed and 13,860 patients will die of RCC in 2014 [1]. Clear cell RCC (ccRCC) is the most common histologic subtype of RCC and its initiation is often linked to mutations in the VHL gene which leads to upregulation of the hypoxia inducible factor (HIF) pathway [2]. von Hippel–Lindau (VHL) is a hereditary cancer syndrome characterized by germline mutation of the VHL gene [3, 4]. The product of the VHL gene, pVHL, facilitates degradation of the hypoxia inducible factors (HIF) via ubiquitin-mediated proteosomal degradation. HIF, which mediates the cell’s response to hypoxia by activating the transcription of many genes, is a substrate of the pVHL and absence or mutation of the VHL gene-protein results in accumulation of HIF and transcription of downstream genes, which have been implicated in oncogenesis [5]. Carbonic Anhydrase IX (CA-IX), osteopontin, and heterogeneous nuclear Ribonucleo-protein (hnRNP) A2/B1 are downstream of HIF-1α and therefore, are elevated when the VHL protein is dysfunctional [6, 7]. Some studies demonstrate that the combination of low CA-IX expression and the absence of VHL mutation appear to predict worse overall survival, whereas the presence of a VHL mutation with high CA-IX expression correlates with a more favorable outcome [8]. However, other studies suggest that CA-IX expression is independent of VHL mutation status and prognosis [9, 10].
CA-IX has been identified as a potential imaging biomarker for ccRCC [11, 12]. Early attempts to target CA-IX for imaging involved the use of radiolabeled monoclonal antibodies (mAb G250). In addition to occasional immunologic reactions [13, 14], mAbs have a prolonged serum half-life requiring several days after initial dosing for satisfactory tumor to background ratios to be achieved [15-18]. The decreased renal excretion seen with mAbs allows uptake in the tumor to be more easily recognized, however the prolonged imaging times, which range up to a week post injection, reduce its clinical applicability.
The radiotracer, 18F-VM4-037, was developed as a small molecule that binds to the active ligand site of CA-IX [19]. Imaging can be performed on the same day as the injection. Herein, we report the results of a phase 2 pilot trial of 18F-VM4-037 for imaging of CA-IX expression in localized and metastatic ccRCC.
Methods
Study design and patient population
This is a HIPAA compliant, prospective, single institution study, approved by the local institutional review board (IRB) with written informed consent. Inclusion criteria included patients with primary RCC ≥2.5 cm in diameter or one or more extrarenal/extrahepatic metastatic RCC lesions (≥1 cm in diameter). Exclusion criteria were contraindications to PET/CT scan or abnormal liver function. Patients who had prior radiation therapy to the site of the target lesion within 6 months of enrollment were ineligible.
Between October 2012 and May 2013, 12 patients signed the consent form, but only 11 patients (n = 3 female, n = 8 men) (mean age 60.5 years, range: 46–78 years) underwent an 18F-VM4-037 PET/CT scan (Table 1). Patients underwent surgical removal or biopsy of their lesions within 4 weeks after their 18F-VM4-037 PET/CT scans.
Table 1.
Demographics information of the all accrued 12 patients, patient #2 did not receive 18F-VM4-037 injection and PET/CT imaging
| Patient demographics | |||||||
|---|---|---|---|---|---|---|---|
| Subject # | Gender | Age | Known hereditary RCC mutation |
Clinical stage | Histology | Grade | Tumor size (cm) |
| 1 | F | 46 | Yes (VHL) | TONOMO | Renalcyst | n/a | 3.6 |
| 2 | M | 28 | Yes (VHL) | T1aNOMO | ccRCC | 2 | 3.4 |
| 3 | M | 44 | No | T3aNOM1 | ccRCC with sarcomatoid differentiation | 4 | 6.89 |
| 4 | F | 60 | No | T3aNOM1 | ccRCC with sarcomatoid features | 4 | 9.3 |
| 5 | M | 76 | Yes (VHL) | T1aNOMO | ccRCC | 2 | 4.0 |
| 6 | M | 57 | Yes (VHL) | T1aNOMO | ccRCC | 2 | 3.3 |
| 7 | M | 52 | No | T1aNOMO | ccRCC | 2 | 2.7 |
| 8 | M | 60 | No | T1aNOMO | ccRCC | 2 | 3.7 |
| 9 | F | 62 | No | T2NOM1 | ccRCC | 2 | 2.0 |
| 10 | M | 71 | No | T1aNOMO | ccRCC | 2 | 3.4 |
| 11 | M | 78 | No | T1bNOMO | ccRCC | 3 | 5.8 |
| 12 | M | 59 | Yes (VHL) | T1aNOMO | ccRCC | 2 | 3.5 |
18F-VM4-037 PET/CT imaging protocol
Patients were required to rest for at least 30 min before injection of 18F-VM4-037 and patients were encouraged to void prior to imaging.
18F-VM4-037 was produced on a FASTlab automated synthesis module as described previously [19]. Manufacturing occurred at PET NETSolutions (North Wales, PA, USA).
Each patient received an IV bolus injection of 168.72 MBq [4.56 mCi] (range 129.5-185 MBq [3.5-5 mCi]) of 18F-VM4-037, mean dose within 5 h of radiosynthesis.
PET was performed on two different PET/CT cameras: for six patients 3D time of flight (TOF) images were obtained on a Philips Gemini TF camera (Philips, Cleveland OH), whereas for five patients 3D time of flight (TOF) images were obtained on a Siemens Biograph PET mCT camera. Details of the imaging parameters are presented in Table 2. Raw data were reconstructed with an ordered subset expectation maximization (OSEM) algorithm using 3 iterations and 33 subsets. Both scanners applied the standard set of pre-reconstruction corrections. These are random, normalization, dead time, model-based scatter, and CT-based attenuation corrections [20]. As part of the PET/CT imaging protocol, two low dose transmission CT scans were obtained (120 kV, 60mAs), one for the 45 min dynamic scan centered on the primary or metastatic lesion and one for the whole-body scan at 60 min post injection. The dynamic scan (4 × 30 s frames, 8 × 60 s frames, 10 × 120 s frames, 3 × 300 s frames) began at the time of injection and continued for 45 min. This was followed by a 2 min/bed position whole-body scan at 60 min post injection. This was immediately followed by a final 10 min single bed position scan with the subject in the same position as the original 45 min dynamic scan.
Table 2.
PET/CT imaging parameters used in the two scanners
| PET/CT scanner parameters | ||
|---|---|---|
| Scanner | Philips Gemini TF | Siemens Biograph mCT |
| Reconstruction method | BLOB-OS-TOF, 3 iterations, 33 subsets | OSEM 3D, 3 iterations, 24 subsets |
| PET corrections | Normalization, dead time, decay, delayed randoms, CT-based attenuation, scatter SS-SIMUL | Normalization, dead time, decay, delayed randoms, CT-based attenuation, model-based scatter |
| Post reconstruction filter | None | None |
| Image specs | Voxel size 4.00 × 4.00 × 4.00 mm | Voxel size 4.07 × 4.07 × 4.00 mm |
| kVp | 120 kV | 120 kV |
| Exposure | 60 mAs | 60 mAs |
| Current | 168 mA | 115 mA |
Vital signs were obtained prior to 18F-VM4-037 injection, at 10 and 30 min post injection and directly after the last PET scan. The patients were queried regarding potential subjective adverse events. An additional telephone query was performed the following day.
Clinical management
Within 3 weeks of enrollment, selected tumors underwent biopsy or surgical resection as part of the standard of care in all patients. Surgical managements of primary tumors have been described previously [21]. Metastatic lesions were biopsied or resected as clinically indicated.
Data analysis
Histopathologic analysis
All conventional stainings were reviewed by a single pathologist (MJM).
Imaging analysis
PET/CT images were analyzed with commercial software (MIM 5.4 Software, MIM Software Inc. Cleveland, OH). One intrarenal tumor from each patient was included in the analysis. In two patients, metastases (n = 1 in the lung, n = 1 in the bony pelvis) were also included in the analysis. A lesion-based analysis was applied to all 13 target lesions to obtain SUVmean (the average SUV value within the lesion contour) on the static whole-body PET/CT images acquired at ~ around 60 min post injection. SUVmax was not used for primary lesions in this study because of the high likelihood of contamination from adjacent kidney that had significantly higher uptake than the tumor. On the other hand, for metastatic lesions SUVmax was used since these lesions were isolated with no adjacent background activity.
VHL gene mutation analysis
Patients suspected of being affected with Von Hippel–Lindau disease (VHL) were evaluated on an NCI IRB-approved protocol (NCT00001238). Family history, clinical phenotype, tumor characteristics, and mutational assessment were evaluated. Germline VHL mutation testing was performed using Clinical Laboratory Improvement Amendments (CLIA) certified laboratories.
For patients without clinical suspicion of germline VHL, tumor mutation analysis for VHL alterations was performed on an NCI IRB approved protocol (NCT000026884). For this analysis, DNA was extracted from fresh frozen tissue using a Promega Maxwell 16 Tissue DNA Purification Kit or from formalin-fixed, paraffin-embedded tissue using a Maxwell 16 FFPE Tissue LEV DNA Purification Kit (Madison, WI, USA). Quantification of extracted DNA was performed using a ThermoScientific Nanodrop 1000 (Wilmington, DE, USA). A Qiagen Taq PCR Core Kit (Germantown, MD, USA) was used to amplify all three VHL exons. Purified DNA products were sequenced bidirectionally using the Big Dye Terminator v.1.1 Cycle Sequencing Kit (Applied Biosystems, Foster City, CA) according to the manufacturer’s specifications and run on an ABI 3130xl Genetic Analyzer (Applied Biosystems). Forward and reverse sequences were evaluated using Sequencher 4.10.01 (Ann Arbor, MI, USA).
Statistical analysis
Descriptive statistics were used to define patient characteristics.
Graphical analysis
Time-activity curves (TAC) were generated from the 45 min dynamic scans for the primary tumor lesion, the aorta, to generate a blood TAC and healthy kidney and liver tissue, to study background effects. The distribution volume ratio (DVR) was calculated using the Logan graphical analysis method for the primary lesions. The Ki rate constant from the Patlak graphical analysis method was calculated for the primary lesion, and the healthy kidney and liver tissues. Because of the high uptake of the ligand causing background effects of the normal kidney tissue, the mean SUV was recorded for the primary kidney lesions. The 80% max was used for the aorta TAC to help offset partial volume effects. Because of the non-uniform uptake in the kidney and to a lesser extent in the liver, the 80% max was also used for the normal kidney and liver tissue TAC.
Results
Clinical findings
All eleven patients tolerated the radiotracer well without any adverse events. Ten patients had histologically confirmed malignancy. One patient had a Bosniak 3 complex cyst on pre-operative conventional CT with no tumor found at surgery. Among the 10 patients with renal malignancy, two patients had extrarenal disease (n = 1 in the lungs, n = 1 in the left iliac bone). All 10 patients with malignancy had ccRCC with two patients exhibiting sarcomatoid features, and 1 demonstrating smooth muscle features. Both metastatic lesions were consistent with ccRCC with poor differentiation in the lung lesion.
Lesion-based 18F-VM4-037 uptake
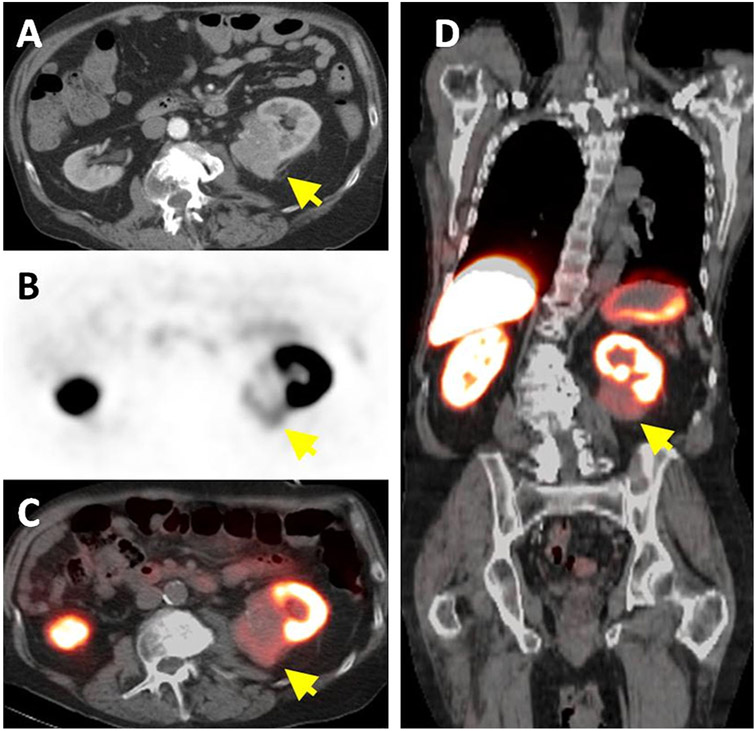
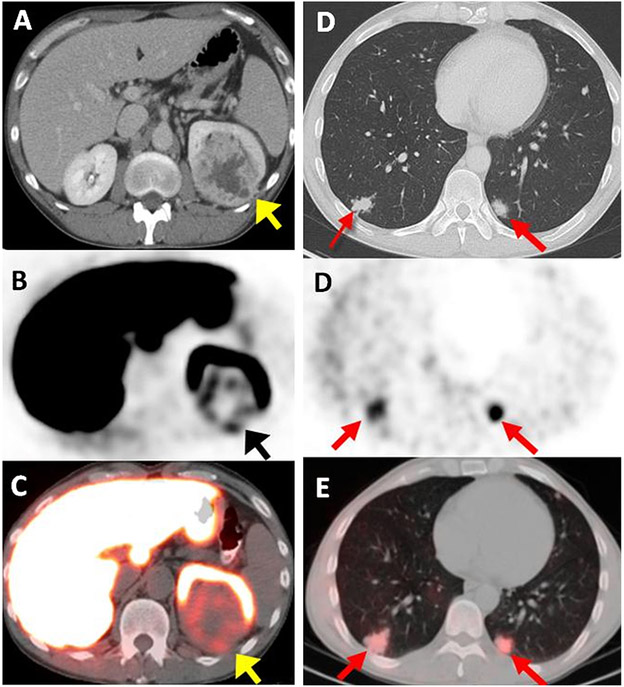
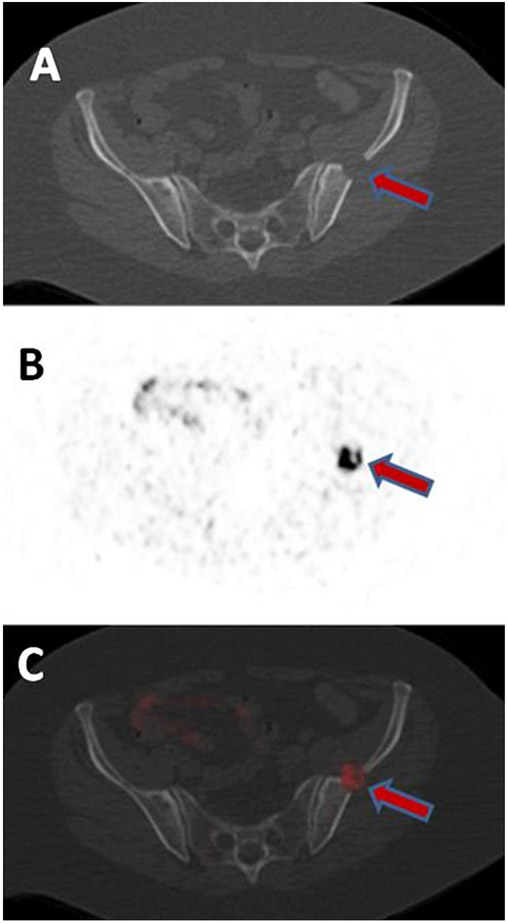
The primary ccRCC lesions were partly obscured by the high 18F-VM4-037 uptake within normal kidney parenchyma, whereas clear tumor images were observed in metastatic lesions in two patients (Figs. 1, 2, 3). Mean SUV for all target lesions was 3.04 (range: 0.58–9.61; SD: 1.14). Mean SUV for primary ccRCC lesions after excluding the Bosniak 3 cyst in patient #1 was 2.55 (range: 0.58–4.23; SD:1.23. Mean SUVmax for metastatic lesions was 5.92 (Table 3). The mean SUV for normal kidney was 35.4 (range 19.6–50.3; SD 12.3).
Fig. 1.
A 78-year-old man with left-sided ccRCC detected on contrast enhanced CT (arrow) (A). Axial 18F-VM4-037 PET (B) and PET/CT (C) show uptake within the left kidney lesion (arrow) with an SUVmean of 1.86. Coronal 18F-VM4-037 PET/CT shows the uptake within the left sided lesion (arrow) and the high uptake of the tracer in normal kidney parenchyma as well as in the liver (D).
Fig. 2.
A 44-year-old male with left-sided ccRCC detected on contrast enhanced CT (arrow) (A). Axial 18F-VM4-037 PET (B) and PET/CT (C) show uptake within the left kidney lesion (arrow) with an SUVmean of 2.45. Axial CT shows bilateral metastases in lung bases (SUV = 2.22 in the right lower lobe lesion with histology confirmation of poorly differentiated ccRCC) (arrows) (D). Axial 18F-VM4-037 PET/CT (E) show uptake of 18F-VM4-037 both lesions (arrows).
Fig. 3.
A 62-year-old female with metastatic ccRCC in the left ilium detected on CT (A). The lesions show uptake on axial 18F-VM4-037 PET (B) and PET/CT (C) with SUVmax of 9.61.
Table 3.
PET/CT results of primary and metastatic ccRCC lesions
| Subject # | SUVmean | Histology | Grade |
|---|---|---|---|
| Primary renal lesions | |||
| 1 | 1.68 | Renal cyst | n/a |
| 3 | 2.45 | ccRCC with sarcomatoid differentiation | 4 |
| 4 | 0.58 | ccRCC with sarcomatoid features | 4 |
| 5 | 1.13 | ccRCC | 2 |
| 6 | 2.66 | ccRCC | 2 |
| 7 | 3.35 | ccRCC | 2 |
| 8 | 2.6 | ccRCC with smooth muscle features | 2 |
| 10 | 4.08 | ccRCC | 2 |
| 11 | 1.86 | ccRCC | 3 |
| Metastatic lesions | |||
| 3 (lung) | 2.22 | ccRCC poorly differentiated | 4 |
| 9 (iliac bone) | 9.61 | ccRCC | 2 |
VHL gene mutation analysis
Of the 11 total patients who were enrolled and subsequently imaged and underwent surgery, 5 had germline VHL testing with 4 having identifiable mutations of the VHL gene. The remaining six patients did not have germline VHL mutation testing due to low index of clinical suspicion although 2 of the 6 had germline analysis for other gene mutations linked to familial RCC conditions. Interestingly, of the 10 tumors resected that were histologically classified as ccRCC, 9 of the 10 were found to have VHL gene mutations meaning five of six patients without germline VHL alterations had somatic VHL mutations in their tumors. Among the four subjects with known germline VHL mutations, 3 of the 4 had ccRCC tumors as expected and one had a complex cyst without tumor present. The remaining patient without either germline or somatic VHL alterations had a tumor histology read as clear cell RCC with smooth muscle.
Graphical analysis
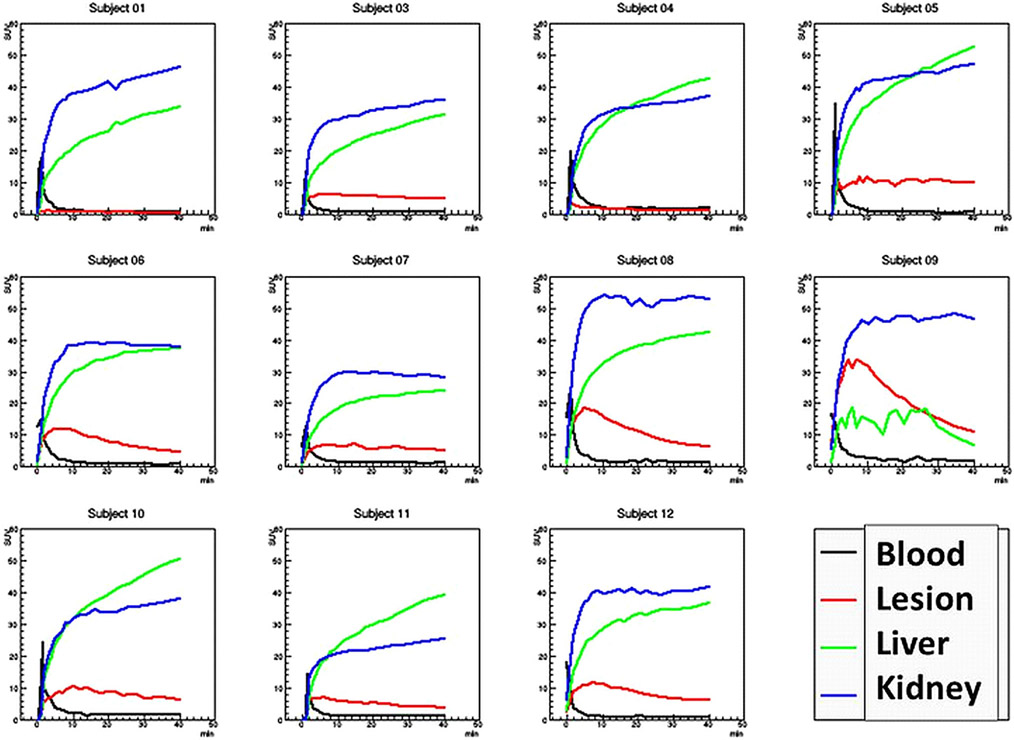
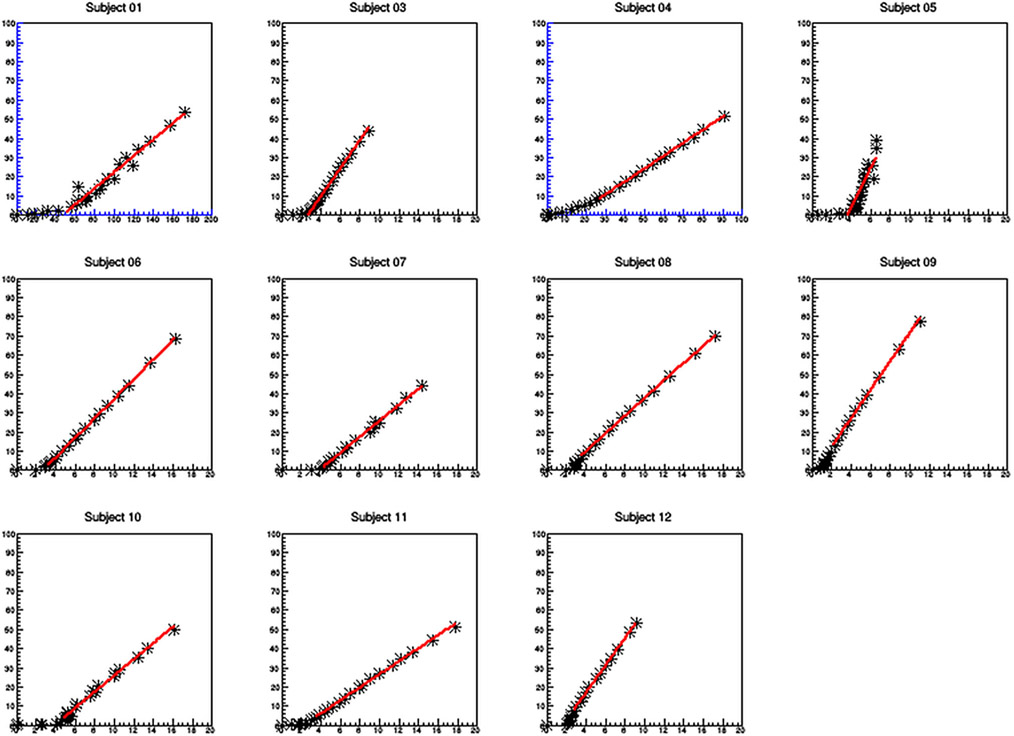
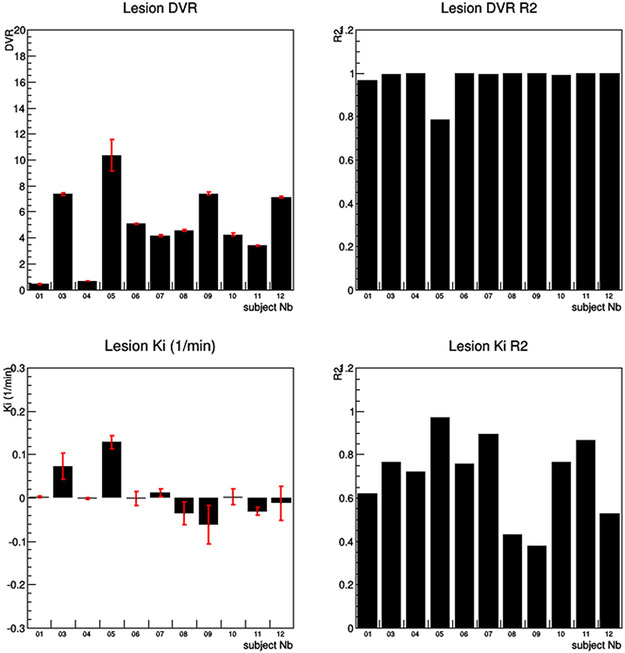
For the kinetic data analysis, the DVR for the primary kidney lesions had a mean of 5.2 ± 2.8, whereas the Ki for the same primary lesions had a mean value of 0.01/min ± .05/min. Subject #9, who had an iliac bone metastatic lesion had a DVR of 7.4 ± 0.1 and a Ki of −0.06/min ± 0.04/min. The normal kidney Ki had a mean of .45/min ± 0.22/min and the liver Ki had a mean of 0.54/min ± .018/min (Fig. 4, 5, 6).
Fig. 4.
Time-activity curves (TAC) for the 11 subjects. Note, subject 9 only had a few voxels of liver activity and thus the liver TAC is not well sampled. Visual inspection shows the tumor lesion demonstrating reversible binding of the ligand, while the kidney and liver tissue do not. Also note subject #1 had a benign lesion with no uptake.
Fig. 5.
Logan graphical analysis for the primary lesions. Subjects 1 and 4 had very low uptake and thus the axis were rescaled (color blue). The rest of the Logan plots are graphed using the same X and Y axis scales so one can visually compare the slopes (DVR) of the graphical analysis.
Fig. 6.
The results of both the Logan and Patlak graphical analysis. The Logan graphical analysis showed a strong linear fit for all subjects except subject #5 with an R2 greater than .95. In contrast, the Patlak graphical analysis shows very poor linear fits with R2 fit values much less than .9, thus demonstrating that the ligand shows reversible binding.
Discussion
18F-VM4-037 was developed to image CA-IX expression primarily in clear cell carcinoma. These results indicate that clear cell kidney cancers demonstrate uptake of 18F-VM4-037, however, due to the high level of activity in the normal kidney, the uptake within tumor tissue is not conspicuous despite having an SUVmean of over 2. In one patient with a complex renal cyst, 18F-VM4-037 uptake was low (SUVmean = 1.68). The signal within this lesion gives some estimate of the contribution of the adjacent parenchyma to the SUV of the tumor as there should have been no uptake within this cystic lesion. Interestingly, metastatic sites not only demonstrated more tracer uptake compared to in situ renal tumors, but the metastatic tumor sites were visibly obvious due to the much lower background uptake in the surrounding tissue compared to normal kidney parenchyma. This suggests that this compound may have some utility in detecting extrarenal ccRCC deposits. However, the high uptake noted in the liver will make detection of low volume liver metastases difficult to detect with this compound.
18F-VM4-037 was well tolerated by all injected patients without any adverse event. This compound has been shown to be safe in healthy subjects with biodistribution dominated by accumulation in the liver and kidney [19]. The plasma half-life of 18F-VM4-037 is reported to be approximately 18 min which is substantially shorter than the reported half-life of monoclonal antibodies targeting CA-IX (e.g., Girentuximab:cG250) that have entered Phase III testing in humans [13-18]. This property of 18F-VM4-037 may yield a theoretical clinical benefit due to reduced radiation exposure as a result of short half-life and rapid clearance. However, the principle benefit is the ability to scan the same day as injection, thus making the agent more practical. This is balanced against the decreased conspicuity of primary renal masses compared to the radiolabeled antibody.
The pharmacokinetic modeling of the agent shows reversibility of binding to the ligand. This is seen both via visual inspection of the lesion TAC which has an initial peak uptake at about 8 min post injection followed by varying degrees of washout, as well as in the very high linear correlation in the Logan graphical analysis. Furthermore, the Patlak graphical analysis which measures the uptake rate constant Ki had very poor linear correlation in the graphical analysis again consistent with reversible binding. On the other hand, the healthy liver and kidney tissue show no binding reversibility by visual inspection of the TACs and the Patlak uptake rate constant Ki shows appreciable uptake rates with means of .54/min ± 0.17/min and .45/min ± 0.22/min, respectively.
Regarding the one iliac metastatic lesion imaged in subject #9, the DVR was much higher, and measured 7.4 ± 0.1. This was because the SUV 80% max was used to generate the TAC instead of the simple SUV mean which was required in the other lesions. The lesion was located far away from the kidney and liver background regions allowing one to use the SUV 80% max without the danger of background contamination skewing the uptake.
18F-FDG PET is limited for detection of RCC. The main reasons behind this are relatively lower metabolic status of majority of subtypes of RCCs such as cystic-solid ones and excretion of 18F-FDG through the kidney collecting system, which can easily obscure an accurate image evaluation [22]. Currently, use of 18F-FDG PET is limited to staging in high risk patients, especially ones with a suspicion of tumor thrombus and in patients who are monitored for targeted molecular therapies [23]. Experience with Girentuximab suggested that a CA-IX imaging agent would have utility in defining the presence of clear cell carcinoma. Given that the majority of renal cancers are of the clear cell subtype, uptake within the lesion suggests this diagnosis. This may make it useful in patients with suspected benign renal masses (angiomyolipoma or oncocytoma) and may thus, avoid biopsy or unnecessary surgery. Moreover, such targeted radiotracers may help to characterize the lesion biology and may aid stratification of therapy and assist delivery of targeted therapy approaches.
Our study has several limitations. We only included ccRCC cancers which limits conclusions regarding the specificity of this agent. Also, only two patients with metastatic lesions were imaged, thus limiting our conclusions regarding the relative uptake of primary and secondary renal tumors. These two cases were relatively straightforward to visualize on PET but this small number of cases only suggests its utility in patients with metastatic disease.
In conclusion, 18F-VM4-037 is a small molecular weight radiotracer that demonstrated uptake in localized and metastatic ccRCC and no adverse events in a limited patient population. The evaluation of primary ccRCC lesions with 18F-VM4-037 on the PET alone can be challenging due to high background activity in the normal kidney parenchyma; however, 18F-VM4-037 tumor uptake can be measured by limiting the region of interest to the tumor as defined on the accompanying CT. Metastatic lesions are more easily recognized due to lower background signal. Since CA-IX is downstream of HIF, this agent may also be useful as a marker of hypoxia in other indications; however, this requires further investigation.
Acknowledgments.
This project has been funded in whole or in part with federal funds from the National Cancer Institute, National Institutes of Health, under Contract No. HHSN261200800001E. The content of this publication does not necessarily reflect the views or policies of the Department of Health and Human Services, nor does mention of trade names, commercial products, or organizations imply endorsement by the U.S. Government. This research was supported [in part] by the Intramural Research Program of the NIH, National Cancer Institute, Center for Cancer Research. Special thanks to the Urologic Oncology Fellows of the Urologic Oncology Branch of the National Cancer Institute, NIH; Avi Rosenberg, MD, PhD, Laboratory of Pathology, National Cancer Institute, NIH; Hartmut Kolb from Siemens and PET/NET for supplying the agent.
Footnotes
Conflict of interest All authors declare that they have no conflict of interest.
Ethical approval All procedures performed in studies involving human participants were in accordance with the ethical standards of the institutional and/or national research committee and with the 1964 Helsinki declaration and its later amendments or comparable ethical standards.
Informed consent Informed consent was obtained from all individual participants included in the study.
References
- 1.American Cancer Society (2014) Cancer facts & figures 2014. Atlanta: American Cancer Society [Google Scholar]
- 2.Potter CP, Harris AL (2003) Diagnostic, prognostic and therapeutic implications of carbonic anhydrases in cancer. Br J Cancer 89(1):2–7 [DOI] [PMC free article] [PubMed] [Google Scholar]
- 3.Latif F, Tory K, Gnarra J, et al. (1993) Identification of the von Hippel–Lindau disease tumor suppressor gene. Science. 260(5112):1317–1320 [DOI] [PubMed] [Google Scholar]
- 4.Linehan WM, Walther MM, Zbar B (2003) The genetic basis of cancer of the kidney. J Urol 170(6 Pt 1):2163–2172 [DOI] [PubMed] [Google Scholar]
- 5.Rankin EB, Giaccia AJ (2008) The role of hypoxia-inducible factors in tumorigenesis. Cell Death Differ 15(4):678–685 [DOI] [PMC free article] [PubMed] [Google Scholar]
- 6.Kaelin WG Jr (2008) The von Hippel–Lindau tumour suppressor protein: O2 sensing and cancer. Nat Rev Cancer 8(11):865–873 [DOI] [PubMed] [Google Scholar]
- 7.Kim WY, Kaelin WG (2004) Role of VHL gene mutation in human cancer. J Clin Oncol 22(24):4991–5004 [DOI] [PubMed] [Google Scholar]
- 8.Patard JJ, Fergelot P, Karakiewicz PI, et al. (2008) Low CAIX expression and absence of VHL gene mutation are associated with tumor aggressiveness and poor survival of clear cell renal cell carcinoma. Int J Cancer 123(2):395–400 [DOI] [PMC free article] [PubMed] [Google Scholar]
- 9.Nyhan MJ, El Mashad SM, O’Donovan TR, et al. (2011) VHL genetic alteration in CCRCC does not determine de-regulation of HIF, CAIX, hnRNP A2/B1 and osteopontin. Cell Oncol 34(3):225–234 [DOI] [PubMed] [Google Scholar]
- 10.Leibovich BC, Sheinin Y, Lohse CM, et al. (2007) Carbonic anhydrase IX is not an independent predictor of outcome for patients with clear cell renal cell carcinoma. J Clin Oncol 25(30):4757–4764 [DOI] [PubMed] [Google Scholar]
- 11.Donato DP, Johnson MT, Yang XJ, Zynger DL (2011) Expression of carbonic anhydrase IX in genitourinary and adrenal tumours. Histopathology 59(6):1229–1239 [DOI] [PubMed] [Google Scholar]
- 12.Bui MH, Seligson D, Han KR, et al. (2003) Carbonic anhydrase IX is an independent predictor of survival in advanced renal clear cell carcinoma: implications for prognosis and therapy. Clin Cancer Res 9:802. [PubMed] [Google Scholar]
- 13.Stillebroer AB, Boerman OC, Desar IM, et al. (2013) Phase 1 radioimmunotherapy study with lutetium 177-labeled anti-carbonic anhydrase IX monoclonal antibody girentuximab in patients with advanced renal cell carcinoma. Eur Urol 64:478. [DOI] [PubMed] [Google Scholar]
- 14.Divgi CR, Bander NH, Scott AM, et al. (1998) Phase I/II radioimmunotherapy trial with iodine-131-labeled monoclonal antibody G250 in metastatic renal cell carcinoma. Clin Cancer Res 4:2729. [PubMed] [Google Scholar]
- 15.Divgi CR, Pandit-Taskar N, Jungbluth AA, et al. (2007) Preoperative characterisation of clear-cell renal carcinoma using iodine-124-labelled antibody chimeric G250 (124I-cG250) and PET in patients with renal masses: a phase I trial. Lancet Oncol 8:304. [DOI] [PubMed] [Google Scholar]
- 16.Muselaers CH, Boerman OC, Oosterwijk E, et al. (2013) Indium-111-labeled girentuximab immunoSPECT as a diagnostic tool in clear cell renal cell carcinoma. Eur Urol 63:1101. [DOI] [PubMed] [Google Scholar]
- 17.Oosterwijk E, Bander NH, Divgi CR, et al. (1993) Antibody localization in human renal cell carcinoma: a phase I study of monoclonal antibody G250. J Clin Oncol 11:738. [DOI] [PubMed] [Google Scholar]
- 18.Pryma DA, O’Donoghue JA, Humm JL, et al. (2011) Correlation of in vivo and in vitro measures of carbonic anhydrase IX antigen expression in renal masses using antibody 124I-cG250. J Nucl Med 52(4):535–540 [DOI] [PubMed] [Google Scholar]
- 19.Doss M, Kolb HC, Walsh JC, et al. (2014) Biodistribution and radiation dosimetry of the carbonic anhydrase IX imaging agent [(18) F]VM4-037 determined from PET/CT scans in healthy volunteers. Mol Imaging Biol 16(5):739–746 [DOI] [PMC free article] [PubMed] [Google Scholar]
- 20.Surti S, Kuhn A, Werner ME, et al. (2007) Performance of Philips Gemini TF PET/CT scanner with special consideration for its time-of-flight imaging capabilities. J Nucl Med 48:471–480 [PubMed] [Google Scholar]
- 21.Shuch B, Singer EA, Bratslavsky G (2012) The surgical approach to multifocal renal cancers: hereditary syndromes, ipsilateral multifocality, and bilateral tumors. Urol Clin North Am 39:133. [DOI] [PubMed] [Google Scholar]
- 22.Makis W, Ciarallo A, Rakheja R, et al. (2012) Spectrum of malignant renal and urinary bladder tumors on 18F-FDG PET/CT: a pictorial essay. Clin Imaging 36:660. [DOI] [PubMed] [Google Scholar]
- 23.Bouchelouche K, Choyke PL (2015) PET/computed tomography in renal, bladder, and testicular cancer. PET Clin 10(3):361–374 [DOI] [PMC free article] [PubMed] [Google Scholar]


