

Abstract
Over the last few years, cancer immunotherapy experienced tremendous developments and it is nowadays considered a promising strategy against many types of cancer. However, the exclusion of lymphocytes from the tumor nest is a common phenomenon that limits the efficiency of immunotherapy in solid tumors. Despite several mechanisms proposed during the years to explain the immune excluded phenotype, at present, there is no integrated understanding about the role played by different models of immune exclusion in human cancers. Hypoxia is a hallmark of most solid tumors and, being a multifaceted and complex condition, shapes in a unique way the tumor microenvironment, affecting gene transcription and chromatin remodeling. In this review, we speculate about an upstream role for hypoxia as a common biological determinant of immune exclusion in solid tumors. We also discuss the current state of ex vivo and in vivo imaging of hypoxic determinants in relation to T cell distribution that could mechanisms of immune exclusion and discover functional-morphological tumor features that could support clinical monitoring.
Keywords: Hypoxia, Immune exclusion, Tumor microenvironment, Physical barriers, Functional barriers, Dynamic barriers, Imaging
Background
Over the last few years, cancer immunotherapy has experienced significant developments and is considered a promising therapeutic frontier against various types of cancer. Cell-based therapies could be encouraging strategies to eradicate cancer: chimeric antigen receptor T cells (CAR-T) and tumor infiltrating lymphocytes (TIL) are routinely expanded ex vivo and administered to patients. The most significant clinical responses have been obtained in haematological malignancies, using CAR-T lymphocytes engineered to recognize the CD19 antigen on neoplastic B cells [1–3]. Advanced clinical trials have also demonstrated promising results in various types of solid tumors [4–7]. Checkpoint blocking antibodies have been approved for the treatment of melanoma, head and neck squamous cell carcinoma, non-small lung cancer, urothelial bladder cancer and Hodgkin lymphoma [8–13].
Immunotherapy is particularly effective when applied for the treatment of cancers with an unstable genetic profile demarcated by high mutational burden. Previous studies have shown that neo-antigens are expressed by tumor cells and can be used as therapeutic targets [9, 14–16]. However, various challenges limit the efficacy of immunotherapy including a low mutational burden and low infiltration of CD8+ T lymphocytes into certain tumor areas [17, 18]. These obstacles limit the applicability of immunotherapies in a wide range of cancer types.
Spatial-functional orientation and density of CD8+ T cells within the tumor, have been shown to be directly associated with immunotherapy response and patient prognosis across many types of cancer [19–25]. Infiltration of immune cells can be detected by staining tissue samples with hematoxylin and eosin, or via immunostaining. Three topographies have currently been defined based on the distribution of T lymphocytes in the tumor: immune active (hot), immune desert (cold), and immune excluded. Hot tumors are enriched in CD8+ T cells while cold tumors may present with other immune populations or myeloid cells. Immune excluded tumors present cancer cell nests surrounded by T cells, which are incapable of penetrating inside [24, 26–29]. Although this classification is largely accepted, it is backed by little quantitative data about the relative frequencies of the three immune landscapes across cancers of different derivation.
The introduction of immunological biomarkers into tumor classification is currently under development. The Society for Immunotherapy of Cancer (SITC) Immunoscore Validation Project is a global and collaborative effort to validate a set of prognostic immune parameters centered predominantly on CD8+ T cell infiltration. These markers constitute the Immunoscore of a tumor as the objective calculation of T cells within a determined area that combines both intra-tumoral and per-tumoral infiltrates. This parameter could be used beyond its prognostic value also as a main predictor for the efficacy of cancer immunotherapies [30]. The Immunoscore project led to a multi-national immunohistochemistry study published in 2018, which reported the validation of a robust prognostic scoring system for the classification of colon cancer [26].
Transcriptional signatures, such as the immunologic constant of rejection (ICR) or the tumor inflammation signature (TIS), also demonstrated the importance of immune predictive biomarkers adding a functional dimension to the morphological parameters determining the Immunoscore [30–34]. A recent pan-cancer analysis highlighted the ICR signature as a predictive value in patients treated with anti-CTLA4 immune checkpoint inhibition [35]. However, further morphological and transcriptional studies are necessary to provide a deeper insight into the immune excluded phenotype.
Immune excluded tumors may occur as a result of several underlying mechanisms and present a considerable challenge for immunotherapy. Yet, they represent a unique model system, being different from homogeneously infiltrated tumors, as they present gradients of exclusion. Such gradients are peculiar within each tumor environment and possibly not present in silent tumors. In cold tumors instead, lack of chemo-attraction may constitute a predominant phenotype rather than the presence of barriers [36].
The variety of determinants potentially involved in immune exclusion suggested according to the literature, can be organized into three main groups: physical barriers, functional barriers and dynamic barriers. Physical or mechanical barriers include all mechanisms that prevent T cells from engaging with cancer cells, including structural components of the tumor microenvironment, vascular access and cancer cell coating [37]. In some cases, T lymphocytes may reach the tumor but metabolic barriers, soluble factors or tumor cell-intrinsic signaling impede their penetration and expansion into the tumor core. These are functional barriers. Finally, dynamic barriers may not be present in baseline conditions but are elicited only after the contact between T cells and cancer cells. An example for this kind of barrier is the inducible activation of PDL-1 in response to IFN-γ signaling [38–40].
At present, it is not clear if a predominant biology is responsible for most immune excluded cases, or if a synergy of random factors could better explain this complex phenomenon [18]. Moreover, a direct correlation has not been observed between tumor stages and the prevalence of a certain immune exclusion mechanism over another. In this review, we speculate on an upstream role played by hypoxia as a common biological determinant of immune exclusion. Hypoxia may be the initial triggering factor for most of the known mechanisms of immune exclusion. We also discuss the current state of ex vivo and in vivo imaging of hypoxic determinants and T cell distribution. Ex-vivo methods could facilitate the interpretation of spatial and temporal dynamics between these two parameters and elucidate if a specific sequential pattern is prevalent in most immune excluded tumors. In-vivo methods could be applicable in clinical settings, to monitor the efficacy of immunotherapy in hypoxic solid tumors.
Molecular mechanisms involved in cell response to hypoxia
In normal physiological conditions, the partial oxygen pressure of a tissue is called physioxia. Depending on the tissue, it ranges from 8 to 100 mmHg (Table 1). For example, in venous blood the partial oxygen pressure is 30-40 mmHg while in arterial blood is 75–100 mmHg [41].
Table 1.
Reference values of pO2 measurements in different human tissues
| Human tissue | pO2 (mmHg) | References |
|---|---|---|
| Air | 160 | |
| Arterial blood | 75–100 | [434–436] |
| Venous blood | 30–40 | [436, 437] |
| Brain | 39 ± 9 | [438–442] |
| Lung | 42.8 | [443] |
| Liver | 55.5 ± 21.3 | [444–446] |
| Kidney | 72 ± 20 | [447] |
| Muscle | 29.2 ± 1.8 | [448–452] |
| Skin epidermis | 8 ± 3.2 | [452, 453] |
| Small bowel | 61.2 | [452, 454, 455] |
| Large bowel | 57.6 | [452, 454, 455] |
| Bone marrow | 51.8 ± 14.5 | [456] |
| Ovaries | 88 | [457] |
| Cornea | 30.6 ± 3.1 | [458] |
| Femur Bone | 34 ± 1.6 | [459] |
Hypoxia is an environmental condition that occurs when the demand for oxygen exceeds supply and values of partial oxygen pressure in a tissue drop below physioxia. Normoxia is defined as the partial oxygen pressure normally present in the environment (21% of oxygen corresponding to 160 mmHg).
Hypoxia normally occurs during development: mammalian embryogenesis occurs at low oxygen concentrations (1–5%) and the gradient of oxygen itself functions as morphogen in many developmental systems [42, 43]. Hypoxia is also linked to many medical conditions including myocardial infarction, ischemic or hemorrhagic brain stroke, transient ischemic attack and late stages of some neurodegenerative diseases [43–47].
Hypoxic areas are present in most solid tumours, as cellular proliferation outgrows the blood supply, and often contain regions where the concentration of oxygen is lower than 5 mmHg [48–50]. Diffusion of oxygen to the tissues occurs at an average distance of 100–170 µm from the capillary itself, therefore solid tumors need to become angiogenic to grow beyond 1–2 mm in diameter [51–55]. Highly proliferative tumors accumulate a subpopulation of cancer cells distant from the blood vessels; even when tumor neo-angiogenesis occurs, it is structurally and functionally abnormal, and cancer cells experience chronic hypoxia. Acute hypoxia is transient and can be caused by the mechanical pressure exerted by fast growing tissues on existing blood vessels or by temporary fluctuations in blood perfusion in newly formed vessels. These phenomena lead to a metabolically heterogeneous tumor microenvironment [56–62].
These environmental conditions create a strong selective pressure on cells, favoring the growth of more aggressive tumor clones. Hypoxia is generally clinically associated with poor prognosis across multiple tumor types and is also one of the main causes of resistance to therapy. Hypoxic tumors are generally more aggressive, with increased metastatic potential and reduced apoptosis [59, 60, 63–66].
A compelling understanding of the molecular mechanisms involved in the hypoxic response has been cemented in the last 25 years. A family of heterodimeric transcription factors called Hypoxic Inducible Factors (HIFs) is responsible for the maintenance of cellular homeostasis during hypoxic conditions. They consist of an α (HIF-α) and a β (HIF-β or ARNT) subunit. There are three HIFα isoforms: HIF1-, HIF2- and HIF3-α. Therefore HIF-1, for example, is constituted by HIF-1α and HIF-1β. HIF proteins bind to Hypoxia Regulated Elements (HREs), canonical DNA sequences in the promoters or enhancers regions, activating the expression of more than 100 genes [67–69].
Under normal oxygen tension, HIF-α subunits are expressed but rapidly degraded resulting in minimal levels of detectable HIF proteins (Fig. 1a). Distinct proline sites, within the oxygen degradation domain (ODD) of HIF-α, are hydroxylated by a family of oxygen-dependent prolyl hydroxylases (PHDs). Hydroxylated HIF-α is recognised by the von-Hippel Lindau tumor suppressor (pVHL), leading to HIF-α poly-ubiquitination and subsequent degradation by the 26S proteasome [70–73]. Under hypoxic conditions HIF-α is no longer hydroxylated but it dimerizes with the constitutively expressed HIF-β (Fig. 1b). The heterodimer enters the nucleus and binds to HREs to upregulate transcription of a group of hypoxic responsive genes [68, 69, 74–78]. The HIF signaling pathway is activated not only by hypoxia but also by mutations that inactivate tumor suppressor genes such as VHL. Loss of function of the VHL protein causes an autosomal dominant hereditary disorder characterized by clear cell renal carcinoma, retinal, cerebellar and spinal hemangioblastoma and a multitude of visceral tumors. Somatic VHL mutations have also been implicated in sporadic renal carcinoma, accounting for approximately 80% of adult sporadic tumors [79–81]. The HIF pathway is also activated by increased activity of the phosphoinositol 3-kinase (PI3K) and mitogen-activated protein kinase (MAPK) signalling cascades [82–84].
Fig. 1.

Mechanisms of HIF-1α protein stabilization in hypoxia and degradation in normoxia. a Under normal oxygen tension, HIF-α subunits are expressed, hydroxylated by a family of oxygen dependent prolyl hydroxylases (PHDs), recognised by the von-Hippel Lindau tumor suppressor (pVHL) which leads to HIF-α poly-ubiquitination and subsequent degradation by the 26S proteasome. b Under hypoxic conditions HIF-α is no longer hydroxylated but it dimerizes with the constitutively expressed HIF-β, enters the nucleus and binds to HREs to upregulate transcription of a group of hypoxic responsive genes. c Extensive modifications in chromatin structure, both HIF dependent and independent, also promote gene silencing
PI3K and MAPK signalling cascades can regulate HIF-1α under normoxic conditions. The MAPK pathway is required for HIF-1α transactivation activity while PI3K can increase its mRNA translation through mechanisms dependent or independent on the mammalian target of rapamycin (mTOR) [85–88]. Another mechanism triggering the stabilization of HIF proteins is mediated by the intracellular increase in reactive oxygen species (ROS). ROS levels increase during acute and chronic hypoxia and are also a side effect of chemotherapy. This could represent one of the numerous mechanisms involved in tumor refractoriness to cytotoxic therapies [89].
HIF proteins activate the transcription of genes involved in stem cell maintenance [90], apoptosis, cell immortalization, epithelial to mesenchymal transition [91], genetic instability [92], erythropoiesis and angiogenesis [93], glycolysis [94], pH regulation [95], immune evasion [96], invasion and metastasis [97] and radiation resistance [43, 98]. The relationship between these transcriptional modifications and the immune excluded phenotype will be discussed in the next section.
HIF-1α and HIF-2α are structurally similar, with the exception of the transactivation domain. HIF-1α generally binds HREs close to gene promoters while HIF-2α targets transcriptional enhancers [68, 74, 99–102]. This could explain why, despite binding identical HRE sequences, they have both overlapping and unique target genes. The isoform specificity influencing the outcome of the transcriptional programs has been investigated in several studies and found to vary depending on cell type, genetic background, severity and duration of hypoxia [103–107]. While HIF-1 plays a major role in glycolytic gene regulation, HIF-2 is mainly involved in pluripotent stem cell maintenance and angiogenesis, enhancing the pro-tumorigenic phenotype [108–110]. HIF-1α is mainly expressed during acute hypoxia (in the first 24 hours) in all tissues, while HIF-2α is stabilized later and its expression is limited to specific tissues [110–112]. Although the expression of HIF-3α is detectable in a variety of human cancer cell lines, it has been less investigated. HIF-3α lacks a transactivation domain, suggesting that this form possesses a suppressive effect toward the other HIF isoforms [113–116].
Interestingly, under hypoxic conditions, there are also substantial HIF-independent changes in global gene transcription. Vast transcriptional repression forms a significant component of the hypoxic response which is mediated, in part, by at least ten different transcriptional repressors [117, 118]. Extensive modifications in chromatin structure, both HIF dependent and independent, promote gene silencing (Fig. 1c). High-throughput RNA-seq of human embryonic kidney cells revealed 851 and 1013 genes induced and repressed in hypoxia, respectively [117]. Transcriptomic studies in kidneys from ischemic mice revealed that 642 genes were induced, while 577 were repressed [118].
Downregulated genes include those coding proteins associated with oxidative phosphorylation, transcription, translation and mRNA processing, intercellular junctions and DNA repair pathways. These latter include BRCA1, BRCA2, RAD51 genes, and genes involved in mismatch repair and nucleotide excision repair [119–121]. Their transcriptional and translational repression leads to moderate hypoxia-driven genomic instability [122–125]. DNA replication stress is also a HIF-independent phenomenon triggered by hypoxia and it is caused by a decreased activity of oxygen-dependent replication enzymes [126]. During transient episodes of re-oxygenation, hypoxic cells may undergo further DNA damage as a result of a burst of free radicals [127, 128]. Studies published so far demonstrate how diverse and important the changes associated with the transcriptional landscape in hypoxia are, and how the metabolic traits of cells experiencing hypoxia are profoundly impacted.
Hypoxia as an upstream determinant in immune excluded phenotypes
Hypoxia occurs during cancer development, primarily because cellular proliferation outgrows its blood supply. Hypoxia response does not translate in a random activation of cellular pathways which are responsible to keep homeostasis, but it is responsible for an organized and evolutionary-established progression of events [43].
Despite HIF-1 and HIF-2 sharing a pool of target genes, there are other genes specifically upregulated by HIF-1 or HIF-2. As mentioned before, other differences between the two proteins include their kinetics of expression; stabilization of HIF-1 occurs in the first phases of hypoxia (acute) leading to upregulation of genes mainly involved in cell metabolism and angiogenesis, while HIF-2 is generally stabilized later (chronic). Their stabilization is also tissue dependent [101–105].
This background provides some rationale for the importance of having a spatial and temporal topographic map of the correlation between hypoxic phenotypic expressions and immune exclusion in different types of cancer.
Mechanical barriers
Mechanical barriers represent a category of determinants of immune exclusion, where lack of interaction between T cells and cancer cells occurs due to physical impediments. These impediments include vascular accessibility, stromal fibrosis and cancer cell coating (Fig. 2).
Fig. 2.

Hypoxia-induced mechanical barriers. Mechanical barriers represent a category of determinants of immune exclusion where a lack of interaction between T cells and cancer cells is due to physical impediments. Hypoxia induced-mechanical barriers include neoangiogenesis (vascular accessibility), ECM remodeling (stromal fibrosis, collagen remodelling and crosslinking), EMT and cancer cell coating
Through upregulation of HIF-induced genes, cancer cells produce pro-angiogenic factors, affecting the equilibrium between pro- and anti- angiogenic factors in the tumor microenvironment (TME). The newly formed vessels are often structurally and morphologically aberrant: leaky, tortuous, compressed or dilated. The consequence is the development of a pro-tumorigenic environment with a spatial-temporal heterogeneity in blood flow. Blood vessels anomalies lead to increased blood viscosity, reduced flow, enhanced hypoxia, acidosis, high interstitial fluid pressure and immunosuppressive TME [54, 129–132]. This plethora of conditions play a pivotal role in affecting T cell delivery and fitness into the tumor core and thus the clinical response to immunotherapy [133–135].
HIF-1 increases angiogenesis and vascular permeability by upregulating a variety of angiogenetic factors including those belonging to the VEGF-family, angiopoietin-2 (Ang-2), transforming growth factor beta (TGF-β), platelet-derived growth factor B (PDGFB), placental growth factor (PGF), connective tissue growth factor (CTGF), stem cell factor (SCF), stromal cell-derived factor 1 (CXCL12), leptin, endoglin, nitric oxide synthase 2, haemoxygenase-1 and endothelin-1 (ET-1) [136–142]. It has been shown that HIF-2 upregulates VEGF receptor-2 [143] and the endothelial receptor tyrosin kinase Tie-2 [69].
ET-1 is a vascular regulator peptide, which promotes angiogenesis directly and indirectly. However, HIF-1 binding to ET-1 promoter is not sufficient and transcriptional activation requires binding of activator protein-1 (AP-1), GATA-2, and CAAT-binding factor (NF-1) [144]. ET-1 acts through two G-protein coupled receptors: Endothelin A and B receptors. It has been shown that ET-1 promotes neo-angiogenesis and increases vascular permeability through Endothelin B receptor activation [145]. The result is the increased survival and proliferation of endothelial cells and the upregulation of VEGF factors. Evidence shows a positive correlation between ET-1 and VEGF expression in a variety of different tumors [144, 146, 147]. Transcriptional profiling of micro-dissected tumor endothelial cells revealed that overexpression of the Endothelin B receptor is associated with the absence of tumor-infiltrating lymphocytes and worse prognosis in patients with ovarian cancer [148].
VEGF is also produced by endothelial cells, fibroblasts and inflammatory cells and it has been implicated in fibrosis as well. VEGF induces the reorganization of the extra-cellular matrix (ECM) through activation of stromal cells and induction of fibronectin and collagen type-I [149]. Angiogenic factors also contribute to fibrosis, attracting fibroblasts or activating resident fibroblasts. This normally occurs during wound healing, when angiogenesis and ECM deposition happen concomitantly [150].
A variety of cytokines secreted by cancer cells, and other stroma cells, is responsible for fibroblast recruitment and activation: epidermal growth factor (EGF), platelet-derived growth factor (PDGF), fibroblast growth factor 2 (FGF2), CXCL12 and TGF-β are key regulators of fibroblast recruitment and activation [151–158]. In hypoxia, HIF proteins and TGF-β are reciprocally induced, in a positive feedback loop. TGF-β is a main player in the activation of recruited and resident myofibroblasts and fibroblasts in the primary tumors, transforming them in cancer-associated fibroblasts (CAFs) [153]. CAFs are morphologically different from normal fibroblasts and posses increased proliferative and migratory potential. CAFs are responsible for the production of fibrous material and the secretion of cytokines, playing multiple roles in the TME. In addition, they contribute to angiogenesis, ECM remodeling, metastasis, metabolic reprogramming and immune regulation. Therefore, CAFs actively contribute to the development of mechanical and functional barriers [151, 159–162].
Studies on CXCL12, which is mainly secreted by CAFs, demonstrated its dual role as functional and physical barrier. CXCL12 plays a role in tumor growth, angiogenesis, immune suppression and invasion [142, 163]. However, recent evidence showed how this cytokine could have a role as a physical barrier in pancreatic ductal adenocarcinoma (PDA). PDA-bearing mice display reduced response to immunological checkpoint antagonists because CXCL12 could coat cancer cells and shield them from T cells [164, 165].
CXCL12 is also one of the chemokines involved in epithelial-mesenchymal transition (EMT) in different types of cancer [166, 167]. EMT is a process through which epithelial cells gain migratory and invasive properties, detaching from the basement membrane and acquiring properties similar to mesenchymal stem cells. This process is driven by inflammatory cytokines and it is also responsible for the development of mechanical barriers [37, 168]. Hypoxia-induced cytokines, which trigger EMT, also include tumor necrosis factor α (TNF-α), TGF-β, interleukin 1 (IL-1), interleukin-6 (IL-6) and interleukin-8 (IL-8). Cytokines are secreted by cancer cells, myeloid cells and mesenchymal cells. In many carcinomas, together with TGF-β and interleukins signaling, hepatocyte growth factor (HGF), basic fibroblast growth factor (bFGF), epidermal growth factor (EGF) and PDGF also play a role in the induction of transcription factors responsible for EMT progression [169].
It is common knowledge that tumor stroma presents increased hypoxia-dependent stiffness due to the increased secretion of fibrous material and collagen-modifying enzymes. Collagens constitute up to 90% of the ECM and the most prevalent ECM alteration in tumors is, indeed, an increase in collagen deposition. It has been demonstrated that in breast tumors the stroma can be up to ten times stiffer than in normal tissue, with an increase in cross-linked collagen fibers and other ECM components [170–174]. Transcription factors responsible for the synthesis of ECM components and remodeling enzymes are zinc finger E-box binding homeobox 1 and 2 (ZEB1, ZEB2) proteins, Snail, Slug, Twist, Goosecoid, and FOXC2. Collagen crosslinking is initiated in the extracellular compartment by a family of secreted enzymes called LOX. In different cancer cell lines, HIF proteins upregulate different members of the LOX family and all of them have been shown to be involved in tumor fibrosis [175–177].
Another mechanism of hypoxic-induced fibrosis is the upregulation of PLOD1, PLOD2 and P4HA1, P4HA2 genes which encode for proteins that are necessary for the biogenesis of collagen. This mechanism also includes increased production of procollagen lysyl and prolyl hydroxylases, respectively. These genes are not exclusively induced in cancer cells, but also in fibroblasts, chondrocytes and endothelial cells. Increased expression of PLOD2 in breast cancer and sarcomas has been associated with tumor stiffness and increased metastatic potential [178, 179]. Depletion of HIF-1, but not HIF-2, inhibited collagen deposition in vitro, and decreased tissue stiffness in orthotopic tumors [180–183]. Collagen degradation is also a part of the TME remodeling, and matrix metalloproteinases (MMPs) are responsible for this process. HIF-1 is associated with transcriptional upregulation of MMP2 and MMP9 in vitro.
Overall HIF factors reshape the transcriptional landscape of ECM, resulting in the increase of fibrillar collagens and degradation of the basement membrane. ECM remodeling leads to increased stiffness which influences the bioavailability of signaling molecules and the accessibility of T cells. In correlation with these findings, is the reduced infiltration of CD8+ T cells, which was observed in breast tumors with high collagen-density. Transcriptome analysis of 3D-cultured T cells on high density matrix showed downregulation of cytotoxic markers suggesting reduced engagement with antigen-bearing cancer cells [184].
A recent publication by Salerno et al., revealed that human melanoma and ovarian cancers lacking a Th1-polarized immune signature display upregulation of genes encoding for mechanical barrier function in the skin. Filaggrin (FLG), tumor-associated calcium signal transducer 2 (TACSTD2) and six desmosomal proteins (DST, DSC3, DSP, PPL, PKP3, and JUP) were upregulated, but the most upregulated one was Flg [37]. Interestingly, it has been previously demonstrated that expression of Flg is upregulated in a HIF-1- and HIF-2-dependent manner [185].
Functional barriers
Functional barriers represent a class of impediments in which T cells engage with cancer cells but their activity is impaired. Mechanisms such as metabolic barriers, soluble factors, danger sensing pathways and/or cell-intrinsic signaling affect T cell penetration and expansion in the tumor nests (Fig. 3).
Fig. 3.

Hypoxia-induced functional barriers. Functional barriers represent a class of impediments in which T cells are in close proximity with cancer cells, but their activity is impaired. Hypoxia-driven functional barriers include metabolic barriers, secreted soluble factors, danger sensing pathways and/or cell-intrinsic signaling
Metabolic barriers
Nutrient depletion of the TME by cancer cells represents a classic example of a mechanism leading to metabolically-determined functional barriers. Moreover, a shift of cellular metabolism from oxidative to glycolytic occurs almost universally in cancers and it is known as the Warburg effect. Although this phenomenon has been described initially in cancer cells, it has also been observed in normal, but rapidly proliferating cells [186, 187]. Interestingly, cancer cells generally exhibit higher glucose metabolism, even when oxygen levels are comprised in a physiological range [188].
In response to hypoxia, HIF-1 orchestrates an evolutionary conserved response regulating oxidative metabolism. The transition from oxidative to glycolytic metabolism occurs when oxygen levels become limiting for mitochondrial ATP production. HIF-1 upregulates the enzymes glucose transporters (GLUTs) 1–3 to maintain cellular ATP pools [189–191]. GLUTs overexpression in solid tumors is correlated with poor prognosis and found in a variety of malignant neoplasms [192]. HIF-1 is also responsible for the upregulation of enzymes involved in glycolysis, such as pyruvate dehydrogenase kinase 1 (PDK1) which phosphorylates and inactivates the pyruvate dehydrogenase. Other proteins upregulated in hypoxia are lactic dehydrogenase A (LDHA) and pyruvate kinase M2 subtype (PKM2). Increased glycolysis leads to the production of pyruvate, which is subsequently converted into lactate [193].
Lactate, responsible of lowering intracellular pH, is exported to the ECM via mono-carboxylate transporters (MCTs are upregulated), leading to the acidification of the ECM. In the TME, lactate can reach concentrations of 20-30 mM, compared to 3 mM in normal tissues [194, 195]. High lactate concentration decreases T and NK cell function and survival and extracellular acidification is one of the causes leading to T cell immune response impairment [196, 197]. Other pH regulating enzymes, that are induced in hypoxic conditions, include carbonic anhydrases (CAs), Na+/H+ exchanger (NHE1), bicarbonate transporters (SLC4A4) and indoleamine 2,3 dioxygenase (IDO). These enzymes are responsible for the acidification and tryptophan depletion of the TME, which suppress T cell activity [95, 198–201].
In addition to glucose, essential amino acids can also be deprived from the TME. Myeloid-derived suppressor cells produce arginase [202, 203], while CAFs can process tryptophan leading to the downstream production of kyurenine, a suppressive metabolite [204, 205]. However, controversial evidence has been reported regarding tryptophan metabolism. Schmidt et al., showed in different human cell lines that hypoxia leads to a decrease in IDO expression which causes reduced production of kynurenine [206]. Recent studies have demonstrated how an alternative pathway via tryptophan-2,3-dioxygenase (TDO2) is also responsible for suppressing antitumor immune response in a variety of cancers [207]. Another study has shown that HIF-1 inhibits the expression of TDO2 in glioblastoma and hypoxic conditions increase T cell proliferation [208].
A further determinant which can act as a functional barrier to T cell activity is the lack of extracellular glutamine [209, 210]. T cells and cancer cells proliferation is associated with increased consumption of glutamine. Glutaminase 1 (GLS1) is a mitochondrial enzyme which hydrolyzes glutamine into glutamate and provides carbon and nitrogen crucial for anabolic metabolism and thus for rapid cell proliferation. It has been demonstrated that downregulation of glutamine and leucine metabolism inhibits the differentiation of TH1 and TH17 effector lymphocytes while maintaining T reg differentiation [211].
Xiang et al., demonstrated that HIF-1 binds directly to GLS1 promoter, inducing this gene in hypoxic colorectal cancer cells and increasing glutamine conversion to glutamate [212]. Hypoxia-induced transcriptional changes lead to a decrease in the extracellular concentration of glutamine, which plays a role in T cell regulation and activation [211, 213] .
Chronic hypoxia leads also to downregulation of Kv1.3, which is a classical Shaker-type potassium channel with six transmembrane segments in a variety of different cell lines [214]. Hypoxia has been reported to promote both, acute and long-term inhibition of Kv1.3 in T lymphocytes [215, 216]. Therefore, it is not unusual to detect elevated extracellular potassium concentrations in solid tumors. An ionic misbalance may lead to a state of functional caloric restriction in T cells triggering a starvation response, with T cells retaining stemness.
T cells rely on glycolysis to proliferate and secrete cytokines and cytotoxic mediators. Therefore, low pH, low glucose and reduced amino acid presence lead to T lymphocytes exhaustion. Exhausted T cells undergo metabolic and functional impairments, display mitochondrial dysfunction, high levels of co-inhibitory receptors (PD-1, CTLA-4, Tim-3, lymphocyte activation gene-3) and low proliferative capacity.
Soluble factors and danger sensing pathways
Compelling reviews have recently been published, summarizing the contribution of hypoxia in cytokine mediated immunosuppression [217, 218] and it is not the aim of this review to describe in detail such phenomenon. Briefly, hypoxia is a major suppressor of the immune system, altering the expression of cytokines, recruiting suppressive cell populations and expressing co-inhibitory ligands.
HIF-1 induces the secretion of a variety of chemokines responsible for myeloid cell recruitment, such as CCL5 and CXCL12 by cancer cells [219, 220]. Moreover, the expression of CXCR4 by myeloid and tumor cells is also regulated by HIF proteins [221]. VEGF, Sema3A, CCL28, endothelin 1 and 2 secretion is induced in hypoxia and they act as chemo-attractants for monocytes, macrophages and T regulatory cells (T regs) [222–226]. TGF-β is a pivotal player in the immune surveillance mechanism, acting directly and indirectly to restrict and modulate T cell trafficking [227]. As mentioned in the previous section, TGF-β secretion is induced by HIF-1 creating a positive feedback. Indeed, in hypoxia, immune suppressive populations such as T regs, tumor-associated macrophages (TAMs) and myeloid-derived suppressor cells (MDSCs) prominently infiltrate the tumor site, reducing the access of cytotoxic T cells and natural killer cells. Hypoxia also enhances the synthesis of CD39 and CD73 enzymes, which are important factors in the immunosuppressive mechanism involving adenosine production in the TME [228–230]. Adenosine is produced by hydrolysis of tumor cell derived ATP and ADP, and released in the TME through membrane channels, cell death or granular components. Adenosine receptors on T cells are transcriptionally induced by HIF-1 and HIF-2 in hypoxia, leading to the accumulation of immunosuppressive intracellular cAMP [64, 231].
Siemens et al., reported that hypoxia induces downregulation of different molecules, necessary for effector immune cells recognition. Therefore, tumor cells render themselves virtually invisible to cytotoxic T lymphocytes [232]. In vitro, hypoxic tumors can downregulate expression of major histocompatibility class-I (MHC-I) molecules reducing the recognition by cytotoxic T cells [233]. In vivo studies demonstrated that hypoxia leads to the inhibition of IFN-γ–dependent MHC class I upregulation. Such phenomenon occurs concomitantly with CXCL9 and CXCL10 transcriptional downregulation and it is reversible upon re-oxygenation [234]. In hypoxia, another functional barrier is created by the upregulation of immune checkpoint molecules (CTLA-4, PD-L1, HLA-G). It has been demonstrated that the PTEN/PI3K pathway through HIF-1 is responsible for this phenotype, in several different mouse and human tumor cell lines [218, 235–240].
Finally, TAM receptor kinases and “Don’t eat-me” signals (CD47/signal regulatory protein (SIRP)-α axis) constitute another example of functional barriers. In triple-negative breast cancer cells and in pancreatic adenocarcinoma HIF-1 induces the expression of CD47, leading to escape from immune surveillance [241–243]. Interaction of CD47 with SIRPα causes the block of pro-phagocytic signals and tumor cells escape from macrophages and MDSC mediated phagocytosis. Inhibiting phagocytosis has an anti-inflammatory role, through the activation of innate immune effector cells [244, 245].
TAM receptors such as Tyro3, Axl and Mertk are a family of transmembrane receptor tyrosine kinases which coordinate immune cell activity by promoting the phagocytosis of apoptotic cells. TAM receptors bind to eat-me signal phosphatidylserine displayed on apoptotic cell membranes, with the help of bridging ligands Gas6 and ProteinS. TAM receptors share overlapping functions in tumorigenesis and suppression of anti-tumor immune response [246, 247]. Several studies showed that TAM receptors are involved in the hypoxic response. For example, HIF proteins transcriptionally upregulate Axl in clear cell renal carcinoma [248]. Hypoxia is also responsible for stabilizing GAS6/Axl signaling in metastatic prostate cancer [249]. Tyro3 play a role in promoting survival of neurons and brain endothelial cells exposed to hypoxia and other stressors [250–253]. Activation of these tyrosine kinases is generally coupled to the downstream activation of the PI3K/AKT pathway or the Janus kinase (JAK)-signal transducer and activator of transcription (STAT) pathways. Differential activation of these two signaling cascades may lead to the regulation of distinct TAM-associated functions [246, 254–256]. Finally, Mertk knockout mice present with increased CD8+ T cell infiltration and higher levels of inflammatory cytokines (IL-12 and IL-6) levels. Change in cytokine expression may be responsible for the polarization of the TME toward an immune responsive type [247, 257].
Tumor cell-intrinsic signaling
A variety of oncogenic tumor-intrinsic pathways could be related to the immune excluded phenotype. A few examples will be given for those that present higher proofs of correlation with hypoxia and the excluded phenotype. Hypoxia induces NF-κB activation in different tissues, and it seems that a positive regulatory loop between HIF-1 and NF-κB exists, which may be cell line dependent [258–262]. NF-κB is a transcription regulator and its constitutive activation is considered as a hallmark of tumors. NF-κB mediates EMT, in cooperation with TGF-β, and shapes cancer stem cells (CSCs) features [263, 264]. Generally, the NF-κB signaling pathway promotes the secretion of cytokines that regulate immune response (e.g., TNFα, IL-1, IL-6, and IL-8) as well as adhesion molecules responsible for the regulation of leukocyte recruitment [265].
NF-κB inhibitor DHMEQ reversed the immunosuppression of human dendritic cells and macrophages cultured in the supernatant of epithelial ovarian cancer cells [266]. Evidence regarding NF-kB in a cancer context are controversial, as it has been shown that NF-κB can trigger production of chemokines necessary to recruit activated T lymphocytes to the tumor site [267, 268]. The biological significance of NF-kB signaling could be dependent on the cellular composition of cancers.
STAT3 is a transcriptional factor which cooperates with HIF-1 in activating hypoxic target genes. This has been shown in a variety of cell lines [269, 270]. The STAT3 signaling pathway is associated with tumor growth and reduction of T cell infiltration [271]. Blocking the STAT-3 pathway in tumor cells results in tumor-specific T cell responses due to the increase in the expression of pro-inflammatory cytokines and chemokines [272]. STAT3-HIF-1 signaling also enhances EMT in esophageal cancer and promotes immunosuppression through M2 polarization in glioblastoma [273, 274]. Moreover, Ihara et al., reported increased immune response in the absence of STAT3 dependent signaling associated with an increase in CCL5 and CXCL10 [275].
Similarly, for STAT3, β-catenin can interact with HIF proteins promoting adaptation to hypoxia. A variety of non-inflamed tumors show WNT/β-catenin signaling pathway activation and in vivo experiments in melanomas proved that activation of the β-catenin signaling can dominantly exclude immune cell activation [276, 277]. In addition, β-catenin-overexpressed by melanomas inhibits the production of IFN-γ by melanoma-specific cytotoxic lymphocytes, in an IL-10-independent manner [278] .
The PI3K/AKT/mTOR pathway is found to be active in most tumors. PI3K activation can be due to increased expression of growth factor receptors (such as EGFR), RAS mutation or loss of PTEN [279–281]. Loss of PTEN function increases PD-L1 expression and consequent immune resistance, in gliomas [282]. Moreover, deletion of PTEN in mouse models of sarcomas and prostate cancer demonstrated that it plays a role in tumor progression causing the infiltration of myeloid-derived hematopoietic cells [283–285]. However, constitutive PI3K activation due to loss of PTEN in triple-negative breast cancer is associated with the infiltration of T lymphocytes in the TME [286].
Interestingly, the HIF-1 protein level can be regulated by activation of the EGFR/PI3K/AKT/mTOR pathway, leading to a hypoxia-mimicking phenotype [287]. Activation of the PI3K/AKT/mTOR signaling cascade triggers, via HIF-1 dependent and independent mechanisms, the secretion of VEGF proteins. Furthermore activation of PI3K leads to secretion of TNF, IL-6, CSF-1, VEGF-A, and IL-8 contributing to immunosuppressive cell recruitment and accumulation, such as TAMs [288–290].
PI3K/AKT signaling is vital for cell and survival but it seems to be also involved in cancer cell stemness maintenance [291]. Cancer stem cells normally represent a small population in the tumor, and they are mainly associated with the immune silent phenotype, in the hypoxic niche. HIFs protein stabilization is responsible for the adoption of stem cell properties, including multipotency and self renewal [292]. During cancer progression, stemness of cancer cells is maintained by hypoxia through different mechanisms, including enhancement of EMT and the transcriptional induction of stemness related genes (Oct4, POU5F1, Sox2, Nanog, BMI1, Myc and KLF4) [293–295]. Signaling cascades responsible to maintain stem-like features are also upregulated: BMP, Notch, WNT, JAK-STAT, and Sonic hedgehog (Shh), TGF-β, SIRT1 and IL-6/STAT3. VEGF has also been found to play a role in stemness maintenance and it is produced by cancer stem cells under hypoxia [291, 295, 296]. HIF-1 and HIF-2 are differently expressed in CSCs but they are both required for their stemness, proliferation and survival, as well as upregulation of different subset of genes [297, 298]. The presence of HIF-2 has more frequently been detected in CSCs and, for example, its ability to regulate Oct4 is not shared with HIF-1 [299].
Finally, reduced expression levels of the immune signature have been found in tumor samples with elevated arm and whole-chromosomes somatic copy number alterations (SCNAs). Davoli et al. (2017) performed a bioinformatic analysis on 5255 tumor and normal samples representing 12 cancer types and found that reduced expression of markers for cytotoxic immune cell infiltrates was correlated with high levels of SCNAs [300]. Recently, further bioinformatic studies in different types of cancers confirmed that elevated levels of SCNAs are correlated with a decreased immune signature or an increase in pathways referring to immune suppression [301–303]. As mentioned in the previous chapter, hypoxia is responsible for a moderate genome instability, due to the transcriptional and translational repression of genes involved in DNA damage repair pathways. Replication stress is also a common feature of hypoxic cells [119–128]. Therefore, copy number variations due to an increase in genome instability might be a further mechanism through which hypoxia could lead to an immune excluded phenotype.
Techniques to map hypoxic areas and immune infiltration
Hypoxia is a hallmark of most solid tumors and is associated with the malignant characteristics of cancers. It is also considered one of the many impediments to effective cancer therapy and is, therefore, correlated with poor prognosis. Both chronic and acute hypoxia lead to a variegated TME, exposing cells to different partial oxygen pressures and probably to gradients of immune infiltrations.
In order to have a mechanistic understanding on how functional and physical barriers correlate with morphological parameters in human cancer, different ex vivo tissue analysis techniques can be performed (Fig. 4a). These techniques could allow the creation of an accurate pan-cancer topographic map of hypoxic conditions in immune excluded areas and study the putative role of hypoxia as a possible upstream determinant for most immune excluded phenotypes.
Fig. 4.

Scheme of ex vivo and in vivo techniques to detect hypoxia and immune cells. a Ex-vivo techniques could be useful to create topographic maps of hypoxic-induced physical and functional barriers in immune excluded tumor areas, providing mechanistic highlights into the organization of immune exclusion determinants. Bioinformatic and spatial transcriptomics could investigate hypoxic transcriptional profiles in correlation with ICR or TIS. Immunohistochemistry of exogenous compounds or HIF-induced proteins coupled to digital pathology of immune cells could provide functional and morphological insights. b In-vivo techniques to detect gradients of hypoxia and immune infiltration may be useful to monitor immunotherapy efficiency in hypoxic tumors (clinical setting). To detect hypoxia and immune cells in patients, non-invasive methodologies are preferred
A variety of bioinformatics studies in solid tumors revealed a correlation between high-hypoxic signatures and low immune infiltration. However, the relationship between hypoxia and immune exclusion has been investigated in few cancer types and a consensus on this aspect has not been reached. Bioinformatic studies did not allow to draw generalizable conclusions, highlighting the need for more comprehensive analyses of large bulk transcriptomic cohorts [304–307].
These analyses rely on data from public cancer databases and do not provide any spatial or temporal resolution but rather a ballpark assessment of T cell functional status in bulk tumor samples. In these studies, hypoxia signature is represented by a set of genes that are found to be induced, and a variety of different predictors of hypoxia have been reported during the years. Heterogeneity is an important feature in cancer, therefore such signatures are likely to be tissue-specific and, probably, cancer stage-specific. Efforts have been made by several groups to create a universal hypoxic profile relevant to various cancer types [308–310].
Spatial transcriptional profiling of hypoxia-induced genes coupled with immune signatures (such as ICR or TIS) [30–34], could be an interesting option to characterize hypoxic-dependent phenotypes related to immune exclusion. Hypoxia could be transcriptionally monitored through different marker mRNAs such as those for HIF-proteins, VEGF family (angiogenesis), GLUT 1-3 (metabolic switch), etc. (Table 2). Mapping several distinct hypoxic mRNAs would provide hints of spatial indication of hypoxia-driven barriers in the different tumor areas, related to EMC remodeling, neo-angiogenesis, metabolic reprogramming, stem cell maintenance, etc. (physical or functional barriers).
Table 2.
Set of candidate proteins to monitor transcriptionally, which are involved in different hypoxia-dependent phenotypes, leading to mechanical and functional barriers
| Hypoxic-dependent phenotype | Proteins to monitor (mRNA) |
|---|---|
| ECM remodeling | ZEB1, ZEB2, MMP2, MMP9, bFGF, IL-6, PDGF, TGF-B, P4AH1, P4AH2, PLOD1, PLOD2, LOX |
| Metabolism switch | CAIX-XII, LDHA, MCT1, MCT4, SLC2A1, PDK1, ALDA, GLUT 1-3, PKM2 |
| Angiogenesis | VEGFA, SCF, ANGPT2, SDF1, PDGFB, PGF, CTGF, FGF |
| Stem cell maintenance | ALKBH5, SIAH1, WWTR1, GCLM, BMP, JAK-STAT, SHH, SOX2, Oct-4, NANOG |
| Immune evasion | PDL1, CD39, CD47, CD73, CXCL12, ET-1, ET-2, SDF1, Sema3A |
It could be of interest to collect spatial transcriptional data from different types of tumors at different stages and to create topographies of mRNAs organization for hypoxia and immune signatures. Obtaining correlations between markers of immune excluded areas and hypoxia-driven or hypoxia-independent barriers, would allow to investigate if one/multiple pathways creating physical or functional barriers are prevalent in human cancer at different stages, or these pathways just overlap randomly.
New spatial transcriptomic (ST) technologies take advantage of spatially barcoded oligo-deoxythymidine microarrays, allowing for unbiased mapping of transcripts (Fig. 5). Each area resolves the transcriptome of 10-200 cells depending on the tissue context [311]. ST has been used to study breast cancer, melanoma, prostate cancer, adult human hearth tissue, pancreatic ductal adenocarcinoma, mouse, human and mouse spinal cord tissue and mouse olfactory bulb [312–319]. Moncada et al., (2020) combined microarray-based ST that reveals spatial patterns of gene expression, with single cell RNA sequencing (scRNA-Seq) generated from the same sample, to identify enrichments of specific cell types and subpopulations across spatially-defined regions of pancreatic tumors [317]. Mohenska et al., (2019) combined ST with 3D modelling to investigate and map three-dimensionally the transcriptome in the mouse adult heart [319]. Philippeos et al. (2018) used a combination of comparative ST profiling of human and mouse dermis and scRNA-Seq profiling of human dermal fibroblasts, to define markers in fibroblast populations of the adult human skin [320].
Fig. 5.

Spatial transcriptomics workflow including the downstream analysis. a Histological tumor sections are stained with hematoxylin and eosin-stained and imaged before permeabilization. b The sections are placed on glass slides containing RT-primers arrayed as spots that corresponded to tissues domains. The barcoded microarrays contain printed spots of RT-primers with unique barcode sequences. The RT-primers at each spot have a unique spatial ID barcode, which is sequenced along with the transcript to enable trace-back to a specific tissue domain. c Sequencing. d After sequencing the gene expression profiles and factor activity map are created
A final example is the study performed by Thrane et al., (2018), who applied the ST technology to melanoma lymph node biopsies and successfully sequenced the transcriptomes of over 2200 tissue domains revealing a detailed landscape of melanoma metastases [315]. To our knowledge, ST has never been used to analyze the correlation of hypoxic-dependent and independent barriers with immune signatures.
Immunohistochemistry (IHC) can also be used to evaluate the concomitant expression of HIF-induced proteins and the infiltration of immune cells, in tumors [29, 321]. Exogenously administered nitroimidazole-based components accumulate in hypoxic cells and they can be detected by IHC, PET or SPECT imaging. A commonly used nitroimidazole molecule is called pimonidazole (HypoxyprobeTM) and it has been shown that, immunochemical detection of pimonidazole protein adducts, can be successfully used to investigate hypoxia gradients in histological sections from tumors [322–325]. When oxygen level in tissues decreases below 1.3%, pimonidazole binds to thiol-containing proteins, peptides and amino acids, forming covalent bonds [326–328]. Hypoxic cells are detected using a specific monoclonal antibody and the amount of pimonidazole is directly proportional to the level of hypoxia in the tissue [322]. No toxic effects are associate with pimonidazole administration; therefore, this drug has also been used in patients. Pimonidazole administration followed by biopsy was performed to assess tumor hypoxia in cervical carcinoma, head and neck carcinoma and prostate cancer [323–325, 329, 330].
A pentafluorinated derivative of the 2-nitroimidazole etanidazole, called EF5, is also commonly used in IHC to detect gradients of hypoxia. EF5 is not toxic at doses adequate to detect tumor hypoxia and it is administered intravenously to patients. Tumors are biopsied approximately 48 hours after drug administration [331]. EF5 has been used on patients with squamous cell carcinoma: head and neck tumor, and uterine cervix cancer [332–334]. It has also been used on xenograft models of human colorectal carcinoma and sarcoma and in the detection of hypoxia in atherosclerotic plaques in mice [334–336].
Endogenous proteins such as HIF-1α can be tested by IHC, together with HIF-induced proteins. Such commonly used protein markers for hypoxia include CAIX, VEGFA, osteopontin, glucose transporter GLUT-1 and GLUT-3, BNIP3, PDK1, LDHA, LOX and EPO [321, 333, 337–339].
Regarding immune cells, the density of CD3, CD4, CD8, CD20, CD68, CD163, PD1 and FOXP3-expressing T lymphocytes is often used to evaluate immune infiltration and quantify it by digital pathology. In a recent publication, Kather et al., (2018) measured the topography of multiple immune cell types in a pan-cancer cohort by IHC, providing the first systematic analysis of hot, cold and immune excluded patterns and investigating how these patterns differ between immune cell types and cancer types [29]. Combining immunostaining of hypoxia-induced proteins and T cells in a similar pan-cancer cohort would provide correlations about pattern of immune exclusion and hypoxic related phenotypes.
Few disadvantages are associated with these approaches. Firstly, they require biopsies that precludes the serial monitoring of the same tissue at different time points. Second, the proper handling of samples is essential. For example, upon sample exposure to 20% oxygen, both HIF-1α and HIF-1β mRNA decrease to normoxic levels in less than 5 minutes. The half-life of the HIF-1α protein in normoxic conditions is also approximately 5 minutes [74, 76, 340, 341]. The stability of mRNA and protein levels for other hypoxic markers, such as VEGFA and CAIX is higher [342, 343]. Therefore, it is important to select the most appropriate markers according to sample processing procedure.
In vivo studies, correlating hypoxia and immune excluded phenotypes could be important for clinical monitoring (Fig. 4b). A robust technique could also be exploited as a predictive marker for immunotherapy efficiency and as a tool to monitor progression during treatment.
The methods described below provide a spatial characterization of hypoxic regions and allow the repetitive measurement of the same area at different time points. They provide measurements at various locations, allowing stratification of the information. Since different techniques document oxygen concentration in different locations (i.e. intracellular hypoxia, interstitial hypoxia or blood oxygenation), it is not possible to compare the values obtained with different methods, even within the same tissue.
Polarographic electrodes represent the gold standard for tumor hypoxia characterization in vivo [344, 345]. These invasive probes measure interstitial oxygen in sub-millimeter gradients, sampling a tissue volume of about 50-100 cells [346]. The probes are inserted into a tumor or metastatic lymph node. Variability in reported values could be due to the localization of the probes [347].
Ideally, minimally invasive screening techniques are generally highly preferred, especially for translational and clinical trials. Non-invasive imaging techniques include phosphorescence quenching, positron emission tomography (PET), blood oxygen level dependent (BOLD) magnetic resonance imaging (MRI), tissue oxygen level dependent (TOLD) MRI, oxygen-enhanced MRI (OE-MRI), near-infrared spectroscopy/tomography and single photon emission computed tomography (SPECT).
Phosphorescence quenching depends on the interaction of phosphorescent dyes with oxygen molecules. It is a direct measurement of the partial oxygen pressure and, unlike other methods, the reported value is independent of the tracer concentration [348, 349]. Molecular reporters are largely based on platinum or palladium containing porphyrins and they allow the imaging of tumors at specific absorbance/emission wavelengths [350]. Their emission decays exponentially, at a rate proportional to the local oxygen concentration therefore, increasing the oxygen pressure shortens the lifetime of the reporter, decreasing the total phosphorescence intensity [348, 351]. Due to technical challenges, this technique has not yet been used in clinical settings.
PET is a technique commonly used in the medical field. During recent years it has been shown to allow accurate diagnoses and increase patient comfort. PET allows the absolute quantification of intracellular hypoxia, spatially and temporally [352]. This methodology delivers information about inter- and intra-tumoral heterogeneity, in addition to the molecular and functional properties of a tumor. Small tracer molecules susceptible to hypoxic conditions are required and success of imaging is dependent upon their delivery. Properties of an ideal tracer include hypoxia-specificity, high stability, and effectiveness in clinical settings within a broad range of tumor cell types and volumes. The probe should have pharmacokinetic properties that are independent from parameters known to co-vary with hypoxia (i.e. pH, blood flow, etc.) and should be sufficiently lipophilic in order to enter cells. However, it should also be sufficiently hydrophilic to avoid membrane sequestration and have a faster clearance from the systemic circulation, normoxic and necrotic tissue [353, 354]. Small molecules containing 2-nitroimidazole undergo single electron reduction to form reactive radicals, accumulating under hypoxic conditions. They constitute a versatile class of probes, which can be conjugated with a radioisotope for imaging; over the past years several derivatives have been developed [350, 353].
Widely used 2-nitroimidazole derivatives are 18F-labeled tracers (MISO, FMISO, FETNIM, FRP170, EF5, EF3, FAZA and HX4). None of these probes bear all the characteristics mentioned above therefore, there is currently no optimal and standardized quantification methodology for imaging hypoxia in all cancer types. Moreover, the tracers have different properties, and as such, the comparison of studies with different tracers is not recommended. 18F-FMISO enters cells via passive diffusion, where it is reduced by nitroreductase enzymes under hypoxic conditions. It forms reactive oxygen species, then binds to macromolecular cellular components and conjugates with glutathione, which causes its confinement in the cellular compartment [355–357]. 18F-FMISO is the most widely used tracer but is found at a relatively low concentration in tumors. Moreover, it is normally imaged several hours post-injection, due to its slow clearance from background tissues [358–360]. These circumstances could render the image acquisition challenging. The 18F-FMISO has been used to detect hypoxia in patients with gliomas, head-and-neck, breast, lung, pancreatic and renal tumours [352, 361–374] (Fig. 6). However, 18F-FMISO retention in sarcomas is variable [375–377].
Fig. 6.
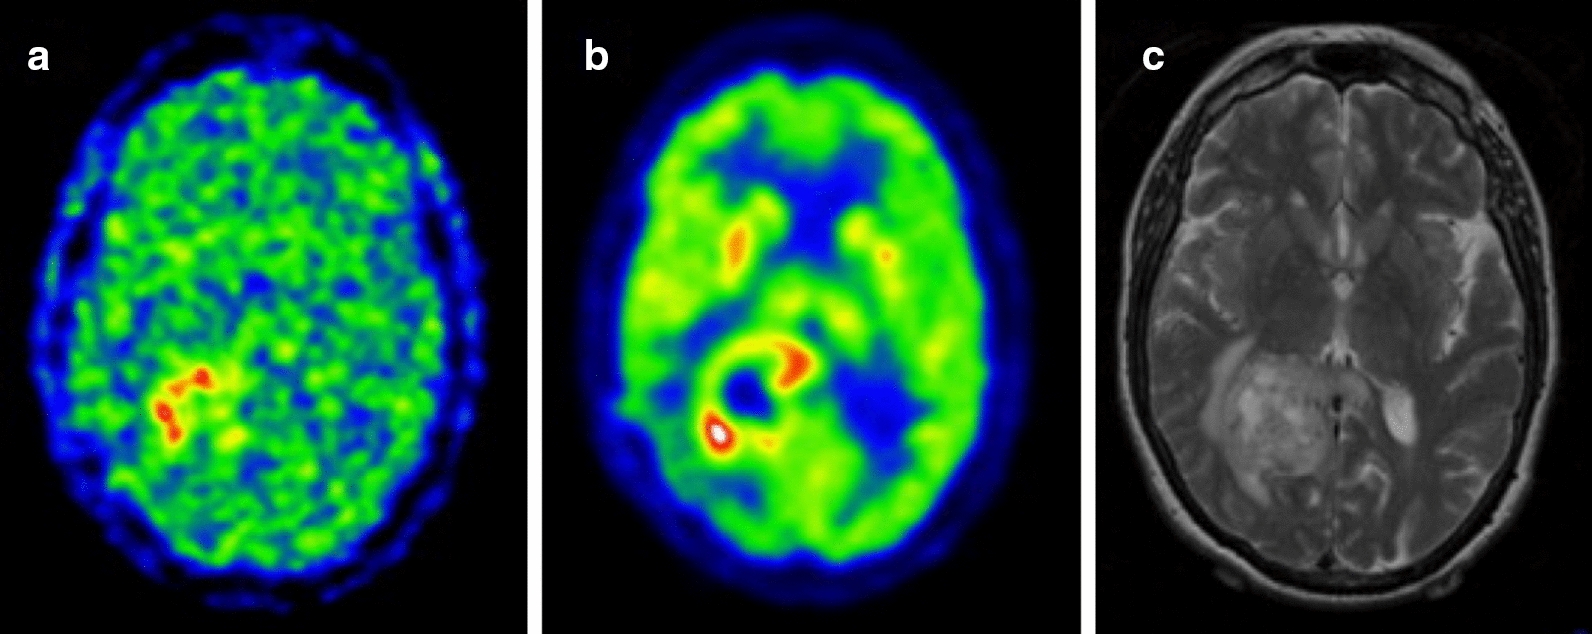
Examples of hypoxia imaging in glioma. Postsurgical assessment of residual tumor showing a 18F-FMISO gradient, hypoxic areas are found in the surgical margin of the tumor. b 18F-FDG staining, marker for the tissue uptake of glucose and C) preoperative MRI showing the tumor mass in the right posterior parieto-occipital lobe
18F- FETNIM, FRP170, EF5, EF3, FAZA and HX4 are next-generation more hydrophilic hypoxia probes and they are dependent on renal clearance. Although these tracers improve the resolution of hypoxia-to-normoxia tissue ratios (higher contrast) compared to 18F-FMISO, intrinsic differences in kidney clearance could lead to variability in measurements [378–381]. 18F-FAZA and other 18F-labelled tracers were used to detect gradients of hypoxia in patients with lung cancer, gliomas, lymphomas, prostate, pancreatic, cervical, rectal and head-and-neck and rectal tumours [382–397].
The lack of a standardized method renders crucial the assessment of the most suitable hypoxia tracer case by case, depending upon the physiological and pathological conditions. Moreover, discrepancies in reproducibility among studies could be due to differences in the methodological parameters (image acquisition protocol, selection of hypoxic-normoxic thresholds) and to the relatively small number of patients tested [353].
Cu-ATSM is an alternative class of agents used in the study of hypoxia with PET. It is characterised by a low molecular weight and lipophilicity, resulting in high membrane permeability. Cu-ATSM is based on a complex of copper with diacetyl-bis (N4-methylthiosemicarbazone) ligands and its specificity is due to the intracellular reduction of Cu(II) to Cu(I) under hypoxic conditions. The complex Cu(I)–ATSM is unstable and may further dissociate into Cu(I) and ATSM, leading to the intracellular trapping of the Cu(I) ion [353, 398].
Cu-ATSM was successfully used in clinical settings to monitor hypoxia in cervical, head and neck, lung and rectal cancer patients [399–404].
SPECT also requires a tracer which reports on intracellular hypoxia and allows the quantification of data at a macroscopic scale, in tumor regions [353]. SPECT is more commonly used in clinical settings than PET as the cost of tracer Technetium-99m is lower, it has a convenient half-life and versatile chemistry compared to 18F compounds [405]. However, PET has a superior spatial resolution and is considered a more suitable and accurate method for detecting tumoral hypoxia [406–408].
Magnetic resonance imaging may provide a practical and safer translational alternative to PET. BOLD-MRI is the standard methodology used to obtain images in functional MRI. It monitors blood oxygen levels using deoxy-haemoglobin as an endogenous marker, but does not provide a direct measurement of the oxygen tension in tissues. It is used to examine the variation in tissue oxygenation rather than quantitatively mapping hypoxia [350, 409–411]. Using this technique, Baudelet et al. (2006) observed signal fluctuations more frequently in tumor regions containing immature blood vessels in fibrosarcoma-bearing mice [412]. BOLD-MRI was used in clinical settings to evaluate response to treatments in recurrent cervical cancer and locally advanced breast cancer [413–415]. It was also used to generate oxygen saturation maps in normal and cancer prostate tissues and in patients with infiltrative astrocytoma [415–417].
TOLD-MRI offers more robust insights into tumor hypoxia. It measures the concentration of free oxygen molecules in the plasma and interstitial tissue fluid. TOLD-MRI provides values on the partial oxygen pressure in tissues. Moreover, it does not require the use of contrast agent, making it more cost-effective than PET [418]. Preclinical studies have shown that TOLD-MRI is a predictor of radiotherapy outcomes and a potential prognostic biomarker (Fig. 7). TOLD-MRI has also been used to confirm tumor re-oxygenation after treatment, in patients affected by glioblastoma [419–421].
Fig. 7.
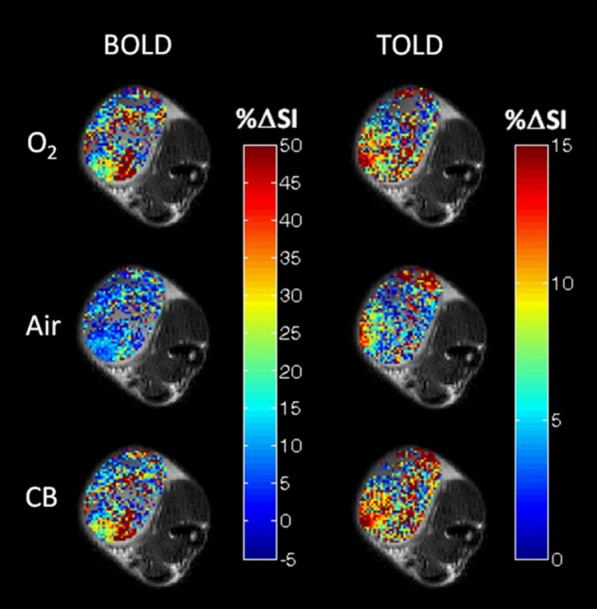
Comparative study of BOLD and TOLD to assess tumor oxygenation. BOLD and TOLD-MRI measures of oxygen gradients overlaid on a high-resolution image of a small Dunning prostate R3327-AT1 tumor in conditions of hyperoxia, 100% O2 (O2), return to normal air (Air) and carbogen breathing, 95% O2 and 5% CO2 (CB). Changes in signal intensity is represented by %ΔSI. Response maps compare final images versus baseline. Each map shows substantial intratumoral heterogeneity and differences in the heatmap pattern within the same treatment, between BOLD and TOLD
Another technique that provides evidence about tumor oximetry, together with microvascular permeability, is the oxygen-enhanced MRI. OE-MRI uses a low-field magnetic resonance scanner and paramagnetic contrast agent allowing spatial resolution of ≈1 mm and temporal resolution of 2 minutes [422]. OE-MRI does not provide quantitative measures of oxygen per se but maps oxygen delivery in tissues with fully saturated haemoglobin [423, 424]. Its potential was assessed in preclinical studies, in healthy individuals subjected to respiratory challenges and in patients with lung cancer and advanced cancer of the abdomen and pelvis [425–427].
There is currently no standardized non-invasive technique that is accurate for all tumor types and available for routine clinical use. Therefore, depending on the pathophysiological features to be investigated, it is important to evaluate the correct methodology to adopt.
Significant advancements were achieved in the last few years in imaging immune cells in the context of translational research [428, 429]. Tracking T cells in vivo implies the need for non-invasive, highly sensitive, molecular quantitative and total body techniques such as PET, SPECT and MRI. The development of the immuno-PET allows to monitor different types of immune cells [430–433]. To be detected, T cells are provided with a tracer conjugated to a molecular target. Example of targets are molecules on the T-cell surface (TCR complex), metabolic pathways, T-cell activation markers (PD-1, OX40, IL-2), PET reporter genes and T-cell effector function markers [429].
Coupling in vivo detection of hypoxia gradients and T cell distribution could provide crucial information to predict immunotherapy efficiency. Such analysis could also provide some insight into the spatial and dynamic organization of determinants responsible for phenomenon of immune exclusion.
Conclusions
Immunotherapy has to overcome various challenges in order to increase its therapeutic potential in solid tumors. Despite evidence that hypoxia is a crucial determinant for the efficacy of immunotherapies, few clinical trials are studying how these two aspects are related in patients.
Preclinical research demonstrated the existence of a plethora of factors and receptors shaping the hypoxic phenotype. Moreover, the dynamics of these factors change during time and, likely, they also vary according to tumor type.
However, it is unclear if hypoxia could be considered an upstream determinant triggering the immune excluded phenotype. Further studies are required to understand the spatial and temporal evolution of mechanisms involved in the immune exclusion phenomenon. It would also be of interest to correlate in vivo tumor stages with immune infiltration and hypoxic-related markers, in a pan-cancer investigation. This correlation would provide insights into strategies to adopt in order to increase immunotherapy efficiency and rationale for translational combinatorial treatments. Moreover, together with ex vivo techniques it could be possible to integrate the actual knowledge of distinct mechanisms responsible for the immune excluded phenotype, into a unified ‘Theory of Everything’.
Acknowledgements
Not applicable
Abbreviations
- CAR-T
Chimeric antigen receptor T cells
- TIL
Tumor infiltrating lymphocytes
- SITC
Society for Immunotherapy of Cancer
- ICR
Immunologic constant of rejection
- TIS
Tumor inflammation signature
- HREs
Hypoxia regulated elements
- HIFs
Hypoxic inducible factors
- ODD
Oxygen degradation domain
- PHDs
Prolyl hydroxylases
- pVHL
von-Hippel Lindau tumor suppressor
- PI3K
Phosphoinositol 3-kinase
- MAPK
Mitogen-activated protein kinase
- mTOR
Mammalian target of rapamycin
- ROS
Reactive oxygen species
- TME
Tumor microenvironment
- ECM
Extra-cellular matrix
- Ang-2
Angiopoietin-2
- TGF-β
Transforming growth factor beta
- PDGFB
Platelet-derived growth factor B
- PGF
Placental growth factor
- CTGF
Connective tissue growth factor
- SCF
Stem cell factor
- CXCL12
Stromal cell-derived factor 1
- ET-1
Endothelin-1
- AP-1
Binding of activator protein-1
- EGF
Epidermal growth factor
- PDGF
Platelet-derived growth factor
- FGF2
Fibroblast growth factor 2
- CAFs
Cancer-associated fibroblasts
- PDA
Pancreatic ductal adenocarcinoma
- EMT
Epithelial–mesenchymal transition
- TNF-α
Tumor necrosis factor α
- IL
Interleukin
- HGF
Hepatocyte growth factor
- bFGF
Basic fibroblast growth factor
- EGF
Epidermal growth factor
- ZEB
Zinc finger E-box binding homeobox
- MMPs
Matrix metalloproteinases
- FLG
Filaggrin
- GLUTs
Enzymes glucose transporters
- PDK1
Pyruvate dehydrogenase kinase 1
- LDHA
Lactic dehydrogenase A
- PKM2
Pyruvate kinase M2 subtype
- MCTs
Mono-carboxylate transporters
- CAs
Carbonic anhydrases
- GLS1
Glutaminase 1
- T regs
T regulatory cells
- TAMs
Tumor-associated macrophages
- MDSCs
Myeloid-derived suppressor cells
- MHC-I
Major histocompatibility class-I
- JAK
Janus kinase
- STAT
Transducer and activator of transcription
- CSCs
Cancer stem cells
- ST
Spatial transcriptomic
- scRNA-Seq
Single cell RNA sequencing
- IHC
Immunohistochemistry
- PET
Positron emission tomography
- BOLD
Blood oxygen level dependent
- MRI
Magnetic resonance imaging
- TOLD
Tissue oxygen level dependent
- OE
Oxygen-enhanced
- SPECT
Single photon emission computed tomography
- SCNA
Somatic copy number alteration
Authors’ contributions
VP wrote the manuscript and prepared the figures. FM read and approved the final manuscript
Funding
Not applicable
Availability of data and materials
Not applicable
Ethics approval and consent to participate
Not applicable
Consent for publication
Not applicable
Competing interests
The authors declare no conflict of interest.
Footnotes
Publisher's Note
Springer Nature remains neutral with regard to jurisdictional claims in published maps and institutional affiliations.
Contributor Information
Violena Pietrobon, Email: violenapietrobon@gmail.com.
Francesco M. Marincola, Email: franco.marincola@refugebiotech.com
References
- 1.Maude SL, et al. Chimeric antigen receptor T cells for sustained remissions in leukemia. N Engl J Med. 2014;371(16):1507–1517. doi: 10.1056/NEJMoa1407222. [DOI] [PMC free article] [PubMed] [Google Scholar]
- 2.Turtle CJ, et al. CD19 CAR-T cells of defined CD4+:CD8+ composition in adult B cell ALL patients. J Clin Invest. 2016;126(6):2123–2138. doi: 10.1172/JCI85309. [DOI] [PMC free article] [PubMed] [Google Scholar]
- 3.Brentjens RJ, et al. Safety and persistence of adoptively transferred autologous CD19-targeted T cells in patients with relapsed or chemotherapy refractory B-cell leukemias. Blood. 2011;118(18):4817–4828. doi: 10.1182/blood-2011-04-348540. [DOI] [PMC free article] [PubMed] [Google Scholar]
- 4.Louis CU, et al. Antitumor activity and long-term fate of chimeric antigen receptor-positive T cells in patients with neuroblastoma. Blood. 2011;118(23):6050–6056. doi: 10.1182/blood-2011-05-354449. [DOI] [PMC free article] [PubMed] [Google Scholar]
- 5.Ahmed N, et al. Human Epidermal Growth Factor Receptor 2 (HER2) -Specific Chimeric Antigen Receptor-Modified T Cells for the Immunotherapy of HER2-Positive Sarcoma. J Clin Oncol. 2015;33(15):1688–1696. doi: 10.1200/JCO.2014.58.0225. [DOI] [PMC free article] [PubMed] [Google Scholar]
- 6.Feng K, et al. Chimeric antigen receptor-modified T cells for the immunotherapy of patients with EGFR-expressing advanced relapsed/refractory non-small cell lung cancer. Sci China Life Sci. 2016;59(5):468–479. doi: 10.1007/s11427-016-5023-8. [DOI] [PubMed] [Google Scholar]
- 7.Ma S, et al. Current Progress in CAR-T Cell Therapy for Solid Tumors. Int J Biol Sci. 2019;15(12):2548–2560. doi: 10.7150/ijbs.34213. [DOI] [PMC free article] [PubMed] [Google Scholar]
- 8.Hodi FS, et al. Improved survival with ipilimumab in patients with metastatic melanoma. N Engl J Med. 2010;363(8):711–723. doi: 10.1056/NEJMoa1003466. [DOI] [PMC free article] [PubMed] [Google Scholar]
- 9.Rizvi, N.A., et al., Cancer immunology. Mutational landscape determines sensitivity to PD-1 blockade in non-small cell lung cancer. Science. 2015;348(6230):124–8. [DOI] [PMC free article] [PubMed]
- 10.Ansell SM, et al. PD-1 blockade with nivolumab in relapsed or refractory Hodgkin’s lymphoma. N Engl J Med. 2015;372(4):311–319. doi: 10.1056/NEJMoa1411087. [DOI] [PMC free article] [PubMed] [Google Scholar]
- 11.Brahmer JR, et al. Safety and activity of anti-PD-L1 antibody in patients with advanced cancer. N Engl J Med. 2012;366(26):2455–2465. doi: 10.1056/NEJMoa1200694. [DOI] [PMC free article] [PubMed] [Google Scholar]
- 12.Chow LQM, et al. Antitumor activity of pembrolizumab in biomarker-unselected patients with recurrent and/or metastatic head and neck squamous cell carcinoma: results from the phase Ib KEYNOTE-012 expansion cohort. J Clin Oncol. 2016;34(32):3838–3845. doi: 10.1200/JCO.2016.68.1478. [DOI] [PMC free article] [PubMed] [Google Scholar]
- 13.Powles T, et al. MPDL3280A (anti-PD-L1) treatment leads to clinical activity in metastatic bladder cancer. Nature. 2014;515(7528):558–562. doi: 10.1038/nature13904. [DOI] [PubMed] [Google Scholar]
- 14.Snyder A, et al. Genetic basis for clinical response to CTLA-4 blockade in melanoma. N Engl J Med. 2014;371(23):2189–2199. doi: 10.1056/NEJMoa1406498. [DOI] [PMC free article] [PubMed] [Google Scholar]
- 15.Le DT, et al. Mismatch repair deficiency predicts response of solid tumors to PD-1 blockade. Science. 2017;357(6349):409–413. doi: 10.1126/science.aan6733. [DOI] [PMC free article] [PubMed] [Google Scholar]
- 16.Mouw KW, et al. DNA damage and repair biomarkers of immunotherapy response. Cancer Discov. 2017;7(7):675–693. doi: 10.1158/2159-8290.CD-17-0226. [DOI] [PMC free article] [PubMed] [Google Scholar]
- 17.Turan T, et al. Immune oncology, immune responsiveness and the theory of everything. J Immunother Cancer. 2018;6(1):50. doi: 10.1186/s40425-018-0355-5. [DOI] [PMC free article] [PubMed] [Google Scholar]
- 18.Bedognetti D, et al. Correction to: toward a comprehensive view of cancer immune responsiveness: a synopsis from the SITC workshop. J Immunother Cancer. 2019;7(1):167. doi: 10.1186/s40425-019-0640-y. [DOI] [PMC free article] [PubMed] [Google Scholar]
- 19.Massi D, et al. The density and spatial tissue distribution of CD8(+) and CD163(+) immune cells predict response and outcome in melanoma patients receiving MAPK inhibitors. J Immunother Cancer. 2019;7(1):308. doi: 10.1186/s40425-019-0797-4. [DOI] [PMC free article] [PubMed] [Google Scholar]
- 20.Verdegaal EM, et al. Successful treatment of metastatic melanoma by adoptive transfer of blood-derived polyclonal tumor-specific CD4+ and CD8+ T cells in combination with low-dose interferon-alpha. Cancer Immunol Immunother. 2011;60(7):953–963. doi: 10.1007/s00262-011-1004-8. [DOI] [PMC free article] [PubMed] [Google Scholar]
- 21.Mlecnik B, et al. Histopathologic-based prognostic factors of colorectal cancers are associated with the state of the local immune reaction. J Clin Oncol. 2011;29(6):610–618. doi: 10.1200/JCO.2010.30.5425. [DOI] [PubMed] [Google Scholar]
- 22.Pages F, et al. Effector memory T cells, early metastasis, and survival in colorectal cancer. N Engl J Med. 2005;353(25):2654–2666. doi: 10.1056/NEJMoa051424. [DOI] [PubMed] [Google Scholar]
- 23.Shimizu S, et al. Tumor-infiltrating CD8(+) T-cell density is an independent prognostic marker for oral squamous cell carcinoma. Cancer Med. 2019;8(1):80–93. doi: 10.1002/cam4.1889. [DOI] [PMC free article] [PubMed] [Google Scholar]
- 24.Galon J, et al. Type, density, and location of immune cells within human colorectal tumors predict clinical outcome. Science. 2006;313(5795):1960–1964. doi: 10.1126/science.1129139. [DOI] [PubMed] [Google Scholar]
- 25.Knief J, et al. Density of CD8-positive tumor-infiltrating T-lymphocytes is an independent prognostic factor in adenocarcinoma of the esophagogastric junction. Histol Histopathol. 2019;34(10):1121–1129. doi: 10.14670/HH-18-109. [DOI] [PubMed] [Google Scholar]
- 26.Pages F, et al. International validation of the consensus Immunoscore for the classification of colon cancer: a prognostic and accuracy study. Lancet. 2018;391(10135):2128–2139. doi: 10.1016/S0140-6736(18)30789-X. [DOI] [PubMed] [Google Scholar]
- 27.Erdag G, et al. Immunotype and immunohistologic characteristics of tumor-infiltrating immune cells are associated with clinical outcome in metastatic melanoma. Cancer Res. 2012;72(5):1070–1080. doi: 10.1158/0008-5472.CAN-11-3218. [DOI] [PMC free article] [PubMed] [Google Scholar]
- 28.Tsujikawa T, et al. Quantitative multiplex immunohistochemistry reveals myeloid-inflamed tumor-immune complexity associated with poor prognosis. Cell Rep. 2017;19(1):203–217. doi: 10.1016/j.celrep.2017.03.037. [DOI] [PMC free article] [PubMed] [Google Scholar]
- 29.Kather JN, et al. Topography of cancer-associated immune cells in human solid tumors. Elife, 2018;7:12. [DOI] [PMC free article] [PubMed]
- 30.Galon J, et al. The continuum of cancer immunosurveillance: prognostic, predictive, and mechanistic signatures. Immunity. 2013;39(1):11–26. doi: 10.1016/j.immuni.2013.07.008. [DOI] [PubMed] [Google Scholar]
- 31.Wang E, Worschech A, Marincola FM. The immunologic constant of rejection. Trends Immunol. 2008;29(6):256–262. doi: 10.1016/j.it.2008.03.002. [DOI] [PubMed] [Google Scholar]
- 32.Ayers M, et al. IFN-gamma-related mRNA profile predicts clinical response to PD-1 blockade. J Clin Invest. 2017;127(8):2930–2940. doi: 10.1172/JCI91190. [DOI] [PMC free article] [PubMed] [Google Scholar]
- 33.Damotte D, et al. The tumor inflammation signature (TIS) is associated with anti-PD-1 treatment benefit in the CERTIM pan-cancer cohort. J Transl Med. 2019;17(1):357. doi: 10.1186/s12967-019-2100-3. [DOI] [PMC free article] [PubMed] [Google Scholar]
- 34.Danaher P, et al. Pan-cancer adaptive immune resistance as defined by the Tumor Inflammation Signature (TIS): results from The Cancer Genome Atlas (TCGA) J Immunother Cancer. 2018;6(1):63. doi: 10.1186/s40425-018-0367-1. [DOI] [PMC free article] [PubMed] [Google Scholar]
- 35.Roelands J, et al. Oncogenic states dictate the prognostic and predictive connotations of intratumoral immune response. J Immunother Cancer. 2020;8(1):e000617. 10.1136/jitc-2020-000617. [DOI] [PMC free article] [PubMed]
- 36.Pai SI, Cesano A, Marincola FM. The paradox of cancer immune exclusion: immune oncology next frontier. Cancer Treat Res. 2020;180:173–195. doi: 10.1007/978-3-030-38862-1_6. [DOI] [PMC free article] [PubMed] [Google Scholar]
- 37.Salerno EP, et al. Human melanomas and ovarian cancers overexpressing mechanical barrier molecule genes lack immune signatures and have increased patient mortality risk. Oncoimmunology. 2016;5(12):e1240857. doi: 10.1080/2162402X.2016.1240857. [DOI] [PMC free article] [PubMed] [Google Scholar]
- 38.Mattox AK, et al. PD-1 expression in head and neck squamous cell carcinomas derives primarily from functionally anergic CD4(+) TILs in the presence of PD-L1(+) TAMs. Cancer Res. 2017;77(22):6365–6374. doi: 10.1158/0008-5472.CAN-16-3453. [DOI] [PMC free article] [PubMed] [Google Scholar]
- 39.Lyford-Pike S, et al. Evidence for a role of the PD-1:PD-L1 pathway in immune resistance of HPV-associated head and neck squamous cell carcinoma. Cancer Res. 2013;73(6):1733–1741. doi: 10.1158/0008-5472.CAN-12-2384. [DOI] [PMC free article] [PubMed] [Google Scholar]
- 40.Garris CS, et al. Successful anti-PD-1 cancer immunotherapy requires T cell-dendritic cell crosstalk involving the cytokines IFN-gamma and IL-12. Immunity. 2018;49(6):1148–61. [DOI] [PMC free article] [PubMed]
- 41.Ortiz-Prado E, et al. Partial pressure of oxygen in the human body: a general review. Am J Blood Res. 2019;9(1):1–14. [PMC free article] [PubMed] [Google Scholar]
- 42.Dunwoodie SL. The role of hypoxia in development of the Mammalian embryo. Dev Cell. 2009;17(6):755–773. doi: 10.1016/j.devcel.2009.11.008. [DOI] [PubMed] [Google Scholar]
- 43.Semenza GL. Hypoxia-inducible factors in physiology and medicine. Cell. 2012;148(3):399–408. doi: 10.1016/j.cell.2012.01.021. [DOI] [PMC free article] [PubMed] [Google Scholar]
- 44.Hlatky MA, et al. Polymorphisms in hypoxia inducible factor 1 and the initial clinical presentation of coronary disease. Am Heart J. 2007;154(6):1035–1042. doi: 10.1016/j.ahj.2007.07.042. [DOI] [PubMed] [Google Scholar]
- 45.Jha NK, et al. Hypoxia-induced signaling activation in neurodegenerative diseases: targets for new therapeutic strategies. J Alzheimers Dis. 2018;62(1):15–38. doi: 10.3233/JAD-170589. [DOI] [PubMed] [Google Scholar]
- 46.Pang B, et al. Systematic review and meta-analysis of the impact of hypoxia on infarcted myocardium: better or worse? Cell Physiol Biochem. 2018;51(2):949–960. doi: 10.1159/000495397. [DOI] [PubMed] [Google Scholar]
- 47.Levenson NI, et al. Effects of myocardial hypoxia and ischemia on myocardial scintigraphy. Am J Cardiol. 1975;35(2):251–257. doi: 10.1016/0002-9149(75)90009-0. [DOI] [PubMed] [Google Scholar]
- 48.Vaupel P, et al. Oxygenation of human tumors: evaluation of tissue oxygen distribution in breast cancers by computerized O2 tension measurements. Cancer Res. 1991;51(12):3316–3322. [PubMed] [Google Scholar]
- 49.Braun RD, et al. Comparison of tumor and normal tissue oxygen tension measurements using OxyLite or microelectrodes in rodents. Am J Physiol Heart Circ Physiol. 2001;280(6):H2533–H2544. doi: 10.1152/ajpheart.2001.280.6.H2533. [DOI] [PubMed] [Google Scholar]
- 50.McKeown SR. Defining normoxia, physoxia and hypoxia in tumours-implications for treatment response. Br J Radiol. 2014;87(1035):20130676. doi: 10.1259/bjr.20130676. [DOI] [PMC free article] [PubMed] [Google Scholar]
- 51.Thomlinson RH, Gray LH. The histological structure of some human lung cancers and the possible implications for radiotherapy. Br J Cancer. 1955;9(4):539–549. doi: 10.1038/bjc.1955.55. [DOI] [PMC free article] [PubMed] [Google Scholar]
- 52.Chapman JD. The detection and measurement of hypoxic cells in solid tumors. Cancer. 1984;54(11):2441–2449. doi: 10.1002/1097-0142(19841201)54:11<2441::AID-CNCR2820541122>3.0.CO;2-S. [DOI] [PubMed] [Google Scholar]
- 53.Nordsmark M, Bentzen SM, Overgaard J. Measurement of human tumour oxygenation status by a polarographic needle electrode. An analysis of inter- and intratumour heterogeneity. Acta Oncol. 1994;33(4):383–9. [DOI] [PubMed]
- 54.Forster JC, et al. A review of the development of tumor vasculature and its effects on the tumor microenvironment. Hypoxia (Auckl) 2017;5:21–32. doi: 10.2147/HP.S133231. [DOI] [PMC free article] [PubMed] [Google Scholar]
- 55.Folkman J. Tumor angiogenesis: a possible control point in tumor growth. Ann Intern Med. 1975;82(1):96–100. doi: 10.7326/0003-4819-82-1-96. [DOI] [PubMed] [Google Scholar]
- 56.Bayer C, Vaupel P. Acute versus chronic hypoxia in tumors: controversial data concerning time frames and biological consequences. Strahlenther Onkol. 2012;188(7):616–627. doi: 10.1007/s00066-012-0085-4. [DOI] [PubMed] [Google Scholar]
- 57.Chaplin DJ, Durand RE, Olive PL. Acute hypoxia in tumors: implications for modifiers of radiation effects. Int J Radiat Oncol Biol Phys. 1986;12(8):1279–1282. doi: 10.1016/0360-3016(86)90153-7. [DOI] [PubMed] [Google Scholar]
- 58.Chaplin DJ, Olive PL, Durand RE. Intermittent blood flow in a murine tumor: radiobiological effects. Cancer Res. 1987;47(2):597–601. [PubMed] [Google Scholar]
- 59.Rofstad EK, et al. Tumors exposed to acute cyclic hypoxic stress show enhanced angiogenesis, perfusion and metastatic dissemination. Int J Cancer. 2010;127(7):1535–1546. doi: 10.1002/ijc.25176. [DOI] [PubMed] [Google Scholar]
- 60.Kato Y, et al. Effects of acute and chronic hypoxia on the radiosensitivity of gastric and esophageal cancer cells. Anticancer Res. 2011;31(10):3369–3375. [PubMed] [Google Scholar]
- 61.Martin JD, et al. Corrigendum: reengineering the tumor microenvironment to alleviate hypoxia and overcome cancer heterogeneity. Cold Spring Harb Perspect Med. 2016;6:12. [DOI] [PMC free article] [PubMed]
- 62.Brown JM, Giaccia AJ. The unique physiology of solid tumors: opportunities (and problems) for cancer therapy. Cancer Res. 1998;58(7):1408–1416. [PubMed] [Google Scholar]
- 63.Semenza GL. Hypoxia, clonal selection, and the role of HIF-1 in tumor progression. Crit Rev Biochem Mol Biol. 2000;35(2):71–103. doi: 10.1080/10409230091169186. [DOI] [PubMed] [Google Scholar]
- 64.Semenza GL. HIF-1 and tumor progression: pathophysiology and therapeutics. Trends Mol Med. 2002;8(4 Suppl):S62–S67. doi: 10.1016/S1471-4914(02)02317-1. [DOI] [PubMed] [Google Scholar]
- 65.Zhong H, et al. Overexpression of hypoxia-inducible factor 1alpha in common human cancers and their metastases. Cancer Res. 1999;59(22):5830–5835. [PubMed] [Google Scholar]
- 66.Talks KL, et al. The expression and distribution of the hypoxia-inducible factors HIF-1alpha and HIF-2alpha in normal human tissues, cancers, and tumor-associated macrophages. Am J Pathol. 2000;157(2):411–421. doi: 10.1016/S0002-9440(10)64554-3. [DOI] [PMC free article] [PubMed] [Google Scholar]
- 67.Semenza GL, Wang GL. A nuclear factor induced by hypoxia via de novo protein synthesis binds to the human erythropoietin gene enhancer at a site required for transcriptional activation. Mol Cell Biol. 1992;12(12):5447–5454. doi: 10.1128/MCB.12.12.5447. [DOI] [PMC free article] [PubMed] [Google Scholar]
- 68.Wang GL, et al. Hypoxia-inducible factor 1 is a basic-helix-loop-helix-PAS heterodimer regulated by cellular O2 tension. Proc Natl Acad Sci USA. 1995;92(12):5510–5514. doi: 10.1073/pnas.92.12.5510. [DOI] [PMC free article] [PubMed] [Google Scholar]
- 69.Tian H, McKnight SL, Russell DW. Endothelial PAS domain protein 1 (EPAS1), a transcription factor selectively expressed in endothelial cells. Genes Dev. 1997;11(1):72–82. doi: 10.1101/gad.11.1.72. [DOI] [PubMed] [Google Scholar]
- 70.Huang LE, et al. Regulation of hypoxia-inducible factor 1alpha is mediated by an O2-dependent degradation domain via the ubiquitin-proteasome pathway. Proc Natl Acad Sci USA. 1998;95(14):7987–7992. doi: 10.1073/pnas.95.14.7987. [DOI] [PMC free article] [PubMed] [Google Scholar]
- 71.O’Rourke JF, et al. Oxygen-regulated and transactivating domains in endothelial PAS protein 1: comparison with hypoxia-inducible factor-1alpha. J Biol Chem. 1999;274(4):2060–2071. doi: 10.1074/jbc.274.4.2060. [DOI] [PubMed] [Google Scholar]
- 72.Ivan M, et al. HIFalpha targeted for VHL-mediated destruction by proline hydroxylation: implications for O2 sensing. Science. 2001;292(5516):464–468. doi: 10.1126/science.1059817. [DOI] [PubMed] [Google Scholar]
- 73.Jaakkola P, et al. Targeting of HIF-alpha to the von Hippel-Lindau ubiquitylation complex by O2-regulated prolyl hydroxylation. Science. 2001;292(5516):468–472. doi: 10.1126/science.1059796. [DOI] [PubMed] [Google Scholar]
- 74.Wang GL, Semenza GL. Purification and characterization of hypoxia-inducible factor 1. J Biol Chem. 1995;270(3):1230–1237. doi: 10.1074/jbc.270.3.1230. [DOI] [PubMed] [Google Scholar]
- 75.Wang GL, Semenza GL. General involvement of hypoxia-inducible factor 1 in transcriptional response to hypoxia. Proc Natl Acad Sci USA. 1993;90(9):4304–4308. doi: 10.1073/pnas.90.9.4304. [DOI] [PMC free article] [PubMed] [Google Scholar]
- 76.Wang GL, Semenza GL. Characterization of hypoxia-inducible factor 1 and regulation of DNA binding activity by hypoxia. J Biol Chem. 1993;268(29):21513–21518. [PubMed] [Google Scholar]
- 77.Ema M, et al. A novel bHLH-PAS factor with close sequence similarity to hypoxia-inducible factor 1alpha regulates the VEGF expression and is potentially involved in lung and vascular development. Proc Natl Acad Sci U S A. 1997;94(9):4273–4278. doi: 10.1073/pnas.94.9.4273. [DOI] [PMC free article] [PubMed] [Google Scholar]
- 78.Flamme I, et al. HRF, a putative basic helix-loop-helix-PAS-domain transcription factor is closely related to hypoxia-inducible factor-1 alpha and developmentally expressed in blood vessels. Mech Dev. 1997;63(1):51–60. doi: 10.1016/S0925-4773(97)00674-6. [DOI] [PubMed] [Google Scholar]
- 79.Kanno H, et al. Somatic mutations of the von Hippel-Lindau tumor suppressor gene in sporadic central nervous system hemangioblastomas. Cancer Res. 1994;54(18):4845–4847. [PubMed] [Google Scholar]
- 80.Shuin T, et al. Germline and somatic mutations in von Hippel-Lindau disease gene and its significance in the development of kidney cancer. Contrib Nephrol. 1999;128:1–10. doi: 10.1159/000059976. [DOI] [PubMed] [Google Scholar]
- 81.Lee JY, et al. Loss of heterozygosity and somatic mutations of the VHL tumor suppressor gene in sporadic cerebellar hemangioblastomas. Cancer Res. 1998;58(3):504–508. [PubMed] [Google Scholar]
- 82.Haase VH. The VHL tumor suppressor: master regulator of HIF. Curr Pharm Des. 2009;15(33):3895–3903. doi: 10.2174/138161209789649394. [DOI] [PMC free article] [PubMed] [Google Scholar]
- 83.Clifford SC, et al. Contrasting effects on HIF-1alpha regulation by disease-causing pVHL mutations correlate with patterns of tumourigenesis in von Hippel-Lindau disease. Hum Mol Genet. 2001;10(10):1029–1038. doi: 10.1093/hmg/10.10.1029. [DOI] [PubMed] [Google Scholar]
- 84.Sutter CH, Laughner E, Semenza GL. Hypoxia-inducible factor 1alpha protein expression is controlled by oxygen-regulated ubiquitination that is disrupted by deletions and missense mutations. Proc Natl Acad Sci USA. 2000;97(9):4748–4753. doi: 10.1073/pnas.080072497. [DOI] [PMC free article] [PubMed] [Google Scholar]
- 85.Laughner E, et al. HER2 (neu) signaling increases the rate of hypoxia-inducible factor 1alpha (HIF-1alpha) synthesis: novel mechanism for HIF-1-mediated vascular endothelial growth factor expression. Mol Cell Biol. 2001;21(12):3995–4004. doi: 10.1128/MCB.21.12.3995-4004.2001. [DOI] [PMC free article] [PubMed] [Google Scholar]
- 86.Brugarolas JB, et al. TSC2 regulates VEGF through mTOR-dependent and -independent pathways. Cancer Cell. 2003;4(2):147–158. doi: 10.1016/S1535-6108(03)00187-9. [DOI] [PubMed] [Google Scholar]
- 87.Hudson CC, et al. Regulation of hypoxia-inducible factor 1alpha expression and function by the mammalian target of rapamycin. Mol Cell Biol. 2002;22(20):7004–7014. doi: 10.1128/MCB.22.20.7004-7014.2002. [DOI] [PMC free article] [PubMed] [Google Scholar]
- 88.Pore N, et al. Akt1 activation can augment hypoxia-inducible factor-1alpha expression by increasing protein translation through a mammalian target of rapamycin-independent pathway. Mol Cancer Res. 2006;4(7):471–479. doi: 10.1158/1541-7786.MCR-05-0234. [DOI] [PubMed] [Google Scholar]
- 89.Kietzmann T, Gorlach A. Reactive oxygen species in the control of hypoxia-inducible factor-mediated gene expression. Semin Cell Dev Biol. 2005;16(4–5):474–486. doi: 10.1016/j.semcdb.2005.03.010. [DOI] [PubMed] [Google Scholar]
- 90.Wang Y, et al. Targeting HIF1alpha eliminates cancer stem cells in hematological malignancies. Cell Stem Cell. 2011;8(4):399–411. doi: 10.1016/j.stem.2011.02.006. [DOI] [PMC free article] [PubMed] [Google Scholar]
- 91.Mak P, et al. ERbeta impedes prostate cancer EMT by destabilizing HIF-1alpha and inhibiting VEGF-mediated snail nuclear localization: implications for Gleason grading. Cancer Cell. 2010;17(4):319–332. doi: 10.1016/j.ccr.2010.02.030. [DOI] [PMC free article] [PubMed] [Google Scholar]
- 92.Huang LE, et al. Hypoxia-induced genetic instability–a calculated mechanism underlying tumor progression. J Mol Med (Berl) 2007;85(2):139–148. doi: 10.1007/s00109-006-0133-6. [DOI] [PubMed] [Google Scholar]
- 93.Liao D, et al. Hypoxia-inducible factor-1alpha is a key regulator of metastasis in a transgenic model of cancer initiation and progression. Cancer Res. 2007;67(2):563–572. doi: 10.1158/0008-5472.CAN-06-2701. [DOI] [PubMed] [Google Scholar]
- 94.Luo W, et al. Pyruvate kinase M2 is a PHD3-stimulated coactivator for hypoxia-inducible factor 1. Cell. 2011;145(5):732–744. doi: 10.1016/j.cell.2011.03.054. [DOI] [PMC free article] [PubMed] [Google Scholar]
- 95.Swietach P, Vaughan-Jones RD, Harris AL. Regulation of tumor pH and the role of carbonic anhydrase 9. Cancer Metastasis Rev. 2007;26(2):299–310. doi: 10.1007/s10555-007-9064-0. [DOI] [PubMed] [Google Scholar]
- 96.Lukashev D, Ohta A, Sitkovsky M. Hypoxia-dependent anti-inflammatory pathways in protection of cancerous tissues. Cancer Metastasis Rev. 2007;26(2):273–279. doi: 10.1007/s10555-007-9054-2. [DOI] [PubMed] [Google Scholar]
- 97.Chan DA, Giaccia AJ. Hypoxia, gene expression, and metastasis. Cancer Metastasis Rev. 2007;26(2):333–339. doi: 10.1007/s10555-007-9063-1. [DOI] [PubMed] [Google Scholar]
- 98.Moeller BJ, Richardson RA, Dewhirst MW. Hypoxia and radiotherapy: opportunities for improved outcomes in cancer treatment. Cancer Metastasis Rev. 2007;26(2):241–248. doi: 10.1007/s10555-007-9056-0. [DOI] [PubMed] [Google Scholar]
- 99.Hu CJ, et al. The N-terminal transactivation domain confers target gene specificity of hypoxia-inducible factors HIF-1alpha and HIF-2alpha. Mol Biol Cell. 2007;18(11):4528–4542. doi: 10.1091/mbc.e06-05-0419. [DOI] [PMC free article] [PubMed] [Google Scholar]
- 100.Salnikow K, et al. Regulation of hypoxia-inducible genes by ETS1 transcription factor. Carcinogenesis. 2008;29(8):1493–1499. doi: 10.1093/carcin/bgn088. [DOI] [PMC free article] [PubMed] [Google Scholar]
- 101.Jiang BH, et al. Transactivation and inhibitory domains of hypoxia-inducible factor 1alpha. Modulation of transcriptional activity by oxygen tension. J Biol Chem, 1997;272(31):19253–60. [DOI] [PubMed]
- 102.Dengler VL, Galbraith M, Espinosa JM. Transcriptional regulation by hypoxia inducible factors. Crit Rev Biochem Mol Biol. 2014;49(1):1–15. doi: 10.3109/10409238.2013.838205. [DOI] [PMC free article] [PubMed] [Google Scholar]
- 103.Samanta D, Prabhakar NR, Semenza GL. Systems biology of oxygen homeostasis. Wiley Interdiscip Rev Syst Biol Med. 2017;9:4. [DOI] [PMC free article] [PubMed]
- 104.Ortiz-Barahona A, et al. Genome-wide identification of hypoxia-inducible factor binding sites and target genes by a probabilistic model integrating transcription-profiling data and in silico binding site prediction. Nucleic Acids Res. 2010;38(7):2332–2345. doi: 10.1093/nar/gkp1205. [DOI] [PMC free article] [PubMed] [Google Scholar]
- 105.Chi JT, et al. Gene expression programs in response to hypoxia: cell type specificity and prognostic significance in human cancers. PLoS Med. 2006;3(3):e47. doi: 10.1371/journal.pmed.0030047. [DOI] [PMC free article] [PubMed] [Google Scholar]
- 106.Warnecke C, et al. The specific contribution of hypoxia-inducible factor-2alpha to hypoxic gene expression in vitro is limited and modulated by cell type-specific and exogenous factors. Exp Cell Res. 2008;314(10):2016–2027. doi: 10.1016/j.yexcr.2008.03.003. [DOI] [PubMed] [Google Scholar]
- 107.Pawlus MR, Hu CJ. Enhanceosomes as integrators of hypoxia inducible factor (HIF) and other transcription factors in the hypoxic transcriptional response. Cell Signal. 2013;25(9):1895–1903. doi: 10.1016/j.cellsig.2013.05.018. [DOI] [PMC free article] [PubMed] [Google Scholar]
- 108.Hu CJ, et al. Differential roles of hypoxia-inducible factor 1alpha (HIF-1alpha) and HIF-2alpha in hypoxic gene regulation. Mol Cell Biol. 2003;23(24):9361–9374. doi: 10.1128/MCB.23.24.9361-9374.2003. [DOI] [PMC free article] [PubMed] [Google Scholar]
- 109.Takeda N, et al. Endothelial PAS domain protein 1 gene promotes angiogenesis through the transactivation of both vascular endothelial growth factor and its receptor, Flt-1. Circ Res. 2004;95(2):146–153. doi: 10.1161/01.RES.0000134920.10128.b4. [DOI] [PubMed] [Google Scholar]
- 110.Koh MY, et al. The hypoxia-associated factor switches cells from HIF-1alpha- to HIF-2alpha-dependent signaling promoting stem cell characteristics, aggressive tumor growth and invasion. Cancer Res. 2011;71(11):4015–4027. doi: 10.1158/0008-5472.CAN-10-4142. [DOI] [PMC free article] [PubMed] [Google Scholar]
- 111.Koh MY, Powis G. Passing the baton: the HIF switch. Trends Biochem Sci. 2012;37(9):364–372. doi: 10.1016/j.tibs.2012.06.004. [DOI] [PMC free article] [PubMed] [Google Scholar]
- 112.Cavadas MAS, Taylor CT, Cheong A. Acquisition of temporal HIF transcriptional activity using a secreted luciferase assay. Methods Mol Biol. 2018;1742:37–44. doi: 10.1007/978-1-4939-7665-2_4. [DOI] [PubMed] [Google Scholar]
- 113.Gu YZ, et al. Molecular characterization and chromosomal localization of a third alpha-class hypoxia inducible factor subunit, HIF3alpha. Gene Expr. 1998;7(3):205–213. [PMC free article] [PubMed] [Google Scholar]
- 114.Makino Y, et al. Inhibitory PAS domain protein is a negative regulator of hypoxia-inducible gene expression. Nature. 2001;414(6863):550–554. doi: 10.1038/35107085. [DOI] [PubMed] [Google Scholar]
- 115.Makino Y, et al. Inhibitory PAS domain protein (IPAS) is a hypoxia-inducible splicing variant of the hypoxia-inducible factor-3alpha locus. J Biol Chem. 2002;277(36):32405–32408. doi: 10.1074/jbc.C200328200. [DOI] [PubMed] [Google Scholar]
- 116.Maynard MA, et al. Human HIF-3alpha4 is a dominant-negative regulator of HIF-1 and is down-regulated in renal cell carcinoma. FASEB J. 2005;19(11):1396–1406. doi: 10.1096/fj.05-3788com. [DOI] [PubMed] [Google Scholar]
- 117.Cavadas MA, et al. REST is a hypoxia-responsive transcriptional repressor. Sci Rep. 2016;6:31355. doi: 10.1038/srep31355. [DOI] [PMC free article] [PubMed] [Google Scholar]
- 118.Cavadas MAS, Cheong A, Taylor CT. The regulation of transcriptional repression in hypoxia. Exp Cell Res. 2017;356(2):173–181. doi: 10.1016/j.yexcr.2017.02.024. [DOI] [PubMed] [Google Scholar]
- 119.Bindra RS, et al. Hypoxia-induced down-regulation of BRCA1 expression by E2Fs. Cancer Res. 2005;65(24):11597–11604. doi: 10.1158/0008-5472.CAN-05-2119. [DOI] [PubMed] [Google Scholar]
- 120.Bindra RS, et al. Down-regulation of Rad51 and decreased homologous recombination in hypoxic cancer cells. Mol Cell Biol. 2004;24(19):8504–8518. doi: 10.1128/MCB.24.19.8504-8518.2004. [DOI] [PMC free article] [PubMed] [Google Scholar]
- 121.Fanale D, et al. Hypoxia and human genome stability: downregulation of BRCA2 expression in breast cancer cell lines. Biomed Res Int. 2013;2013:746858. doi: 10.1155/2013/746858. [DOI] [PMC free article] [PubMed] [Google Scholar]
- 122.Jongen JMJ, et al. Downregulation of DNA repair proteins and increased DNA damage in hypoxic colon cancer cells is a therapeutically exploitable vulnerability. Oncotarget. 2017;8(49):86296–86311. doi: 10.18632/oncotarget.21145. [DOI] [PMC free article] [PubMed] [Google Scholar]
- 123.Cowman S, Pizer B, Sée V. Downregulation of both mismatch repair and non-homologous end-joining pathways in hypoxic brain tumour cell lines. bioRxiv. 2020;15:2020. [DOI] [PMC free article] [PubMed]
- 124.Scanlon SE, Glazer PM. Multifaceted control of DNA repair pathways by the hypoxic tumor microenvironment. DNA Repair (Amst) 2015;32:180–189. doi: 10.1016/j.dnarep.2015.04.030. [DOI] [PMC free article] [PubMed] [Google Scholar]
- 125.Luoto KR, Kumareswaran R, Bristow RG. Tumor hypoxia as a driving force in genetic instability. Genome Integr. 2013;4(1):5. doi: 10.1186/2041-9414-4-5. [DOI] [PMC free article] [PubMed] [Google Scholar]
- 126.Foskolou IP, et al. Ribonucleotide reductase requires subunit switching in hypoxia to maintain DNA replication. Mol Cell. 2017;66(2):206–20. [DOI] [PMC free article] [PubMed]
- 127.Hammond EM, Dorie MJ, Giaccia AJ. ATR/ATM targets are phosphorylated by ATR in response to hypoxia and ATM in response to reoxygenation. J Biol Chem. 2003;278(14):12207–12213. doi: 10.1074/jbc.M212360200. [DOI] [PubMed] [Google Scholar]
- 128.Hsieh CH, et al. NADPH oxidase subunit 4-mediated reactive oxygen species contribute to cycling hypoxia-promoted tumor progression in glioblastoma multiforme. PLoS ONE. 2011;6(9):e23945. doi: 10.1371/journal.pone.0023945. [DOI] [PMC free article] [PubMed] [Google Scholar]
- 129.Muz B, et al. The role of hypoxia in cancer progression, angiogenesis, metastasis, and resistance to therapy. Hypoxia (Auckl) 2015;3:83–92. doi: 10.2147/HP.S93413. [DOI] [PMC free article] [PubMed] [Google Scholar]
- 130.Schaaf MB, Garg AD, Agostinis P. Defining the role of the tumor vasculature in antitumor immunity and immunotherapy. Cell Death Dis. 2018;9(2):115. doi: 10.1038/s41419-017-0061-0. [DOI] [PMC free article] [PubMed] [Google Scholar]
- 131.Padera TP, et al. Pathology: cancer cells compress intratumour vessels. Nature. 2004;427(6976):695. doi: 10.1038/427695a. [DOI] [PubMed] [Google Scholar]
- 132.Welti J, et al. Recent molecular discoveries in angiogenesis and antiangiogenic therapies in cancer. J Clin Invest. 2013;123(8):3190–3200. doi: 10.1172/JCI70212. [DOI] [PMC free article] [PubMed] [Google Scholar]
- 133.Hatfield S, et al. Mechanistic justifications of systemic therapeutic oxygenation of tumors to weaken the hypoxia inducible factor 1alpha-mediated immunosuppression. Adv Exp Med Biol. 2019;1136:113–121. doi: 10.1007/978-3-030-12734-3_8. [DOI] [PubMed] [Google Scholar]
- 134.Hatfield SM, et al. Systemic oxygenation weakens the hypoxia and hypoxia inducible factor 1alpha-dependent and extracellular adenosine-mediated tumor protection. J Mol Med (Berl) 2014;92(12):1283–1292. doi: 10.1007/s00109-014-1189-3. [DOI] [PMC free article] [PubMed] [Google Scholar]
- 135.Hatfield, S.M., et al., Immunological mechanisms of the antitumor effects of supplemental oxygenation. Sci Transl Med, 2015. 7(277): p. 277ra30. [DOI] [PMC free article] [PubMed]
- 136.Schito L, et al. Hypoxia-inducible factor 1-dependent expression of platelet-derived growth factor B promotes lymphatic metastasis of hypoxic breast cancer cells. Proc Natl Acad Sci USA. 2012;109(40):E2707–E2716. doi: 10.1073/pnas.1214019109. [DOI] [PMC free article] [PubMed] [Google Scholar]
- 137.Forsythe JA, et al. Activation of vascular endothelial growth factor gene transcription by hypoxia-inducible factor 1. Mol Cell Biol. 1996;16(9):4604–4613. doi: 10.1128/MCB.16.9.4604. [DOI] [PMC free article] [PubMed] [Google Scholar]
- 138.Simon MP, Tournaire R, Pouyssegur J. The angiopoietin-2 gene of endothelial cells is up-regulated in hypoxia by a HIF binding site located in its first intron and by the central factors GATA-2 and Ets-1. J Cell Physiol. 2008;217(3):809–818. doi: 10.1002/jcp.21558. [DOI] [PubMed] [Google Scholar]
- 139.Chaturvedi P, et al. Hypoxia-inducible factor-dependent breast cancer-mesenchymal stem cell bidirectional signaling promotes metastasis. J Clin Invest. 2013;123(1):189–205. doi: 10.1172/JCI64993. [DOI] [PMC free article] [PubMed] [Google Scholar]
- 140.Kelly BD, et al. Cell type-specific regulation of angiogenic growth factor gene expression and induction of angiogenesis in nonischemic tissue by a constitutively active form of hypoxia-inducible factor 1. Circ Res. 2003;93(11):1074–1081. doi: 10.1161/01.RES.0000102937.50486.1B. [DOI] [PubMed] [Google Scholar]
- 141.Krock BL, Skuli N, Simon MC. Hypoxia-induced angiogenesis: good and evil. Genes Cancer. 2011;2(12):1117–1133. doi: 10.1177/1947601911423654. [DOI] [PMC free article] [PubMed] [Google Scholar]
- 142.Hitchon C, et al. Hypoxia-induced production of stromal cell-derived factor 1 (CXCL12) and vascular endothelial growth factor by synovial fibroblasts. Arthritis Rheum. 2002;46(10):2587–2597. doi: 10.1002/art.10520. [DOI] [PubMed] [Google Scholar]
- 143.Elvert G, et al. Cooperative interaction of hypoxia-inducible factor-2alpha (HIF-2alpha) and Ets-1 in the transcriptional activation of vascular endothelial growth factor receptor-2 (Flk-1) J Biol Chem. 2003;278(9):7520–7530. doi: 10.1074/jbc.M211298200. [DOI] [PubMed] [Google Scholar]
- 144.Yamashita K, et al. Molecular regulation of the endothelin-1 gene by hypoxia. Contributions of hypoxia-inducible factor-1, activator protein-1, GATA-2, AND p300/CBP. J Biol Chem, 2001;276(16):12645–53. [DOI] [PubMed]
- 145.Kowalczyk A, et al. The role of endothelin-1 and endothelin receptor antagonists in inflammatory response and sepsis. Arch Immunol Ther Exp (Warsz) 2015;63(1):41–52. doi: 10.1007/s00005-014-0310-1. [DOI] [PMC free article] [PubMed] [Google Scholar]
- 146.Spinella F, et al. Endothelin-1 induces vascular endothelial growth factor by increasing hypoxia-inducible factor-1alpha in ovarian carcinoma cells. J Biol Chem. 2002;277(31):27850–27855. doi: 10.1074/jbc.M202421200. [DOI] [PubMed] [Google Scholar]
- 147.Wulfing P, et al. Endothelin-1-, endothelin-A-, and endothelin-B-receptor expression is correlated with vascular endothelial growth factor expression and angiogenesis in breast cancer. Clin Cancer Res. 2004;10(7):2393–2400. doi: 10.1158/1078-0432.CCR-03-0115. [DOI] [PubMed] [Google Scholar]
- 148.Buckanovich RJ, et al. Endothelin B receptor mediates the endothelial barrier to T cell homing to tumors and disables immune therapy. Nat Med. 2008;14(1):28–36. doi: 10.1038/nm1699. [DOI] [PubMed] [Google Scholar]
- 149.Corpechot C, et al. Hypoxia-induced VEGF and collagen I expressions are associated with angiogenesis and fibrogenesis in experimental cirrhosis. Hepatology. 2002;35(5):1010–1021. doi: 10.1053/jhep.2002.32524. [DOI] [PubMed] [Google Scholar]
- 150.Gonzalez AC, et al. Wound healing—a literature review. An Bras Dermatol. 2016;91(5):614–620. doi: 10.1590/abd1806-4841.20164741. [DOI] [PMC free article] [PubMed] [Google Scholar]
- 151.Mao Y, et al. Stromal cells in tumor microenvironment and breast cancer. Cancer Metastasis Rev. 2013;32(1–2):303–315. doi: 10.1007/s10555-012-9415-3. [DOI] [PMC free article] [PubMed] [Google Scholar]
- 152.Pietras K, Ostman A. Hallmarks of cancer: interactions with the tumor stroma. Exp Cell Res. 2010;316(8):1324–1331. doi: 10.1016/j.yexcr.2010.02.045. [DOI] [PubMed] [Google Scholar]
- 153.Katsuno Y, Lamouille S, Derynck R. TGF-beta signaling and epithelial-mesenchymal transition in cancer progression. Curr Opin Oncol. 2013;25(1):76–84. doi: 10.1097/CCO.0b013e32835b6371. [DOI] [PubMed] [Google Scholar]
- 154.Gonzalez, D.M. and D. Medici, Signaling mechanisms of the epithelial-mesenchymal transition. Sci Signal. 2014;7(344):re8. [DOI] [PMC free article] [PubMed]
- 155.Kim D, et al. Epidermal growth factor improves the migration and contractility of aged fibroblasts cultured on 3D collagen matrices. Int J Mol Med. 2015;35(4):1017–1025. doi: 10.3892/ijmm.2015.2088. [DOI] [PubMed] [Google Scholar]
- 156.Rajkumar VS, et al. Platelet-derived growth factor-beta receptor activation is essential for fibroblast and pericyte recruitment during cutaneous wound healing. Am J Pathol. 2006;169(6):2254–2265. doi: 10.2353/ajpath.2006.060196. [DOI] [PMC free article] [PubMed] [Google Scholar]
- 157.Tanghetti E, et al. Biological activity of substrate-bound basic fibroblast growth factor (FGF2): recruitment of FGF receptor-1 in endothelial cell adhesion contacts. Oncogene. 2002;21(24):3889–3897. doi: 10.1038/sj.onc.1205407. [DOI] [PubMed] [Google Scholar]
- 158.Lin CH, et al. CXCL12 induces connective tissue growth factor expression in human lung fibroblasts through the Rac1/ERK, JNK, and AP-1 pathways. PLoS ONE. 2014;9(8):e104746. doi: 10.1371/journal.pone.0104746. [DOI] [PMC free article] [PubMed] [Google Scholar]
- 159.Monteran L, Erez N. The dark side of fibroblasts: cancer-associated fibroblasts as mediators of immunosuppression in the tumor microenvironment. Front Immunol. 2019;10:1835. doi: 10.3389/fimmu.2019.01835. [DOI] [PMC free article] [PubMed] [Google Scholar]
- 160.Borriello L, et al. Cancer-associated fibroblasts share characteristics and protumorigenic activity with mesenchymal stromal cells. Cancer Res. 2017;77(18):5142–5157. doi: 10.1158/0008-5472.CAN-16-2586. [DOI] [PMC free article] [PubMed] [Google Scholar]
- 161.LeBleu VS, Kalluri R. A peek into cancer-associated fibroblasts: origins, functions and translational impact. Dis Model Mech. 2018;11:4. [DOI] [PMC free article] [PubMed]
- 162.Liu T, et al. Cancer-associated fibroblasts build and secure the tumor microenvironment. Front Cell Dev Biol. 2019;7:60. doi: 10.3389/fcell.2019.00060. [DOI] [PMC free article] [PubMed] [Google Scholar]
- 163.Dewan MZ, et al. Stromal cell-derived factor-1 and CXCR4 receptor interaction in tumor growth and metastasis of breast cancer. Biomed Pharmacother. 2006;60(6):273–276. doi: 10.1016/j.biopha.2006.06.004. [DOI] [PubMed] [Google Scholar]
- 164.Sugihara H, et al. Cancer-associated fibroblast-derived CXCL12 causes tumor progression in adenocarcinoma of the esophagogastric junction. Med Oncol. 2015;32(6):618. doi: 10.1007/s12032-015-0618-7. [DOI] [PubMed] [Google Scholar]
- 165.Wang Z, et al. Transglutaminase-2 of pancreatic cancer cells assembles a CXCL12-keratin 19-coat that mediates the resistance to immunotherapy. bioRxiv, 2019;2:776419.
- 166.Brabletz T, et al. EMT in cancer. Nat Rev Cancer. 2018;18(2):128–134. doi: 10.1038/nrc.2017.118. [DOI] [PubMed] [Google Scholar]
- 167.Yang P, Hu Y, Zhou Q. The CXCL12-CXCR4 signaling axis plays a key role in cancer metastasis and is a potential target for developing novel therapeutics against metastatic cancer. Curr Med Chem. 2019. [DOI] [PubMed]
- 168.Kurata T, et al. Low-dose eribulin mesylate exerts antitumor effects in gastric cancer by inhibiting fibrosis via the suppression of epithelial-mesenchymal transition and acts synergistically with 5-fluorouracil. Cancer Manag Res. 2018;10:2729–2742. doi: 10.2147/CMAR.S167846. [DOI] [PMC free article] [PubMed] [Google Scholar]
- 169.Suarez-Carmona M, et al. EMT and inflammation: inseparable actors of cancer progression. Mol Oncol. 2017;11(7):805–823. doi: 10.1002/1878-0261.12095. [DOI] [PMC free article] [PubMed] [Google Scholar]
- 170.van der Rest M, Garrone R. Collagen family of proteins. FASEB J. 1991;5(13):2814–2823. doi: 10.1096/fasebj.5.13.1916105. [DOI] [PubMed] [Google Scholar]
- 171.Shapiro FD, Eyre DR. Collagen polymorphism in extracellular matrix of human osteosarcoma. J Natl Cancer Inst. 1982;69(5):1009–1016. [PubMed] [Google Scholar]
- 172.Jussila T, et al. Collagen formation in extracellular matrix of transplants of human transformed keratinocyte cell lines. Anticancer Res. 2002;22(3):1705–1711. [PubMed] [Google Scholar]
- 173.Kauppila S, et al. Aberrant type I and type III collagen gene expression in human breast cancer in vivo. J Pathol. 1998;186(3):262–268. doi: 10.1002/(SICI)1096-9896(1998110)186:3<262::AID-PATH191>3.0.CO;2-3. [DOI] [PubMed] [Google Scholar]
- 174.Zhu GG, et al. Immunohistochemical study of type I collagen and type I pN-collagen in benign and malignant ovarian neoplasms. Cancer. 1995;75(4):1010–1017. doi: 10.1002/1097-0142(19950215)75:4<1010::AID-CNCR2820750417>3.0.CO;2-O. [DOI] [PubMed] [Google Scholar]
- 175.Erler JT, et al. Hypoxia-induced lysyl oxidase is a critical mediator of bone marrow cell recruitment to form the premetastatic niche. Cancer Cell. 2009;15(1):35–44. doi: 10.1016/j.ccr.2008.11.012. [DOI] [PMC free article] [PubMed] [Google Scholar]
- 176.Schietke R, et al. The lysyl oxidases LOX and LOXL2 are necessary and sufficient to repress E-cadherin in hypoxia: insights into cellular transformation processes mediated by HIF-1. J Biol Chem. 2010;285(9):6658–6669. doi: 10.1074/jbc.M109.042424. [DOI] [PMC free article] [PubMed] [Google Scholar]
- 177.Wong CC, et al. Hypoxia-inducible factor 1 is a master regulator of breast cancer metastatic niche formation. Proc Natl Acad Sci USA. 2011;108(39):16369–16374. doi: 10.1073/pnas.1113483108. [DOI] [PMC free article] [PubMed] [Google Scholar]
- 178.Gilkes DM, et al. Procollagen lysyl hydroxylase 2 is essential for hypoxia-induced breast cancer metastasis. Mol Cancer Res. 2013;11(5):456–466. doi: 10.1158/1541-7786.MCR-12-0629. [DOI] [PMC free article] [PubMed] [Google Scholar] [Retracted]
- 179.Eisinger-Mathason TS, et al. Hypoxia-dependent modification of collagen networks promotes sarcoma metastasis. Cancer Discov. 2013;3(10):1190–1205. doi: 10.1158/2159-8290.CD-13-0118. [DOI] [PMC free article] [PubMed] [Google Scholar]
- 180.Aro E, et al. Hypoxia-inducible factor-1 (HIF-1) but not HIF-2 is essential for hypoxic induction of collagen prolyl 4-hydroxylases in primary newborn mouse epiphyseal growth plate chondrocytes. J Biol Chem. 2012;287(44):37134–37144. doi: 10.1074/jbc.M112.352872. [DOI] [PMC free article] [PubMed] [Google Scholar]
- 181.Hofbauer KH, et al. Oxygen tension regulates the expression of a group of procollagen hydroxylases. Eur J Biochem. 2003;270(22):4515–4522. doi: 10.1046/j.1432-1033.2003.03846.x. [DOI] [PubMed] [Google Scholar]
- 182.Xiong G, et al. Prolyl-4-hydroxylase alpha subunit 2 promotes breast cancer progression and metastasis by regulating collagen deposition. BMC Cancer. 2014;14:1. doi: 10.1186/1471-2407-14-1. [DOI] [PMC free article] [PubMed] [Google Scholar]
- 183.Gilkes DM, et al. Collagen prolyl hydroxylases are essential for breast cancer metastasis. Cancer Res. 2013;73(11):3285–3296. doi: 10.1158/0008-5472.CAN-12-3963. [DOI] [PMC free article] [PubMed] [Google Scholar]
- 184.Kuczek DE, et al. Collagen density regulates the activity of tumor-infiltrating T cells. J Immunother Cancer. 2019;7(1):68. doi: 10.1186/s40425-019-0556-6. [DOI] [PMC free article] [PubMed] [Google Scholar]
- 185.Wong WJ, et al. Hypoxia-inducible factors regulate filaggrin expression and epidermal barrier function. J Invest Dermatol. 2015;135(2):454–461. doi: 10.1038/jid.2014.283. [DOI] [PMC free article] [PubMed] [Google Scholar]
- 186.Takubo K, et al. Regulation of glycolysis by Pdk functions as a metabolic checkpoint for cell cycle quiescence in hematopoietic stem cells. Cell Stem Cell. 2013;12(1):49–61. doi: 10.1016/j.stem.2012.10.011. [DOI] [PMC free article] [PubMed] [Google Scholar]
- 187.Varum S, et al. Energy metabolism in human pluripotent stem cells and their differentiated counterparts. PLoS ONE. 2011;6(6):e20914. doi: 10.1371/journal.pone.0020914. [DOI] [PMC free article] [PubMed] [Google Scholar]
- 188.Xie J, et al. Beyond Warburg effect–dual metabolic nature of cancer cells. Sci Rep. 2014;4:4927. doi: 10.1038/srep04927. [DOI] [PMC free article] [PubMed] [Google Scholar]
- 189.Chen C, et al. Regulation of glut1 mRNA by hypoxia-inducible factor-1. Interaction between H-ras and hypoxia. J Biol Chem. 2001;276(12):9519–25. [DOI] [PubMed]
- 190.Mimura I, et al. Dynamic change of chromatin conformation in response to hypoxia enhances the expression of GLUT3 (SLC2A3) by cooperative interaction of hypoxia-inducible factor 1 and KDM3A. Mol Cell Biol. 2012;32(15):3018–3032. doi: 10.1128/MCB.06643-11. [DOI] [PMC free article] [PubMed] [Google Scholar]
- 191.Wood IS, et al. Hypoxia increases expression of selective facilitative glucose transporters (GLUT) and 2-deoxy-D-glucose uptake in human adipocytes. Biochem Biophys Res Commun. 2007;361(2):468–473. doi: 10.1016/j.bbrc.2007.07.032. [DOI] [PMC free article] [PubMed] [Google Scholar]
- 192.Wang J, et al. Glucose transporter GLUT1 expression and clinical outcome in solid tumors: a systematic review and meta-analysis. Oncotarget. 2017;8(10):16875–16886. doi: 10.18632/oncotarget.15171. [DOI] [PMC free article] [PubMed] [Google Scholar]
- 193.Semenza GL. HIF-1 mediates metabolic responses to intratumoral hypoxia and oncogenic mutations. J Clin Invest. 2013;123(9):3664–3671. doi: 10.1172/JCI67230. [DOI] [PMC free article] [PubMed] [Google Scholar]
- 194.Brizel DM, et al. Elevated tumor lactate concentrations predict for an increased risk of metastases in head-and-neck cancer. Int J Radiat Oncol Biol Phys. 2001;51(2):349–353. doi: 10.1016/S0360-3016(01)01630-3. [DOI] [PubMed] [Google Scholar]
- 195.Walenta S, et al. High lactate levels predict likelihood of metastases, tumor recurrence, and restricted patient survival in human cervical cancers. Cancer Res. 2000;60(4):916–921. [PubMed] [Google Scholar]
- 196.Erra Diaz F, Dantas E, Geffner J. Unravelling the interplay between extracellular acidosis and immune cells. Mediators Inflamm. 2018;2018:1218297. [DOI] [PMC free article] [PubMed]
- 197.Kellum JA, Song M, Li J. Science review: extracellular acidosis and the immune response: clinical and physiologic implications. Crit Care. 2004;8(5):331–336. doi: 10.1186/cc2900. [DOI] [PMC free article] [PubMed] [Google Scholar]
- 198.Chiche J, Brahimi-Horn MC, Pouyssegur J. Tumour hypoxia induces a metabolic shift causing acidosis: a common feature in cancer. J Cell Mol Med. 2010;14(4):771–794. doi: 10.1111/j.1582-4934.2009.00994.x. [DOI] [PMC free article] [PubMed] [Google Scholar]
- 199.Brahimi-Horn MC, Pouyssegur J. Hypoxia in cancer cell metabolism and pH regulation. Essays Biochem. 2007;43:165–178. doi: 10.1042/bse0430165. [DOI] [PubMed] [Google Scholar]
- 200.Svastova E, et al. Hypoxia activates the capacity of tumor-associated carbonic anhydrase IX to acidify extracellular pH. FEBS Lett. 2004;577(3):439–445. doi: 10.1016/j.febslet.2004.10.043. [DOI] [PubMed] [Google Scholar]
- 201.Bobulescu IA, Di Sole F, Moe OW. Na+/H+ exchangers: physiology and link to hypertension and organ ischemia. Curr Opin Nephrol Hypertens. 2005;14(5):485–494. doi: 10.1097/01.mnh.0000174146.52915.5d. [DOI] [PMC free article] [PubMed] [Google Scholar]
- 202.Rodriguez PC, et al. Arginase I-producing myeloid-derived suppressor cells in renal cell carcinoma are a subpopulation of activated granulocytes. Cancer Res. 2009;69(4):1553–1560. doi: 10.1158/0008-5472.CAN-08-1921. [DOI] [PMC free article] [PubMed] [Google Scholar]
- 203.Rodriguez PC, Ochoa AC. Arginine regulation by myeloid derived suppressor cells and tolerance in cancer: mechanisms and therapeutic perspectives. Immunol Rev. 2008;222:180–191. doi: 10.1111/j.1600-065X.2008.00608.x. [DOI] [PMC free article] [PubMed] [Google Scholar]
- 204.Ziani L, Chouaib S, Thiery J. Alteration of the antitumor immune response by cancer-associated fibroblasts. Front Immunol. 2018;9:414. doi: 10.3389/fimmu.2018.00414. [DOI] [PMC free article] [PubMed] [Google Scholar]
- 205.Platten M, Wick W, Van den Eynde BJ. Tryptophan catabolism in cancer: beyond IDO and tryptophan depletion. Cancer Res. 2012;72(21):5435–5440. doi: 10.1158/0008-5472.CAN-12-0569. [DOI] [PubMed] [Google Scholar]
- 206.Schmidt SK, et al. Regulation of IDO activity by oxygen supply: inhibitory effects on antimicrobial and immunoregulatory functions. PLoS ONE. 2013;8(5):e63301. doi: 10.1371/journal.pone.0063301. [DOI] [PMC free article] [PubMed] [Google Scholar]
- 207.Ye Z, et al. Role of IDO and TDO in cancers and related diseases and the therapeutic implications. J Cancer. 2019;10(12):2771–2782. doi: 10.7150/jca.31727. [DOI] [PMC free article] [PubMed] [Google Scholar]
- 208.Mohapatra SR, et al. Hypoxia inducible factor 1alpha inhibits the expression of immunosuppressive tryptophan-2,3-dioxygenase in glioblastoma. Front Immunol. 2019;10:2762. doi: 10.3389/fimmu.2019.02762. [DOI] [PMC free article] [PubMed] [Google Scholar]
- 209.Sener Z, et al. T helper cell activation and expansion is sensitive to glutaminase inhibition under both hypoxic and normoxic conditions. PLoS ONE. 2016;11(7):e0160291. doi: 10.1371/journal.pone.0160291. [DOI] [PMC free article] [PubMed] [Google Scholar]
- 210.Yin Z, et al. Targeting T cell metabolism in the tumor microenvironment: an anti-cancer therapeutic strategy. J Exp Clin Cancer Res. 2019;38(1):403. doi: 10.1186/s13046-019-1409-3. [DOI] [PMC free article] [PubMed] [Google Scholar]
- 211.Patel CH, Powell JD. Targeting T cell metabolism to regulate T cell activation, differentiation and function in disease. Curr Opin Immunol. 2017;46:82–88. doi: 10.1016/j.coi.2017.04.006. [DOI] [PMC free article] [PubMed] [Google Scholar]
- 212.Xiang L, et al. Glutaminase 1 expression in colorectal cancer cells is induced by hypoxia and required for tumor growth, invasion, and metastatic colonization. Cell Death Dis. 2019;10(2):40. doi: 10.1038/s41419-018-1291-5. [DOI] [PMC free article] [PubMed] [Google Scholar]
- 213.Song M, et al. IRE1alpha-XBP1 controls T cell function in ovarian cancer by regulating mitochondrial activity. Nature. 2018;562(7727):423–428. doi: 10.1038/s41586-018-0597-x. [DOI] [PMC free article] [PubMed] [Google Scholar]
- 214.Hong Z, et al. Subacute hypoxia decreases voltage-activated potassium channel expression and function in pulmonary artery myocytes. Am J Respir Cell Mol Biol. 2004;31(3):337–343. doi: 10.1165/rcmb.2003-0386OC. [DOI] [PubMed] [Google Scholar]
- 215.Chimote AA, Kuras Z, Conforti L. Disruption of kv1.3 channel forward vesicular trafficking by hypoxia in human T lymphocytes. J Biol Chem. 2012;287(3):2055–67. [DOI] [PMC free article] [PubMed]
- 216.Conforti L, et al. Hypoxia regulates expression and activity of Kv1.3 channels in T lymphocytes: a possible role in T cell proliferation. J Immunol. 2003;170(2):695–702. [DOI] [PubMed]
- 217.Riera-Domingo C, et al. Immunity, hypoxia, and metabolism-the menage a trois of cancer: implications for immunotherapy. Physiol Rev. 2020;100(1):1–102. doi: 10.1152/physrev.00018.2019. [DOI] [PubMed] [Google Scholar]
- 218.Noman MZ, et al. Improving cancer immunotherapy by targeting the hypoxic tumor microenvironment: new opportunities and challenges. Cells. 2019;8:9. [DOI] [PMC free article] [PubMed]
- 219.Du R, et al. HIF1alpha induces the recruitment of bone marrow-derived vascular modulatory cells to regulate tumor angiogenesis and invasion. Cancer Cell. 2008;13(3):206–220. doi: 10.1016/j.ccr.2008.01.034. [DOI] [PMC free article] [PubMed] [Google Scholar]
- 220.Lin S, et al. Chemokine C–C motif receptor 5 and C–C motif ligand 5 promote cancer cell migration under hypoxia. Cancer Sci. 2012;103(5):904–912. doi: 10.1111/j.1349-7006.2012.02259.x. [DOI] [PMC free article] [PubMed] [Google Scholar]
- 221.Schioppa T, et al. Regulation of the chemokine receptor CXCR4 by hypoxia. J Exp Med. 2003;198(9):1391–1402. doi: 10.1084/jem.20030267. [DOI] [PMC free article] [PubMed] [Google Scholar]
- 222.Casazza A, et al. Impeding macrophage entry into hypoxic tumor areas by Sema3A/Nrp1 signaling blockade inhibits angiogenesis and restores antitumor immunity. Cancer Cell. 2013;24(6):695–709. doi: 10.1016/j.ccr.2013.11.007. [DOI] [PubMed] [Google Scholar]
- 223.Dineen SP, et al. Vascular endothelial growth factor receptor 2 mediates macrophage infiltration into orthotopic pancreatic tumors in mice. Cancer Res. 2008;68(11):4340–4346. doi: 10.1158/0008-5472.CAN-07-6705. [DOI] [PubMed] [Google Scholar]
- 224.Grimshaw MJ. Endothelins and hypoxia-inducible factor in cancer. Endocr Relat Cancer. 2007;14(2):233–244. doi: 10.1677/ERC-07-0057. [DOI] [PubMed] [Google Scholar]
- 225.Grimshaw MJ, Wilson JL, Balkwill FR. Endothelin-2 is a macrophage chemoattractant: implications for macrophage distribution in tumors. Eur J Immunol. 2002;32(9):2393–2400. doi: 10.1002/1521-4141(200209)32:9<2393::AID-IMMU2393>3.0.CO;2-4. [DOI] [PubMed] [Google Scholar]
- 226.Leek RD, et al. Macrophage infiltration is associated with VEGF and EGFR expression in breast cancer. J Pathol. 2000;190(4):430–436. doi: 10.1002/(SICI)1096-9896(200003)190:4<430::AID-PATH538>3.0.CO;2-6. [DOI] [PubMed] [Google Scholar]
- 227.Mariathasan S, et al. TGFbeta attenuates tumour response to PD-L1 blockade by contributing to exclusion of T cells. Nature. 2018;554(7693):544–548. doi: 10.1038/nature25501. [DOI] [PMC free article] [PubMed] [Google Scholar]
- 228.Deaglio S, Robson SC. Ectonucleotidases as regulators of purinergic signaling in thrombosis, inflammation, and immunity. Adv Pharmacol. 2011;61:301–332. doi: 10.1016/B978-0-12-385526-8.00010-2. [DOI] [PMC free article] [PubMed] [Google Scholar]
- 229.Eltzschig HK, et al. Central role of Sp1-regulated CD39 in hypoxia/ischemia protection. Blood. 2009;113(1):224–232. doi: 10.1182/blood-2008-06-165746. [DOI] [PMC free article] [PubMed] [Google Scholar]
- 230.Tak E, et al. Protective role of hypoxia-inducible factor-1alpha-dependent CD39 and CD73 in fulminant acute liver failure. Toxicol Appl Pharmacol. 2017;314:72–81. doi: 10.1016/j.taap.2016.11.016. [DOI] [PubMed] [Google Scholar]
- 231.Chambers AM, Matosevic S. Immunometabolic dysfunction of natural killer cells mediated by the hypoxia-CD73 axis in solid tumors. Front Mol Biosci. 2019;6:60. doi: 10.3389/fmolb.2019.00060. [DOI] [PMC free article] [PubMed] [Google Scholar]
- 232.Siemens DR, et al. Hypoxia increases tumor cell shedding of MHC class I chain-related molecule: role of nitric oxide. Cancer Res. 2008;68(12):4746–4753. doi: 10.1158/0008-5472.CAN-08-0054. [DOI] [PubMed] [Google Scholar]
- 233.Sethumadhavan S, et al. Hypoxia and hypoxia-inducible factor (HIF) downregulate antigen-presenting MHC class I molecules limiting tumor cell recognition by T cells. PLoS ONE. 2017;12(11):e0187314. doi: 10.1371/journal.pone.0187314. [DOI] [PMC free article] [PubMed] [Google Scholar]
- 234.Murthy A, et al. Intratumoral hypoxia reduces IFN-gamma-mediated immunity and MHC class i induction in a preclinical tumor model. Immunohorizons. 2019;3(4):149–160. doi: 10.4049/immunohorizons.1900017. [DOI] [PMC free article] [PubMed] [Google Scholar]
- 235.Noman MZ, et al. PD-L1 is a novel direct target of HIF-1alpha, and its blockade under hypoxia enhanced MDSC-mediated T cell activation. J Exp Med. 2014;211(5):781–790. doi: 10.1084/jem.20131916. [DOI] [PMC free article] [PubMed] [Google Scholar]
- 236.Barsoum IB, et al. A mechanism of hypoxia-mediated escape from adaptive immunity in cancer cells. Cancer Res. 2014;74(3):665–674. doi: 10.1158/0008-5472.CAN-13-0992. [DOI] [PubMed] [Google Scholar]
- 237.Messai Y, et al. Renal cell carcinoma programmed death-ligand 1, a new direct target of hypoxia-inducible factor-2 alpha, is regulated by von Hippel-Lindau Gene Mutation status. Eur Urol. 2016;70(4):623–632. doi: 10.1016/j.eururo.2015.11.029. [DOI] [PubMed] [Google Scholar]
- 238.Doedens AL, et al. Hypoxia-inducible factors enhance the effector responses of CD8(+) T cells to persistent antigen. Nat Immunol. 2013;14(11):1173–1182. doi: 10.1038/ni.2714. [DOI] [PMC free article] [PubMed] [Google Scholar]
- 239.Lequeux A, et al. Impact of hypoxic tumor microenvironment and tumor cell plasticity on the expression of immune checkpoints. Cancer Lett. 2019;458:13–20. doi: 10.1016/j.canlet.2019.05.021. [DOI] [PubMed] [Google Scholar]
- 240.Yaghi L, et al. Hypoxia inducible factor-1 mediates the expression of the immune checkpoint HLA-G in glioma cells through hypoxia response element located in exon 2. Oncotarget. 2016;7(39):63690–63707. doi: 10.18632/oncotarget.11628. [DOI] [PMC free article] [PubMed] [Google Scholar]
- 241.Samanta D, et al. Chemotherapy induces enrichment of CD47(+)/CD73(+)/PDL1(+) immune evasive triple-negative breast cancer cells. Proc Natl Acad Sci U S A. 2018;115(6):E1239–E1248. doi: 10.1073/pnas.1718197115. [DOI] [PMC free article] [PubMed] [Google Scholar]
- 242.Michaels AD, et al. CD47 blockade as an adjuvant immunotherapy for resectable pancreatic cancer. Clin Cancer Res. 2018;24(6):1415–1425. doi: 10.1158/1078-0432.CCR-17-2283. [DOI] [PMC free article] [PubMed] [Google Scholar]
- 243.Soto-Pantoja DR, et al. CD47 in the tumor microenvironment limits cooperation between antitumor T-cell immunity and radiotherapy. Cancer Res. 2014;74(23):6771–6783. doi: 10.1158/0008-5472.CAN-14-0037-T. [DOI] [PMC free article] [PubMed] [Google Scholar]
- 244.Willingham SB, et al. The CD47-signal regulatory protein alpha (SIRPa) interaction is a therapeutic target for human solid tumors. Proc Natl Acad Sci USA. 2012;109(17):6662–6667. doi: 10.1073/pnas.1121623109. [DOI] [PMC free article] [PubMed] [Google Scholar]
- 245.Wu L, et al. Anti-CD47 treatment enhances anti-tumor T-cell immunity and improves immunosuppressive environment in head and neck squamous cell carcinoma. Oncoimmunology. 2018;7(4):e1397248. doi: 10.1080/2162402X.2017.1397248. [DOI] [PMC free article] [PubMed] [Google Scholar]
- 246.Lemke G. Biology of the TAM receptors. Cold Spring Harb Perspect Biol. 2013;5(11):a009076. doi: 10.1101/cshperspect.a009076. [DOI] [PMC free article] [PubMed] [Google Scholar]
- 247.Myers KV, Amend SR, Pienta KJ. Targeting Tyro3, Axl and MerTK (TAM receptors): implications for macrophages in the tumor microenvironment. Mol Cancer. 2019;18(1):94. doi: 10.1186/s12943-019-1022-2. [DOI] [PMC free article] [PubMed] [Google Scholar]
- 248.Rankin EB, et al. Direct regulation of GAS6/AXL signaling by HIF promotes renal metastasis through SRC and MET. Proc Natl Acad Sci USA. 2014;111(37):13373–13378. doi: 10.1073/pnas.1404848111. [DOI] [PMC free article] [PubMed] [Google Scholar]
- 249.Mishra A, et al. Hypoxia stabilizes GAS6/Axl signaling in metastatic prostate cancer. Mol Cancer Res. 2012;10(6):703–712. doi: 10.1158/1541-7786.MCR-11-0569. [DOI] [PMC free article] [PubMed] [Google Scholar]
- 250.Zhu D, et al. Protein S controls hypoxic/ischemic blood-brain barrier disruption through the TAM receptor Tyro3 and sphingosine 1-phosphate receptor. Blood. 2010;115(23):4963–4972. doi: 10.1182/blood-2010-01-262386. [DOI] [PMC free article] [PubMed] [Google Scholar]
- 251.Zhu YZ, et al. Inhibition of TYRO3/Akt signaling participates in hypoxic injury in hippocampal neurons. Neural Regen Res. 2016;11(5):752–757. doi: 10.4103/1673-5374.182701. [DOI] [PMC free article] [PubMed] [Google Scholar]
- 252.Zhong Z, et al. Protein S protects neurons from excitotoxic injury by activating the TAM receptor Tyro3-phosphatidylinositol 3-kinase-Akt pathway through its sex hormone-binding globulin-like region. J Neurosci. 2010;30(46):15521–15534. doi: 10.1523/JNEUROSCI.4437-10.2010. [DOI] [PMC free article] [PubMed] [Google Scholar]
- 253.Smart SK, et al. The emerging role of TYRO3 as a therapeutic target in cancer. Cancers. 2018; 10:12. [DOI] [PMC free article] [PubMed]
- 254.Lemke G, Rothlin CV. Immunobiology of the TAM receptors. Nat Rev Immunol. 2008;8(5):327–336. doi: 10.1038/nri2303. [DOI] [PMC free article] [PubMed] [Google Scholar]
- 255.Babon JJ, et al. The molecular regulation of Janus kinase (JAK) activation. Biochem J. 2014;462(1):1–13. doi: 10.1042/BJ20140712. [DOI] [PMC free article] [PubMed] [Google Scholar]
- 256.Scutera S, et al. Survival and migration of human dendritic cells are regulated by an IFN-alpha-inducible Axl/Gas6 pathway. J Immunol. 2009;183(5):3004–3013. doi: 10.4049/jimmunol.0804384. [DOI] [PubMed] [Google Scholar]
- 257.Cook RS, et al. MerTK inhibition in tumor leukocytes decreases tumor growth and metastasis. J Clin Invest. 2013;123(8):3231–3242. doi: 10.1172/JCI67655. [DOI] [PMC free article] [PubMed] [Google Scholar]
- 258.Jiang Y, et al. Temporal regulation of HIF-1 and NF-kappaB in hypoxic hepatocarcinoma cells. Oncotarget. 2015;6(11):9409–9419. doi: 10.18632/oncotarget.3352. [DOI] [PMC free article] [PubMed] [Google Scholar]
- 259.Chandel NS, et al. Role of oxidants in NF-kappa B activation and TNF-alpha gene transcription induced by hypoxia and endotoxin. J Immunol. 2000;165(2):1013–1021. doi: 10.4049/jimmunol.165.2.1013. [DOI] [PubMed] [Google Scholar]
- 260.Lluis JM, et al. Dual role of mitochondrial reactive oxygen species in hypoxia signaling: activation of nuclear factor-{kappa}B via c-SRC and oxidant-dependent cell death. Cancer Res. 2007;67(15):7368–7377. doi: 10.1158/0008-5472.CAN-07-0515. [DOI] [PubMed] [Google Scholar]
- 261.Rius J, et al. NF-kappaB links innate immunity to the hypoxic response through transcriptional regulation of HIF-1alpha. Nature. 2008;453(7196):807–811. doi: 10.1038/nature06905. [DOI] [PMC free article] [PubMed] [Google Scholar]
- 262.Belaiba RS, et al. Hypoxia up-regulates hypoxia-inducible factor-1alpha transcription by involving phosphatidylinositol 3-kinase and nuclear factor kappaB in pulmonary artery smooth muscle cells. Mol Biol Cell. 2007;18(12):4691–4697. doi: 10.1091/mbc.e07-04-0391. [DOI] [PMC free article] [PubMed] [Google Scholar]
- 263.Li H, et al. The integrated pathway of TGFbeta/Snail with TNFalpha/NFkappaB may facilitate the tumor-stroma interaction in the EMT process and colorectal cancer prognosis. Sci Rep. 2017;7(1):4915. doi: 10.1038/s41598-017-05280-6. [DOI] [PMC free article] [PubMed] [Google Scholar]
- 264.Kaltschmidt C, et al. A role for NF-kappaB in organ specific cancer and cancer stem cells. Cancers. 2019;11:5. [DOI] [PMC free article] [PubMed]
- 265.Hoesel B, Schmid JA. The complexity of NF-kappaB signaling in inflammation and cancer. Mol Cancer. 2013;12:86. doi: 10.1186/1476-4598-12-86. [DOI] [PMC free article] [PubMed] [Google Scholar]
- 266.Nishio H, et al. Immunosuppression through constitutively activated NF-kappaB signalling in human ovarian cancer and its reversal by an NF-kappaB inhibitor. Br J Cancer. 2014;110(12):2965–2974. doi: 10.1038/bjc.2014.251. [DOI] [PMC free article] [PubMed] [Google Scholar]
- 267.Greten FR, et al. IKKbeta links inflammation and tumorigenesis in a mouse model of colitis-associated cancer. Cell. 2004;118(3):285–296. doi: 10.1016/j.cell.2004.07.013. [DOI] [PubMed] [Google Scholar]
- 268.Muthuswamy R, et al. NF-kappaB hyperactivation in tumor tissues allows tumor-selective reprogramming of the chemokine microenvironment to enhance the recruitment of cytolytic T effector cells. Cancer Res. 2012;72(15):3735–3743. doi: 10.1158/0008-5472.CAN-11-4136. [DOI] [PMC free article] [PubMed] [Google Scholar]
- 269.Pawlus MR, Wang L, Hu CJ. STAT3 and HIF1alpha cooperatively activate HIF1 target genes in MDA-MB-231 and RCC4 cells. Oncogene. 2014;33(13):1670–1679. doi: 10.1038/onc.2013.115. [DOI] [PMC free article] [PubMed] [Google Scholar]
- 270.Jung JE, et al. STAT3 is a potential modulator of HIF-1-mediated VEGF expression in human renal carcinoma cells. FASEB J. 2005;19(10):1296–1298. doi: 10.1096/fj.04-3099fje. [DOI] [PubMed] [Google Scholar]
- 271.Burdelya L, et al. Stat3 activity in melanoma cells affects migration of immune effector cells and nitric oxide-mediated antitumor effects. J Immunol. 2005;174(7):3925–3931. doi: 10.4049/jimmunol.174.7.3925. [DOI] [PMC free article] [PubMed] [Google Scholar]
- 272.Wang T, et al. Regulation of the innate and adaptive immune responses by Stat-3 signaling in tumor cells. Nat Med. 2004;10(1):48–54. doi: 10.1038/nm976. [DOI] [PubMed] [Google Scholar]
- 273.Cui Y, et al. STAT3 regulates hypoxia-induced epithelial mesenchymal transition in oesophageal squamous cell cancer. Oncol Rep. 2016;36(1):108–116. doi: 10.3892/or.2016.4822. [DOI] [PMC free article] [PubMed] [Google Scholar]
- 274.Gray GK, et al. NF-kappaB and STAT3 in glioblastoma: therapeutic targets coming of age. Expert Rev Neurother. 2014;14(11):1293–1306. doi: 10.1586/14737175.2014.964211. [DOI] [PMC free article] [PubMed] [Google Scholar]
- 275.Ihara S, et al. Inhibitory roles of signal transducer and activator of transcription 3 in antitumor immunity during carcinogen-induced lung tumorigenesis. Cancer Res. 2012;72(12):2990–2999. doi: 10.1158/0008-5472.CAN-11-4062. [DOI] [PubMed] [Google Scholar]
- 276.Spranger S, Bao R, Gajewski TF. Melanoma-intrinsic beta-catenin signalling prevents anti-tumour immunity. Nature. 2015;523(7559):231–235. doi: 10.1038/nature14404. [DOI] [PubMed] [Google Scholar]
- 277.Pai SG, et al. Wnt/beta-catenin pathway: modulating anticancer immune response. J Hematol Oncol. 2017;10(1):101. doi: 10.1186/s13045-017-0471-6. [DOI] [PMC free article] [PubMed] [Google Scholar]
- 278.Yaguchi T, et al. Immune suppression and resistance mediated by constitutive activation of Wnt/beta-catenin signaling in human melanoma cells. J Immunol. 2012;189(5):2110–2117. doi: 10.4049/jimmunol.1102282. [DOI] [PubMed] [Google Scholar]
- 279.Diaz ME, et al. Growth hormone modulation of EGF-induced PI3K-Akt pathway in mice liver. Cell Signal. 2012;24(2):514–523. doi: 10.1016/j.cellsig.2011.10.001. [DOI] [PMC free article] [PubMed] [Google Scholar]
- 280.Castellano E, Downward J. RAS interaction with PI3K: more than just another effector pathway. Genes Cancer. 2011;2(3):261–274. doi: 10.1177/1947601911408079. [DOI] [PMC free article] [PubMed] [Google Scholar]
- 281.Carracedo A, Pandolfi PP. The PTEN-PI3K pathway: of feedbacks and cross-talks. Oncogene. 2008;27(41):5527–5541. doi: 10.1038/onc.2008.247. [DOI] [PubMed] [Google Scholar]
- 282.Parsa AT, et al. Loss of tumor suppressor PTEN function increases B7-H1 expression and immunoresistance in glioma. Nat Med. 2007;13(1):84–88. doi: 10.1038/nm1517. [DOI] [PubMed] [Google Scholar]
- 283.Barrott JJ, et al. Modeling synovial sarcoma metastasis in the mouse: PI3’-lipid signaling and inflammation. J Exp Med. 2016;213(13):2989–3005. doi: 10.1084/jem.20160817. [DOI] [PMC free article] [PubMed] [Google Scholar]
- 284.Garcia AJ, et al. Pten null prostate epithelium promotes localized myeloid-derived suppressor cell expansion and immune suppression during tumor initiation and progression. Mol Cell Biol. 2014;34(11):2017–2028. doi: 10.1128/MCB.00090-14. [DOI] [PMC free article] [PubMed] [Google Scholar]
- 285.Wang G, et al. Targeting YAP-dependent MDSC infiltration impairs tumor progression. Cancer Discov. 2016;6(1):80–95. doi: 10.1158/2159-8290.CD-15-0224. [DOI] [PMC free article] [PubMed] [Google Scholar]
- 286.Mittendorf EA, et al. PD-L1 expression in triple-negative breast cancer. Cancer Immunol Res. 2014;2(4):361–370. doi: 10.1158/2326-6066.CIR-13-0127. [DOI] [PMC free article] [PubMed] [Google Scholar]
- 287.Zhong H, et al. Modulation of hypoxia-inducible factor 1alpha expression by the epidermal growth factor/phosphatidylinositol 3-kinase/PTEN/AKT/FRAP pathway in human prostate cancer cells: implications for tumor angiogenesis and therapeutics. Cancer Res. 2000;60(6):1541–1545. [PubMed] [Google Scholar]
- 288.Zhang Z, et al. PI3K/Akt and HIF1 signaling pathway in hypoxiaischemia (Review) Mol Med Rep. 2018;18(4):3547–3554. doi: 10.3892/mmr.2018.9375. [DOI] [PMC free article] [PubMed] [Google Scholar]
- 289.Karar J, Maity A. PI3K/AKT/mTOR pathway in angiogenesis. Front Mol Neurosci. 2011;4:51. doi: 10.3389/fnmol.2011.00051. [DOI] [PMC free article] [PubMed] [Google Scholar]
- 290.Hirsch E, et al. PI3K in cancer-stroma interactions: bad in seed and ugly in soil. Oncogene. 2014;33(24):3083–3090. doi: 10.1038/onc.2013.265. [DOI] [PubMed] [Google Scholar]
- 291.Yang L, et al. Targeting cancer stem cell pathways for cancer therapy. Signal Transduct Target Ther. 2020;5:8. doi: 10.1038/s41392-020-0110-5. [DOI] [PMC free article] [PubMed] [Google Scholar]
- 292.Kim RJ, et al. High aldehyde dehydrogenase activity enhances stem cell features in breast cancer cells by activating hypoxia-inducible factor-2alpha. Cancer Lett. 2013;333(1):18–31. doi: 10.1016/j.canlet.2012.11.026. [DOI] [PubMed] [Google Scholar]
- 293.Civenni G, et al. RNAi-mediated silencing of Myc transcription inhibits stem-like cell maintenance and tumorigenicity in prostate cancer. Cancer Res. 2013;73(22):6816–6827. doi: 10.1158/0008-5472.CAN-13-0615. [DOI] [PubMed] [Google Scholar]
- 294.Takebe N, Warren RQ, Ivy SP. Breast cancer growth and metastasis: interplay between cancer stem cells, embryonic signaling pathways and epithelial-to-mesenchymal transition. Breast Cancer Res. 2011;13(3):211. doi: 10.1186/bcr2876. [DOI] [PMC free article] [PubMed] [Google Scholar]
- 295.Keith B, Simon MC. Hypoxia-inducible factors, stem cells, and cancer. Cell. 2007;129(3):465–472. doi: 10.1016/j.cell.2007.04.019. [DOI] [PMC free article] [PubMed] [Google Scholar]
- 296.Qiu GZ, et al. Reprogramming of the tumor in the hypoxic niche: the emerging concept and associated therapeutic strategies. Trends Pharmacol Sci. 2017;38(8):669–686. doi: 10.1016/j.tips.2017.05.002. [DOI] [PubMed] [Google Scholar]
- 297.Lee G, et al. Dedifferentiation of glioma cells to glioma stem-like cells by therapeutic stress-induced hif signaling in the recurrent gbm model. Mol Cancer Ther. 2016;15(12):3064–3076. doi: 10.1158/1535-7163.MCT-15-0675. [DOI] [PMC free article] [PubMed] [Google Scholar]
- 298.Schito L, Semenza GL. Hypoxia-inducible factors: master regulators of cancer progression. Trends Cancer. 2016;2(12):758–770. doi: 10.1016/j.trecan.2016.10.016. [DOI] [PubMed] [Google Scholar]
- 299.Covello KL, et al. HIF-2alpha regulates Oct-4: effects of hypoxia on stem cell function, embryonic development, and tumor growth. Genes Dev. 2006;20(5):557–570. doi: 10.1101/gad.1399906. [DOI] [PMC free article] [PubMed] [Google Scholar]
- 300.Davoli T, et al. Tumor aneuploidy correlates with markers of immune evasion and with reduced response to immunotherapy. Science. 2017;355:6322. [DOI] [PMC free article] [PubMed]
- 301.Xiong Y, et al. Relevance of arm somatic copy number alterations for oncologic outcomes and tumor immune microenvironment in clear cell renal cell carcinoma. Ann Transl Med. 2019;7(22):646. doi: 10.21037/atm.2019.10.54. [DOI] [PMC free article] [PubMed] [Google Scholar]
- 302.Lu Z. et al. Tumor copy-number alterations predict response to immune-checkpoint-blockade in gastrointestinal cancer. J Immunother Cancer. 2020;8:2. [DOI] [PMC free article] [PubMed]
- 303.Mizuno S. et al. Immuno-genomic pan-cancer landscape reveals diverse immune escape mechanisms and immuno-editing histories. bioRxiv. 2019;20:285338.
- 304.Chang WH, Forde D, Lai AG. A novel signature derived from immunoregulatory and hypoxia genes predicts prognosis in liver and five other cancers. J Transl Med. 2019;17(1):14. doi: 10.1186/s12967-019-1775-9. [DOI] [PMC free article] [PubMed] [Google Scholar]
- 305.Brooks JM, et al. Development and validation of a combined hypoxia and immune prognostic classifier for head and neck cancer. Clin Cancer Res. 2019;25(17):5315–5328. doi: 10.1158/1078-0432.CCR-18-3314. [DOI] [PubMed] [Google Scholar]
- 306.Yang L, et al. Validation of a hypoxia related gene signature in multiple soft tissue sarcoma cohorts. Oncotarget. 2018;9(3):3946–3955. doi: 10.18632/oncotarget.23280. [DOI] [PMC free article] [PubMed] [Google Scholar]
- 307.Zhang C, et al. Profiles of immune cell infiltration and immune-related genes in the tumor microenvironment of osteosarcoma. Aging (Albany NY) 2020;12(4):3486–3501. doi: 10.18632/aging.102824. [DOI] [PMC free article] [PubMed] [Google Scholar]
- 308.Buffa FM, et al. Large meta-analysis of multiple cancers reveals a common, compact and highly prognostic hypoxia metagene. Br J Cancer. 2010;102(2):428–435. doi: 10.1038/sj.bjc.6605450. [DOI] [PMC free article] [PubMed] [Google Scholar]
- 309.Fox NS, et al. Ensemble analyses improve signatures of tumour hypoxia and reveal inter-platform differences. BMC Bioinformatics. 2014;15:170. doi: 10.1186/1471-2105-15-170. [DOI] [PMC free article] [PubMed] [Google Scholar]
- 310.Sorensen BS, et al. The usability of a 15-gene hypoxia classifier as a universal hypoxia profile in various cancer cell types. Radiother Oncol. 2015;116(3):346–351. doi: 10.1016/j.radonc.2015.06.028. [DOI] [PubMed] [Google Scholar]
- 311.Saiselet M, et al. Transcriptional output, cell types densities and normalization in spatial transcriptomics. bioRxiv. 2020;5:503870. [DOI] [PMC free article] [PubMed]
- 312.Asp M, et al. Spatial detection of fetal marker genes expressed at low level in adult human heart tissue. Sci Rep. 2017;7(1):12941. doi: 10.1038/s41598-017-13462-5. [DOI] [PMC free article] [PubMed] [Google Scholar]
- 313.Berglund E, et al. Spatial maps of prostate cancer transcriptomes reveal an unexplored landscape of heterogeneity. Nat Commun. 2018;9(1):2419. doi: 10.1038/s41467-018-04724-5. [DOI] [PMC free article] [PubMed] [Google Scholar]
- 314.Stahl PL, et al. Visualization and analysis of gene expression in tissue sections by spatial transcriptomics. Science. 2016;353(6294):78–82. doi: 10.1126/science.aaf2403. [DOI] [PubMed] [Google Scholar]
- 315.Thrane K, et al. Spatially resolved transcriptomics enables dissection of genetic heterogeneity in stage III cutaneous malignant melanoma. Cancer Res. 2018;78(20):5970–5979. doi: 10.1158/0008-5472.CAN-18-0747. [DOI] [PubMed] [Google Scholar]
- 316.Maniatis S, et al. Spatiotemporal dynamics of molecular pathology in amyotrophic lateral sclerosis. Science. 2019;364(6435):89–93. doi: 10.1126/science.aav9776. [DOI] [PubMed] [Google Scholar]
- 317.Moncada R, et al. Integrating microarray-based spatial transcriptomics and single-cell RNA-seq reveals tissue architecture in pancreatic ductal adenocarcinomas. Nat Biotechnol. 2020;38(3):333–342. doi: 10.1038/s41587-019-0392-8. [DOI] [PubMed] [Google Scholar]
- 318.Delile J, et al. Single cell transcriptomics reveals spatial and temporal dynamics of gene expression in the developing mouse spinal cord. Development. 2019;146:12. [DOI] [PMC free article] [PubMed]
- 319.Mohenska, M., et al., 3D-Cardiomics: A spatial transcriptional atlas of the mammalian heart. bioRxiv, 2019: p. 792002. [DOI] [PubMed]
- 320.Philippeos C, et al. Spatial and single-cell transcriptional profiling identifies functionally distinct human dermal fibroblast subpopulations. J Invest Dermatol. 2018;138(4):811–825. doi: 10.1016/j.jid.2018.01.016. [DOI] [PMC free article] [PubMed] [Google Scholar]
- 321.Zaidi M, et al. Quantitative visualization of hypoxia and proliferation gradients within histological tissue sections. Front Bioeng Biotechnol. 2019;7:397. doi: 10.3389/fbioe.2019.00397. [DOI] [PMC free article] [PubMed] [Google Scholar]
- 322.Aguilera KY, Brekken RA. Hypoxia studies with pimonidazole in vivo. Bio Protoc. 2014;4:19. [DOI] [PMC free article] [PubMed]
- 323.Carnell DM, et al. An immunohistochemical assessment of hypoxia in prostate carcinoma using pimonidazole: implications for radioresistance. Int J Radiat Oncol Biol Phys. 2006;65(1):91–99. doi: 10.1016/j.ijrobp.2005.11.044. [DOI] [PubMed] [Google Scholar]
- 324.Raleigh JA, et al. Hypoxia and vascular endothelial growth factor expression in human squamous cell carcinomas using pimonidazole as a hypoxia marker. Cancer Res. 1998;58(17):3765–3768. [PubMed] [Google Scholar]
- 325.Varia MA, et al. Pimonidazole: a novel hypoxia marker for complementary study of tumor hypoxia and cell proliferation in cervical carcinoma. Gynecol Oncol. 1998;71(2):270–277. doi: 10.1006/gyno.1998.5163. [DOI] [PubMed] [Google Scholar]
- 326.Gross MW, et al. Calibration of misonidazole labeling by simultaneous measurement of oxygen tension and labeling density in multicellular spheroids. Int J Cancer. 1995;61(4):567–573. doi: 10.1002/ijc.2910610422. [DOI] [PubMed] [Google Scholar]
- 327.Raleigh JA, Koch CJ. Importance of thiols in the reductive binding of 2-nitroimidazoles to macromolecules. Biochem Pharmacol. 1990;40(11):2457–2464. doi: 10.1016/0006-2952(90)90086-Z. [DOI] [PubMed] [Google Scholar]
- 328.Kutluk Cenik B, et al. BIBF 1120 (nintedanib), a triple angiokinase inhibitor, induces hypoxia but not EMT and blocks progression of preclinical models of lung and pancreatic cancer. Mol Cancer Ther. 2013;12(6):992–1001. doi: 10.1158/1535-7163.MCT-12-0995. [DOI] [PMC free article] [PubMed] [Google Scholar]
- 329.Kaanders JH, et al. Pimonidazole binding and tumor vascularity predict for treatment outcome in head and neck cancer. Cancer Res. 2002;62(23):7066–7074. [PubMed] [Google Scholar]
- 330.Ragnum HB, et al. The tumour hypoxia marker pimonidazole reflects a transcriptional programme associated with aggressive prostate cancer. Br J Cancer. 2015;112(2):382–390. doi: 10.1038/bjc.2014.604. [DOI] [PMC free article] [PubMed] [Google Scholar]
- 331.Koch CJ, et al. Pharmacokinetics of EF5 [2-(2-nitro-1-H-imidazol-1-yl)-N-(2,2,3,3,3-pentafluoropropyl) acetamide] in human patients: implications for hypoxia measurements in vivo by 2-nitroimidazoles. Cancer Chemother Pharmacol. 2001;48(3):177–187. doi: 10.1007/s002800100324. [DOI] [PubMed] [Google Scholar]
- 332.Evans SM, et al. Oxygen levels in normal and previously irradiated human skin as assessed by EF5 binding. J Invest Dermatol. 2006;126(12):2596–2606. doi: 10.1038/sj.jid.5700451. [DOI] [PubMed] [Google Scholar]
- 333.Russell J, et al. Immunohistochemical detection of changes in tumor hypoxia. Int J Radiat Oncol Biol Phys. 2009;73(4):1177–1186. doi: 10.1016/j.ijrobp.2008.12.004. [DOI] [PMC free article] [PubMed] [Google Scholar]
- 334.Evans SM, et al. Comparative measurements of hypoxia in human brain tumors using needle electrodes and EF5 binding. Cancer Res. 2004;64(5):1886–1892. doi: 10.1158/0008-5472.CAN-03-2424. [DOI] [PubMed] [Google Scholar]
- 335.Silvola JM, et al. Detection of hypoxia by [18F]EF5 in atherosclerotic plaques in mice. Arterioscler Thromb Vasc Biol. 2011;31(5):1011–1015. doi: 10.1161/ATVBAHA.110.221440. [DOI] [PubMed] [Google Scholar]
- 336.Nordsmark M, et al. Hypoxia in human soft tissue sarcomas: adverse impact on survival and no association with p53 mutations. Br J Cancer. 2001;84(8):1070–1075. doi: 10.1054/bjoc.2001.1728. [DOI] [PMC free article] [PubMed] [Google Scholar]
- 337.Meier V, et al. Hypoxia-related marker GLUT-1, CAIX, proliferative index and microvessel density in canine oral malignant neoplasia. PLoS ONE. 2016;11(2):e0149993. doi: 10.1371/journal.pone.0149993. [DOI] [PMC free article] [PubMed] [Google Scholar]
- 338.Pinato DJ, et al. Immunohistochemical markers of the hypoxic response can identify malignancy in phaeochromocytomas and paragangliomas and optimize the detection of tumours with VHL germline mutations. Br J Cancer. 2013;108(2):429–437. doi: 10.1038/bjc.2012.538. [DOI] [PMC free article] [PubMed] [Google Scholar]
- 339.Moon EJ, et al. The potential role of intrinsic hypoxia markers as prognostic variables in cancer. Antioxid Redox Signal. 2007;9(8):1237–1294. doi: 10.1089/ars.2007.1623. [DOI] [PubMed] [Google Scholar]
- 340.Berra E, et al. HIF-1-dependent transcriptional activity is required for oxygen-mediated HIF-1alpha degradation. FEBS Lett. 2001;491(1–2):85–90. doi: 10.1016/S0014-5793(01)02159-7. [DOI] [PubMed] [Google Scholar]
- 341.Moroz E, et al. Real-time imaging of HIF-1alpha stabilization and degradation. PLoS ONE. 2009;4(4):e5077. doi: 10.1371/journal.pone.0005077. [DOI] [PMC free article] [PubMed] [Google Scholar]
- 342.Stein I, et al. Stabilization of vascular endothelial growth factor mRNA by hypoxia and hypoglycemia and coregulation with other ischemia-induced genes. Mol Cell Biol. 1995;15(10):5363–5368. doi: 10.1128/MCB.15.10.5363. [DOI] [PMC free article] [PubMed] [Google Scholar]
- 343.Rafajova M, et al. Induction by hypoxia combined with low glucose or low bicarbonate and high posttranslational stability upon reoxygenation contribute to carbonic anhydrase IX expression in cancer cells. Int J Oncol. 2004;24(4):995–1004. [PubMed] [Google Scholar]
- 344.Raleigh JA, Dewhirst MW, Thrall DE. Measuring tumor hypoxia. Semin Radiat Oncol. 1996;6(1):37–45. doi: 10.1016/S1053-4296(96)80034-8. [DOI] [PubMed] [Google Scholar]
- 345.Vaupel P, Hockel M, Mayer A. Detection and characterization of tumor hypoxia using pO2 histography. Antioxid Redox Signal. 2007;9(8):1221–1235. doi: 10.1089/ars.2007.1628. [DOI] [PubMed] [Google Scholar]
- 346.Stone HB, et al. Oxygen in human tumors: correlations between methods of measurement and response to therapy. Summary of a workshop held November 19–20, 1992, at the National Cancer Institute, Bethesda, Maryland. Radiat Res. 1993;136(3):422–34. [PubMed]
- 347.Gatenby RA, et al. Oxygen distribution in squamous cell carcinoma metastases and its relationship to outcome of radiation therapy. Int J Radiat Oncol Biol Phys. 1988;14(5):831–838. doi: 10.1016/0360-3016(88)90002-8. [DOI] [PubMed] [Google Scholar]
- 348.Rumsey WL, Vanderkooi JM, Wilson DF. Imaging of phosphorescence: a novel method for measuring oxygen distribution in perfused tissue. Science. 1988;241(4873):1649–1651. doi: 10.1126/science.3420417. [DOI] [PubMed] [Google Scholar]
- 349.Vanderkooi JM, Wilson DF. A new method for measuring oxygen concentration in biological systems. Adv Exp Med Biol. 1986;200:189–193. doi: 10.1007/978-1-4684-5188-7_25. [DOI] [PubMed] [Google Scholar]
- 350.Walsh JC, et al. The clinical importance of assessing tumor hypoxia: relationship of tumor hypoxia to prognosis and therapeutic opportunities. Antioxid Redox Signal. 2014;21(10):1516–1554. doi: 10.1089/ars.2013.5378. [DOI] [PMC free article] [PubMed] [Google Scholar]
- 351.Dunphy I, Vinogradov SA, Wilson DF. Oxyphor R2 and G2: phosphors for measuring oxygen by oxygen-dependent quenching of phosphorescence. Anal Biochem. 2002;310(2):191–198. doi: 10.1016/S0003-2697(02)00384-6. [DOI] [PubMed] [Google Scholar]
- 352.Gagel B, et al. pO(2) Polarography versus positron emission tomography ([(18)F] fluoromisonidazole, [(18)F]-2-fluoro-2’-deoxyglucose). An appraisal of radiotherapeutically relevant hypoxia. Strahlenther Onkol. 2004;180(10):616–22. [DOI] [PubMed]
- 353.Fleming IN, et al. Imaging tumour hypoxia with positron emission tomography. Br J Cancer. 2015;112(2):238–250. doi: 10.1038/bjc.2014.610. [DOI] [PMC free article] [PubMed] [Google Scholar]
- 354.Kelada OJ, Carlson DJ. Molecular imaging of tumor hypoxia with positron emission tomography. Radiat Res. 2014;181(4):335–349. doi: 10.1667/RR13590.1. [DOI] [PMC free article] [PubMed] [Google Scholar]
- 355.Zhao S, et al. Elimination of tumor hypoxia by eribulin demonstrated by (18)F-FMISO hypoxia imaging in human tumor xenograft models. EJNMMI Res. 2019;9(1):51. doi: 10.1186/s13550-019-0521-x. [DOI] [PMC free article] [PubMed] [Google Scholar]
- 356.Masaki Y, et al. FMISO accumulation in tumor is dependent on glutathione conjugation capacity in addition to hypoxic state. Ann Nucl Med. 2017;31(8):596–604. doi: 10.1007/s12149-017-1189-9. [DOI] [PMC free article] [PubMed] [Google Scholar]
- 357.Krohn KA, Link JM, Mason RP. Molecular imaging of hypoxia. J Nucl Med. 2008;49(Suppl 2):129S–148S. doi: 10.2967/jnumed.107.045914. [DOI] [PubMed] [Google Scholar]
- 358.Tong X, et al. Monitoring tumor hypoxia using (18)F-FMISO PET and pharmacokinetics modeling after photodynamic therapy. Sci Rep. 2016;6:31551. doi: 10.1038/srep31551. [DOI] [PMC free article] [PubMed] [Google Scholar]
- 359.Watanabe S, et al. Biodistribution and radiation dosimetry of the novel hypoxia PET probe [(18)F]DiFA and comparison with [(18)F]FMISO. EJNMMI Res. 2019;9(1):60. doi: 10.1186/s13550-019-0525-6. [DOI] [PMC free article] [PubMed] [Google Scholar]
- 360.Nunes PSG, et al. Synthesis and evaluation of an (18) F-labeled trifluoroborate derivative of 2-nitroimidazole for imaging tumor hypoxia with positron emission tomography. J Labelled Comp Radiopharm. 2018;61(4):370–379. doi: 10.1002/jlcr.3594. [DOI] [PubMed] [Google Scholar]
- 361.Valk PE, et al. Hypoxia in human gliomas: demonstration by PET with fluorine-18-fluoromisonidazole. J Nucl Med. 1992;33(12):2133–2137. [PubMed] [Google Scholar]
- 362.Cher LM, et al. Correlation of hypoxic cell fraction and angiogenesis with glucose metabolic rate in gliomas using 18F-fluoromisonidazole, 18F-FDG PET, and immunohistochemical studies. J Nucl Med. 2006;47(3):410–418. [PubMed] [Google Scholar]
- 363.Gagel B, et al. [18F] fluoromisonidazole and [18F] fluorodeoxyglucose positron emission tomography in response evaluation after chemo-/radiotherapy of non-small-cell lung cancer: a feasibility study. BMC Cancer. 2006;6:51. doi: 10.1186/1471-2407-6-51. [DOI] [PMC free article] [PubMed] [Google Scholar]
- 364.Thorwarth D, et al. Kinetic analysis of dynamic 18F-fluoromisonidazole PET correlates with radiation treatment outcome in head-and-neck cancer. BMC Cancer. 2005;5:152. doi: 10.1186/1471-2407-5-152. [DOI] [PMC free article] [PubMed] [Google Scholar]
- 365.Sato J, et al. 18F-fluoromisonidazole PET uptake is correlated with hypoxia-inducible factor-1alpha expression in oral squamous cell carcinoma. J Nucl Med. 2013;54(7):1060–1065. doi: 10.2967/jnumed.112.114355. [DOI] [PubMed] [Google Scholar]
- 366.Okamoto S, et al. High reproducibility of tumor hypoxia evaluated by 18F-fluoromisonidazole PET for head and neck cancer. J Nucl Med. 2013;54(2):201–207. doi: 10.2967/jnumed.112.109330. [DOI] [PubMed] [Google Scholar]
- 367.Cheng J, et al. 18F-fluoromisonidazole PET/CT: a potential tool for predicting primary endocrine therapy resistance in breast cancer. J Nucl Med. 2013;54(3):333–340. doi: 10.2967/jnumed.112.111963. [DOI] [PubMed] [Google Scholar]
- 368.Koh WJ, et al. Evaluation of oxygenation status during fractionated radiotherapy in human nonsmall cell lung cancers using [F-18]fluoromisonidazole positron emission tomography. Int J Radiat Oncol Biol Phys. 1995;33(2):391–398. doi: 10.1016/0360-3016(95)00170-4. [DOI] [PubMed] [Google Scholar]
- 369.Vera P, et al. Simultaneous positron emission tomography (PET) assessment of metabolism with (1)(8)F-fluoro-2-deoxy-d-glucose (FDG), proliferation with (1)(8)F-fluoro-thymidine (FLT), and hypoxia with (1)(8)fluoro-misonidazole (F-miso) before and during radiotherapy in patients with non-small-cell lung cancer (NSCLC): a pilot study. Radiother Oncol. 2011;98(1):109–116. doi: 10.1016/j.radonc.2010.10.011. [DOI] [PubMed] [Google Scholar]
- 370.Thureau S, et al. Interobserver agreement of qualitative analysis and tumor delineation of 18F-fluoromisonidazole and 3’-deoxy-3’-18F-fluorothymidine PET images in lung cancer. J Nucl Med. 2013;54(9):1543–1550. doi: 10.2967/jnumed.112.118083. [DOI] [PubMed] [Google Scholar]
- 371.Schwartz J, et al. Pharmacokinetic analysis of dynamic (18)F-fluoromisonidazole pet data in non-small cell lung cancer. J Nucl Med. 2017;58(6):911–919. doi: 10.2967/jnumed.116.180422. [DOI] [PMC free article] [PubMed] [Google Scholar]
- 372.Hugonnet F, et al. Metastatic renal cell carcinoma: relationship between initial metastasis hypoxia, change after 1 month’s sunitinib, and therapeutic response: an 18F-fluoromisonidazole PET/CT study. J Nucl Med. 2011;52(7):1048–1055. doi: 10.2967/jnumed.110.084517. [DOI] [PubMed] [Google Scholar]
- 373.Segard T, et al. Detection of hypoxia with 18F-fluoromisonidazole (18F-FMISO) PET/CT in suspected or proven pancreatic cancer. Clin Nucl Med. 2013;38(1):1–6. doi: 10.1097/RLU.0b013e3182708777. [DOI] [PubMed] [Google Scholar]
- 374.Bekaert L, et al. [18F]-FMISO PET study of hypoxia in gliomas before surgery: correlation with molecular markers of hypoxia and angiogenesis. Eur J Nucl Med Mol Imaging. 2017;44(8):1383–1392. doi: 10.1007/s00259-017-3677-5. [DOI] [PubMed] [Google Scholar]
- 375.Mortensen LS, et al. Identifying hypoxia in human tumors: A correlation study between 18F-FMISO PET and the Eppendorf oxygen-sensitive electrode. Acta Oncol. 2010;49(7):934–940. doi: 10.3109/0284186X.2010.516274. [DOI] [PubMed] [Google Scholar]
- 376.Bentzen L, et al. Tumour oxygenation assessed by 18F-fluoromisonidazole PET and polarographic needle electrodes in human soft tissue tumours. Radiother Oncol. 2003;67(3):339–344. doi: 10.1016/S0167-8140(03)00081-1. [DOI] [PubMed] [Google Scholar]
- 377.Rajendran JG, et al. [(18)F]FMISO and [(18)F]FDG PET imaging in soft tissue sarcomas: correlation of hypoxia, metabolism and VEGF expression. Eur J Nucl Med Mol Imaging. 2003;30(5):695–704. doi: 10.1007/s00259-002-1096-7. [DOI] [PubMed] [Google Scholar]
- 378.Savi A, et al. First evaluation of PET-based human biodistribution and dosimetry of (18)F-FAZA, a tracer for imaging tumor hypoxia. J Nucl Med. 2017;58(8):1224–1229. doi: 10.2967/jnumed.113.122671. [DOI] [PubMed] [Google Scholar]
- 379.Doss M, et al. Biodistribution and radiation dosimetry of the hypoxia marker 18F-HX4 in monkeys and humans determined by using whole-body PET/CT. Nucl Med Commun. 2010;31(12):1016–1024. doi: 10.1097/MNM.0b013e3283407950. [DOI] [PMC free article] [PubMed] [Google Scholar]
- 380.Serganova I, et al. Tumor hypoxia imaging. Clin Cancer Res. 2006;12(18):5260–5264. doi: 10.1158/1078-0432.CCR-06-0517. [DOI] [PubMed] [Google Scholar]
- 381.Dubois LJ, et al. Preclinical evaluation and validation of [18F]HX4, a promising hypoxia marker for PET imaging. Proc Natl Acad Sci USA. 2011;108(35):14620–14625. doi: 10.1073/pnas.1102526108. [DOI] [PMC free article] [PubMed] [Google Scholar]
- 382.Schuetz M, et al. Evaluating repetitive 18F-fluoroazomycin-arabinoside (18FAZA) PET in the setting of MRI guided adaptive radiotherapy in cervical cancer. Acta Oncol. 2010;49(7):941–947. doi: 10.3109/0284186X.2010.510145. [DOI] [PubMed] [Google Scholar]
- 383.Grosu AL, et al. Hypoxia imaging with FAZA-PET and theoretical considerations with regard to dose painting for individualization of radiotherapy in patients with head and neck cancer. Int J Radiat Oncol Biol Phys. 2007;69(2):541–551. doi: 10.1016/j.ijrobp.2007.05.079. [DOI] [PubMed] [Google Scholar]
- 384.Mortensen LS, et al. FAZA PET/CT hypoxia imaging in patients with squamous cell carcinoma of the head and neck treated with radiotherapy: results from the DAHANCA 24 trial. Radiother Oncol. 2012;105(1):14–20. doi: 10.1016/j.radonc.2012.09.015. [DOI] [PubMed] [Google Scholar]
- 385.Bollineni VR, et al. PET imaging of tumor hypoxia using 18F-fluoroazomycin arabinoside in stage III-IV non-small cell lung cancer patients. J Nucl Med. 2013;54(8):1175–1180. doi: 10.2967/jnumed.112.115014. [DOI] [PubMed] [Google Scholar]
- 386.Trinkaus ME, et al. Imaging of hypoxia with 18F-FAZA PET in patients with locally advanced non-small cell lung cancer treated with definitive chemoradiotherapy. J Med Imaging Radiat Oncol. 2013;57(4):475–481. doi: 10.1111/1754-9485.12086. [DOI] [PubMed] [Google Scholar]
- 387.Garcia-Parra R, et al. Investigation on tumor hypoxia in resectable primary prostate cancer as demonstrated by 18F-FAZA PET/CT utilizing multimodality fusion techniques. Eur J Nucl Med Mol Imaging. 2011;38(10):1816–1823. doi: 10.1007/s00259-011-1876-z. [DOI] [PMC free article] [PubMed] [Google Scholar]
- 388.Havelund BM, et al. Tumour hypoxia imaging with 18F-fluoroazomycinarabinofuranoside PET/CT in patients with locally advanced rectal cancer. Nucl Med Commun. 2013;34(2):155–161. doi: 10.1097/MNM.0b013e32835bd5bc. [DOI] [PubMed] [Google Scholar]
- 389.Postema EJ, et al. Initial results of hypoxia imaging using 1-alpha-D: -(5-deoxy-5-[18F]-fluoroarabinofuranosyl)-2-nitroimidazole (18F-FAZA) Eur J Nucl Med Mol Imaging. 2009;36(10):1565–1573. doi: 10.1007/s00259-009-1154-5. [DOI] [PubMed] [Google Scholar]
- 390.Metran-Nascente C, et al. Measurement of Tumor Hypoxia in Patients with Advanced Pancreatic Cancer Based on 18F-Fluoroazomyin Arabinoside Uptake. J Nucl Med. 2016;57(3):361–366. doi: 10.2967/jnumed.115.167650. [DOI] [PubMed] [Google Scholar]
- 391.Hu M, et al. Hypoxia imaging with 18F-fluoroerythronitroimidazole integrated PET/CT and immunohistochemical studies in non-small cell lung cancer. Clin Nucl Med. 2013;38(8):591–596. doi: 10.1097/RLU.0b013e318279fd3d. [DOI] [PubMed] [Google Scholar]
- 392.Li L, et al. Comparison of 18F-Fluoroerythronitroimidazole and 18F-fluorodeoxyglucose positron emission tomography and prognostic value in locally advanced non-small-cell lung cancer. Clin Lung Cancer. 2010;11(5):335–340. doi: 10.3816/CLC.2010.n.042. [DOI] [PubMed] [Google Scholar]
- 393.Vercellino L, et al. Hypoxia imaging of uterine cervix carcinoma with (18)F-FETNIM PET/CT. Clin Nucl Med. 2012;37(11):1065–1068. doi: 10.1097/RLU.0b013e3182638e7e. [DOI] [PubMed] [Google Scholar]
- 394.Yue J, et al. Measuring tumor hypoxia with (1)(8)F-FETNIM PET in esophageal squamous cell carcinoma: a pilot clinical study. Dis Esophagus. 2012;25(1):54–61. doi: 10.1111/j.1442-2050.2011.01209.x. [DOI] [PubMed] [Google Scholar]
- 395.Shibahara I, et al. Imaging of hypoxic lesions in patients with gliomas by using positron emission tomography with 1-(2-[18F] fluoro-1-[hydroxymethyl]ethoxy)methyl-2-nitroimidazole, a new 18F-labeled 2-nitroimidazole analog. J Neurosurg. 2010;113(2):358–368. doi: 10.3171/2009.10.JNS09510. [DOI] [PubMed] [Google Scholar]
- 396.Beppu T, et al. Standardized uptake value in high uptake area on positron emission tomography with 18F-FRP170 as a hypoxic cell tracer correlates with intratumoral oxygen pressure in glioblastoma. Mol Imaging Biol. 2014;16(1):127–135. doi: 10.1007/s11307-013-0670-7. [DOI] [PubMed] [Google Scholar]
- 397.Zegers CM, et al. Hypoxia imaging with [(1)(8)F]HX4 PET in NSCLC patients: defining optimal imaging parameters. Radiother Oncol. 2013;109(1):58–64. doi: 10.1016/j.radonc.2013.08.031. [DOI] [PubMed] [Google Scholar]
- 398.Dearling JL, Packard AB. Some thoughts on the mechanism of cellular trapping of Cu(II)-ATSM. Nucl Med Biol. 2010;37(3):237–243. doi: 10.1016/j.nucmedbio.2009.11.004. [DOI] [PubMed] [Google Scholar]
- 399.Grigsby PW, et al. Comparison of molecular markers of hypoxia and imaging with (60)Cu-ATSM in cancer of the uterine cervix. Mol Imaging Biol. 2007;9(5):278–283. doi: 10.1007/s11307-007-0095-2. [DOI] [PubMed] [Google Scholar]
- 400.Dehdashti F, et al. Assessing tumor hypoxia in cervical cancer by PET with 60Cu-labeled diacetyl-bis(N4-methylthiosemicarbazone) J Nucl Med. 2008;49(2):201–205. doi: 10.2967/jnumed.107.048520. [DOI] [PubMed] [Google Scholar]
- 401.Dehdashti F, et al. In vivo assessment of tumor hypoxia in lung cancer with 60Cu-ATSM. Eur J Nucl Med Mol Imaging. 2003;30(6):844–850. doi: 10.1007/s00259-003-1130-4. [DOI] [PubMed] [Google Scholar]
- 402.Dietz DW, et al. Tumor hypoxia detected by positron emission tomography with 60Cu-ATSM as a predictor of response and survival in patients undergoing Neoadjuvant chemoradiotherapy for rectal carcinoma: a pilot study. Dis Colon Rectum. 2008;51(11):1641–1648. doi: 10.1007/s10350-008-9420-3. [DOI] [PMC free article] [PubMed] [Google Scholar]
- 403.Minagawa Y, et al. Assessment of tumor hypoxia by 62Cu-ATSM PET/CT as a predictor of response in head and neck cancer: a pilot study. Ann Nucl Med. 2011;25(5):339–345. doi: 10.1007/s12149-011-0471-5. [DOI] [PubMed] [Google Scholar]
- 404.Lohith TG, et al. Pathophysiologic correlation between 62Cu-ATSM and 18F-FDG in lung cancer. J Nucl Med. 2009;50(12):1948–1953. doi: 10.2967/jnumed.109.069021. [DOI] [PubMed] [Google Scholar]
- 405.Boschi A, et al. Recent achievements in Tc-99m radiopharmaceutical direct production by medical cyclotrons. Drug Dev Ind Pharm. 2017;43(9):1402–1412. doi: 10.1080/03639045.2017.1323911. [DOI] [PubMed] [Google Scholar]
- 406.Van Dort ME, Rehemtulla A, Ross BD. PET and SPECT imaging of tumor biology: new approaches towards oncology drug discovery and development. Curr Comput Aided Drug Des. 2008;4(1):46–53. doi: 10.2174/157340908783769265. [DOI] [PMC free article] [PubMed] [Google Scholar]
- 407.Khalil MM, et al. Molecular SPECT imaging: an overview. Int J Mol Imaging. 2011;2011:796025. doi: 10.1155/2011/796025. [DOI] [PMC free article] [PubMed] [Google Scholar]
- 408.Cheng D, et al. Comparison of 18F PET and 99mTc SPECT imaging in phantoms and in tumored mice. Bioconjug Chem. 2010;21(8):1565–1570. doi: 10.1021/bc1001467. [DOI] [PMC free article] [PubMed] [Google Scholar]
- 409.Baudelet C, Gallez B. How does blood oxygen level-dependent (BOLD) contrast correlate with oxygen partial pressure (pO2) inside tumors? Magn Reson Med. 2002;48(6):980–986. doi: 10.1002/mrm.10318. [DOI] [PubMed] [Google Scholar]
- 410.Li SP, Padhani AR, Makris A. Dynamic contrast-enhanced magnetic resonance imaging and blood oxygenation level-dependent magnetic resonance imaging for the assessment of changes in tumor biology with treatment. J Natl Cancer Inst Monogr. 2011;2011(43):103–107. doi: 10.1093/jncimonographs/lgr031. [DOI] [PubMed] [Google Scholar]
- 411.Malmgren C, et al. Reliable typing of DNA amplified from formalin-fixed tissue biopsies. PCR Methods Appl. 1992;2(2):175–176. doi: 10.1101/gr.2.2.175. [DOI] [PubMed] [Google Scholar]
- 412.Baudelet C, et al. The role of vessel maturation and vessel functionality in spontaneous fluctuations of T2*-weighted GRE signal within tumors. NMR Biomed. 2006;19(1):69–76. doi: 10.1002/nbm.1002. [DOI] [PubMed] [Google Scholar]
- 413.Lee J, et al. Value of blood oxygenation level-dependent MRI for predicting clinical outcomes in uterine cervical cancer treated with concurrent chemoradiotherapy. Eur Radiol. 2019;29(11):6256–6265. doi: 10.1007/s00330-019-06198-5. [DOI] [PubMed] [Google Scholar]
- 414.Hallac RR, et al. Oxygenation in cervical cancer and normal uterine cervix assessed using blood oxygenation level-dependent (BOLD) MRI at 3T. NMR Biomed. 2012;25(12):1321–1330. doi: 10.1002/nbm.2804. [DOI] [PMC free article] [PubMed] [Google Scholar]
- 415.Jiang L, et al. Blood oxygenation level-dependent (BOLD) contrast magnetic resonance imaging (MRI) for prediction of breast cancer chemotherapy response: a pilot study. J Magn Reson Imaging. 2013;37(5):1083–1092. doi: 10.1002/jmri.23891. [DOI] [PubMed] [Google Scholar]
- 416.Di N, et al. Blood oxygenation level-dependent magnetic resonance imaging during carbogen breathing: differentiation between prostate cancer and benign prostate hyperplasia and correlation with vessel maturity. Onco Targets Ther. 2016;9:4143–4150. doi: 10.2147/OTT.S105480. [DOI] [PMC free article] [PubMed] [Google Scholar]
- 417.Maralani PJ, et al. hypoxia detection in infiltrative astrocytoma: ferumoxytol-based quantitative BOLD MRI with intraoperative and histologic validation. Radiology. 2018;288(3):821–829. doi: 10.1148/radiol.2018172601. [DOI] [PubMed] [Google Scholar]
- 418.Graham K, Unger E. Overcoming tumor hypoxia as a barrier to radiotherapy, chemotherapy and immunotherapy in cancer treatment. Int J Nanomedicine. 2018;13:6049–6058. doi: 10.2147/IJN.S140462. [DOI] [PMC free article] [PubMed] [Google Scholar]
- 419.Lickliter J, et al. Abstract 4247: TOLD MRI validation of reversal of tumor hypoxia in glioblastoma with a novel oxygen therapeutic. Cancer Res. 2016;76(14 Supplement):4247–4247. [Google Scholar]
- 420.Hallac RR, et al. Correlations of noninvasive BOLD and TOLD MRI with pO2 and relevance to tumor radiation response. Magn Reson Med. 2014;71(5):1863–1873. doi: 10.1002/mrm.24846. [DOI] [PMC free article] [PubMed] [Google Scholar]
- 421.Zhou H, et al. Examining correlations of oxygen sensitive MRI (BOLD/TOLD) with [(18)F]FMISO PET in rat prostate tumors. Am J Nucl Med Mol Imaging. 2019;9(2):156–167. [PMC free article] [PubMed] [Google Scholar]
- 422.Krishna MC, et al. Overhauser enhanced magnetic resonance imaging for tumor oximetry: coregistration of tumor anatomy and tissue oxygen concentration. Proc Natl Acad Sci USA. 2002;99(4):2216–2221. doi: 10.1073/pnas.042671399. [DOI] [PMC free article] [PubMed] [Google Scholar]
- 423.O’Connor JP, et al. Oxygen-enhanced mri accurately identifies, quantifies, and maps tumor hypoxia in preclinical cancer models. Cancer Res. 2016;76(4):787–795. doi: 10.1158/0008-5472.CAN-15-2062. [DOI] [PMC free article] [PubMed] [Google Scholar]
- 424.O’Connor JPB, Robinson SP, Waterton JC. Imaging tumour hypoxia with oxygen-enhanced MRI and BOLD MRI. Br J Radiol. 2019;92(1095):20180642. doi: 10.1259/bjr.20180642. [DOI] [PMC free article] [PubMed] [Google Scholar]
- 425.O’Connor JP, et al. Preliminary study of oxygen-enhanced longitudinal relaxation in MRI: a potential novel biomarker of oxygenation changes in solid tumors. Int J Radiat Oncol Biol Phys. 2009;75(4):1209–1215. doi: 10.1016/j.ijrobp.2008.12.040. [DOI] [PubMed] [Google Scholar]
- 426.Salem A, et al. Oxygen-enhanced MRI is feasible, repeatable, and detects radiotherapy-induced change in hypoxia in xenograft models and in patients with non-small cell lung cancer. Clin Cancer Res. 2019;25(13):3818–3829. doi: 10.1158/1078-0432.CCR-18-3932. [DOI] [PubMed] [Google Scholar]
- 427.Moosvi F, et al. Fast and sensitive dynamic oxygen-enhanced MRI with a cycling gas challenge and independent component analysis. Magn Reson Med. 2019;81(4):2514–2525. doi: 10.1002/mrm.27584. [DOI] [PubMed] [Google Scholar]
- 428.Perrin J, et al. Cell tracking in cancer immunotherapy. Front Med (Lausanne) 2020;7:34. doi: 10.3389/fmed.2020.00034. [DOI] [PMC free article] [PubMed] [Google Scholar]
- 429.Krekorian M, et al. Imaging of T-cells and their responses during anti-cancer immunotherapy. Theranostics. 2019;9(25):7924–7947. doi: 10.7150/thno.37924. [DOI] [PMC free article] [PubMed] [Google Scholar]
- 430.Leech JM, et al. Whole-body imaging of adoptively transferred T cells using magnetic resonance imaging, single photon emission computed tomography and positron emission tomography techniques, with a focus on regulatory T cells. Clin Exp Immunol. 2013;172(2):169–177. doi: 10.1111/cei.12087. [DOI] [PMC free article] [PubMed] [Google Scholar]
- 431.van Dongen GA, et al. Immuno-PET: a navigator in monoclonal antibody development and applications. Oncologist. 2007;12(12):1379–1389. doi: 10.1634/theoncologist.12-12-1379. [DOI] [PubMed] [Google Scholar]
- 432.Jauw YWS, et al. (89)Zr-immuno-PET: toward a noninvasive clinical tool to measure target engagement of therapeutic antibodies in vivo. J Nucl Med. 2019;60(12):1825–1832. doi: 10.2967/jnumed.118.224568. [DOI] [PubMed] [Google Scholar]
- 433.Wei W, et al. ImmunoPET: concept, design, and applications. Chem Rev. 2020;120(8):3787–3851. doi: 10.1021/acs.chemrev.9b00738. [DOI] [PMC free article] [PubMed] [Google Scholar]
- 434.Shapiro BA. Temperature correction of blood gas values. Respir Care Clin N Am. 1995;1(1):69–76. [PubMed] [Google Scholar]
- 435.Malatesha G, et al. Comparison of arterial and venous pH, bicarbonate, PCO2 and PO2 in initial emergency department assessment. Emerg Med J. 2007;24(8):569–571. doi: 10.1136/emj.2007.046979. [DOI] [PMC free article] [PubMed] [Google Scholar]
- 436.Chu YC, et al. Prediction of arterial blood gas values from venous blood gas values in patients with acute respiratory failure receiving mechanical ventilation. J Formos Med Assoc. 2003;102(8):539–543. [PubMed] [Google Scholar]
- 437.Walkey AJ, et al. The accuracy of the central venous blood gas for acid-base monitoring. J Intensive Care Med. 2010;25(2):104–110. doi: 10.1177/0885066609356164. [DOI] [PubMed] [Google Scholar]
- 438.Dings J, et al. Clinical experience with 118 brain tissue oxygen partial pressure catheter probes. Neurosurgery. 1998;43(5):1082–1095. doi: 10.1097/00006123-199811000-00045. [DOI] [PubMed] [Google Scholar]
- 439.Meixensberger J, et al. Studies of tissue PO2 in normal and pathological human brain cortex. Acta Neurochir Suppl (Wien) 1993;59:58–63. doi: 10.1007/978-3-7091-9302-0_10. [DOI] [PubMed] [Google Scholar]
- 440.Hoffman WE, Charbel FT, Edelman G. Brain tissue oxygen, carbon dioxide, and pH in neurosurgical patients at risk for ischemia. Anesth Analg. 1996;82(3):582–586. doi: 10.1097/00000539-199603000-00027. [DOI] [PubMed] [Google Scholar]
- 441.Korsic M, Jugovic D, Kremzar B. Intracranial pressure and biochemical indicators of brain damage: follow-up study. Croat Med J. 2006;47(2):246–252. [PMC free article] [PubMed] [Google Scholar]
- 442.Ortiz-Prado E, et al. A method for measuring brain partial pressure of oxygen in unanesthetized unrestrained subjects: the effect of acute and chronic hypoxia on brain tissue PO(2) J Neurosci Methods. 2010;193(2):217–225. doi: 10.1016/j.jneumeth.2010.08.019. [DOI] [PMC free article] [PubMed] [Google Scholar]
- 443.Le QT, et al. An evaluation of tumor oxygenation and gene expression in patients with early stage non-small cell lung cancers. Clin Cancer Res. 2006;12(5):1507–1514. doi: 10.1158/1078-0432.CCR-05-2049. [DOI] [PubMed] [Google Scholar]
- 444.Leary TS, et al. Measurement of liver tissue oxygenation after orthotopic liver transplantation using a multiparameter sensor. A pilot study. Anaesthesia. 2002;57(11):1128–1133. doi: 10.1046/j.1365-2044.2002.02782_5.x. [DOI] [PubMed] [Google Scholar]
- 445.Brooks AJ, et al. Liver tissue partial pressure of oxygen and carbon dioxide during partial hepatectomy. Br J Anaesth. 2004;92(5):735–737. doi: 10.1093/bja/aeh112. [DOI] [PubMed] [Google Scholar]
- 446.Brooks AJ, et al. The effect of hepatic vascular inflow occlusion on liver tissue pH, carbon dioxide, and oxygen partial pressures: defining the optimal clamp/release regime for intermittent portal clamping. J Surg Res. 2007;141(2):247–251. doi: 10.1016/j.jss.2006.10.054. [DOI] [PubMed] [Google Scholar]
- 447.Muller M, et al. Renocortical tissue oxygen pressure measurements in patients undergoing living donor kidney transplantation. Anesth Analg. 1998;87(2):474–476. doi: 10.1097/00000539-199808000-00045. [DOI] [PubMed] [Google Scholar]
- 448.Beerthuizen GI, Goris RJ, Kreuzer FJ. Skeletal muscle Po2 during imminent shock. Arch Emerg Med. 1989;6(3):172–182. doi: 10.1136/emj.6.3.172. [DOI] [PMC free article] [PubMed] [Google Scholar]
- 449.Boekstegers P, Riessen R, Seyde W. Oxygen partial pressure distribution within skeletal muscle: indicator of whole body oxygen delivery in patients? Adv Exp Med Biol. 1990;277:507–514. doi: 10.1007/978-1-4684-8181-5_57. [DOI] [PubMed] [Google Scholar]
- 450.Ikossi DG, et al. Continuous muscle tissue oxygenation in critically injured patients: a prospective observational study. J Trauma. 2006;61(4):780–8. [DOI] [PubMed]
- 451.Richardson RS, et al. Human skeletal muscle intracellular oxygenation: the impact of ambient oxygen availability. J Physiol. 2006;571(Pt 2):415–424. doi: 10.1113/jphysiol.2005.102327. [DOI] [PMC free article] [PubMed] [Google Scholar]
- 452.Carreau A, et al. Why is the partial oxygen pressure of human tissues a crucial parameter? Small molecules and hypoxia. J Cell Mol Med. 2011;15(6):1239–1253. doi: 10.1111/j.1582-4934.2011.01258.x. [DOI] [PMC free article] [PubMed] [Google Scholar]
- 453.Wang W, Winlove CP, Michel CC. Oxygen partial pressure in outer layers of skin of human finger nail folds. J Physiol. 2003;549(Pt 3):855–863. doi: 10.1113/jphysiol.2002.037994. [DOI] [PMC free article] [PubMed] [Google Scholar]
- 454.Muller M, et al. Effects of desflurane and isoflurane on intestinal tissue oxygen pressure during colorectal surgery. Anaesthesia. 2002;57(2):110–115. doi: 10.1046/j.0003-2409.2001.02363.x. [DOI] [PubMed] [Google Scholar]
- 455.Muller M, et al. Effects of lumbar peridural anesthesia on tissue pO2 of the large intestine in man. Anasthesiol Intensivmed Notfallmed Schmerzther. 1995;30(2):108–110. doi: 10.1055/s-2007-996457. [DOI] [PubMed] [Google Scholar]
- 456.Harrison JS, et al. Oxygen saturation in the bone marrow of healthy volunteers. Blood. 2002;99(1):394. doi: 10.1182/blood.V99.1.394. [DOI] [PubMed] [Google Scholar]
- 457.Fraser IS, Baird DT, Cockburn F. Ovarian venous blood PO 2, PCO 2 and pH in women. J Reprod Fertil. 1973;33(1):11–17. doi: 10.1530/jrf.0.0330011. [DOI] [PubMed] [Google Scholar]
- 458.Bonanno JA, et al. Estimation of human corneal oxygen consumption by noninvasive measurement of tear oxygen tension while wearing hydrogel lenses. Invest Ophthalmol Vis Sci. 2002;43(2):371–376. [PubMed] [Google Scholar]
- 459.Maurer P, et al. Measurement of oxygen partial pressure in the mandibular bone using a polarographic fine needle probe. Int J Oral Maxillofac Surg. 2006;35(3):231–236. doi: 10.1016/j.ijom.2005.07.016. [DOI] [PubMed] [Google Scholar]
Associated Data
This section collects any data citations, data availability statements, or supplementary materials included in this article.
Data Availability Statement
Not applicable