Abstract
Disruption of systemic homeostasis by either chronic or acute stressors, such as obesity1 or surgery2, alters cancer pathogenesis. Cancer patients, particularly those with breast cancer, can be at increased risk for cardiovascular disease due to treatment toxicity and changes in lifestyle behaviors3–5. While elevated risk and incidence of cardiovascular events in breast cancer is well-established, whether such events impact cancer pathogenesis is not known. Here, we show that myocardial infarction (MI) accelerates breast cancer outgrowth and cancer-specific mortality in mice and humans. In mouse models of breast cancer, MI epigenetically reprogrammed Ly6Chigh monocytes in the bone marrow reservoir to an immunosuppressive phenotype that was maintained at the transcriptional level in monocytes in both the circulation and tumor. In parallel, MI increased circulating Ly6Chigh monocyte levels and recruitment to tumors, and depletion of these cells abrogated MI-induced tumor growth. Furthermore, early-stage breast cancer patients who experienced cardiovascular events after cancer diagnosis had increased risk of recurrence and cancer-specific death. These preclinical and clinical results demonstrate that MI induces alterations to systemic homeostasis, triggering cross-disease communication that accelerates breast cancer.
Pre-clinical and clinical evidence indicate that cancer progression is determined not only by the tumor genetic landscape, but also by complex interactions within the tumor microenvironment and systemic host milieu6. MI results in ischaemic myocardial injury and myriad systemic effects, driven by elevated sympathetic outflow from the central nervous system. For example, danger / alarmin signalling (e.g. interleukin (IL)-1β) alongside β3 adrenergic stimulation post-MI activates leukocyte progenitors in the bone marrow, resulting in a transient expansion of innate immune effector cells, in particular monocytes, in the circulation and hematopoietic reservoirs7. Monocytes are key regulators of the tumor microenvironment and elevated levels of circulating monocytes correlate with poor clinical outcomes in a variety of cancers8,9. Monocytes and monocyte-derived macrophages have a multitude of tumor-promoting accessory functions, including fostering tumor immune evasion and angiogenesis, as well tumor cell proliferation, migration, invasion and metastasis8. Whether MI-induced disruption of systemic homeostasis initiates cross-disease communication in the setting of breast cancer to alter the course of disease is not known.
To investigate whether an incident MI influences breast cancer pathophysiology, we utilized the E0771 syngeneic mouse model of breast cancer. We induced MI by ligating the left anterior descending (LAD) coronary artery (Extended Data Fig. 1) or performed a sham surgery as control three days after orthotopic implantation of cancer cells in the mammary fat pad (Fig. 1a). Compared to sham surgery, MI accelerated tumor growth (Fig. 1b), resulting in an ~2-fold increase in tumor volume and weight at 20 days, when tumors reached cancer-specific criteria for mouse euthanasia (Fig. 1c). Echocardiographic analyses showed no difference in cardiac remodeling or function in mice with and without cancer, indicating that changes in cardiac function do not underlie the MI-induced acceleration of tumor growth (Extended Data Fig. 1b). In addition, presence of cancer did not influence the clinical response to MI. No animals in the MI cohorts developed clinical signs of overt heart failure, such as edema or changes in grooming behavior. Analysis of cell proliferation showed a doubling in Ki67+ cells in the tumor border of mice exposed to MI versus sham surgery (Fig. 1d), which occurred in both non-immune (CD45–) and immune cell (CD45+) fractions of the tumors (Extended Data Fig. 2).
Figure 1. Surgically-induced myocardial infarction accelerates tumor growth in a syngeneic mouse model of breast cancer.
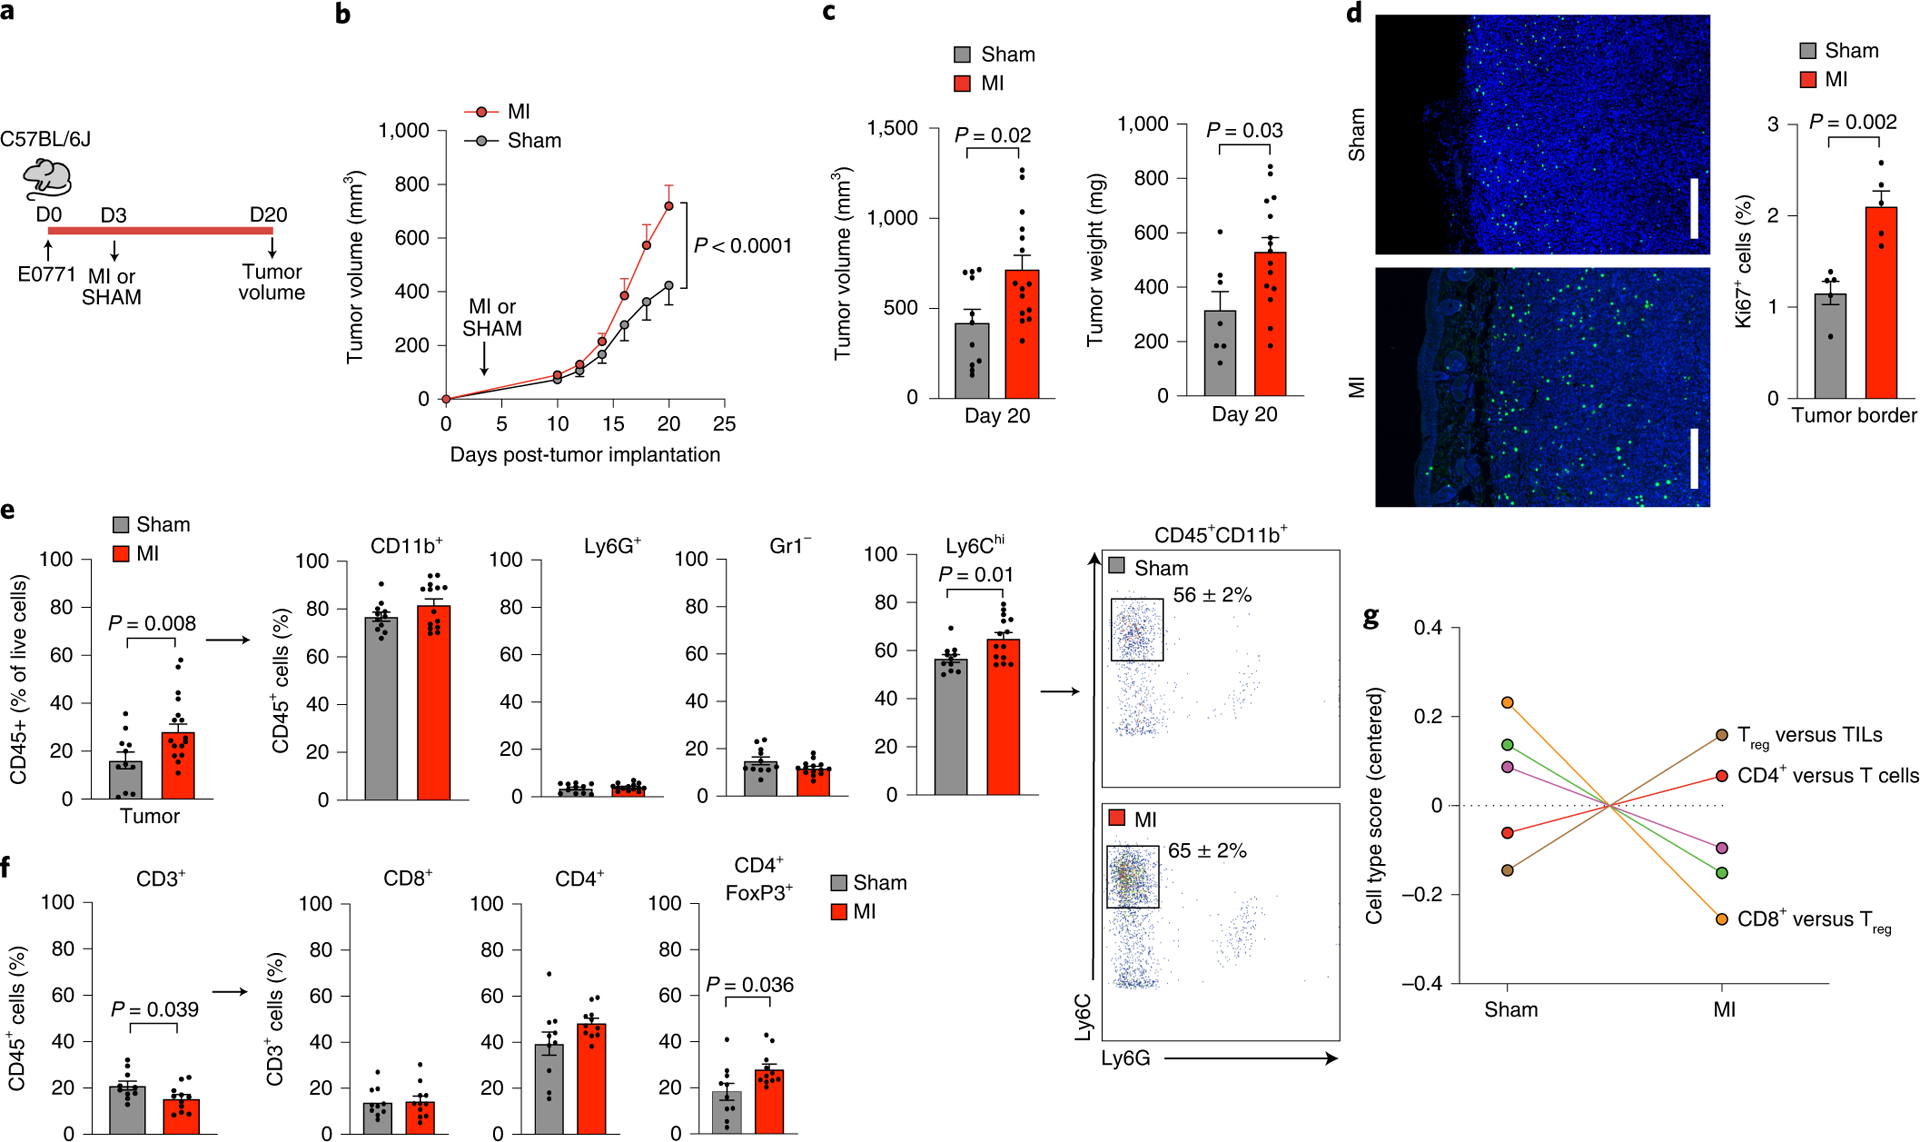
(a) Coronary artery ligation or sham surgery was performed 3 days following orthotopic implantation of E0771 cancer cells into the mammary fat pad of C57BL/6J mice and tumor growth was followed over the course of 20 days. (b) Tumor growth over 20 days following tumor implantation (n=15 MI, 11 sham) (c) Quantification of tumor volume (n=15 MI, 11 sham) and weight (n=15 MI, 7 sham) at sacrifice. (d) Representative images of tumors stained for Ki67 to detect proliferating cells in the tumor border (left) and quantification of Ki67+ cells (right) (n=5/group). Scale bar represents 250 μm. (e) Left, flow cytometric analysis of tumor immune cells (CD45+) at day 20 to identify myeloid subsets (n=14 MI, 11 sham): CD11b+Ly6G+, neutrophils; CD11b+Gr1–, macrophage-like cells; CD11b+Ly6Chi, monocytes. Right, representative gating showing increased percentage of CD45+CD11b+Ly6G–Ly6Chi monocytes in MI compared to sham mice. (f) Flow cytometric analysis of tumor immune cells (CD45+) at day 20 to identify lymphoid subsets (n=11 MI, 10 sham): CD3+, T cells; CD8+, cytotoxic T cells; CD4+, T helper cells; CD4+FoxP3+, regulatory T cells. (g) Nanostring immune profiling gene set analysis of tumor RNA from MI (n=11) or sham (n=10) mice. TILs, tumor infiltrating lymphocytes. Two (f,g), three (d,e) and five (b,c) independent experiments were conducted. Data are the mean ± s.e.m. P values were calculated using a repeated measures analysis of variance (ANOVA) with Bonferroni’s multiple comparisons test (b) or two-tailed unpaired Student’s t-test (c [tumor volume], d, e [Ly6C, Gr1, CD3, CD8, CD4]) or two-tailed Mann–Whitney U-test (c [tumor weight], e [CD11b, Ly6G, FoxP3]).
Further analysis of the intratumoral immune cell landscape by flow cytometry showed an increased proportion of tumoral CD45+ leukocytes in the MI condition compared to sham (30% vs. 16% of live cells; Fig. 1e). Among CD45+ cells, we observed an increased proportion of CD11b+Ly6G–Ly6Chigh monocytes in tumors of mice subjected to MI compared to sham surgery, with no differences in CD11b+Gr1– and CD11b+Gr1−F4/80+ macrophages, CD11b+Gr1–Cd11c+ dendritic cells, or CD11b+Ly6G+Ly6Clow neutrophils (Fig. 1e, Extended Data Fig. 3). The increase in CD11b+Ly6G–Ly6Chigh monocytes in mice subjected to MI was also observed when analyzed as a percentage of total live cells in the tumors (Extended Data Fig. 3). As CD11b+Ly6G−Ly6Chi monocytes share analogous cell-surface markers with monocytic myeloid derived suppressor cells (mMDSCs) that can restrict T cell infiltration and anti-tumoral immune responses,8,10 we next measured intratumoral T cell levels. Among CD45+ cells, tumors from mice subjected to MI showed fewer T lymphocytes (CD3+ cells), of which a higher proportion were immunosuppressive CD4+FoxP3+ T regulatory (Treg) cells compared to sham (Fig. 1f, Extended Data Fig. 3). The enrichment in pro-tumoral Tregs after MI was corroborated by immune profiling gene set analysis of bulk tumor RNA (Fig. 1g). These findings suggest that MI-induced accelerated tumor growth is associated with an immunosuppressive intratumoral immune landscape.
We next investigated whether the systemic effects of MI on hematopoiesis contributed to altered immune cell composition in the tumor. As previously reported11, non-tumor bearing mice exposed to MI showed an increase in circulating monocytes compared to sham, which resolved approximately 12 days following surgery (Figure 2a). By contrast, in E0771 tumor-bearing mice, MI induced a sustained increase in circulating Ly6Chigh monocytes (Fig. 2a, b). No differences in other circulating immune cell subsets were observed in tumor bearing mice exposed to MI versus sham surgery (Fig. 2b, Extended Data Fig. 4). Flow cytometric analysis of bone marrow hematopoietic stem and progenitor cell populations showed that common myeloid progenitor cells, a precursor of Ly6Chigh monocytes, were increased 9 days after MI compared to sham (Extended Data Fig. 4). To investigate whether MI increased recruitment of Ly6Chigh monocytes to the tumor, we performed adoptive transfer experiments using congenic CD45.1 and CD45.2 mice to track donor and host monocytes at the time point at which tumor growth begins to diverge (12 days post-tumor implantation and 9 days post-MI). To test whether MI alone induced monocyte-intrinsic changes that altered recruitment to the tumor, we isolated Ly6Chigh monocytes from CD45.1 non-tumor bearing mice 9 days post-MI or sham surgery, and transferred them to CD45.2 mice implanted with E0771 tumors 12 days earlier. No difference in CD45.1 monocyte recruitment to tumors was observed (Extended Data Fig. 5). Next, Ly6Chigh monocytes from naive CD45.1 mice were adoptively transferred into E0771-tumor bearing CD45.2 mice exposed to MI or sham surgery 9 days earlier (Fig 2c, d). MI increased the recruitment of CD45.1 Ly6Chigh monocytes into tumors, despite comparable tumor volumes between conditions (Fig. 2c, d, Extended Data Fig. 5). Transcriptomic profiling of tumors at this time point revealed an increase in the tumoral expression of chemokine genes in mice exposed to MI vs sham surgery, including Cxcl13 (Extended Data Fig. 5f), which has been linked to breast cancer progression12,13 and whose receptor Cxcr5 was also increased in monocytes from tumor bearing mice exposed to MI vs sham surgery (Extended Data Fig. 5g). In addition, we observed an increase in monocyte expression of Cxcr1, a chemokine receptor linked to tumor progression and metastasis14, in tumor bearing mice exposed MI vs sham surgery. Notably, monocyte expression of both Cxcr1 and Cxcr5 were specifically increased after MI in tumor-bearing but not control (non-tumor bearing) mice (Suppl. Fig. 5g). These data suggest that a MI-cancer specific upregulation of the CXCL13-CXCR5 axis may underlie the increased recruitment of Ly6Chigh monocytes to tumors.
Figure 2. MI-accelerated tumor growth is dependent on enhanced Ly6Chigh monocyte supply and recruitment to tumors.
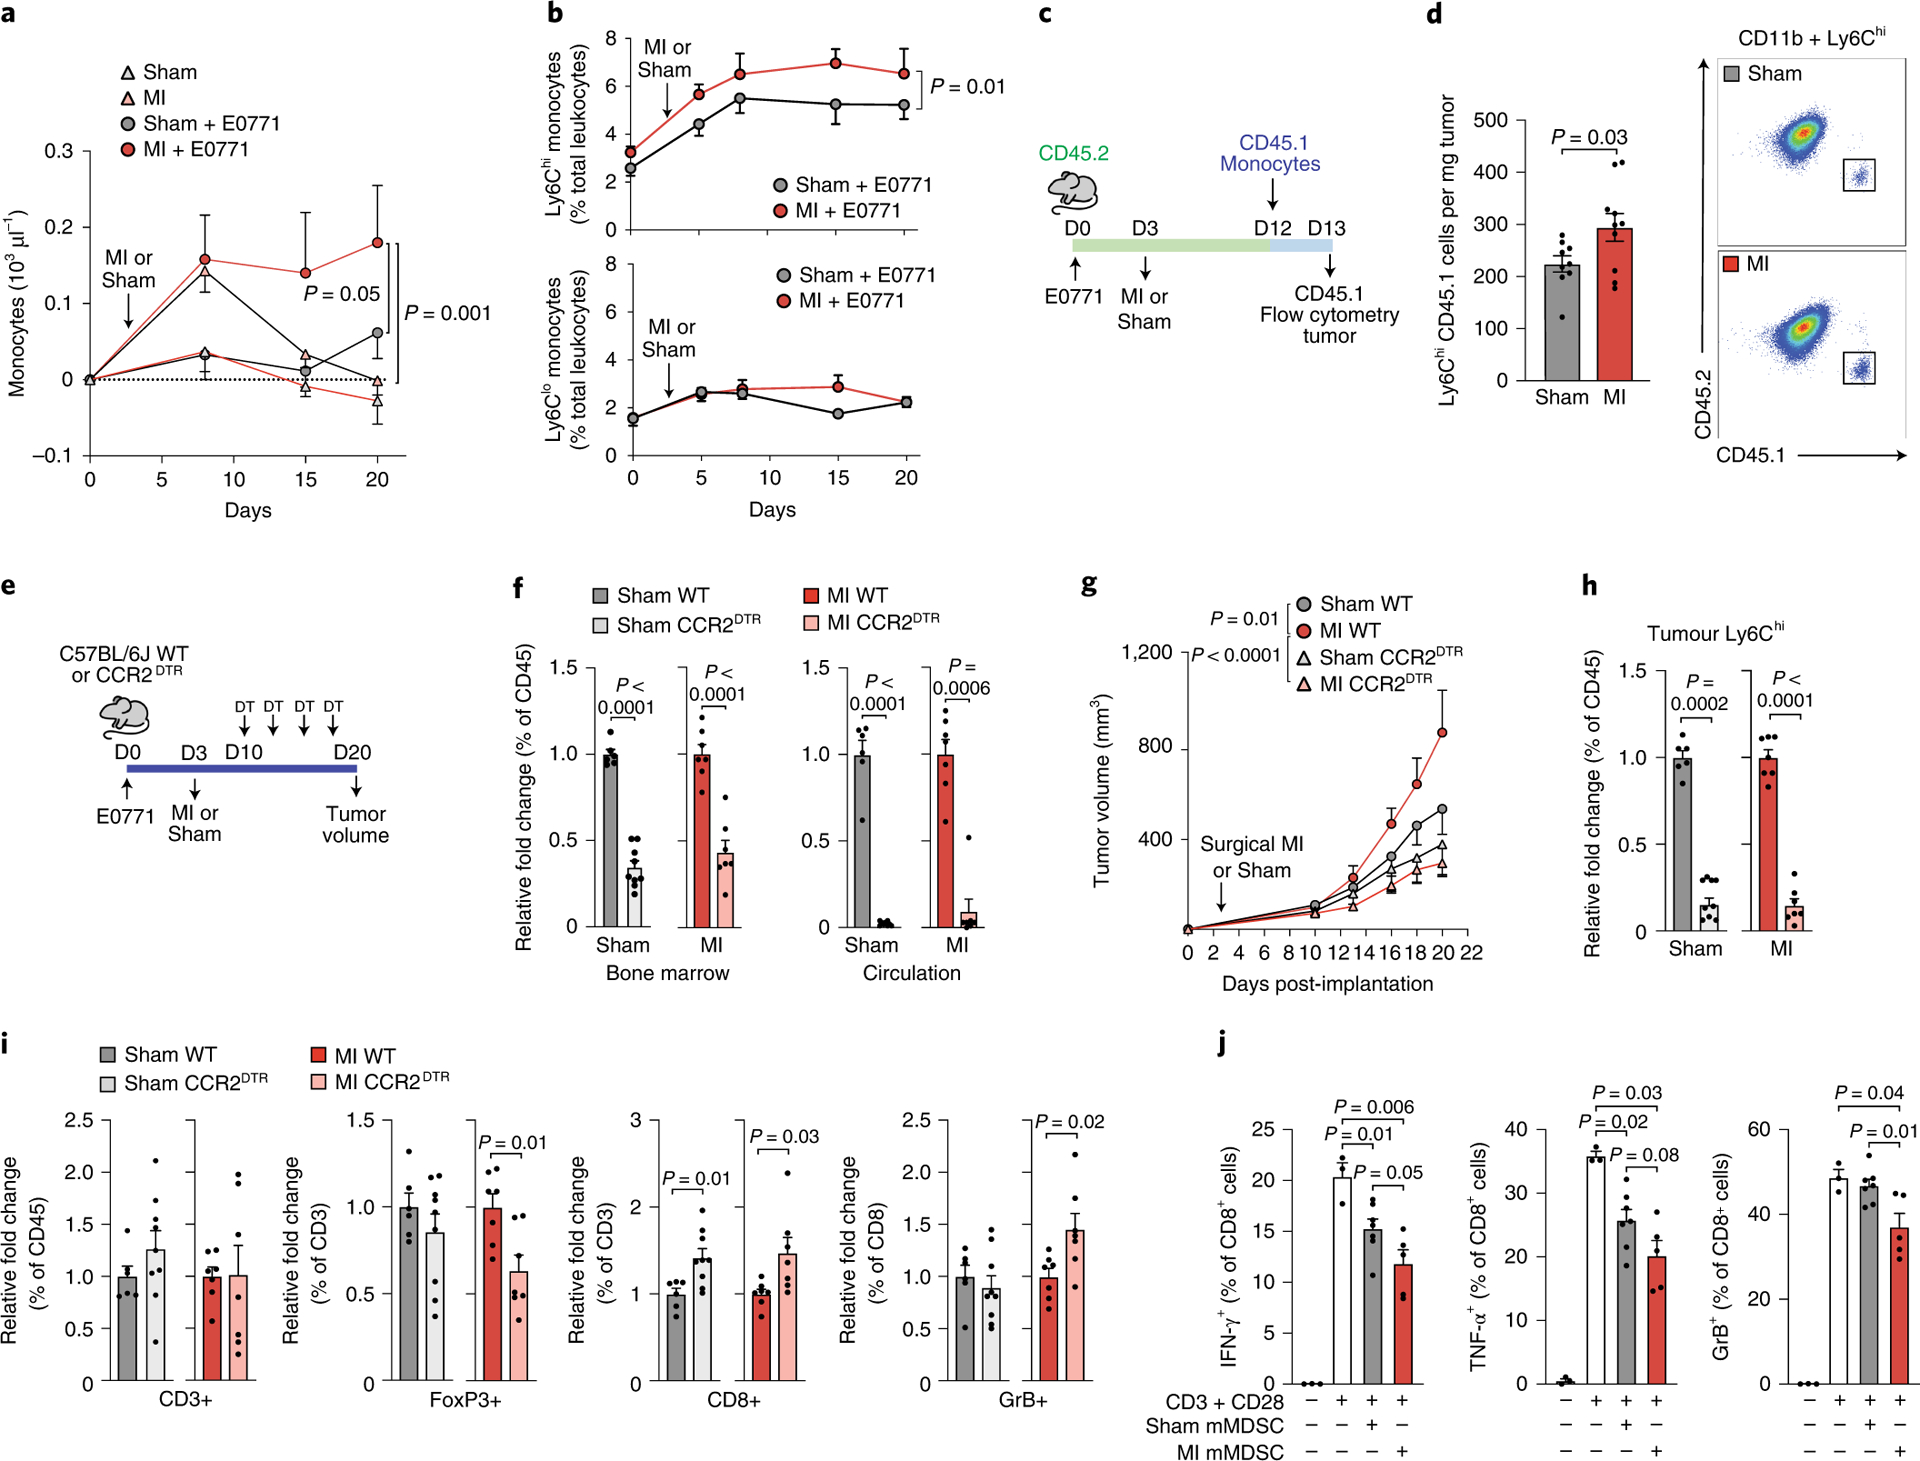
(a) Circulating monocytes in mice exposed to MI (n=5), sham surgery (n=9), MI+E0771 tumor (n=5) or sham surgery + E0771 tumor (n=7). (b) Circulating CD11b+Ly6Chigh (top) and CD11b+Ly6Clow (bottom) monocytes in E0771 tumor-bearing mice exposed to MI or sham surgery (n=8). (c) Outline of the monocyte tracking study using congenic CD45.1 and CD45.2 mice. (d) Left, quantification of CD45.1 Ly6Chigh monocytes in tumors 16 h after monocyte transplantation into CD45.2 recipient mice that underwent MI (n=10) or sham (n=9) surgery 9 days earlier. Right, representative FACS plots illustrating gating of CD45+CD11b+Ly6Chigh cells on CD45.2 and CD45.1. (e) Outline of monocyte depletion study in CCR2-diphtheria toxin receptor (DTR) and wild type (WT) mice implanted with E0771 tumor cells and exposed to MI or sham surgery. (f) Ly6Chigh monocytes in the bone marrow (left) and circulation (right) after DT injection in WT and CCR2DTR mice exposed to MI (n=7 WT, n=7 CCR2DTR) or sham (n=6 WT; n=9 CCR2DTR) surgery. (g-i) Quantification of tumor growth (g), tumoral Ly6Chigh monocytes (h), and T cell populations (FoxP3+ regulatory T cells, CD8+ cytotoxic T cells, Granzyme B+ activated CD8+ T cells) (i) in DT-treated WT and CCR2DTR mice exposed to MI (n=7 WT, n=7 CCR2DTR) or sham surgery (n=6 WT; n=9 CCR2DTR). (j) Suppressive effects of tumor monocytic myeloid derived suppressor cells (mMDSCs) isolated from mice exposed to MI (n=5) or sham surgery (n=7), as assessed by proportion of IFNγ+, TNFα+, and Granzyme B (GrB)+ CD8+ T cells after co-culture with mMDSCs in vitro. Two (a, b, d, f-i) and three (h) independent experiments were conducted. Data are the mean ± s.e.m. P values were calculated using a repeated measures analysis of variance (ANOVA) (b) with Bonferroni’s multiple comparisons test (a, g), a two-tailed Mann–Whitney U-test (f [MI circulation], j [TNFα+: SHAM mMDSC and MI mMDSC vs CD3+CD28]) or a two-tailed unpaired Student’s t-test (d, f [bone marrow, sham circulation], h, i, j [IFNγ+, GrB+, TNFα+ [SHAM mMDSC vs MI mMDSC])
To test if the increased availability and recruitment of Ly6Chigh monocytes was required for MI-accelerated tumor growth, we utilized mice expressing the diphtheria toxin receptor (DTR) under control of the CCR2 locus (CCR2DTR)15 to deplete CCR2+Ly6Chigh monocytes 7 days after MI or sham surgery (day 10 of tumor growth) (Fig. 2e). Serial diphtheria toxin injections reduced Ly6Chigh monocytes in blood (>90%) and bone marrow (~55%) of CCR2DTR compared to wild type (WT) mice (Fig. 2f), and inhibited tumor growth by 56% in mice exposed to MI (Fig. 2g). By contrast, monocyte depletion in CCR2DTR mice exposed to sham surgery did not significantly reduce tumor growth (Fig. 2g), despite equivalent depletion of intratumoral Ly6Chigh monocytes in CCR2DTR mice exposed MI and sham surgery (Fig. 2h). A similar inhibition of MI-accelerated tumor growth was seen in C57BL/6 mice treated with a CCR2 inhbitor 7 days after MI or sham surgery (Extended Data Fig. 6). Flow cytometric analysis of intratumoral T cell populations revealed that CCR2+ cell depletion reduced the proportion of T cells that were immunosuppressive CD4+FOXP3+ Tregs and increased activated (Granzyme B+) CD8+ cytotoxic T cells in mice exposed to MI but not sham surgery (Fig. 2i). Together, these data suggest that CCR2-expressing Ly6Chigh monocytes are required for MI-accelerated tumor growth, and that their recruitment restricts the anti-tumoral adaptive immune response. Although dendritic cell accumulation was unchanged in tumors of MI treated mice (Extended Data Fig. 3), it should be noted that dendritic cells also express CCR2 and thus, their recruitment to tumors would be restricted in these experiments.
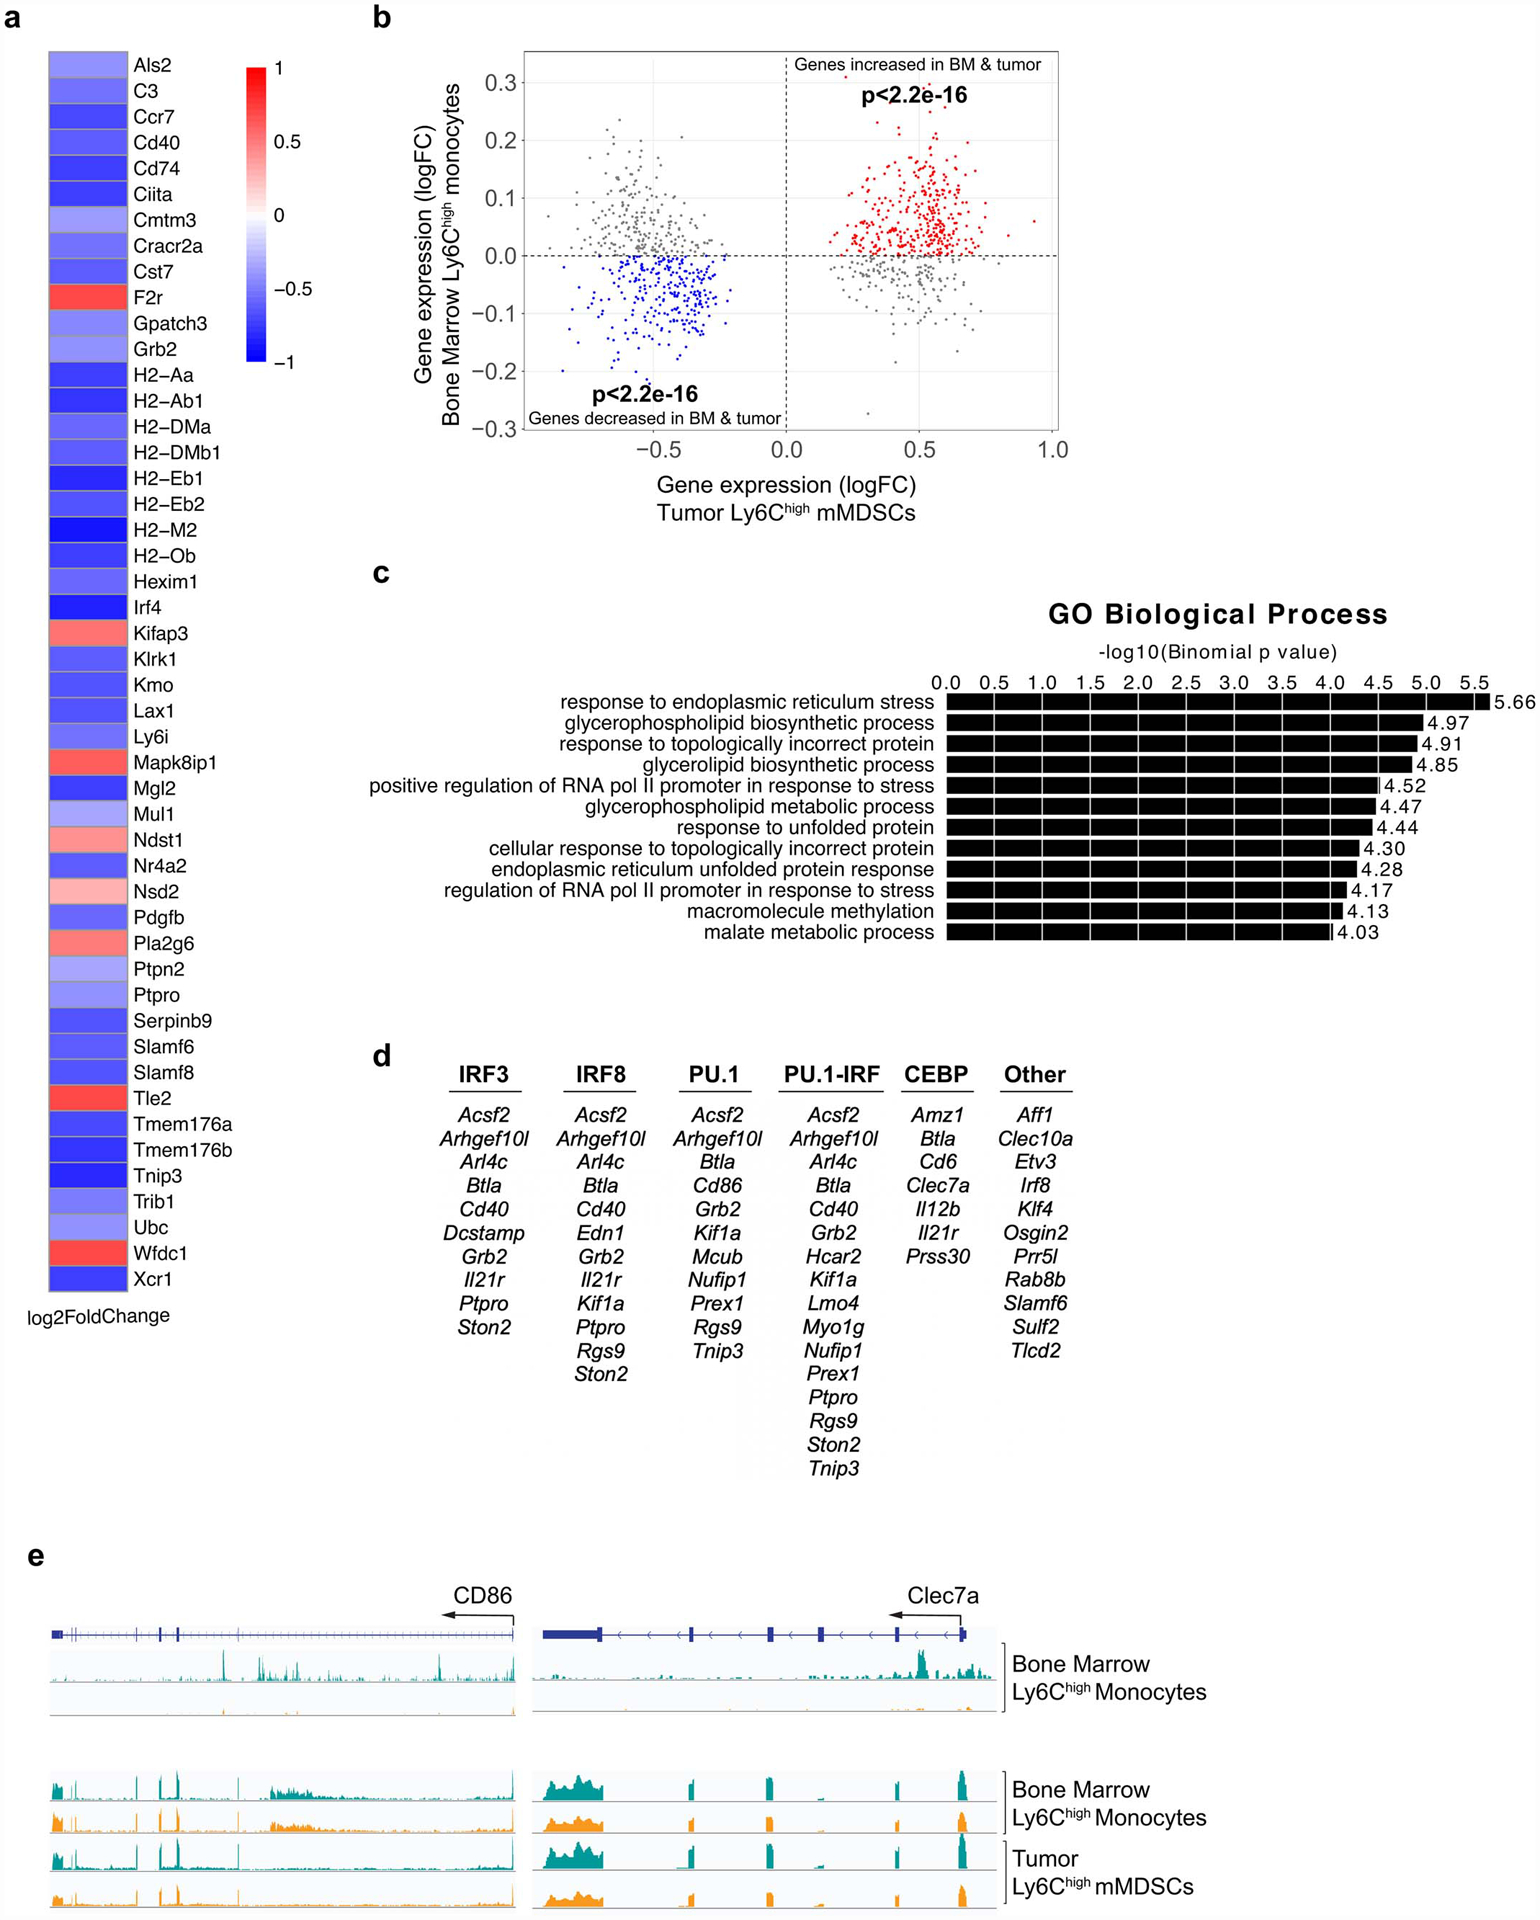
To further understand the functional mechanisms through which myeloid cells contribute to accelerated breast cancer growth after MI, we isolated monocytes from E0771 tumors 17 days post-MI or sham surgery and tested their ability to alter CD8+ T cell proliferation and activation. While we observed no differences in CD8+ T cell proliferation upon co-culture with monocytes isolated from mice exposed to MI or sham surgery (Extended Data Fig. 7), monocytes from mice exposed to MI were more effective at suppressing CD8+ T cell activation in vitro, as measured by IFNγ, TNFα and Granzyme B expression (Fig. 2j, Extended Data Fig. 7). These data suggest that 1) these intratumoral myeloid cells meet the established functional criteria for mMDSCs16 and 2) on a per cell basis, mMDSCs from MI-treated mice are more immunosuppressive than their sham counterparts. RNA sequencing (RNA-Seq) of mMDSCs isolated from tumors 17 days post-surgery revealed 235 genes differentially expressed in mice exposed to MI compared to sham surgery (Fig. 3a), with gene pathways known to restrict cancer pathogenesis being prominently downregulated in mMDSCs from mice exposed to MI (Fig. 3a). Molecular Functional Ontology and REACTOME Pathway analyses identified regulation of the immune response, lymphocyte activation, adaptive immune system function and interferon gamma signaling as processes downregulated in mMDSCs from mice exposed to MI compared to sham surgery (Fig. 3a). Among those genes whose expression was significantly reduced in mMDSCs after MI were genes linked to MHC Class II presentation (e.g. Cd74 and H2-specific genes) and T cell activation (e.g. Cd40, Irf417) (Extended Data Fig. 8), which support the observed immunosuppressive phenotype. Analysis of upstream regulators of differentially expressed genes predicted inhibition of inflammatory mediators such as interferon (IFN)-γ and signal transducer and activator of transcription 1 (STAT1), and activation of anti-inflammatory regulators such as the IL-10 receptor (IL10RA) (Fig. 3b). Together, these findings suggest that MI shifts mMDSCs towards an immunosuppressive state.
Figure 3. Tumoral Ly6Chigh monocytic myeloid derived suppressor cells (mMDSCs) exhibit an MI-induced immunosuppressive transcriptional phenotype that is epigenetically imprinted in the bone marrow.
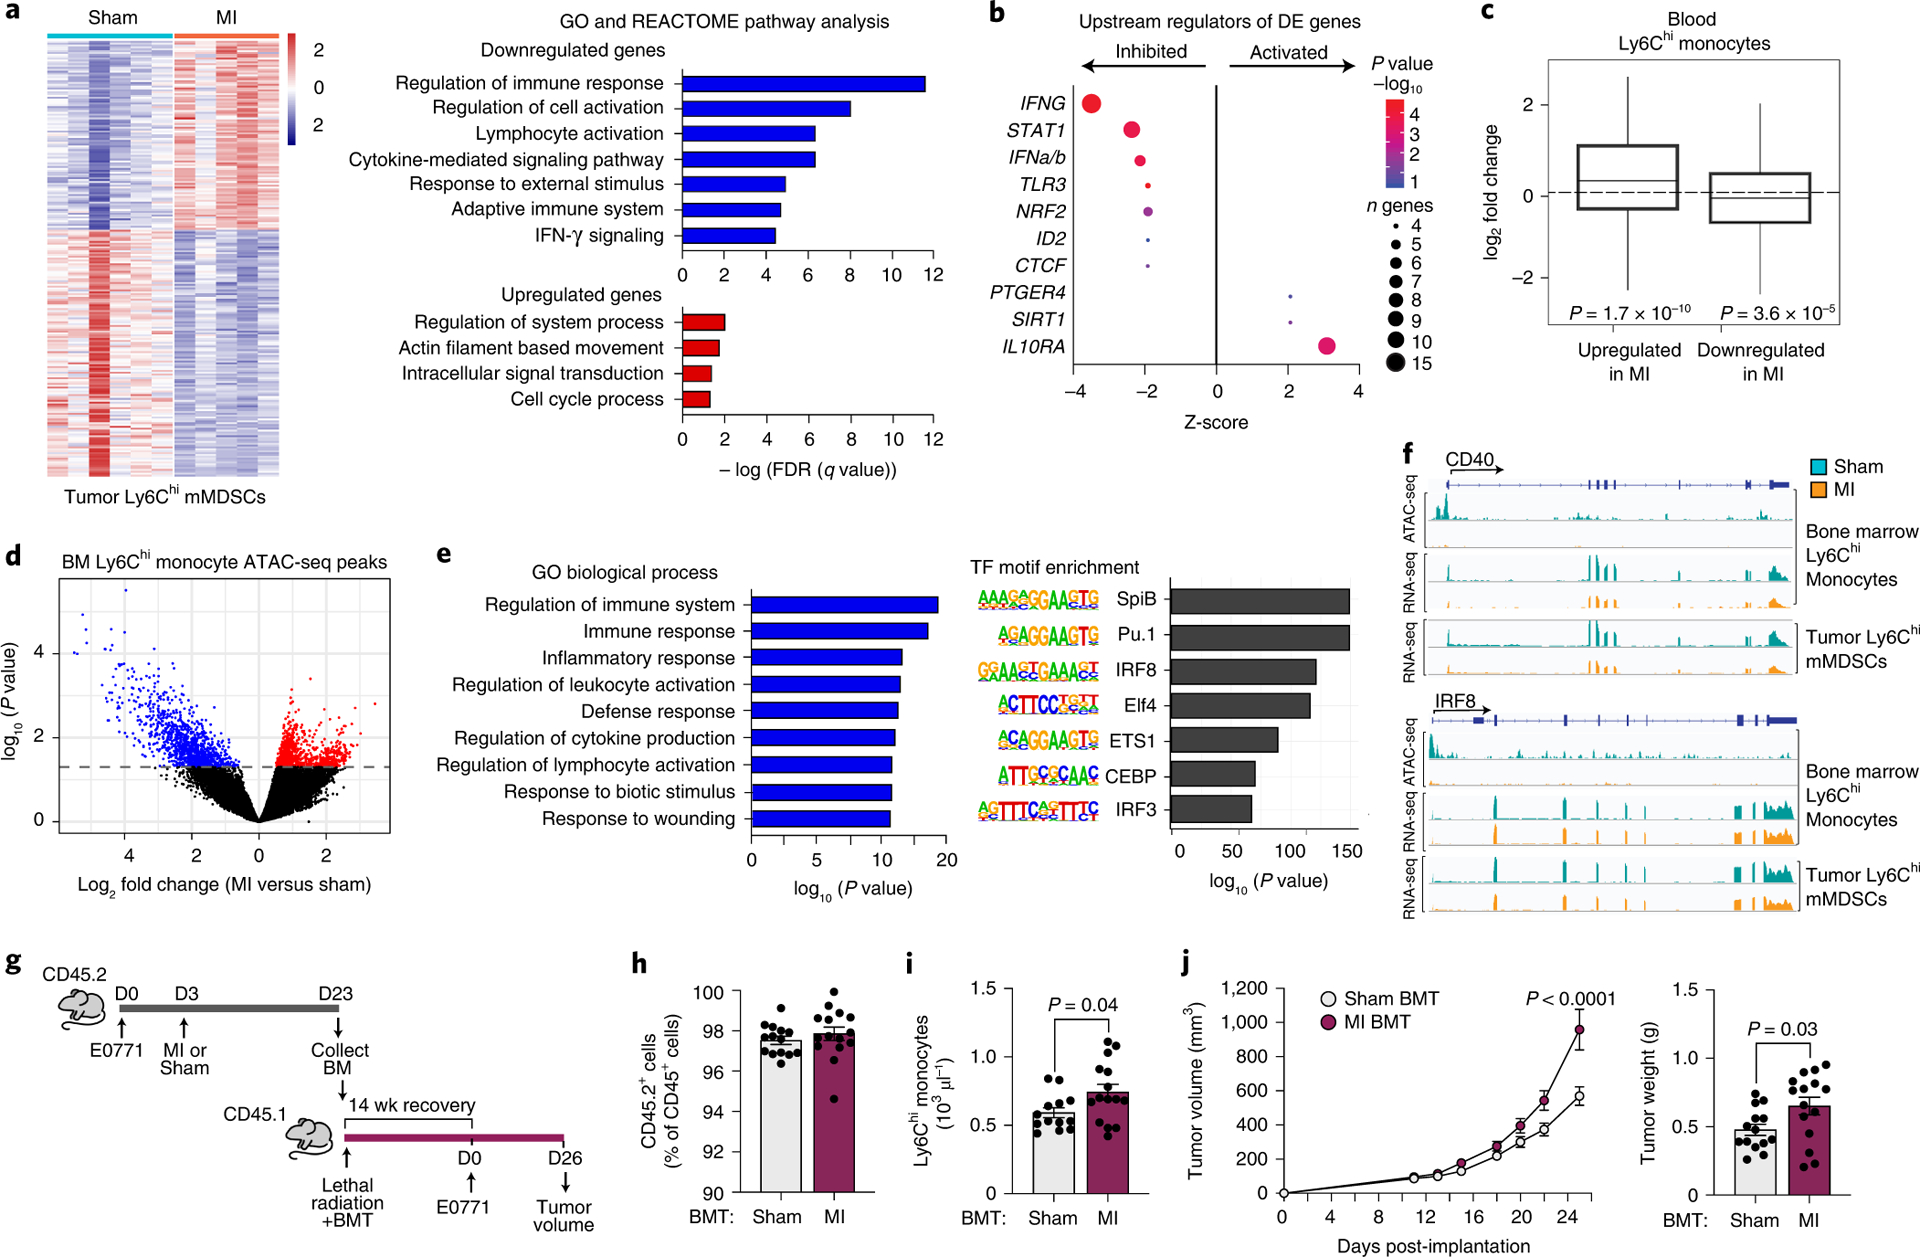
(a) Left, heat map showing RNA-Seq gene expression changes (n=235 genes) in tumoral CD11b+Ly6Chigh mMDSCs from mice 17 days post-MI (n=5) or sham (n=6) surgery (Padj<0.1). Right, functional enrichment analyses of differentially-expressed genes in tumoral mMDSCs from MI and sham mice. (b) Upstream regulator analyses of genes from a. n, number of differentially expressed (DE) genes regulated per factor, with color denoting p value (-log10). (c) Gene set concordance analysis, which shows that the 1000 top DE genes up- and down-regulated in tumor CD11b+Ly6Chigh mMDSCs (n=5 MI, n=6 sham) are up- and down-regulated in blood Ly6Chigh monocytes at 9 days after MI, as compared to background gene expression. Box: interquartile range (IQR); line: median; whiskers: most extreme value within 1.5x the IQR. (d) Volcano plot showing chromatin loci identified by ATAC-Seq to be more (red, n=942 peaks) or less (blue, 1101 peaks) accessible in bone marrow Ly6Chigh monocytes from mice exposed to MI (n=4, 2 pools of two mice) as compared to sham surgery (n=8, 4 pools of two mice) (P<0.05). (e) Gene ontology (GO) (left) and transcription factor binding motif enrichment (right) analyses of less accessible chromatin regions (n=1101 peaks) in bone marrow Ly6Chigh monocytes from mice exposed to MI as compared to sham surgery. (f) ATAC-Seq (top) and RNA-Seq (bottom) reads in bone marrow and tumor Ly6Chigh monocytes at selected gene loci. (g) Bone marrow (CD45.2+) was isolated from mice 20 days after tumor implantation and 17 days after MI (n=5) or sham (n=5) surgery and was pooled in PBS and transplanted into lethally irradiated C57BL/6J mice (CD45.1+) mice. 14 weeks after transplantation, E0771 tumors were implanted and tumor volume was assessed over the course of 26 days. BMT, bone marrow transplantation. (h,i) CD45.2/CD45.1 chimerism (sham, n=14 and MI, n=15) (h) and circulating monocyte levels (sham, n=13 and MI, n=15) (i) in BMT recipients at 14 weeks after transplantation. (j) E0771 tumor volume over 26 days (left) and tumor weight at day 26 (right) (sham, n=14 and MI, n=15). Data are the mean ± s.e.m. P(adj) values were calculated using the Benjamini-Hochberg method (a, left). FDR values were based on a permutation test (a, right). P values were calculated using a one-sided Fishers Exact test (b), two-sided Wilcoxon Rank-Sum Test (c), two-sided Wald test (d), hypergeometric distribution (left) and binomial distribution (right) (e), two-tailed unpaired Student’s t-test (h, i, j [right]), or a repeated measures analysis of variance (ANOVA) with Bonferroni’s multiple comparisons test or (j [left]).
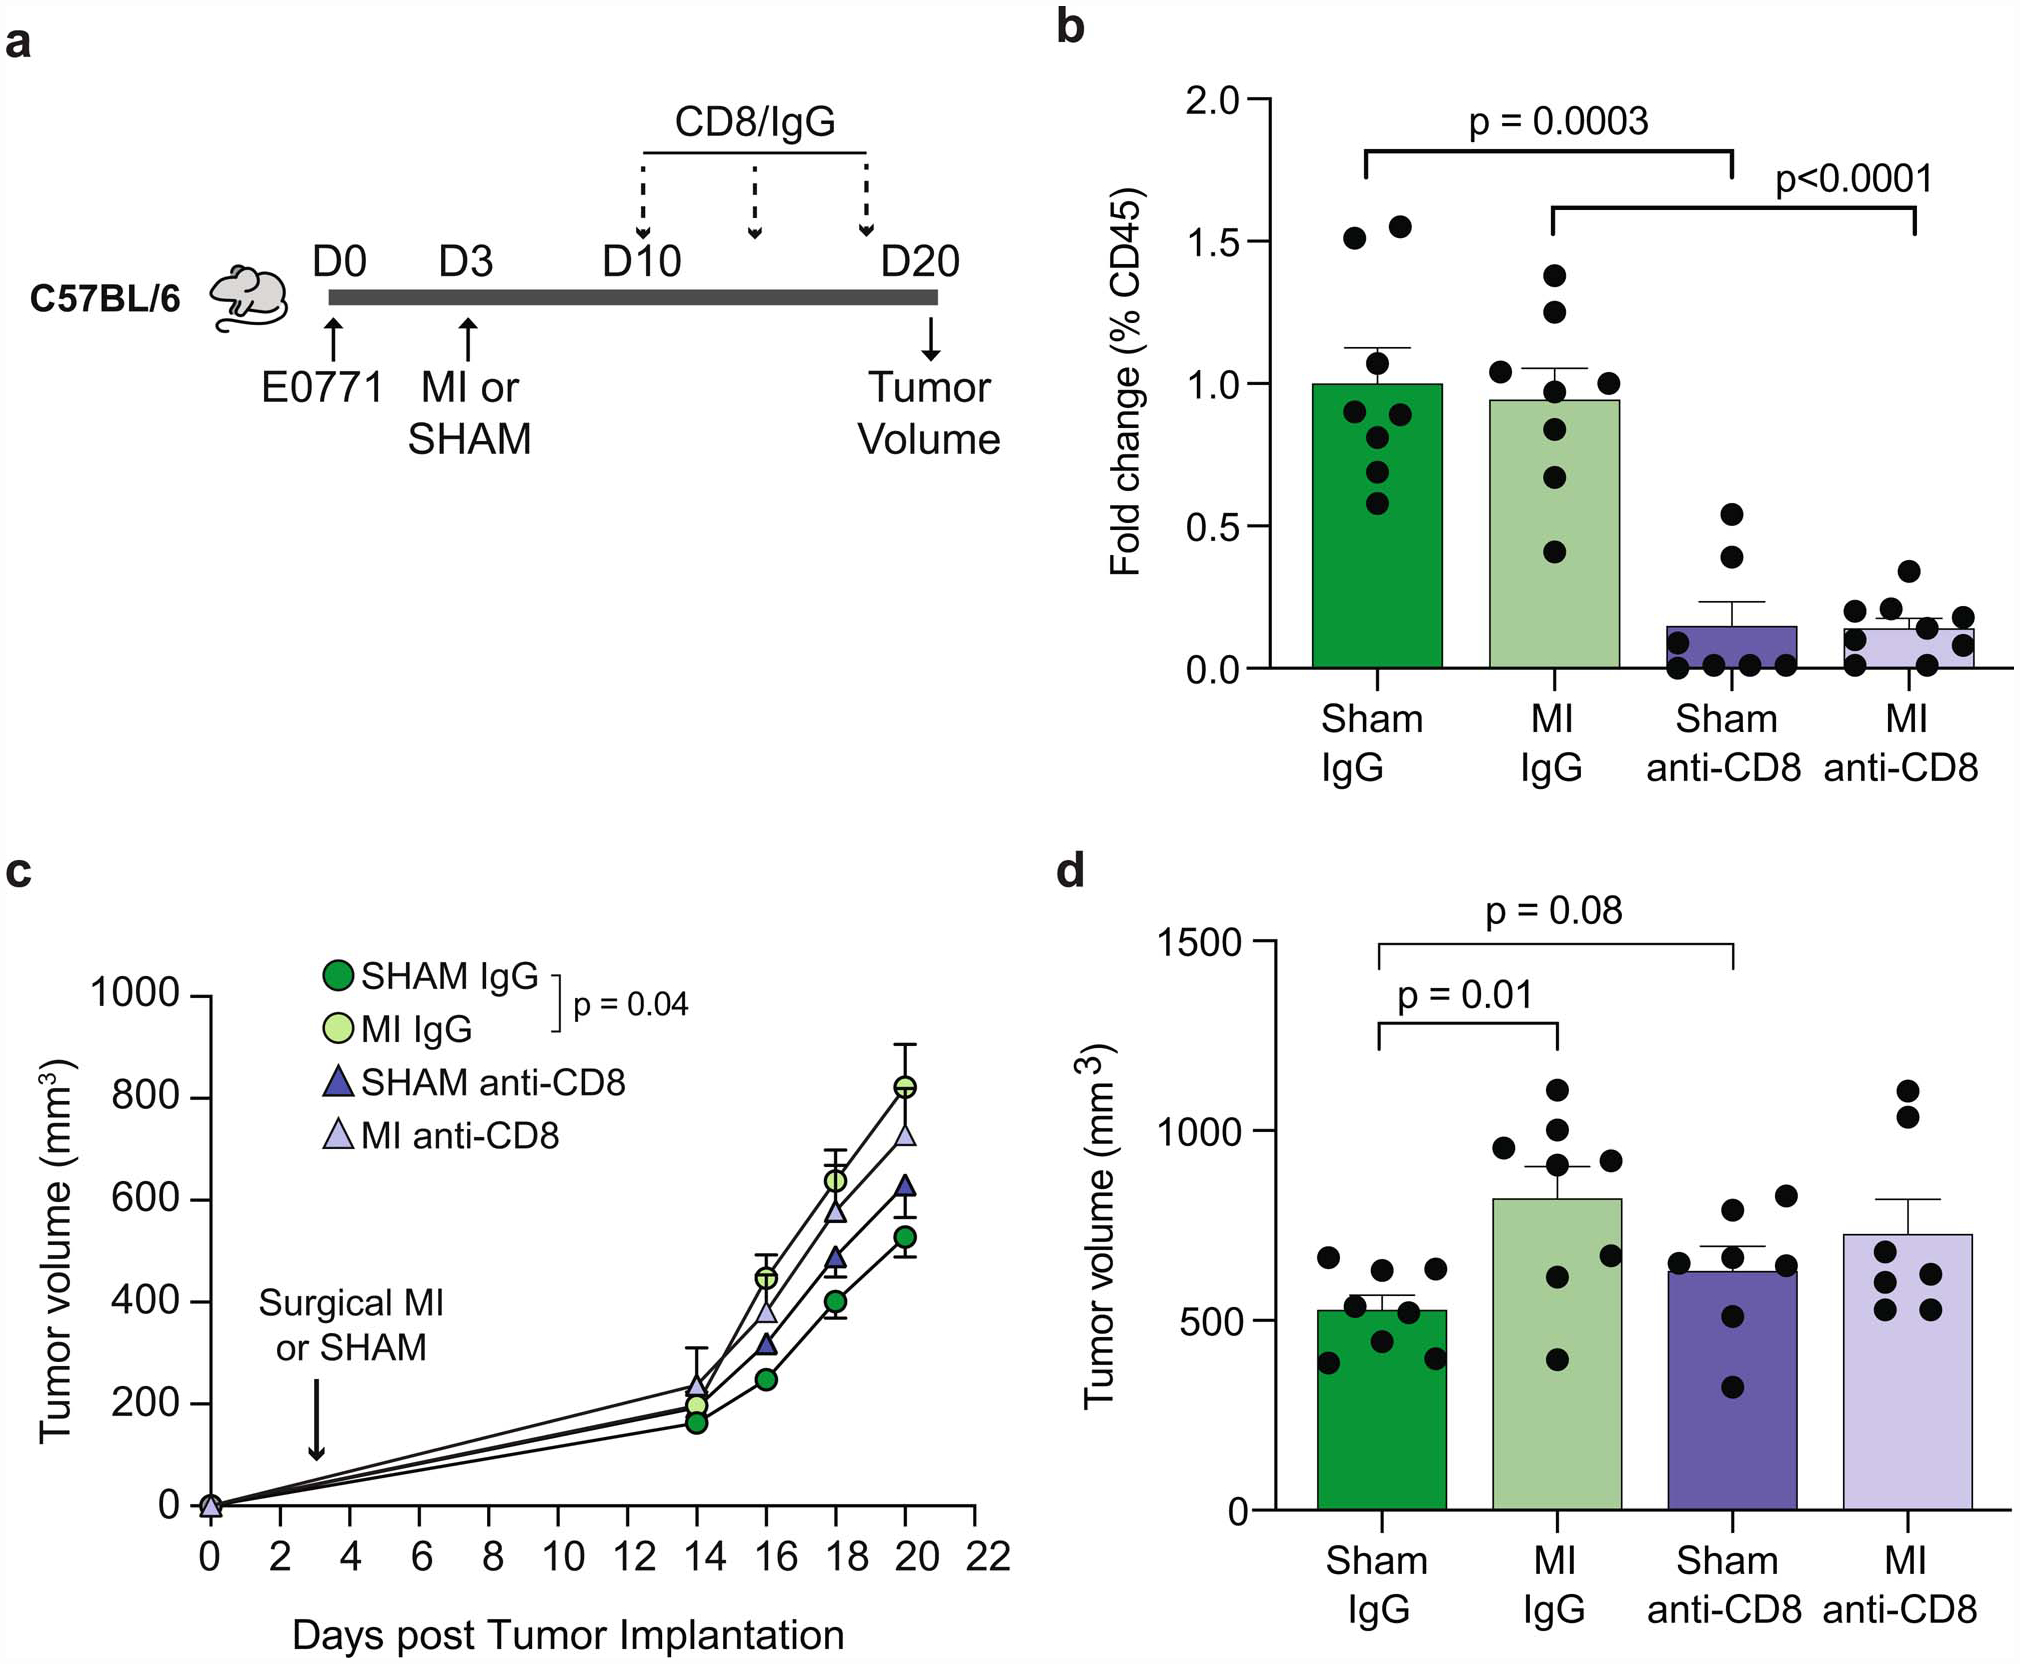
To further investigate the role of CD8+ T cell suppression in MI-accelerated tumor growth, we treated E0771 tumor-bearing mice with anti-CD8 or control IgG 7 days after MI or sham surgery, and measured effects on tumor growth. In sham treated mice, depletion of CD8+ T cells increased tumor growth compared to control IgG, consistent with the loss of CD8-mediated tumor control (Extended Data Fig. 9). By contrast, in mice that experienced MI, depletion of CD8+ T cells had no effect on tumor growth (Extended Data Fig. 9), consistent with the dysfunctional phenotype of CD8+ T cells in these mice (Fig. 2i–j). These results indicate that the accelerated tumor growth effect of MI is due, in part, to a dysfunctional CD8+ T cell response.
To investigate whether MI reprograms Ly6Chigh monocytic reservoirs prior to tumor recruitment, we performed RNA-Seq of blood CD11b+Ly6Chigh monocytes isolated during early tumor growth prior to observed differences in tumor size (9 days post-MI). Using gene set concordance analysis, we tested whether the set of genes differentially expressed in tumor CD11b+Ly6Chigh mMDSCs was enriched in genes differentially expressed in circulating CD11b+Ly6Chigh monocytes post-MI. Compared to background gene expression, the top 1000 genes differentially expressed (504 upregulated and 496 downregulated) in tumor CD11b+Ly6Chigh mMDSCs were significantly overrepresented in genes up- and down-regulated in circulating CD11b+Ly6Chigh monocytes from mice exposed to MI vs sham (Fig. 3c). Furthermore, this gene set was also significantly overrepresented in genes up- and down-regulated in CD11b+Ly6Chigh monocytes isolated from the bone marrow 17 days post-MI (Extended Data Fig. 8), suggesting that MI induces sustained reprogramming of myeloid reservoirs.
As recent studies have established that microbial and sterile triggers of inflammation can imprint innate immune memory through epigenetic changes across the genome18,19, we next investigated whether MI altered the chromatin landscape of bone marrow Ly6Chigh monocytes of tumor-bearing mice using transposase-accessible chromatin with high throughput sequencing (ATAC-Seq). Compared to sham surgery, bone marrow Ly6Chigh monocytes from mice exposed to MI showed marked changes in the chromatin landscape, with 942 regions of more accessible chromatin and 1101 regions of reduced chromatin accessibility (Fig. 3d). Genomic Regions Enrichment of Annotations Tool (GREAT) analysis of the regions showing increased accessibility after MI revealed enrichment of pathways related to stress responses, including ER stress, transcriptional responses to stress, and response to unfolded protein (Extended Data Fig. 8). Analysis of regions showing reduced accessibility after MI revealed an enrichment of pathways regulating immune and inflammatory responses, with associated GO terms such as cytokine production, regulation of lymphocyte activation, and response to wounding (Fig. 3e). Analysis of transcription factor binding motifs within chromatin regions that were less accessible after MI identified binding sites for the pioneer factors PU.1 and CEBP, as well as interferon regulatory factor (IRF)-8 (Fig. 3e), which cooperatively binds with PU.1 at monocyte enhancers to activate inflammatory responses. Notably, reduced levels of IRF-8 impair myeloid cell differentiation resulting in a monocyte phenotype reminiscent of immunosuppressive mMDSCs20,21.
To test whether the altered chromatin landscape in bone marrow monocytes was reflected in transcriptional changes identified in tumor mMDSCs after MI, we integrated the bone marrow Ly6Chigh monocyte ATAC-seq and tumoral Ly6Chigh monocyte RNA-Seq datasets. This analysis identified numerous genes regulated by PU.1, CEBP and IRF-8 that were both transcriptionally inhibited in tumor mMDSCs and exhibited reduced chromatin accessibility in bone marrow monocytes (Fig. 3f, Extended Data Fig 8). These included the Cd40 and Cd86 genes involved in T cell activation, Clec7a (Dectin-1) which has been linked to trained immunity and heightened inflammatory responses, as well as Irf8 itself (Fig. 3f, Extended Data Fig. 8). Collectively, these data indicate that MI epigenetically reprograms bone marrow monocytes towards an immunosuppressive phenotype that persists in tumor mMDSCs. As epigenetic alterations to myelopoietic progenitors have been shown to underlie learned innate immune memory19,22, we next tested whether MI, in the setting of cancer, induces long-term learned responses in hematopoietic progenitor cells using a bone marrow transplantation approach (Fig. 3g, h). Peripheral blood analysis 14 weeks after transplantation showed that CD45.1 mice reconstituted with bone marrow from tumor-bearing CD45.2 mice 20 days after MI exhibited higher levels of circulating monocytes, as compared to CD45.1 mice reconstituted with bone marrow from tumor-bearing CD45.2 sham controls (Fig. 3i). Upon implantation of E0771 tumor cells in the mammary fat pad of these CD45.1 recipient mice we observed accelerated tumor growth in mice reconstituted with bone marrow from MI vs sham treated mice (Fig. 3j). No difference in peripheral chimerism (>95%) was observed between the two groups (Fig. 3h), indicating that the altered tumor growth phenotype was not due to differences in reconstitution potential. These data suggest that epigenetic changes imprinted in the bone marrow after MI are sustained upon transplantation to naïve mice, where they drive myelopoiesis and accelerated tumor growth.
To extend our findings, we next tested the effects of MI in a transgenic mouse model of spontaneous breast cancer (MMTV-PyMT), which also develops pulmonary metastases as part of its disease pathogenesis. We performed MI or sham surgery at the onset of palpable mammary tumor formation (cumulative tumor burden <400 mm3; Extended Data Fig. 10), and monitored tumor growth over 18 days (Fig. 4a). Consistent with our findings in the E0771 tumor model, MI markedly accelerated tumor growth compared to sham surgery in MMTV-PyMT mice (Fig. 4a–b; Extended Data Fig. 10). Accelerated tumor growth was similarly associated with elevated levels of circulating monocytes (Extended Data Fig. 10), although this did not reach statistical significance. In the MMTV-PyMT model, infiltrating Ly6Chigh monocytes differentiate into MHCIIhighCD11blow immunosuppressive tumor-associated macrophages (TAMs), which are the predominant myeloid cell type found in these tumors23 . Consistent with this, we observed an increase in Ly6Chigh monocyte-derived TAMs, but no differences in MDSC populations, in tumors of mice exposed to MI compared sham (Fig. 4c, Extended Data Fig. 10). We also observed a proportional increase in intratumoral immunosuppressive regulatory T cells (FoxP3+), further suggesting that MI is associated with tumor immunosuppression in this model. (Fig. 4c). Next, to investigate whether MI altered metastatic burden in MMTV-PyMT mice, we performed a subset analysis in mice with similar primary tumor volumes at sacrifice (Extended Data Fig. 10), and measured expression of the mammary-specific Pymt gene in whole lung tissue, as previously described24. We found that MI increased metastatic burden as assessed by Pymt-expression to the lung (Fig. 4d) and pulmonary accumulation of Ly6Chigh monocytes (Fig. 4e), which are critical to the formation of the (pre)metastatic niche25.
Figure 4. Myocardial infarction accelerates cancer progression in mice, and incident cardiovascular events increase the risk of recurrence and cancer-specific mortality in early-stage breast cancer patients.
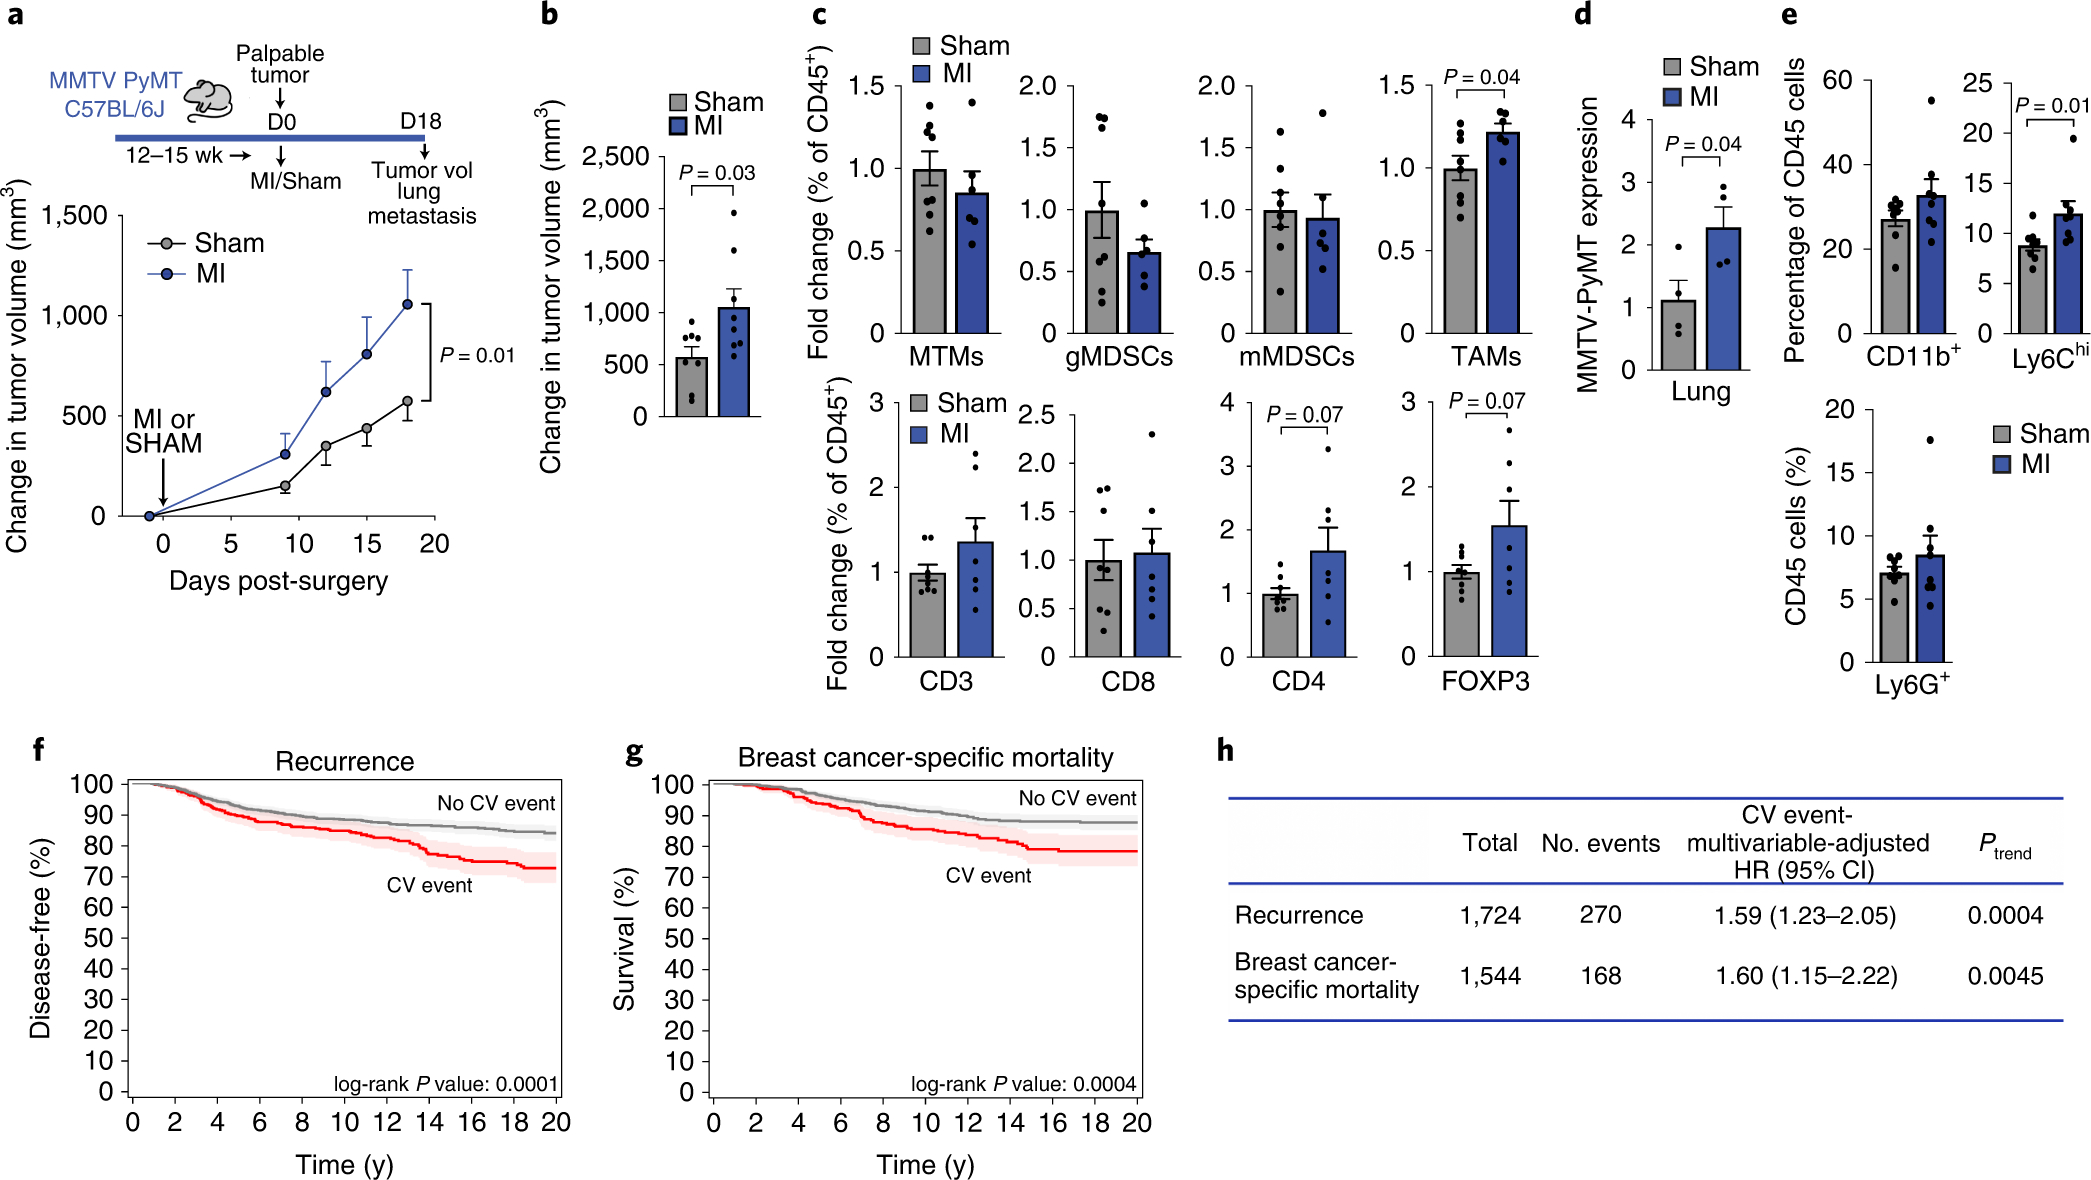
(a) Top, coronary artery ligation or sham surgery was performed upon palpable tumor formation in MMTV-PyMT mice and cumulative tumor burden was followed over the course of 18 days, at which time tumor volume and metastatic burden were assessed. Bottom, quantification of tumor growth in the MMTV-PyMT genetically engineered mouse model of spontaneous breast cancer after MI or sham surgery (n=8/group). (b) Mean change in tumor volume at day 18 as compared to day 0 after MI or sham surgery (n=8/group). (c) Flow cytometric analysis of tumor myeloid cells (top: n=6 MI, 8 sham) and lymphoid cells (bottom: (n=7 MI, 8 sham) at day 18 after MI or sham surgery. Mammary tissue macrophages (MTM: CD11bhighMHCII+); granulocytic myeloid derived suppressor cell (gMDSC: CD11bhighMHCII−Ly6CloLy6Ghi); monocytic myeloid derived suppressor cell (mMDSC: CD11bhighMHCII−Ly6ChiLy6Glo); tumor-associated macrophage (TAM: CD11bloMHCIIhi); CD3+, T cells; CD8+, cytotoxic T cells; CD4+, T helper cells; CD4+FoxP3+, regulatory T cells. (d) Analysis of mammary-specific Pymt mRNA levels in the lungs of MI and sham mice with similar sized tumors at sacrifice (n=4/group). (e) Flow cytometric analysis of myeloid cells in the lungs of MMTV-PyMT mice (n=8/group) at day 18 after MI or sham surgery; CD11b+Gr1–, macrophages; CD11b+Ly6G+, neutrophils; CD11b+Ly6Chi, monocytes. (f-g) Kaplan Meier curves for cancer recurrence (f) and breast cancer-related mortality (g) in patients with early-stage breast cancer (n=1,724) who experienced a post-diagnosis cardiovascular (CV) event. (h) Multivariable-adjusted hazard ratios adjusted for age, race, smoking status, body mass index at diagnosis date, tumor stage and adjuvant therapy (chemotherapy, radiation, endocrine therapy), utilizing traditional Cox proportional hazards regression models. All patient statistical tests were two sided. Three independent experiments (b-e) were conducted. Data are the mean ± s.e.m and P values were calculated using a repeated measures analysis of variance (ANOVA) with Bonferroni’s multiple comparisons test (a), a two-tailed Mann–Whitney U-test (e), or two-tailed unpaired Student’s t-test (b, c, d).
To investigate whether our pre-clinical observations extended to patients, we performed a retrospective analysis of two prospective case cohort studies in early-stage breast cancer26,27 to evaluate the relationship between a new onset, post-diagnosis cardiovascular event (e.g., MI, stroke) and cancer outcomes (i.e., recurrence and cancer-specific death). Patients with existing cardiovascular disease or cardiovascular risk factors at cancer diagnosis were excluded, and remaining patients (n=1724) were adjusted for multiple covariates (Figure 4f–h, Supplementary Table 1). With an average follow up time of 11.7 years from diagnosis, we found that a post-diagnosis incident cardiovascular event was associated with an adjusted increased risk of recurrence of 59% [95% confidence interval (CI), 1.23 to 2.06] and breast cancer-specific mortality of 60% (95% CI, 1.16 to 2.22), compared to no cardiovascular event (Fig. 4f–h). These data support and extend prior work showing that cardiovascular events such as heart failure are associated with increased all-cancer incidence28,29,30 as well as support our preclinical observations indicating that cardiovascular events accelerate breast cancer.
In summary, our findings demonstrate that MI is an acute pathologic stressor that accelerates breast cancer. Mechanistically, MI induces a systemic host response, centrally regulated by the innate immune system, which drives deleterious cross-disease communication enabling tumor growth. MI epigenetically reprograms myeloid cells in hematopoietic reservoirs toward an immunosuppressive state and induces monocytosis, which together are coopted by the tumor to propagate cancer outgrowth. Future studies will be needed to further delineate mechanisms underlying MI-induced monocyte immunosuppression in breast cancer, including the roles of ischemia31, sympathetic and parasympathetic regulation, and regulators of emergency hematopoiesis and innate immune training (e.g., IFN and IL-1b/inflammasome19,32,33. Collectively, our findings exemplify the importance of understanding host co-morbidities and their potential impact on cancer progression, Moving forward, implementing strategies that mitigate cardiovascular disease risk in breast cancer patients may not only yield improvements in cardiovascular-specific, but also cancer-specific mortality.
Methods
Design
The overall objective of our study was to understand if myocardial infarction (MI) altered breast cancer progression. Within the animal studies, mice were randomly assigned to MI or sham surgery following tumor cell implantation (E0771) or upon palpable tumor formation (MMTV-PyMT). To power our studies, sample size was predefined as at least n = 4 in 2–3 independent experiments, as noted. All analyses were blinded when possible through numerical coding of samples. For in vivo E0771 and MMTV-PyMT studies, mice were excluded if they had (i) a confirmed missed LAD ligation (through triphenyl tetrazolium chloride (TTC) staining) (ii) died from complications of surgery (within 10 days) or (iii) tumor ulceration. For E0771, additional exclusion criteria included (i) missed (non-mammary) fat pad tumor injection or (ii) no tumor growth by 20 days following injection. For MMTV, additional exclusion criteria included cumulative tumor burden >400mm3 at time of surgery. To understand how our preclinical findings extended to patients, we performed a retrospective analysis of two prospective case cohort studies, the Life After Cancer Epidemiology (LACE) study26 and Pathways study27 to determine the relationship between a post-diagnosis cardiovascular event and recurrence or breast cancer-specific mortality in 1724 patients diagnosed with early stage disease.
Mouse Studies
All experimental procedures were done in accordance with the US Department of Agriculture Animal Welfare Act and the US Public Health Service Policy on Humane Care and Use of Laboratory Animals and were approved by the New York University School of Medicine’s Institutional Animal Care and Use Committee.
To investigate the effects of MI on breast cancer primary tumor growth, we orthotopically implanted the murine mammary cancer cell line E0771 (provided by Dr. Erik R. Nelson, University of Illinois) in female C57BL/6J (Jackson Laboratory, stock # 00064). Prior to implantation, E0771 cells were maintained in RPMI 1640 (ATCC) supplemented with 10% fetal bovine serum (Life Technologies) and 1% penicillin/streptomycin (Life Technologies), authenticated with American Type Tissue Collection methods and tested monthly for mycoplasma. 2×10⁵ E0771 cells in calcium- and magnesium-free PBS (200 μL) were orthotopically injected into the mammary fat pad of 10–12 week old female C57BL/6J mice (day 0) and myocardial infarction (MI) or sham surgery was performed 3 days later. MI was induced by permanent ligation of the left anterior descending (LAD) coronary artery. Mice were anesthetized using ketamine (100 mg per kg body weight) and xylazine (10 mg per kg body weight) via intraperitoneal (i.p.) injection and then intubated and ventilated with air using a small-animal respirator. The chest wall was shaved and a thoracotomy was performed in the fourth left intercostal space. The LAD coronary artery was identified and permanently ligated ~3 mm below the left atrium with a monofilament nylon 8–0 suture. The thorax was closed with a 6–0 suture. Mice were given buprenorphine as an analgesic following surgery. Sham-operated animals (MI control) were subjected to similar surgery, passing the thread without ligating the artery. Tumor volume was measured by digital caliper and calculated as V = (L × W2)/2 when primary tumors were first palpable (day 10), as well as day 12, 14, 16, and at sacrifice (day 20). 20 days was selected based on mice exposed to MI reaching a primary tumor volume concomitant with cancer-specific death (IACUC euthanization criteria). Tumors were collected at sacrifice for immunohistochemical and flow cytometry analyses.
For studies in the genetically engineered mouse breast cancer model MMTV-PyMT, 12–15 week old female MMTV-PyMT transgenic mice (Jackson Laboratories, stock #022974) were randomized to MI or sham surgery when primary tumors were first palpable (50–400 mm3), and surgeries were performed as described above. The sum of the volume of multiple tumors per mouse were combined to generate ‘total tumor burden’. Tumor volume was measured at day prior to surgery (day –1), and then at day 9, 12, 15 and at sacrifice (day 18), and tumor and lung tissue samples were collected for flow cytometric and gene expression analysis.
For monocyte transfer experiments, bone marrow from CD45.1 mice (Jackson Laboratories, stock # 002014) was collected and monocytes were isolated by negative selection using magnetic-activated cell sorting (MACS, Miltenyi Biotec). In the first transfer experiment, bone marrow monocytes were isolated from CD45.1 mice 9 days post-MI or sham surgery, and 5×10⁵ cells were injected retro-orbitally into E0771 tumor bearing CD45.2 recipient mice. In the second transfer experiment, 5×10⁵ monocytes from untreated mice were resuspended in calcium- and magnesium-free PBS and injected retro-orbitally into E0771 tumor bearing CD45.2 recipient mice (Jackson Laboratories, stock # 00064) 9 days after MI or sham surgery. Intratumoral CD45.1 monocytes were quantified 16 hours following transfer by flow cytometry.
For monocyte depletion studies, E0771 cells were grafted in the mammary fat pad of CCR2DTR mice on the C57BL/6J background (gift from Dr. Eric Pamer, Memorial Sloan Kettering Cancer Center, NY) or wild type C57BL/6J mice (Jackson Laboratories, stock #00064), and MI or sham surgery was performed 3 days later. To deplete CCR2+ monocytes, 5 μg/kg diphtheria toxin (DT, List Biological Laboratories) was injected into all mice at day 10, 13, 16 and 19. Monocyte depletion in the bone marrow, blood and tumor was confirmed by flow cytometry, and tumor growth was monitored over the course of the study. For CCR2 inhibitor studies, the CCR2 inhibitor CCX417 (ChemoCentryx) or DMSO vehicle was administered subcutaneously (5 ml/kg) at day 10, 13, 16 and 19. For CD8+ immune cell depletion studies, mice were injected i.p. with 1 mg anti-CD8 immunoglobulin (BioXCell BP0117; clone YTS169.4) or control IgG2b (BioXCell BE0090; clone LTF-2) on day 10 post tumor injection (7 days post MI or sham) and then with 0.5 mg on day 15 and day 19, and sacrificed at day 20.
For bone marrow transplant studies, the CD45.1/CD45.2 congenic system was used. 8.5 million bone marrow cells from CD45.2+ mice 20 days following tumor cell engraftment (17 days post MI or sham) were retro-orbitally transferred into lethally irradiated (2 × 6 Gy, performed 3 hours apart) CD45.1 recipients. The percentage of circulating CD45.2+ monocytes was assessed at 14 weeks post transplantation. Irradiated recipient mice were kept on antibiotic-containing water for 4 weeks after irradiation. At 14 weeks, mice were injected with E0771 cancer cells as previously described, and tumor volume was measured for 26 days.
Echocardiographic Assessment
Transthoracic echocardiography was performed to evaluate the left ventricular structural and functional characteristics at baseline, prior to surgery and for 17 days following LAD ligation or sham surgery in tumor and non-tumor bearing mice using the Vevo 2100 imaging system (Fujifilm VisualSonics, Toronto, Canada). Mice were anesthetized with 2% isoflurane, and hair was removed from the chest using a depilatory cream (Nair, Church & Dwight Co. Inc.). Heart rate and body temperature was monitored. A heated platform and hair dryer were used to maintain the body temperature at 37°C throughout the procedure. Warmed ultrasound transmission gel was placed on the chest and used to obtain left ventricular endpoints of cardiac function. B-mode cardiac imaging was acquired on parasternal long and short axis view. The papillary muscles were used for the short axis imaging landmark. M-mode recordings of the left ventricle were also recorded at the short-axis view. Data analysis was performed on VevoLAB analysis software (Fujifilm VisualSonics) according to analysis guidelines. Diastolic and systolic LV area and volume, LV fractional shortening and ejection fraction were calculated from long axis view, while anterior and posterior wall thickness and corrected left ventricular mass were calculated from short axis view. Cardiac output was corrected for body weight (BW) measured on the same day and expressed as cardiac index (CI):CI (ml/min/g) = CO/BW.
Flow Cytometric Analysis
For flow cytometry analysis of tumor tissue and lung, a single cell suspension was generated. Briefly, tumors and lungs were extracted and finely minced, and then blended with the gentleMACS Dissociator (Miltenyi cat. 130-093-235) and digested with MACS Miltenyi tumor (Miltenyi Biotec cat. 130-096-730) or lung (Miltenyi Biotec cat. 130-095-927) Dissociation Kit for mouse according to manufacturer’s instructions. Single cell suspensions were washed with RPMI Medium 1640 and lysed with RBC Lysis Solution (BD Biosciences). Blood was collected through the inferior vena cava. A portion of blood (~30uL) was used for a mouse complete blood count using the Oxford Sciences Genesis™ autosampler, and the remainder was lysed with RBC lysis buffer (BD Biosciences). Bone marrow cells were isolated following published protocols34. All single cell suspensions were then incubated for 30 minutes with Fc block (BD Biosciences) (except bone marrow progenitors), incubated for 30 minutes with fixable live/dead stain (eFluor 780 - EBioscience cat. 65-0865-14, eFluor 506 - eBioscience cat. 65-0866-14, or DAPI), and then incubated with conjugated antibodies (1h). UltraComp eBeads (eBioscience) or ArC Amine Reactive Compensation Beads (Invitrogen) were used for compensation. A BD LSRII or Miltenyi MACsQuant was used for flow cytometry and the SY3200™ highly automated parallel sorting (HAPS) or MoFlo™ XDP cell sorter was used for cell sorting. FlowJo was used for all flow cytometry and FACS data analysis, and for generating representative flow plots. For immune cell gating, dead cells and debris were excluded from analyses using FSC × SSC and live/dead staining. CD45 (PerCpCy5.5 – Biolegend cat. 405314, Alexa-Flour 700 – Biolegend ct. 103127, APC - BD ct. 559864); was used as a marker for total leukocytes; CD11b (PE-Cy7 - Biolegend cat. 101215, BV650 – Biolegend cat. 101239) was used as a marker for myeloid cells. Mouse Ly6Chigh monocytes/mMDSCs were collected as CD45+CD11b+Ly6ChighLy6G– and neutrophils were gated as CD45+ CD11b+ Ly6Clow Ly6G+ (Ly6C: BV421 – BD ct. 562727; Ly6G: PE – BD ct. 551461). T cells were gated as CD45+CD3+ (CD3: APC-Cy7 – Biolegend ct. 100330, PerCP-Cy5.5 – Biolegend ct. 100218, PeCy7 – Biolegend ct. 10022, A700 – Biolegend ct. 100216) and then further gated according to positive CD4 (BV650 – Biolegend ct. 100555, PeCy7 – Biolegend ct. 100422) or CD8 (CD8a: FITC – eBioscience ct. 11-0081-82), status for helper and cytotoxic T cells respectively. CD8 cells were further gated for Granzyme B+ (Pacific Blue - Biolegend ct. 515408, APC – Biolegend ct: 372203) and CD4 cells were further gated for FoxP3+ (PE – eBioscience ct. 12-5773-80, BV421 – Biolegend ct. 126419) to determine activated cytotoxic cells and regulatory T cells, respectively. Further activation of CD8 T cells was determined gating IFNγ (PE - Biolegend ct. 505807), TNFα (PerCP-Cy5.5 - Biolegend ct. 506321) and proliferation by Ki67 (BV421 – Biolegend ct.652411) and Cell Trace Violet proliferation dye (Invitrogen, C34571). For MMTV-PyMT tumor immune cell identification, myeloid populations were gated according to previous reports specific to this model23 where tumor associated macrophages were gated as CD11blowMHCIIhigh, mammary-associated macrophages were gated as CD11bhighMHCIIhigh, granulocytic myeloid derived suppressor cells were gated as CD11bhighMHCII−Ly6CloLy6Ghi) and monocytic myeloid derived suppressor cell were gated as CD11bhighMHCII−Ly6ChiLy6Glo (MHCII : Alexa700 – Biolegend ct. 107622). Bone marrow progenitors were stained with lineage markers CD2, CD3e, CD4, CD8a, CD11b, CD19, CD45R (B220), Ly-6G/Ly-6C, TER-119 (FITC, eBioscience ct. 11-0021-82, 11-0031-82, 11-0041-82, 11-0081-82, 11-0112-82, 11-0193-82, 11-0452-82, 11-5931-82, 11-5921-82, respectively), cKit (APC-Cy7 – Biolegend ct. 105826), Sca1 (Pacific Blue – Biolegend ct. 108120), CD16/32 (PE - Biolegend ct. 101307) and CD34 (PerCP-Cy5.5 – Biolegend ct.128607). Flow cytometry analysis was reported as the absolute number of immune cells in monocyte transfer experiments (cells/gram of tumor). In all other analyses, cells were reported as a proportion (%) of total live cells, CD45+ immune cells, or CD3+ T cells, and thus this reflects the relative, and not absolute numbers of cells in these experiments.
mMDSC Suppression Assays
C57BL/6J mice were orthotopically implanted with E0771 tumors and subsequently underwent MI or sham surgery as outlined above. Tumors were harvested 20 days post- implantation and dissociated as described above. Subsequently mMDSCs (Gr-1dim, Ly-6G−) were isolated from the tumor suspension using magnetic-activated cell sorting (MACS) according to manufacturer’s instructions (Miltenyi Biotec, Cat: 130-094-538). To isolate CD8+ T cells from the spleens, spleens were manually passed through a 70μm filter and CD8+ T cells were isolated from the spleen suspension by MACS according to manufacturer’s instructions (Miltenyi Biotec cat: 130-104-075). mMDSCs and T cells were co-cultured in a ratio 1:4 (mMDSCs: T cells) for 60 hours at 37°C and 5% CO2 , and T cells were activated using recombinant murine CD28 (5μg/mL) and murine CD3 (1μg/mL). T cell-only cultures received similar treatment as the mMDSC: T cell co-cultures (positive control), or were collected on the same day as flow cytometric analysis (no stimulation) as a negative control. To assess T cell activation, following 60 hours of co-culture, T cells were collected and incubated with a Cell Activation Cocktail (Biolegend, 423303) for 4 hours. Flow cytometry was performed and the data was analyzed by primary gating for CD11b−, Ly6C−, CD8+ cells, and subsequently for GrB+, IFNγ+, TNFα+, and Ki67+ populations. To assess T cell proliferation, T cells were incubated prior to plating with Cell Trace Violet proliferation dye (Invitrogen, C34571, 1:1000) for 20 minutes at 37°C and 5% CO2. After incubation, T cells were plated and co-cultured as described above. After 60 hours of co-culture T cells were collected and flow cytometry was performed and the data analyzed by gating on CD11b−, Ly6C− CD8+ and proliferation dye+ cells populations. All samples were run on the LSRII HTS (BD Biosciences). All data was analyzed and plots were generated using FlowJo.
RNA Isolation and qPCR
Total RNA was isolated using TRIzol reagent (Invitrogen) and Direct-zol RNA MicroPrep columns (Zymo Research). RNA was reverse transcribed using iScript cDNA Synthesis Kit (Bio-Rad Laboratories), and quantitative PCR (qPCR) analysis was conducted using KAPA SYBR green Supermix (KAPA Biosystems) according to the manufacturer’s instructions and quantified on Quantstudio 3 (Applied Biosystems). Fold change in mRNA expression was calculated using the comparative cycle method (2−ΔΔCt) normalized to the housekeeping gene Gapdh. Primers used in this study are: Gapdh: [F: 5’-TGTGAGGGAGATGCTCAGTG-3’] and [R: 5’-TGTTCCTACCCCCAATGTGT-3’] and Pymt: [F: 5’-GAGTTCTCCAACAGATACACCC-3’] and [R: 5’-TCCCATGGACTCAGACCCGCC-3’].
RNA-Sequencing
RNA was isolated from CD45+CD11b+Ly6ChiLy6G– monocytic cells from the blood (pools of 3 mice), bone marrow (individual mice) and tumor (individual mice). For bone marrow and tumor monocytes, RNA was used to generate barcoded cDNA libraries using the NEBNext Ultra RNA library prep with rRNA depletion (New England Biolabs). Indexed libraries were sequenced in the 2×150 bp configuration on the Illumina HiSEQ platform. For blood monocytes, 1 ng of total RNA was used to prepare amplified cDNA using Ovation® RNA-Seq System V2 kit (Tecan Genomics, Inc.) following manufacturer’s instructions. This was followed by library preparation using Ovation® Ultralow Library System V2 library prep kit (NuGen/Tecan Genomics, Inc.). Briefly, first strand and second stand cDNA was synthesized from the input RNA, single primer isothermal amplification (SPIA) of the resultant cDNA was performed, then mechanical shearing of ds-cDNA (Covaris E220 ultrasonicator; Covaris Inc, MA), followed by end repair and A-tailing of sheared cDNA and subsequent construction of unique barcoded libraries by addition of adapters and PCR amplification (8 cycles). The Agencourt AMPure XP bead (Beckmann Coulter) purified libraries were quantified by qPCR and the size distribution was checked using Agilent TapeStation 2200 system. The libraries were subjected to paired-end 50 bp sequencing on HiSeq 2500 sequencing system (Illumina).
For all samples, paired-end reads were mapped to the mm10 genome assembly using STAR35 with default parameters, except that all best alignments were retained by using the –outSAMprimaryFlag AllBestScore flag. Following alignment, reads were counted per gene using the featureCounts tool36 and the gencode vM18 annotation. Gene counts were then normalized and analyzed for differential expression using the Bioconductor package DESeq237. Gene Ontology (GO) biological process and REACTOME pathway enrichment were calculated with GSEA software against the MSigDB database of gene signatures38. Ingenuity Pathway Analysis (Qiagen) was used for upstream regulator analysis. For comparison of the tumor mMDSC transcriptional signature in blood and bone marrow monocytes, Log2FC values for the top 1000 most differentially expressed genes in tumor CD11b+Ly6ChiLy6G– monocytes 17 days post-MI, as determined by adjusted p-value, were calculated for both CD11b+Ly6ChiLy6G– bone marrow monocytes 17 days post MI and CD11b+Ly6ChiLy6G– blood monocytes 9 days post MI, and classified as either up or down-regulated. To compare differential gene expression in bone marrow monocytes isolated from mice exposed to MI alone vs MI + tumor, we performed RNA-Seq on bone marrow monocytes from mice exposed to MI (n=6, 3 pools of 2 mice), sham (n=10, 5 pools of 2 mice), MI+tumor (n=5), and sham+tumor (n=6) 9–10 days following surgery. DESeq2 analysis was performed to identify genes that showed a differential response in the MI alone (log2FC versus sham) and MI+tumor (log2FC vs sham+tumor). We then focused on genes that showed a significant interaction term (p<0.05) and selected genes displaying no differential response in MI, but were up or downregulated in the MI+cancer setting. Differences in distribution based on expression values were calculated using the non-parametric Wilcoxon Rank Sum test (blood) or Student’s t-test (bone marrow). RNA-Seq data have been deposited in the Gene Expression Omnibus under accession number GSE137790.
ATAC-Sequencing
Chromatin profiling was performed by ATAC-Seq as described previously.39 Briefly, 30,000 to 75,000 bone marrow CD45+CD11b+Ly6ChiLy6G– monocytes (pools of 2 mice) were washed in cold PBS and lysed for 1 min in a centrifuge at 4°C. Transposition reaction (Illumina) was performed at 37°C for 30 min. After purification of the DNA with the MinElute PCR purification kit (Qiagen), material was amplified for 5 cycles. Additional PCR cycles were evaluated by real time PCR. Final product was cleaned with the MinElute PCR purification kit. Libraries were individually checked with the Kapa-Roche quantification kit and size was verified on tapestation high sensitivity screentape. Normalized libraries were sequenced on the Hiseq 2500 in 1 lane of paired end 50 basepair run, using the TruSeq SBS Kit v3 (Illumina).
Per-read per-sample FASTQ files were generated using the bcl2fastq Conversion software (v2.20) to convert per-cycle BCL base call files outputted by the sequencing instrument into the FASTQ format. The alignment program, Bowtie2 (v2.3.4.1), was used for mapping sequenced reads from the mouse samples to the mouse reference genome mm10 and the application Sambamba (v0.6.7) was utilized to remove duplicate reads. The algorithm, MACS (in Python v2.7.3), was used to call peaks of signal for annotated genomic features and, similarly, the Python package NucleoATAC was functioned to call nucleosome positions. The computeMatrix and plotProfile tools in the deepTools suite (v2.3.3) were utilized for generation of signal profile plots. For the differential peak statistical comparisons between groups of samples with varying experimental conditions, the DiffBind package (Bioconductor v3.3.0) in the R statistical programming environment was used. Additionally, motif enrichment analysis was performed to identify regulatory elements using the HOMER software (v4.10). Pathway enrichment of ATAC peaks was generated using the Genomic Regions Enrichment of Annotations Tool (GREAT), using the entire genome as a background set40. Integrative Genomics Viewer (v.2.5.2) was used to visualize individual RNA-seq and ATAC-seq tracks, summed across replicates. ATAC-Seq data have been deposited in the Gene Expression Omnibus under accession number GSE137790.
Nanostring Immune Profiling
Whole tumor samples were preserved in RNA later, and subsequently isolated using Trizol as described previously41. NanoString gene expression profiling was conducted using the mouse nCounter PanCancer Immune Profiling Panel (NanoString Technologies, Seattle, WA, USA) per manufacturer’s instructions42, which contains probes specific to 750 endogenous genes and 20 housekeeping genes. Raw data were processed and normalized with NanoString’s nSolver Analysis Software using the Advanced Analysis module, and differential gene expression, GSVA scores for cell types and immune response categories were generated in the R Statistical Environment using gene signatures provided by the NanoString panel.
Immunofluorescence and Image Analysis
Five-micron sections of paraffin embedded tissue were stained with Akoya Biosciences® Opal™ multiplex automation kit reagents. Automated staining was performed on Leica BondRX® autostainer. Ki67 and CD45 staining was performed according to manufacturers’ instructions with anti-Ki67 SP6 antibody (Abcam ab16667; 1:200 dilution) and anti-CD45 (Abcam ab25386, 1:200 dilution). Briefly, all slides underwent sequential epitope retrieval with Leica Biosystems epitope retrieval 1 solution (EDTA based, pH 9, cat# AR9640), primary and secondary antibody incubation and tyramide signal amplification (TSA) with Opal® fluorophores. Primary and secondary antibodies were removed during epitope retrieval steps while fluorophores remain covalently attached to the epitope. Semi-automated image acquisition was performed on a Vectra® 3.0 multispectral imaging system. After whole slide scanning at 10X the tissue was manually outlined to select fields for multispectral imaging at 20X. InForm® version 2.4.2 software from Akoya Biosciences was used for spectral unmixing and image analysis. Cells were segmented based on nuclear signal (DAPI). Cells were phenotyped after segmentation using inForm’s proprietary trainable algorithm. All cells recognized by nuclear stain were divided into two phenotypic categories: “CD45+”, “CD45-”. Phenotypes were reviewed for different samples during training iterations. Data was exported as text containing sample names, field of acquisition, individual cell information including coordinates and normalized mean signal intensity for Ki67 which was used to determine positivity or negativity. In parallel, manual annotation of the tumor border of each image was performed in ImageJ/Fiji and exported as a region of interest (ROI) as described43. Distance calculations from each phenotyped cell to the tumor edge were performed using a combination of Python and R scripts. Briefly, cell coordinates obtained in InForm® and ROIs manually annotated in ImageJ/Fiji were read in Python and distance from each cell centroid to the edge of the tumor border was calculated using the Shapely package [v 1.6, Sean Gillies https://github.com/Toblerity/Shapely]. Data wrangling and filtering distances to ≤200 μm were performed in RStudio software [RStudio Team (2015). RStudio: Integrated Development for R. RStudio, Inc., Boston, MA URL http://www.rstudio.com/].
Patient Study Overview
Women with histologically confirmed early breast cancer (AJCC stage I with tumor size ≥ 1 cm, stage II or stage IIIA) were selected from two population-based, prospective cohort studies, the Life After Cancer Epidemiology (LACE) study26 and Pathways27. In brief, major eligibility criteria for LACE were: (i) primary diagnosis of invasive breast cancer from 1996 to 2000, (ii) 24 to 79 years old at diagnosis, (iii) completion of primary adjuvant therapy, and (iv) no evidence of recurrence or progressive disease at study entry. Major eligibility criteria for Pathways included: (i) primary diagnosis of stage I-III breast cancer from 2005 to 2008 and (ii) ≥24 years of age at diagnosis. Major exclusion criteria for both studies were bilateral disease and neoadjuvant therapy. LACE and Pathways protocols were reviewed and approved by the human subjects committee at Kaiser Permanente Northern California (KPNC; LACE and Pathways) and University of Utah (LACE only), and informed consent was obtained before study participation. Both cohorts were followed through June 2018, and censored at the event date (recurrence), or date of last contact. Recurrence data were ascertained via self-report as well as computerized algorithm of KPNC electronic medical record review on a monthly basis among participants at least 6 months after initial primary diagnosis. All outcomes were verified by medical record review.
A cardiovascular event was identified by International Classification of Diseases - Ninth (ICD-9), and Tenth Revision (ICD-10) for myocardial infarction (ICD-9 [410] and ICD-10 [I21-I22]), coronary artery disease (ICD-9 [411, 413–414] and ICD-10 [I20, I24-I25]), stroke (ICD9 [430–437] and ICD10 [G45, I60-I63, I65-I67]), heart failure (ICD9 [425, 428–429] and ICD10 [I23, I42-I43, I50-I51]), arrhythmia (ICD9 [426–427] and ICD10 [I44-I49]). Cardiovascular risk factor identification at diagnosis included hyperlipidemia (ICD-9 [272] and ICD-10 [E75, E78, E88]), hypertension (ICD-9 [401–405] and ICD-10 [I10-I13, I15-I16]) and diabetes (ICD-9 [250] and ICD-10 [E10-E11, E13]). Exclusion criteria included history of a cardiovascular event or cardiovascular risk factors at diagnosis.
Statistical Analysis
For analysis of human data, traditional Cox proportional hazards regression models were used to estimate the HRs and 95% confidence intervals (CI) for the association between a CVD event and breast cancer recurrence and breast cancer-specific mortality, adjusted for covariates. Covariates were ascertained at the time of diagnosis via questionnaire, medical chart review, and tumor registry and were as follows: age, race, smoking status, body mass index at diagnosis date, tumor stage and adjuvant therapy (chemotherapy, radiation, endocrine, AI or Tamoxifen use). Statistical analyses were conducted using SAS Version 9.4 (SAS Institute, Inc.) and R Version 2.14.2 and Stata Version 10.1 (StataCorp). A significance probability less than 0.05 was considered statistically significant for all tests.
For analysis of mouse experiments, GraphPad Prism 8 was used. Data are presented as mean ± standard error (s.e.m.) unless otherwise indicated, and P ≤ 0.05 was considered as statistically significant. For all quantitative data, the statistical test used is indicated in the text. Briefly, Gaussian distribution was first determined using the Shapiro-Wilk normality test. Data that were determined to be Gaussian were analyzed by a two-tailed unpaired Student’s t-test (2 groups), or one-way ANOVA (>2 groups) or two-way ANOVA (for time and treatment comparisons) with a Bonferroni’s multiple comparisons test. Data that were determined to be non-parametric were analyzed by a Mann–Whitney U-test (2 groups).
Reporting summary
Further information on research design is available in the Nature Research Life Sciences Reporting Summary linked to this paper.
Extended Data
Extended Data Fig. 1. Cardiac function is not altered by the presence of cancer following surgical MI.
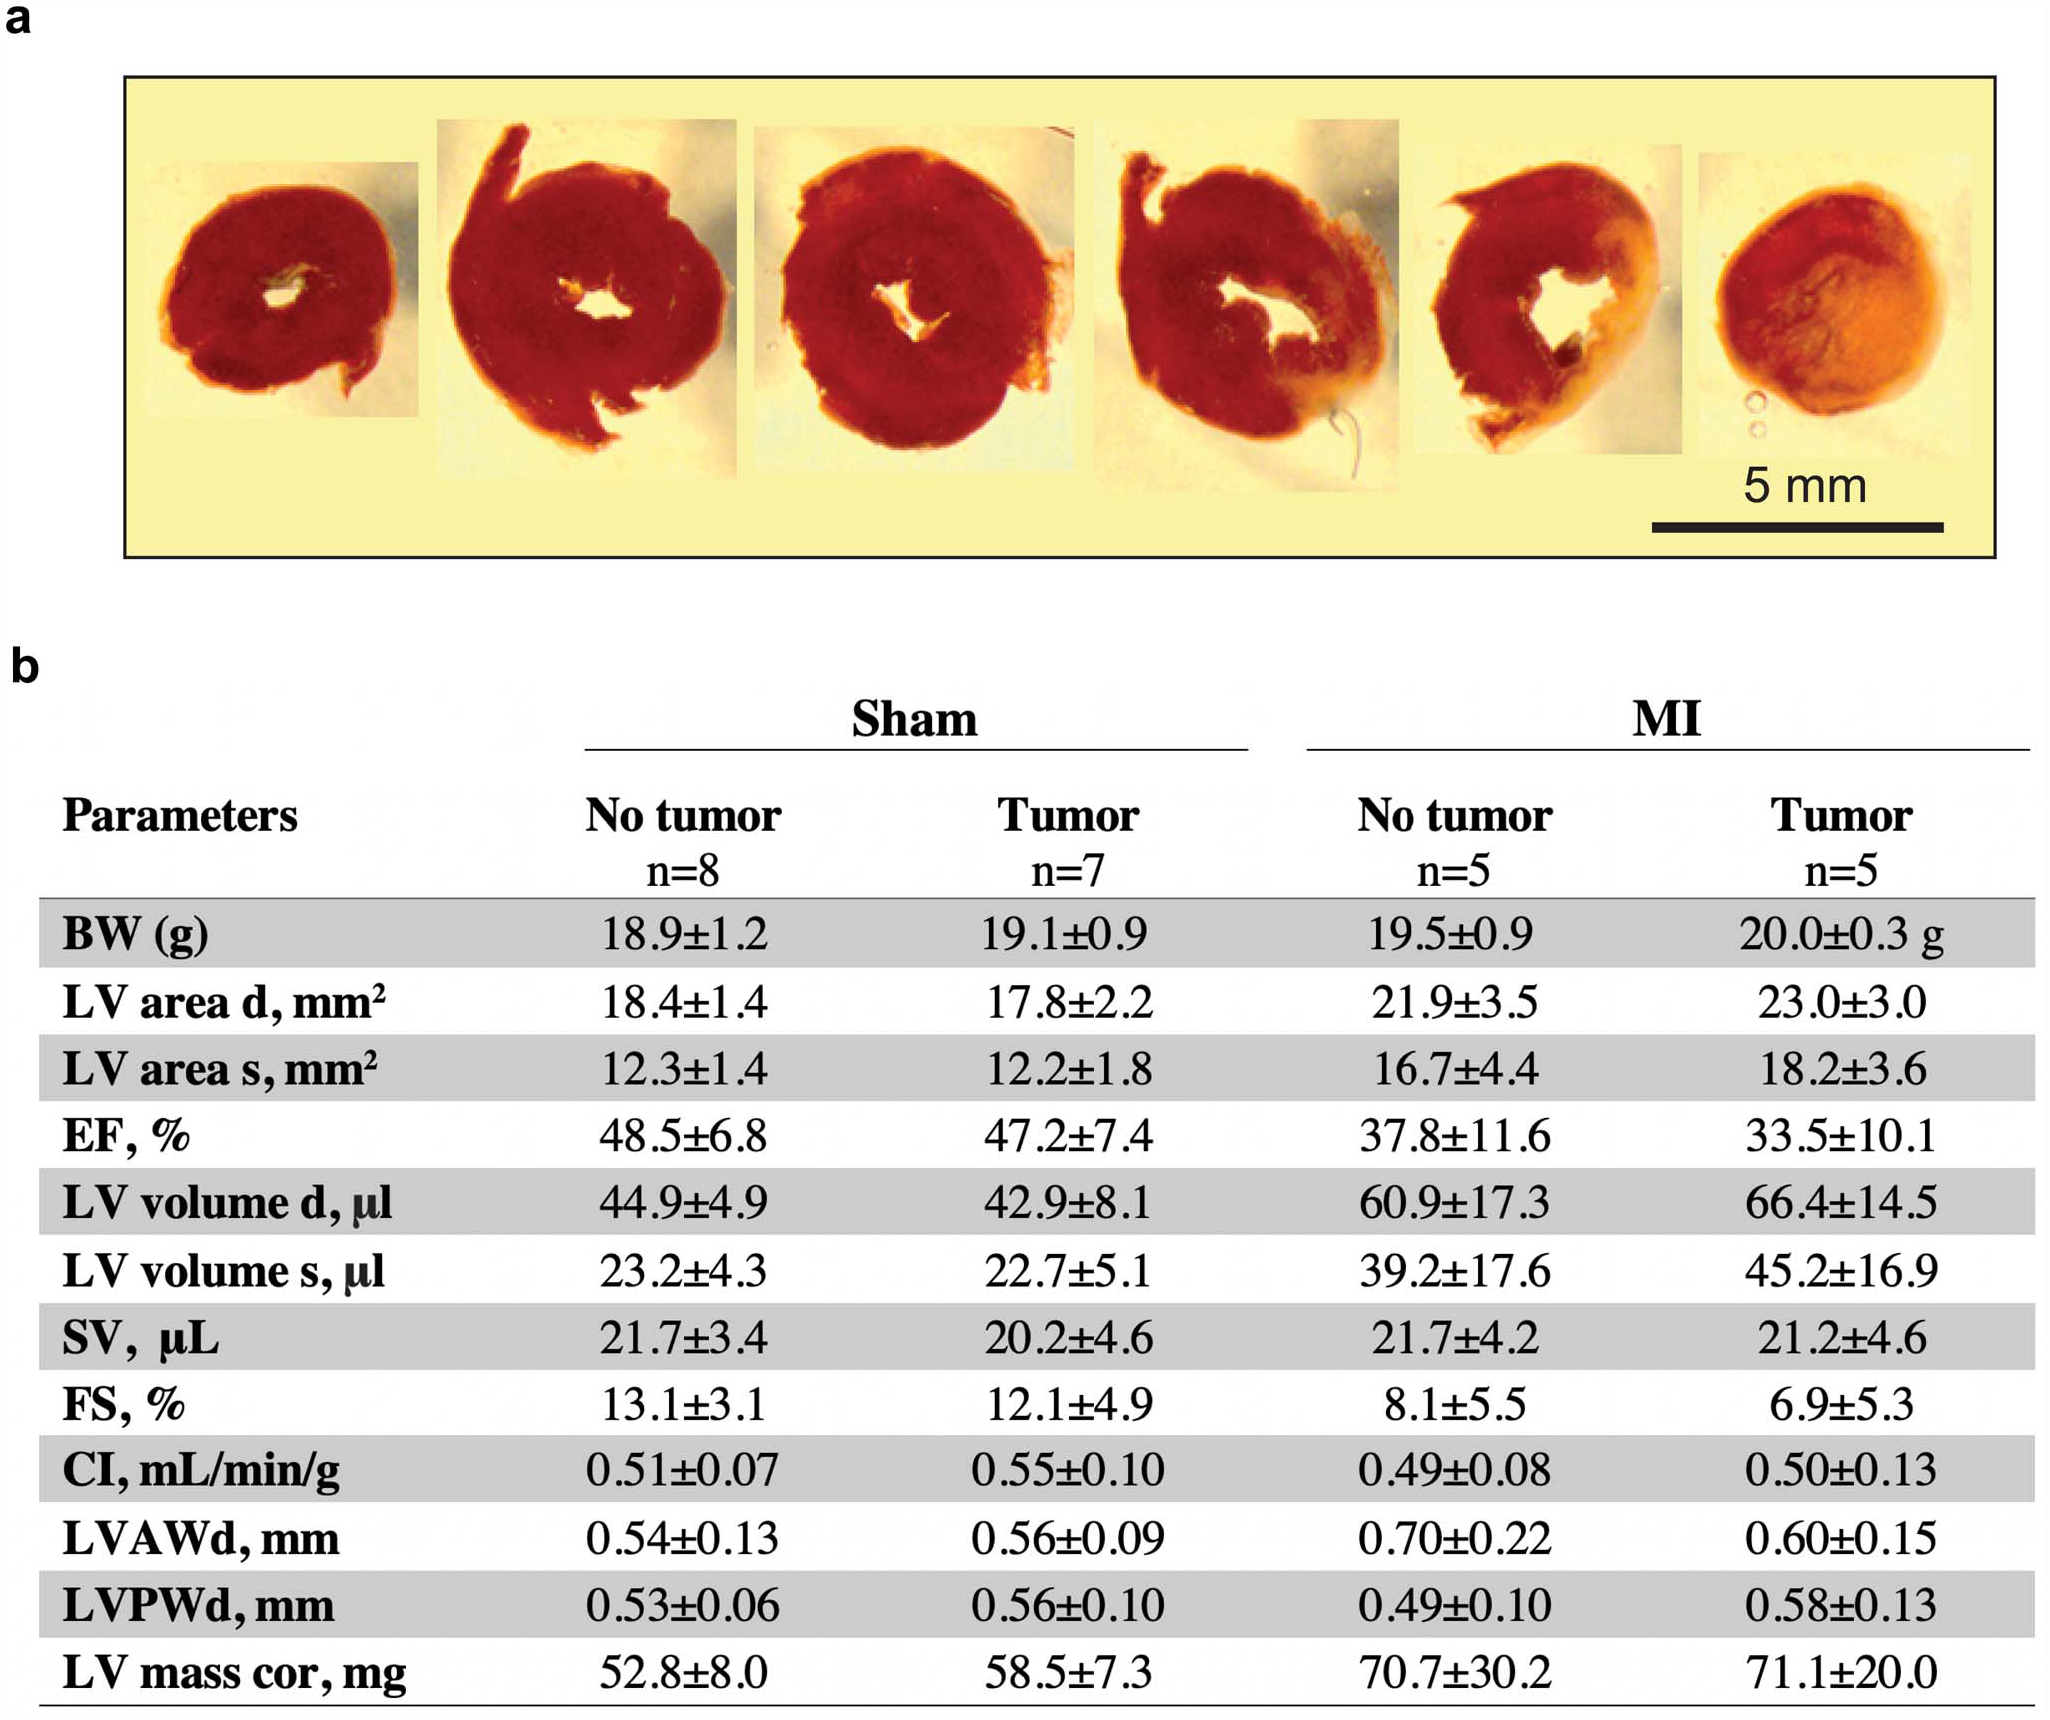
(a) Representative triphenyl-tetrazolium chloride (TTC) staining to confirm surgical myocardial infarction through ligation of the left anterior descending coronary artery. (b) Echocardiography examination 16 days following MI or sham surgery (19 days post tumor implantation). Values are mean ± SD. BW Body weight, LV area d, left ventricular area at diastole; LV area s, left ventricular area at systole; EF, ejection fraction; LV volume d, left ventricular volume at diastole; LV volume s, left ventricular volume at systole; SV, stroke volume; FS, longitudinal fractional shortening; CI, cardiac index; LVAWd, left ventricular anterior wall thickness at diastole; LVPWd, left ventricular posterior wall thickness at diastole; LV mass cor, left ventricular mass corrected. P values in data determined as non-parametric were analyzed by a two-tailed Mann–Whitney test, while data determined to be parametric were analyzed by a two-tailed unpaired Student’s t-test; *P ≤ 0.05, **P ≤ 0.01, ***P ≤ 0.001 for sham (no tumor vs tumor) and MI (no tumor vs tumor) comparisons only.
Extended Data Fig. 2. Proliferation of immune (CD45+) and non-immune (CD45-) cells in tumors of mice following MI or sham surgery.
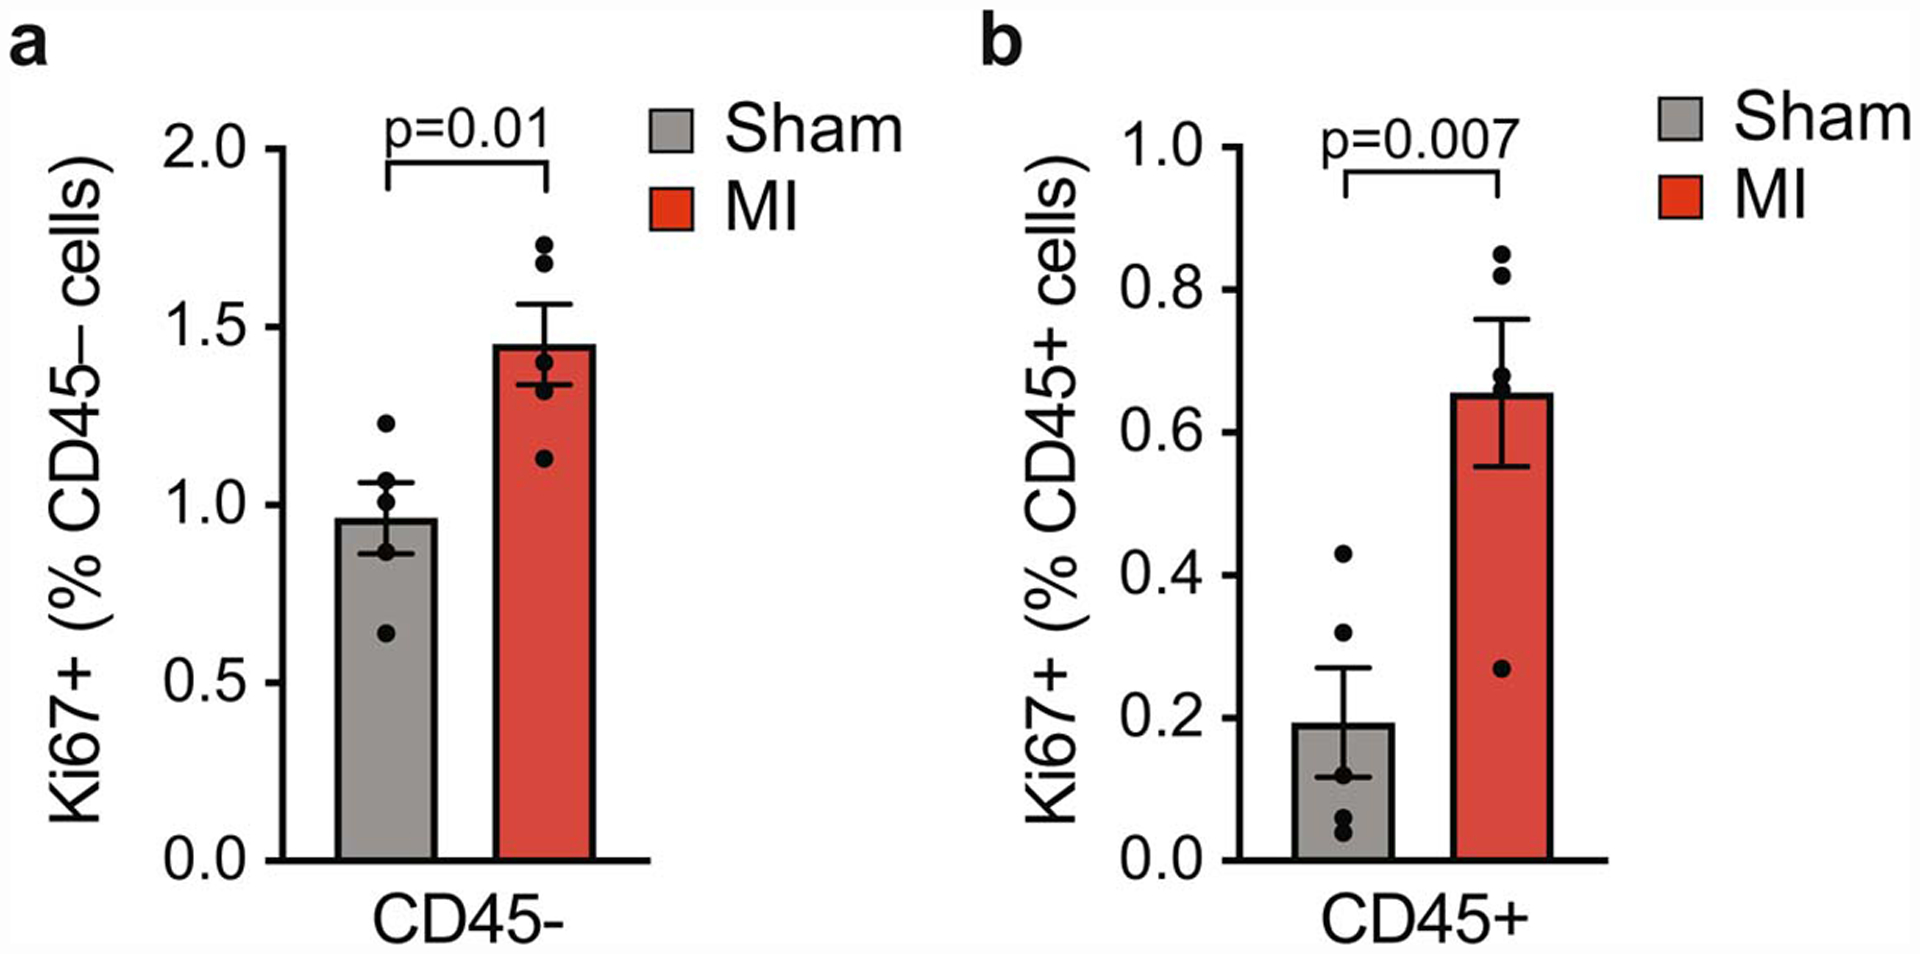
Quantification of Ki67 and CD45 co-staining of tumors to detect proliferating CD45- (a) and CD45+ (b) cells in the tumor border (n=5/group). Data are the mean ± s.e.m and P values determined using a two-tailed unpaired Student’s t-test.
Extended Data Fig. 3. Flow cytometric analysis of intratumoral immune cells following MI or sham surgery.
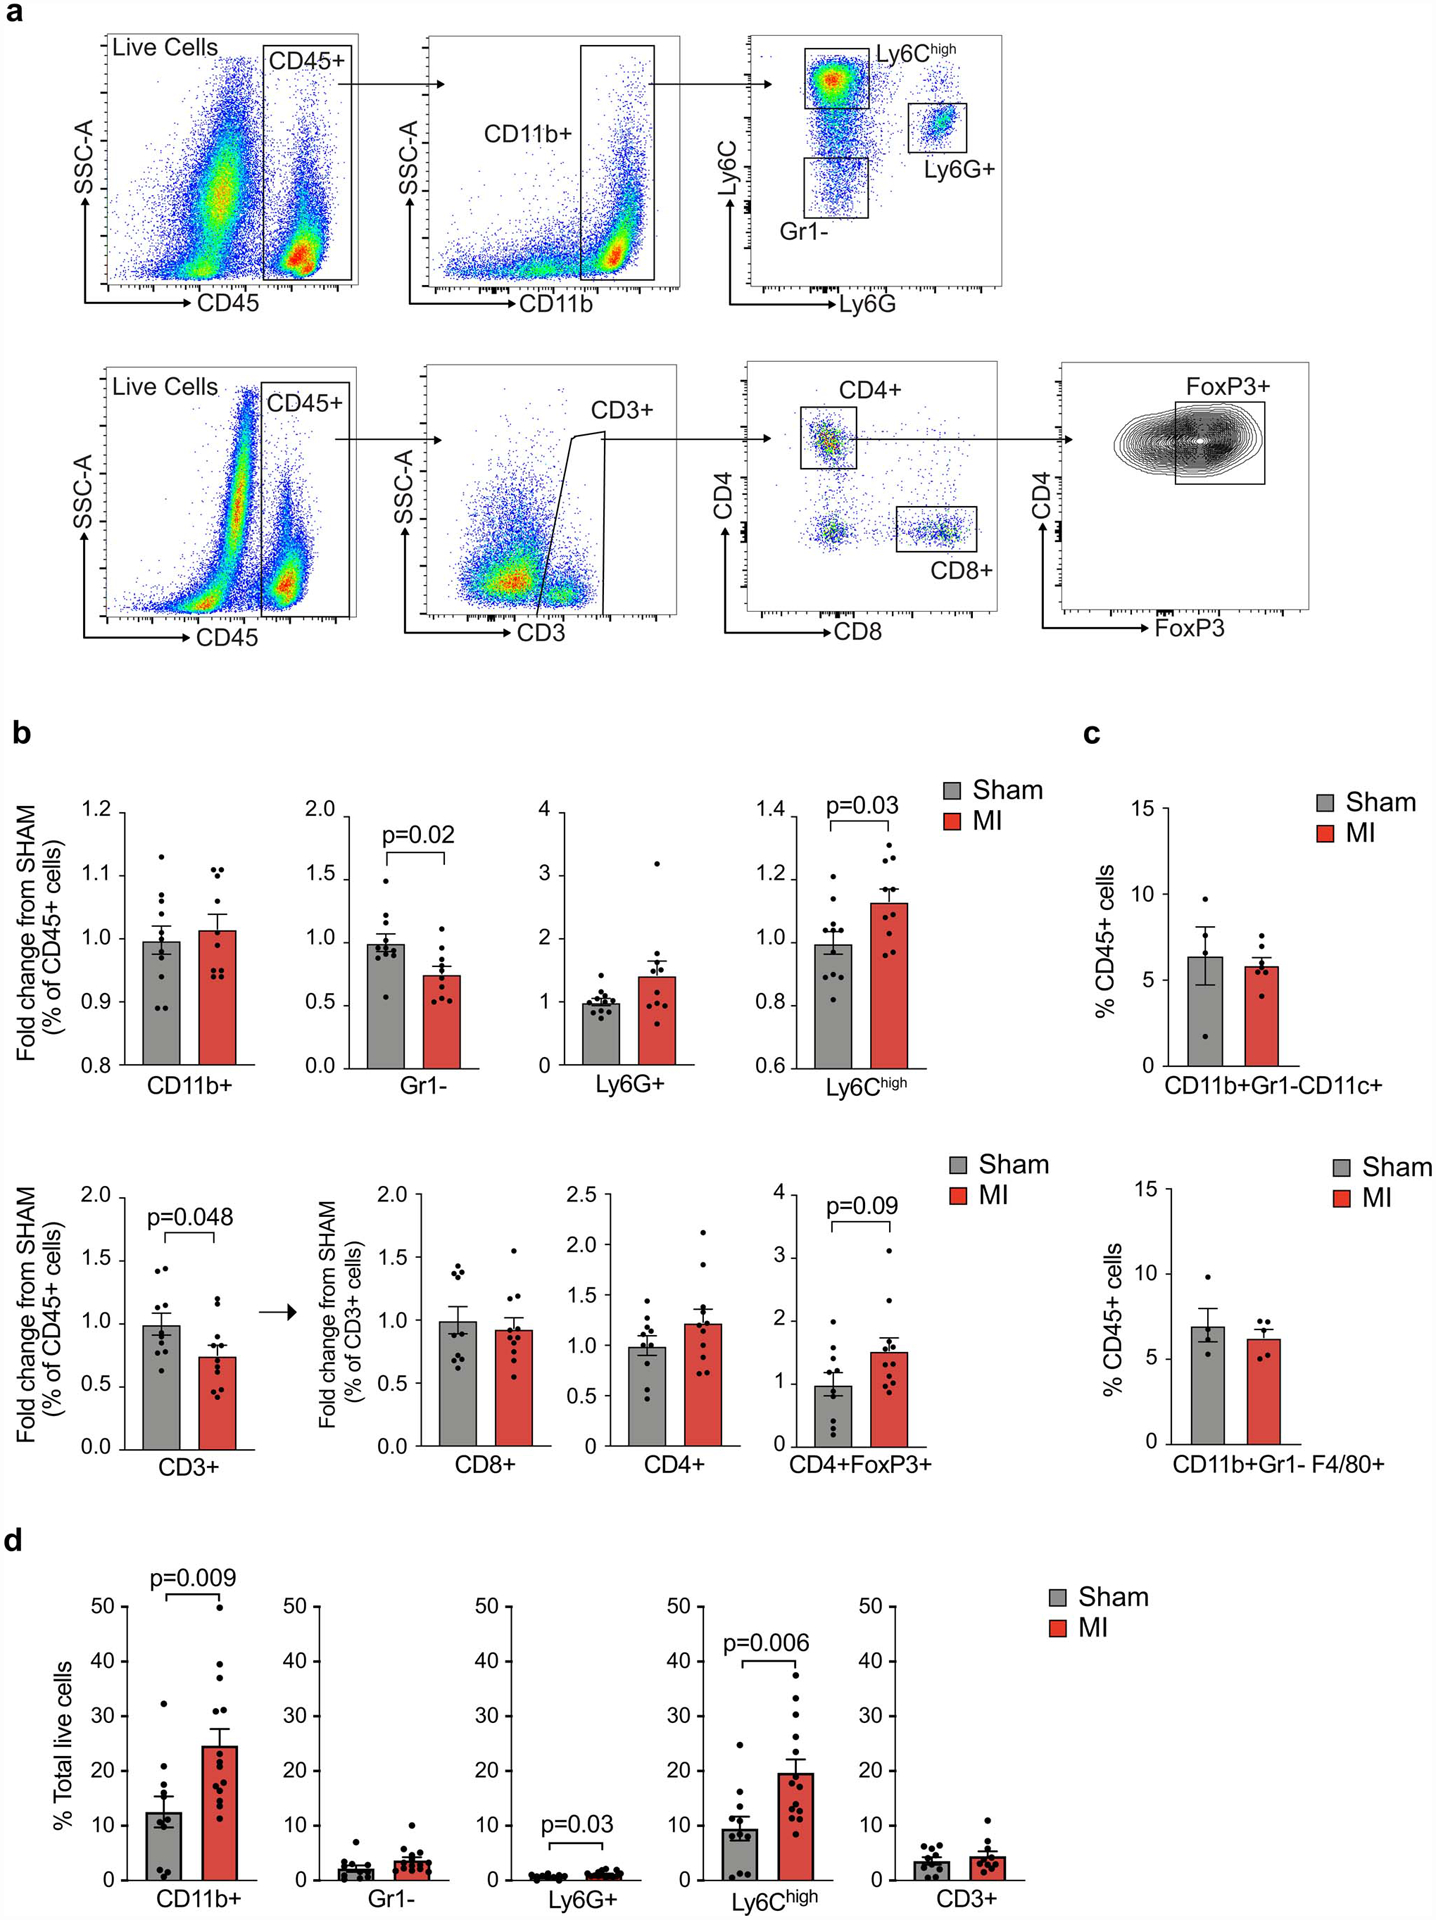
(a) Flow cytometry gating strategy for myeloid (top) and lymphoid (bottom) cells in E0771 tumors. (b) Flow cytometric analysis showing the relative fold change in immune cell proportions in tumors from mice exposed to MI (n=11, red) vs sham (n=10, grey) surgery (day 20); two independent experiments were conducted. All populations were gated based on live/dead stain and CD45+. (c) Flow cytometric analysis of CD11b+Gr1-Cd11c+ dendritic cell-like and CD11b+Gr1+F4/80+ macrophage-like cells in E0771 tumors from mice exposed to MI (n=5) or sham (n=4) surgery. (d) Flow cytometric analysis of tumor immune cells (% total live cells) at day 20 to identify CD3+ T cells (n=11 MI, 10 sham) and CD11b+ myeloid (n=14 MI, 11 sham) subsets: CD11b+Ly6G+, neutrophils; CD11b+Gr1–, macrophage-like cells; CD11b+Ly6Chi, monocytes; Data are the mean ± s.e.m and P values in data were analyzed by a two-tailed Mann–Whitney test (b [FoxP3+ cells], or a two-tailed unpaired Student’s t-test (b,c,d).
Extended Data Fig. 4. Circulating leukocytes and bone marrow progenitors in tumor bearing mice following MI or sham surgery.
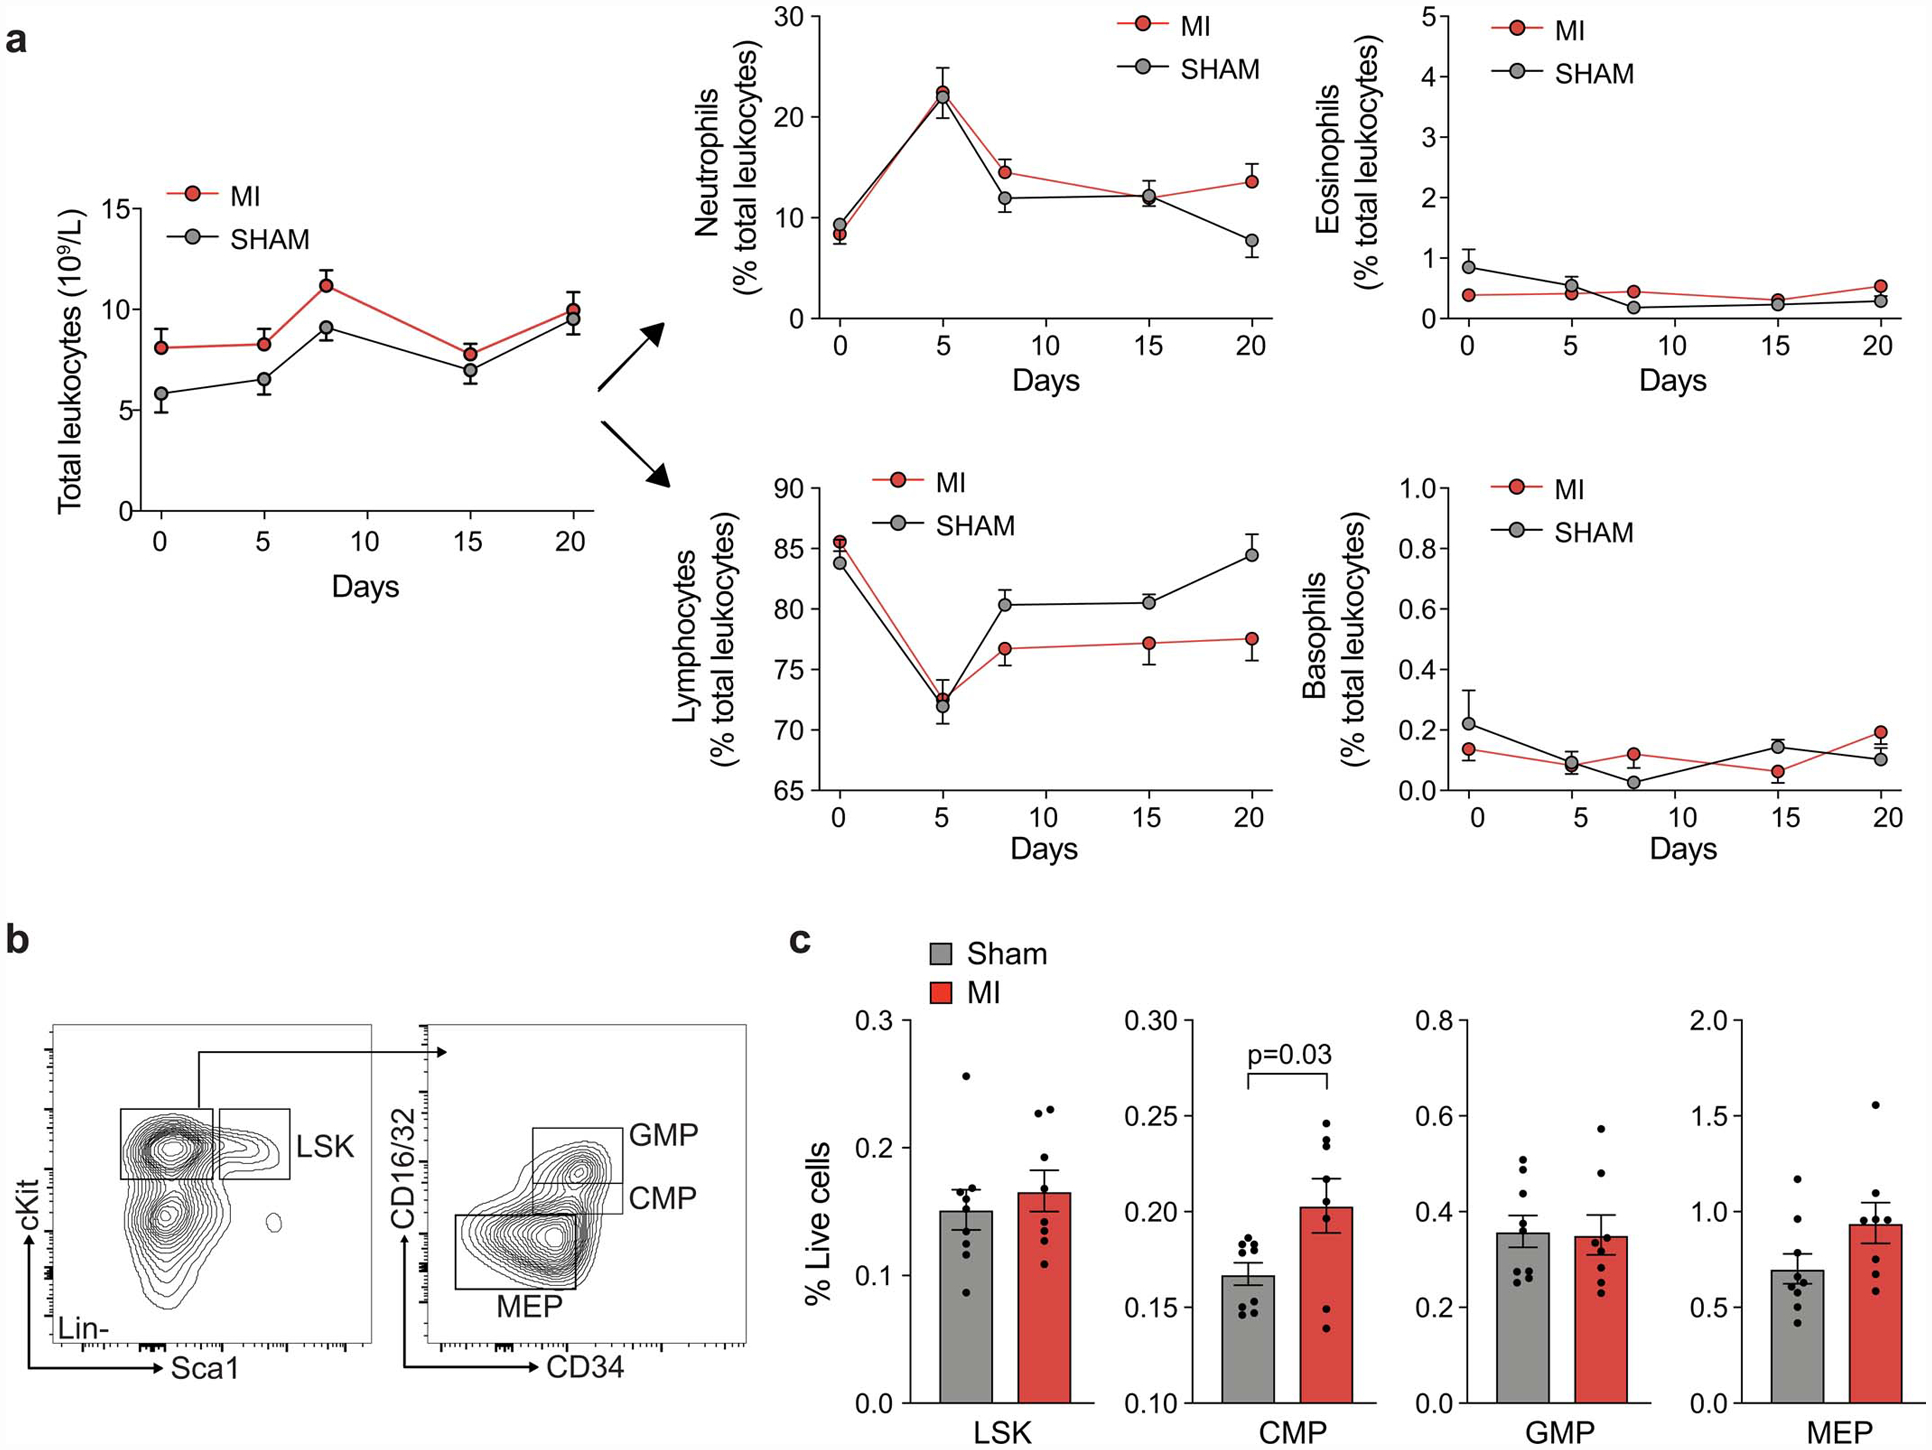
(a) Numbers of circulating leukocytes and relative proportion of neutrophils, eosinophils, lymphocytes and basophils in E0771 tumor bearing mice after MI (n=8) or sham (n=8) surgery. (b,c) Flow cytometric analysis of bone marrow hematopoietic and stem cell populations in E0771 tumor bearing mice 9 days post-MI or sham surgery (12 days post-tumor cell implantation). LSK: Lineage–Sca1–cKit+ cells; CMP: common myeloid progenitor; GMP: granulocytic myeloid progenitor; MEP: megakaryocyte–erythroid progenitor. (a-c) two independent experiments were conducted. Data are the mean ± s.e.m. P values were calculated using a two-way analysis of variance (ANOVA), with results not significant (p>0.05) (a), or a two-tailed unpaired Student’s t-test (c).
Extended Data Fig. 5. Monocyte adoptive transfer experiments into tumor bearing mice; RNA-seq analyses of tumor and bone marrow monocytes in mice exposed to MI or sham surgery.
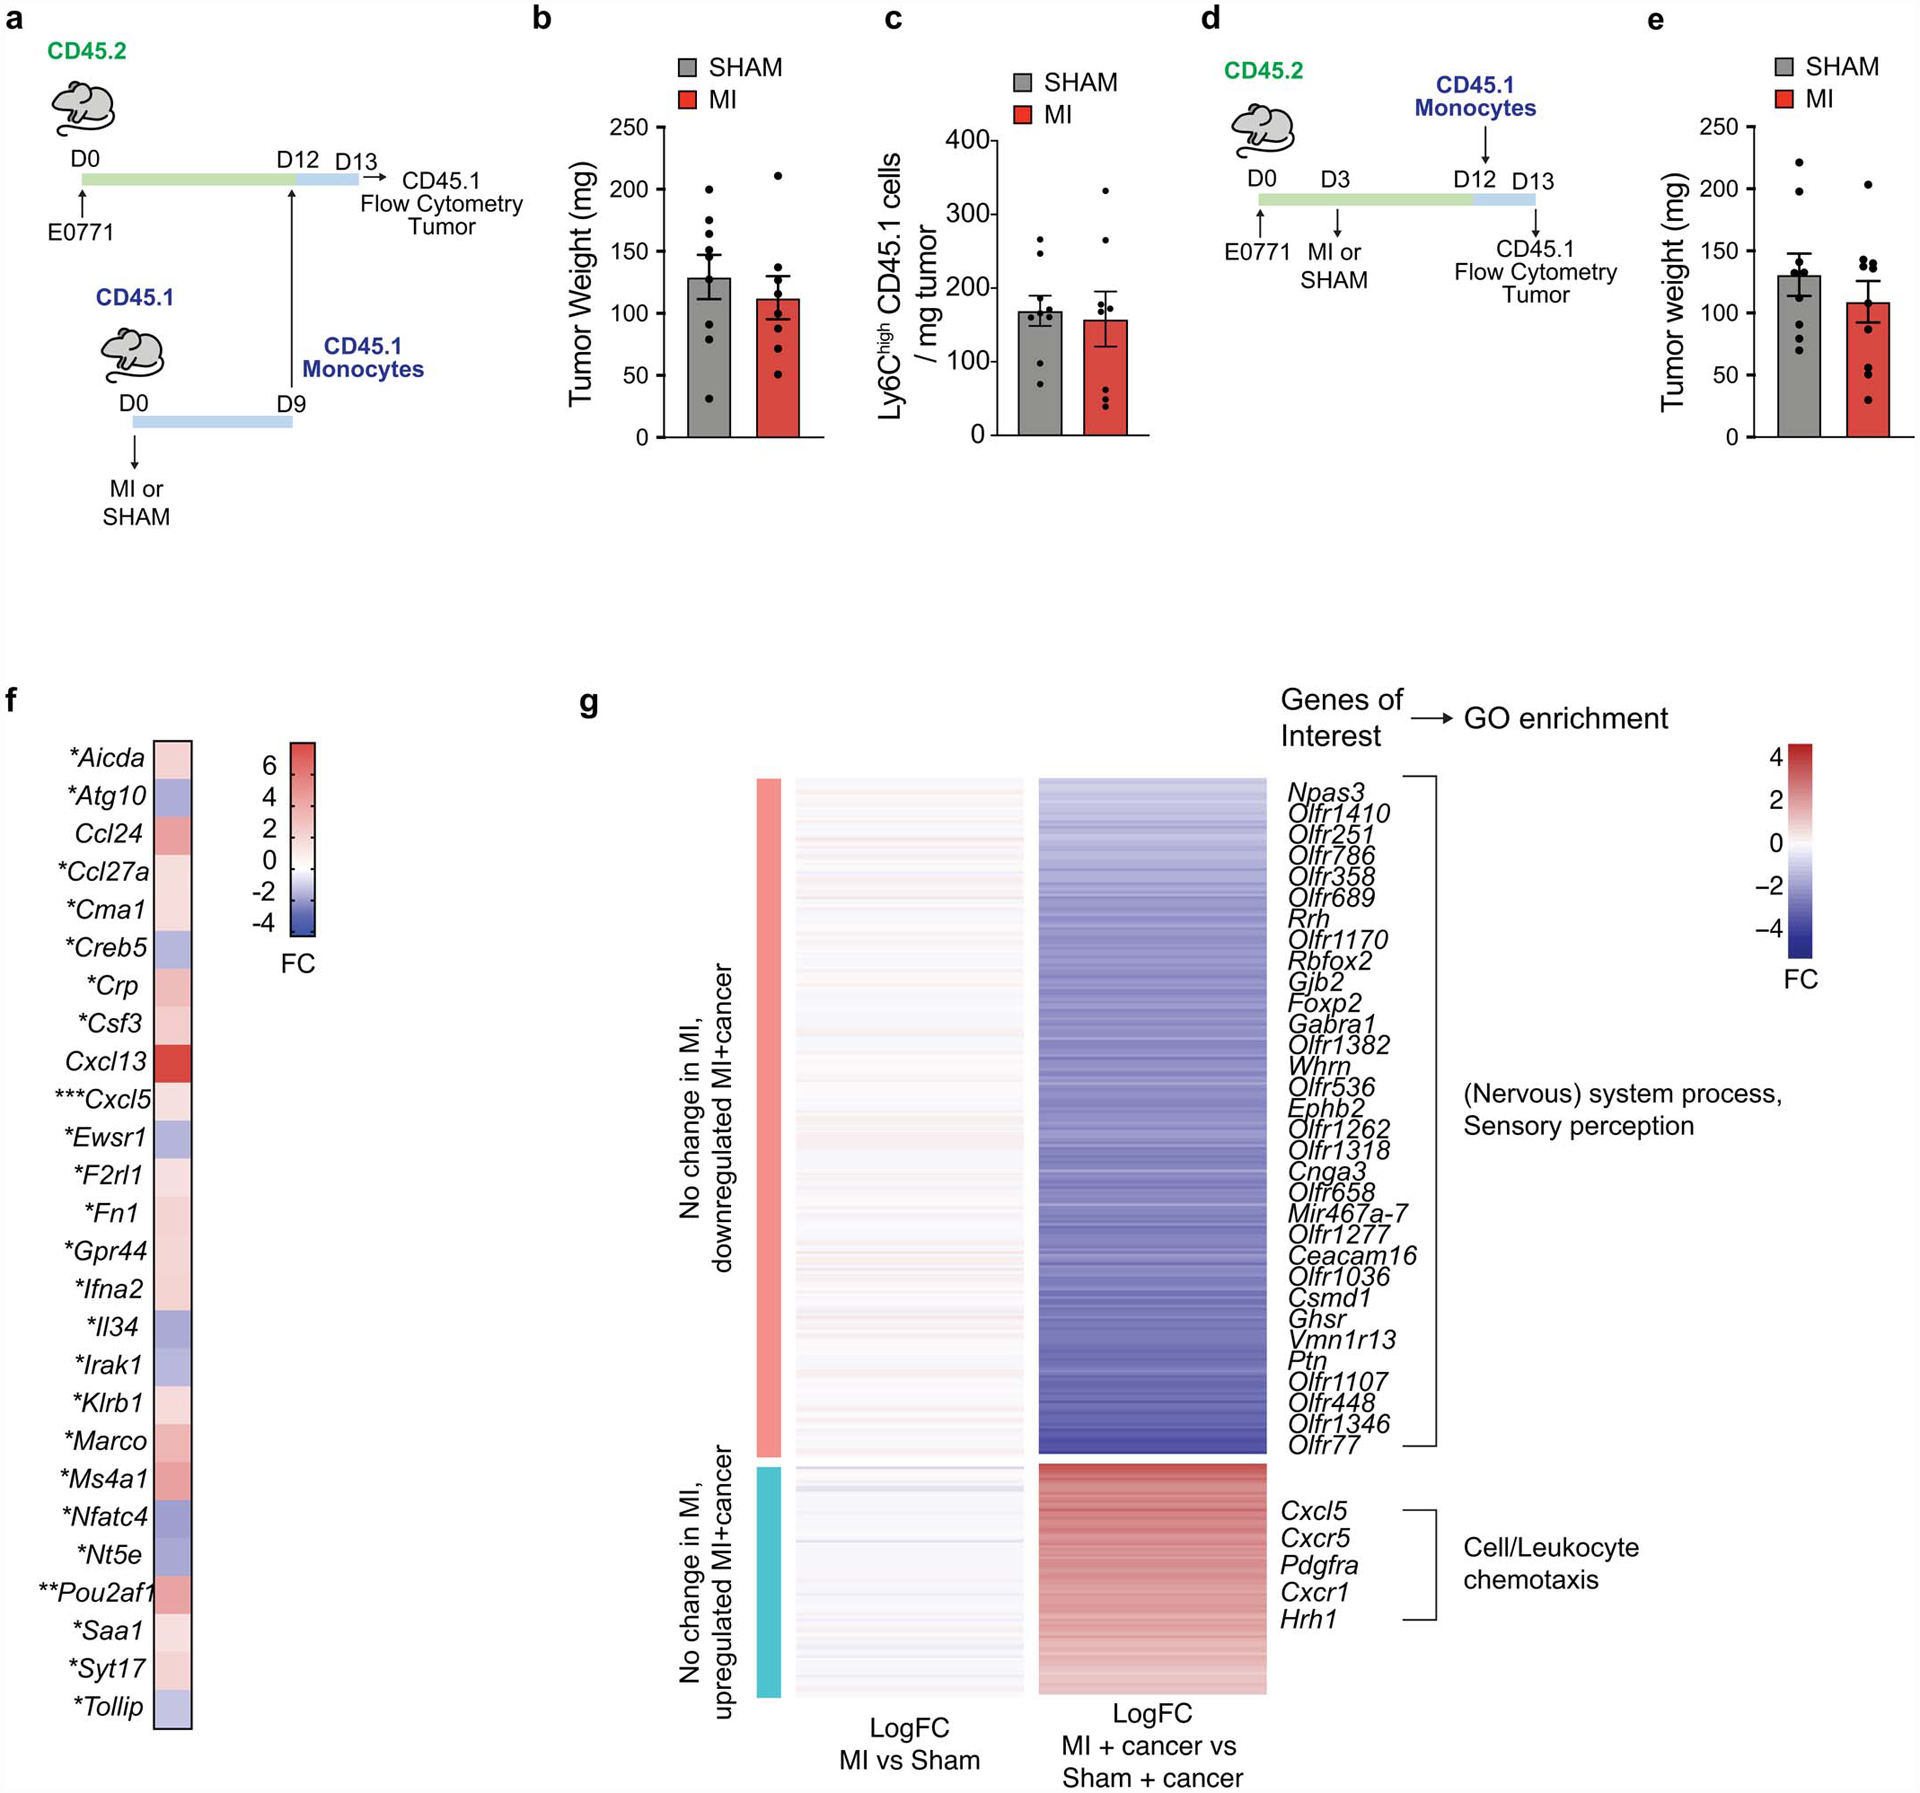
(a-c) Monocytes were adoptively transferred from CD45.1 mice 9 days after exposure to MI or sham surgery into E0771 tumor bearing CD45.2 mice (a), and tumor weight (b), and CD45.1 Ly6Chigh monocytes recruited to the tumor (c) were determined 16 h later (n=9 sham; n=8 MI). (d-e) Monocytes were adoptively transferred from CD45.1 mice into E0771 tumor-bearing CD45.2 mice 9 days following MI or sham surgery (d), and tumor weight was determined 16 h later (n=9 sham; n=10 MI) (e). (f) Fold change (FC) in gene expression in E0771 tumors from mice 8 days post-MI compared to sham surgery (n=3 per group). (g) Heatmap of genes significantly up- or down-regulated (p<0.05, two-sided Wald test) in bone marrow monocytes 9–10 days after MI vs sham treatment specifically in tumor bearing mice. MI (n=6, 3 pools of 2 mice), sham (n=10, 5 pools of 2 mice), MI+tumor (n=5), or sham+tumor (n=6). (a-e) two independent experiments were conducted. Data are the mean ± S.D. and P values were analyzed by two-tailed unpaired Student’s t-test (b, c, e, f), with comparisons not significant unless indicated. *P ≤ 0.05, **P ≤ 0.01, ***P ≤ 0.001.
Extended Data Fig. 6. CCR2 inhibition mitigates MI-induced accelerated tumor growth.
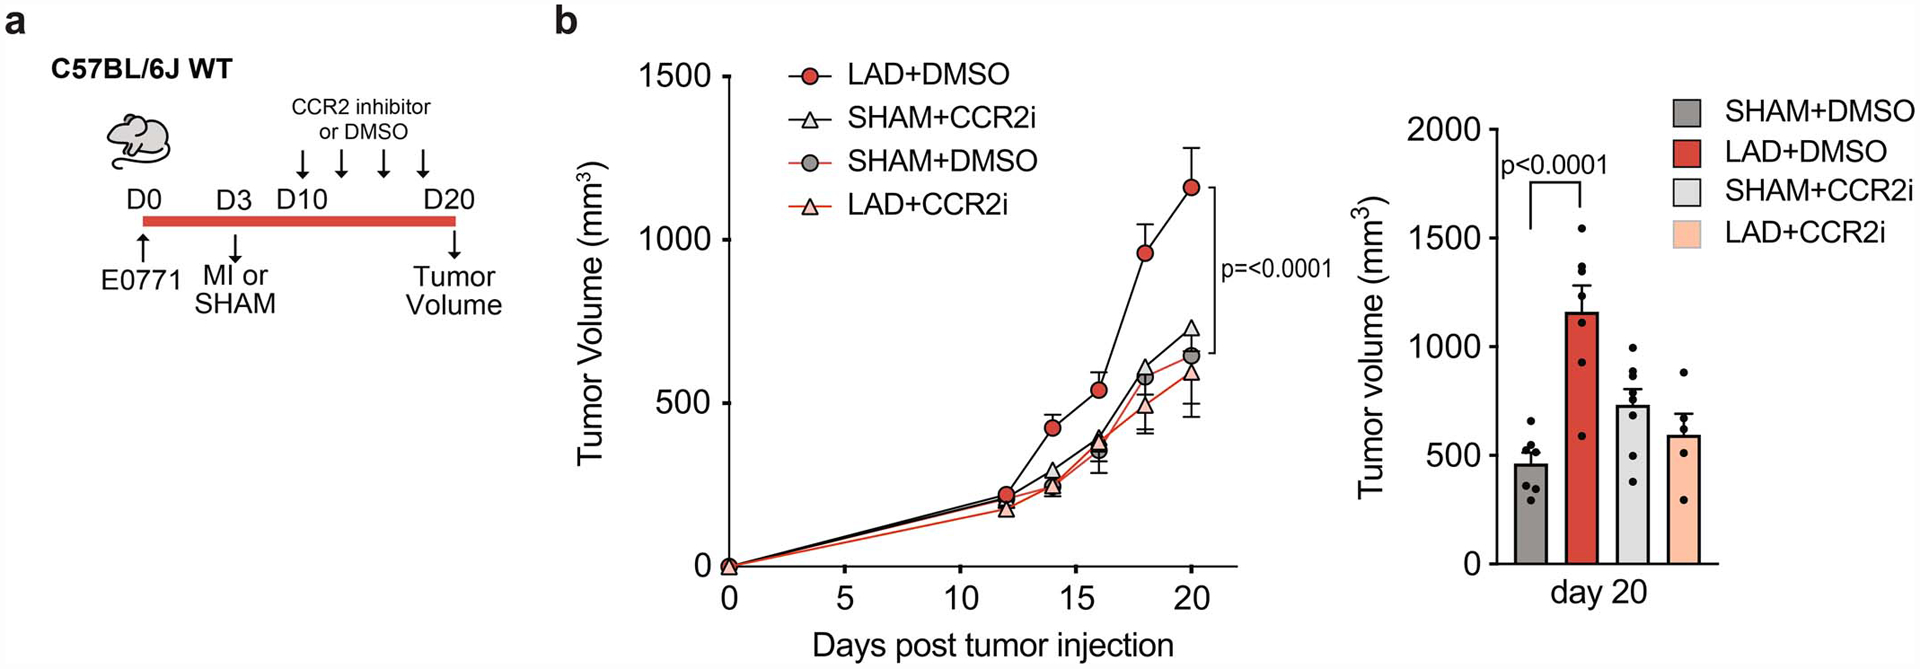
(a) Outline of CCR2 inhibition study in mice implanted with E0771 tumor cells and exposed to MI or sham surgery. CCR2 inhibitor (CCR2i) was administered starting at 7 days after MI or sham surgery. (b) Tumor volume over the course of the study (left) and at sacrifice (day 20 day) (right) in mice exposed to MI (n=5 CCR2 inhibitor, n=7 DMSO control) or sham surgery (n=8 CCR2 inhibitor, n=7 DMSO control). Two independent experiments were conducted (a-c). P values were calculated using a repeated measures analysis of variance (ANOVA) with Bonferroni’s multiple comparisons test (b) or one way ANOVA (c).
Extended Data Fig. 7. Monocytic myeloid-derived suppressor cells isolated from tumors of mice exposed to MI or sham surgery do not alter the proliferation of T cells in vitro.
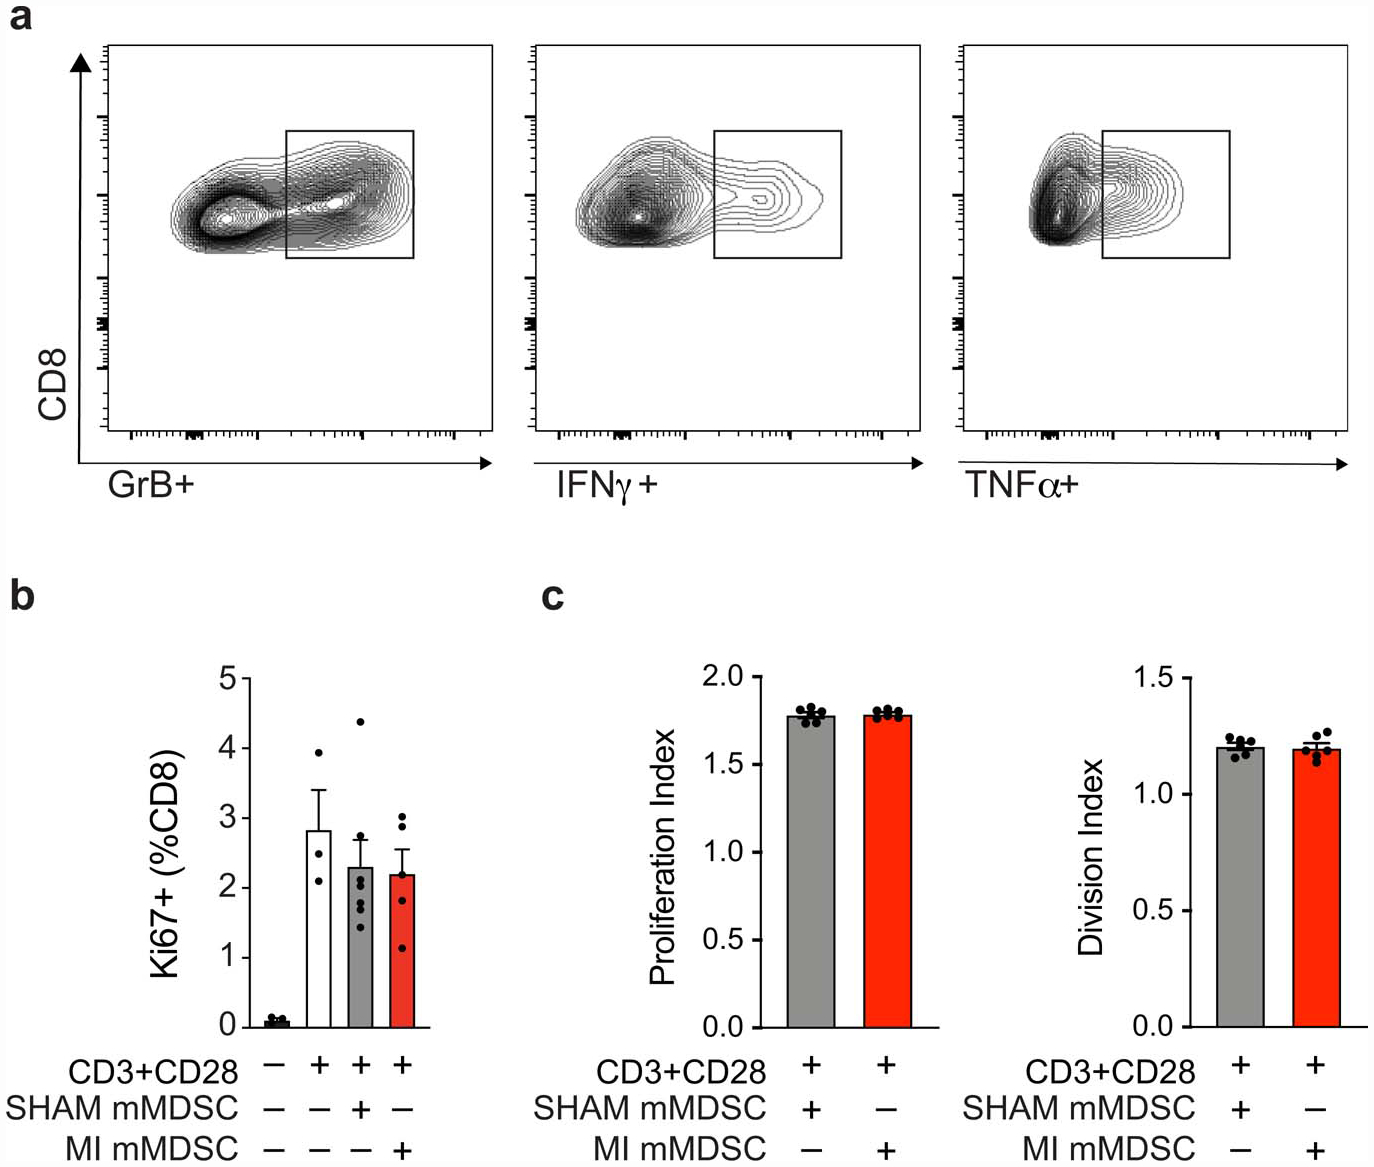
(a) Representative flow plots of CD11b-Ly6C-CD8+ T cells from MDSC:T cell suppression assay, representing % IFNγ +, TNFα+, Granzyme B (GrB)+ populations. (b,c) Purified splenic CD8+ T cells from naïve mice were stimulated with αCD3/αCD28 for 72 hours in the presence of mMDSCs isolated from tumors from mice exposed to MI (n=5) or sham surgery (n=7), and CD8+ T cell proliferation was assessed by % Ki67 (b) and replication and division index (c) using a cell trace proliferation dye. (a,b,c) two independent experiments were conducted. Data are the mean ± s.e.m. P values were calculated using or two-tailed unpaired Student’s t-test (b,c), where relevant comparisons were not significant (p>0.05)
Extended Data Fig. 8. The effect of systemic CD8+ cell depletion on tumor growth in mice following MI or sham surgery.
(a) E0771 tumor-bearing mice were exposed to MI or sham surgery and randomly allocated to either intraperitoneal IgG or anti-CD8 injections 10, 15, and 19 days following tumor implantation. (b) Intratumoral T cell content measured by flow cytometry in sham+IgG (n=8), sham+anti-CD8 (n=7), MI+IgG (n=8) and MI+anti-CD8 (n=7).(c) tumor volume was followed over 20 days and at sacrifice (d) in sham+IgG (n=8), sham+anti-CD8 (n=7), MI+IgG (n=8) and MI+anti-CD8 (n=7). (a-d) two independent experiments were conducted Data are the mean ± s.e.m. P values were calculated using a repeated measures analysis of variance (ANOVA) with Bonferroni’s multiple comparisons test (c), or a two-tailed (b) or one-tailed (d) Mann–Whitney test.
Extended Data Fig. 9. RNA-seq and ATAC-seq analyses of mMDSCs in tumor and bone marrow of mice exposed to MI or sham surgery.
(a) Heat map showing differential gene expression (log2FC) of select immune-related genes from RNA-Seq of tumoral CD11b+Ly6Chigh mMDSCs from mice 17 days post-MI (n=5) or sham (n=6) surgery (Padj<0.1). (b) Gene set concordance analysis showing that the top 1000 differentially expressed genes up- and down-regulated in tumor CD11b+Ly6Chigh mMDSCs (x axis) are enriched in genes up- and down-regulated in bone marrow Ly6Chigh monocytes (y axis) from the same mice 17 days post-MI, compared to background gene expression. (c) Gene ontology (GO) analyses of more accessible chromatin regions (n=942) in bone marrow Ly6Chigh monocytes from mice exposed to MI vs. sham surgery. (d) List of genes differentially expressed in tumor Ly6Chigh monocytes whose chromatin loci that are also less accessible in bone marrow Ly6Chigh monocytes after MI compared to sham surgery, grouped by transcription factors identified in Figure 3e. (e) ATAC-Seq (top) and RNA-Seq (bottom) reads in bone marrow and tumor Ly6Chigh monocytes at selected gene loci. P(adj) values were calculated using the Benjamini-Hochberg method (a). P values determined by two-sided Student’s T-test (b) or hypergeometric distribution (c).
Extended Data Fig. 10. Tumor growth, circulating monocytes and intratumoral innate immune flow cytometry gating strategy in MMTV-PyMT mice following surgical MI or sham surgery.
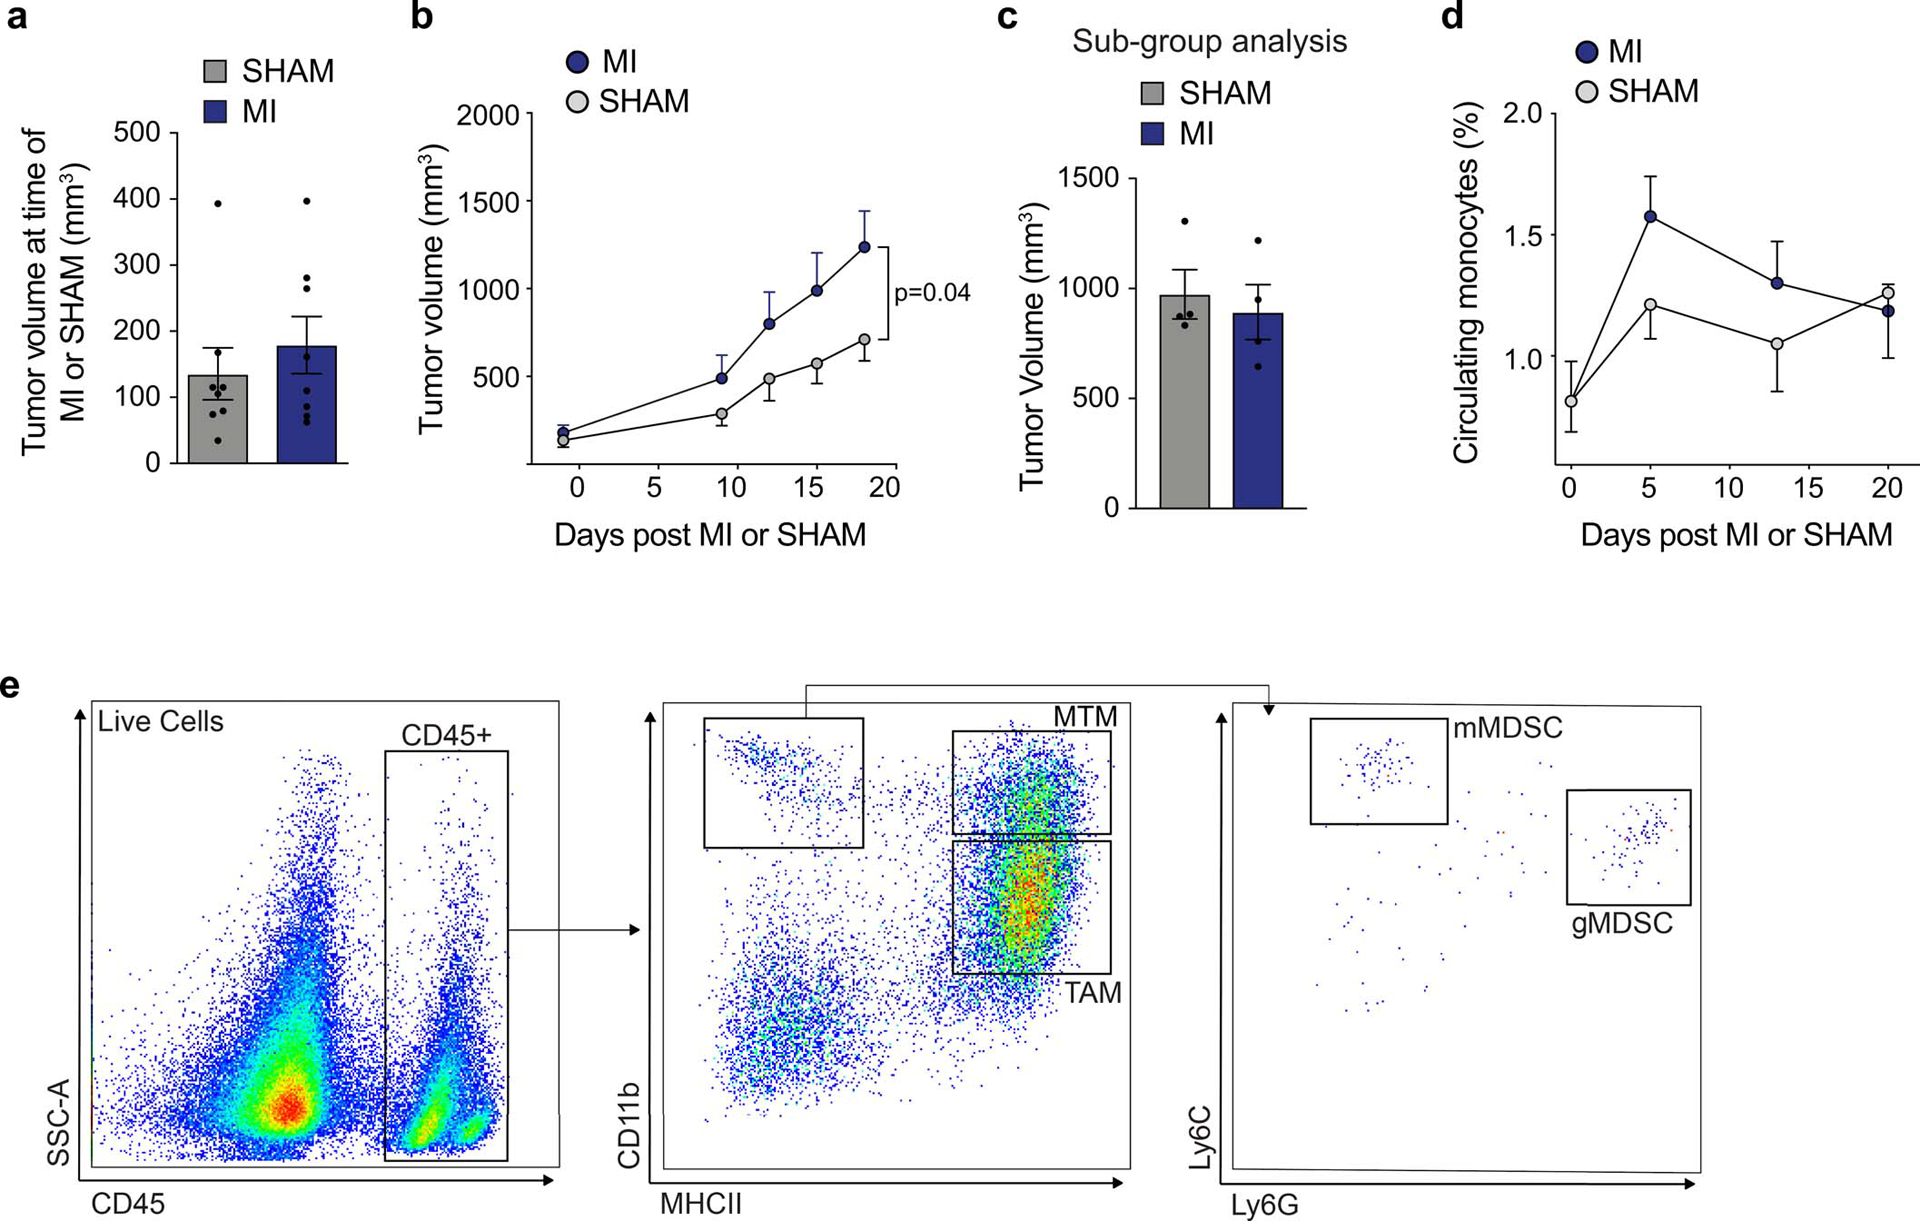
(a) Mean tumor volume at time of MI (n=8) or sham surgery (n=8) in MMTV-PyMT mice. (b) Tumor growth in MMTV-PyMT mice after MI or sham surgery (n=8/group). (c) Tumor volume at sacrifice in MMTV-PyMT mice used for the metastasis subgroup analysis (n=4/group). (d) Circulating monocytes in MMTV mice exposed to MI or sham surgery (n=8/group). (e) Flow cytometry gating strategy for myeloid cells from MMTV-PyMT tumors. Mammary-tissue macrophages (MTM: CD11bhighMHCII+); granulocytic myeloid derived suppressor cell (gMDSC: CD11bhighMHCII−Ly6CloLy6Ghigh); monocytic myeloid derived suppressor cell (mMDSC: CD11bhighMHCII−Ly6ChghiLy6Glo); tumor-associated macrophage (TAM: CD11bloMHCIIhigh). (a-e) three independent experiments were conducted. Data are the mean ± s.e.m and P values were calculated using a repeated measures analysis of variance (ANOVA) (d) with Bonferroni’s multiple comparisons test (b) or by a two-tailed unpaired Student’s t-test (a, c).
Supplementary Material
Acknowledgments:
Tissue sectioning and histological analyses were provided by the NYU Langone’s Experimental Pathology Research Laboratory. Cell sorting/flow cytometry technologies were provided by NYU Langone’s Cytometry and Cell Sorting Laboratory, which is supported in part by grant P30CA016087 from the National Institutes of Health/National Cancer Institute.
Funding: this work was supported by funding from the National Institutes of Health [R35HL135799 to KJM, P01HL131478 and P01HL131481 to KJM and EAF, T32HL098129 to CVS, K23HL125991 to JDN, R01CA234025 to ERN, R01CA129059 to BJC, R01HL132073 to DSP]; NYU Cancer Institute Center Support Grant NCIP30CA16087; NYU Shared Instrumentation Grant S10 OD021747; the Memorial Sloan Kettering Cancer Center Support Grant/Core Grant (P30 CA008748)], the American Heart Association (19CDA34630066 to CvS, 19POST34380010 to MS, 18CDA34110203 to TJB, 20POST35080180 to NY), the Canadian Institutes of Health Research (Doctoral Foreign Study Award to GJK, PJT159742 to DFQ), AKTIV Against Cancer (LWJ), and the Susan G. Komen Foundation (CCR18548032 to DFQ). DFQ is also supported by the Brain Tumor Funders’ Collaborative, Canada Foundation for Innovation, and a Tier II Canada Research Chair in Tumor Microenvironment research.
Footnotes
Competing interests: Authors declare no competing interests.
Data and materials availability: All data generated are included in the Article and in its Supplementary Information. Gene-expression data that support the findings of this study have been deposited in the Gene Expression Omnibus under accession number GSE137790. All data are also available from the corresponding authors on reasonable request.
References
- 1.Quail DF & Dannenberg AJ The obese adipose tissue microenvironment in cancer development and progression. Nat Rev Endocrinol 15, 139–154 (2019). [DOI] [PMC free article] [PubMed] [Google Scholar]
- 2.Krall JA, et al. The systemic response to surgery triggers the outgrowth of distant immune-controlled tumors in mouse models of dormancy. Sci Transl Med 10(2018). [DOI] [PMC free article] [PubMed] [Google Scholar]
- 3.Hershman DL, et al. Association of Cardiovascular Risk Factors With Cardiac Events and Survival Outcomes Among Patients With Breast Cancer Enrolled in SWOG Clinical Trials. J Clin Oncol 36, 2710–2717 (2018). [DOI] [PMC free article] [PubMed] [Google Scholar]
- 4.Jones LW, Haykowsky MJ, Swartz JJ, Douglas PS & Mackey JR Early breast cancer therapy and cardiovascular injury. J Am Coll Cardiol 50, 1435–1441 (2007). [DOI] [PubMed] [Google Scholar]
- 5.Hooning MJ, et al. Long-term risk of cardiovascular disease in 10-year survivors of breast cancer. J Natl Cancer Inst 99, 365–375 (2007). [DOI] [PubMed] [Google Scholar]
- 6.McAllister SS & Weinberg RA The tumour-induced systemic environment as a critical regulator of cancer progression and metastasis. Nat Cell Biol 16, 717–727 (2014). [DOI] [PMC free article] [PubMed] [Google Scholar]
- 7.Libby P, Nahrendorf M & Swirski FK Leukocytes Link Local and Systemic Inflammation in Ischemic Cardiovascular Disease: An Expanded “Cardiovascular Continuum”. J Am Coll Cardiol 67, 1091–1103 (2016). [DOI] [PMC free article] [PubMed] [Google Scholar]
- 8.Engblom C, Pfirschke C & Pittet MJ The role of myeloid cells in cancer therapies. Nat Rev Cancer 16, 447–462 (2016). [DOI] [PubMed] [Google Scholar]
- 9.Shipp C, Speigl L, Janssen N, Martens A & Pawelec G A clinical and biological perspective of human myeloid-derived suppressor cells in cancer. Cell Mol Life Sci 73, 4043–4061 (2016). [DOI] [PMC free article] [PubMed] [Google Scholar]
- 10.Ugel S, De Sanctis F, Mandruzzato S & Bronte V Tumor-induced myeloid deviation: when myeloid-derived suppressor cells meet tumor-associated macrophages. J Clin Invest 125, 3365–3376 (2015). [DOI] [PMC free article] [PubMed] [Google Scholar]
- 11.Nahrendorf M, et al. The healing myocardium sequentially mobilizes two monocyte subsets with divergent and complementary functions. J Exp Med 204, 3037–3047 (2007). [DOI] [PMC free article] [PubMed] [Google Scholar]
- 12.Biswas S, et al. CXCL13-CXCR5 co-expression regulates epithelial to mesenchymal transition of breast cancer cells during lymph node metastasis. Breast Cancer Res Treat 143, 265–276 (2014). [DOI] [PubMed] [Google Scholar]
- 13.Panse J, et al. Chemokine CXCL13 is overexpressed in the tumour tissue and in the peripheral blood of breast cancer patients. Br J Cancer 99, 930–938 (2008). [DOI] [PMC free article] [PubMed] [Google Scholar]
- 14.Ginestier C, et al. CXCR1 blockade selectively targets human breast cancer stem cells in vitro and in xenografts. J Clin Invest 120, 485–497 (2010). [DOI] [PMC free article] [PubMed] [Google Scholar]
- 15.Hohl TM, et al. Inflammatory monocytes facilitate adaptive CD4 T cell responses during respiratory fungal infection. Cell Host Microbe 6, 470–481 (2009). [DOI] [PMC free article] [PubMed] [Google Scholar]
- 16.Bronte V, et al. Recommendations for myeloid-derived suppressor cell nomenclature and characterization standards. Nat Commun 7, 12150 (2016). [DOI] [PMC free article] [PubMed] [Google Scholar]
- 17.Nam S, et al. Interferon regulatory factor 4 (IRF4) controls myeloid-derived suppressor cell (MDSC) differentiation and function. J Leukoc Biol 100, 1273–1284 (2016). [DOI] [PubMed] [Google Scholar]
- 18.Netea MG, et al. Trained immunity: A program of innate immune memory in health and disease. Science 352, aaf1098 (2016). [DOI] [PMC free article] [PubMed] [Google Scholar]
- 19.Christ A, et al. Western Diet Triggers NLRP3-Dependent Innate Immune Reprogramming. Cell 172, 162–175 e114 (2018). [DOI] [PMC free article] [PubMed] [Google Scholar]
- 20.Kurotaki D, et al. Transcription Factor IRF8 Governs Enhancer Landscape Dynamics in Mononuclear Phagocyte Progenitors. Cell Rep 22, 2628–2641 (2018). [DOI] [PubMed] [Google Scholar]
- 21.Waight JD, et al. Myeloid-derived suppressor cell development is regulated by a STAT/IRF-8 axis. J Clin Invest 123, 4464–4478 (2013). [DOI] [PMC free article] [PubMed] [Google Scholar]
- 22.Mitroulis I, et al. Modulation of Myelopoiesis Progenitors Is an Integral Component of Trained Immunity. Cell 172, 147–161 e112 (2018). [DOI] [PMC free article] [PubMed] [Google Scholar]
- 23.Franklin RA, et al. The cellular and molecular origin of tumor-associated macrophages. Science 344, 921–925 (2014). [DOI] [PMC free article] [PubMed] [Google Scholar]
- 24.Nelson ER, et al. 27-Hydroxycholesterol links hypercholesterolemia and breast cancer pathophysiology. Science 342, 1094–1098 (2013). [DOI] [PMC free article] [PubMed] [Google Scholar]
- 25.Peinado H, et al. Pre-metastatic niches: organ-specific homes for metastases. Nat Rev Cancer 17, 302–317 (2017). [DOI] [PubMed] [Google Scholar]
- 26.Caan B, et al. Life After Cancer Epidemiology (LACE) Study: a cohort of early stage breast cancer survivors (United States). Cancer Causes Control 16, 545–556 (2005). [DOI] [PubMed] [Google Scholar]
- 27.Kwan ML, et al. The Pathways Study: a prospective study of breast cancer survivorship within Kaiser Permanente Northern California. Cancer Causes Control 19, 1065–1076 (2008). [DOI] [PMC free article] [PubMed] [Google Scholar]
- 28.Hasin T, et al. Heart Failure After Myocardial Infarction Is Associated With Increased Risk of Cancer. J Am Coll Cardiol 68, 265–271 (2016). [DOI] [PMC free article] [PubMed] [Google Scholar]
- 29.Hasin T, et al. Patients with heart failure have an increased risk of incident cancer. J Am Coll Cardiol 62, 881–886 (2013). [DOI] [PMC free article] [PubMed] [Google Scholar]
- 30.Meijers WC, et al. Heart Failure Stimulates Tumor Growth by Circulating Factors. Circulation 138, 678–691 (2018). [DOI] [PubMed] [Google Scholar]
- 31.Wendeln AC, et al. Innate immune memory in the brain shapes neurological disease hallmarks. Nature 556, 332–338 (2018). [DOI] [PMC free article] [PubMed] [Google Scholar]
- 32.Moorlag S, Roring RJ, Joosten LAB & Netea MG The role of the interleukin-1 family in trained immunity. Immunol Rev 281, 28–39 (2018). [DOI] [PubMed] [Google Scholar]
- 33.Cheng SC, et al. Broad defects in the energy metabolism of leukocytes underlie immunoparalysis in sepsis. Nat Immunol 17, 406–413 (2016). [DOI] [PubMed] [Google Scholar]
- 34.Amend SR, Valkenburg KC & Pienta KJ Murine Hind Limb Long Bone Dissection and Bone Marrow Isolation. J Vis Exp (2016). [DOI] [PMC free article] [PubMed] [Google Scholar]
- 35.Dobin A, et al. STAR: ultrafast universal RNA-seq aligner. Bioinformatics 29, 15–21 (2013). [DOI] [PMC free article] [PubMed] [Google Scholar]
- 36.Liao Y, Smyth GK & Shi W featureCounts: an efficient general purpose program for assigning sequence reads to genomic features. Bioinformatics 30, 923–930 (2014). [DOI] [PubMed] [Google Scholar]
- 37.Love MI, Huber W & Anders S Moderated estimation of fold change and dispersion for RNA-seq data with DESeq2. Genome Biol 15, 550 (2014). [DOI] [PMC free article] [PubMed] [Google Scholar]
- 38.Liberzon A, et al. Molecular signatures database (MSigDB) 3.0. Bioinformatics 27, 1739–1740 (2011). [DOI] [PMC free article] [PubMed] [Google Scholar]
- 39.Buenrostro JD, Giresi PG, Zaba LC, Chang HY & Greenleaf WJ Transposition of native chromatin for fast and sensitive epigenomic profiling of open chromatin, DNA-binding proteins and nucleosome position. Nat Methods 10, 1213–1218 (2013). [DOI] [PMC free article] [PubMed] [Google Scholar]
- 40.McLean CY, et al. GREAT improves functional interpretation of cis-regulatory regions. Nat Biotechnol 28, 495–501 (2010). [DOI] [PMC free article] [PubMed] [Google Scholar]
- 41.Ramkhelawon B, et al. Netrin-1 promotes adipose tissue macrophage retention and insulin resistance in obesity. Nat Med 20, 377–384 (2014). [DOI] [PMC free article] [PubMed] [Google Scholar]
- 42.Cesano A nCounter((R)) PanCancer Immune Profiling Panel (NanoString Technologies, Inc., Seattle, WA). J Immunother Cancer 3, 42 (2015). [DOI] [PMC free article] [PubMed] [Google Scholar]
- 43.Schindelin J, et al. Fiji: an open-source platform for biological-image analysis. Nat Methods 9, 676–682 (2012). [DOI] [PMC free article] [PubMed] [Google Scholar]
Associated Data
This section collects any data citations, data availability statements, or supplementary materials included in this article.


